factors influencing knowledgeable consumers' level of - USM
229
FACTORS INFLUENCING KNOWLEDGEABLE CONSUMERS’ LEVEL OF ACCEPTANCE OF GOODS AND SERVICES TAX SHALENE KALYANASUNDARAM Research report in partial fulfilment of the requirements for the Degree of Master of Business Administration Universiti Sains Malaysia 2015
-
Upload
khangminh22 -
Category
Documents
-
view
3 -
download
0
Transcript of factors influencing knowledgeable consumers' level of - USM

FACTORS INFLUENCING KNOWLEDGEABLE CONSUMERS’ LEVEL OF
ACCEPTANCE OF GOODS AND SERVICES TAX
SHALENE KALYANASUNDARAM
Research report in partial fulfilment of the requirements for the
Degree of Master of Business Administration
Universiti Sains Malaysia
2015

This thesis is dedicated to my Papa, S.K. Sundaram who is my sturdiest pillar of
support and who inspired my interest in GST.
I can never thank you enough.

ii
ACKNOWLEDGEMENT
First and foremost, I am grateful to God for being able to conduct a research in an
area of much interest to me and for surrounding me with the best of people who have
supported me endlessly throughout this challenging journey. I am immensely indebted to my
mentor, Professor Dato’ Dr Hasnah Haron for her impeccable guidance, support, motivation,
approachability and constructive feedback without which this research would not have been
possible. Her diligence and dedication was highly inspiring and words cannot express the
honor and gratitude I feel to have worked with her.
I would also like to thank respected professors, namely Associate Professor Dr
Jayaraman and batch-mates who were so generous with their time and knowledge in assisting
me throughout the duration of this research paper. Their kind assistance and valuable
feedback enabled the successful completion of this paper. I would also like to take this
opportunity to thank my good friends; Bong-Arkya, Suria Chetta, Deepa, Thivagar and
Ameet from the bottom of my heart as they were my pillars of support and encouragement as
we travelled through this journey, spending days and nights together to finish this paper.
I would also like to thank my respondents who have participated in the study. I would
not have been able to contribute this study without their assistance. They have played a key
role in this research paper and I would like to pass my sincere gratitude to them.
Last but not at all least, I would like to thank my ever supporting parents, siblings,
employers, colleagues, friends, FREAKSisters and devoted fiancé for their constant show of
support, understanding, love and encouragement. Everyone played an important part in
easing the challenges I had to face throughout this period. Without this amazing support
system, this research paper would not have been a reality.
iii
TABLE OF CONTENTS
Page
ACKNOWLEDGEMENT…………………………………………………………….ii
TABLE OF CONTENTS……………………………………………………………..iii
LIST OF TABLES………………………………………………………………….....ix
LIST OF FIGURES…………………………………………………………….……..xi
ABSTRAK……………………………………………………………………….......xiii
ABSTRACT…………………………………………………………………………..xiv
LIST OF ABBREVIATION………………..…………………………………………xv
CHAPTER 1 INTRODUCTION………………………………………………………1
1.0 Introduction…………………………………………………………………........1
1.1 Background of the Study…………………………………………………………1
1.2 Problem Statement………………………………………………………………..3
1.3 Research Objectives ……………………………………………………………...7
1.4 Research Question……………………………………………………………......7
1.5 Definition of Key Terms …………………………………………………………8
1.6 Significance of the Study………………………………………………..………..9
1.6.1 Practical Implication…..………………………………………………...……..9
1.6.2 Theoretical Implication……………………………………………………….11
1.7 Organization of the Remaining Chapters……………………………………….12

iv
CHAPTER 2 LITERATURE REVIEW………………………………………..…….13
2.0 Introduction……………………………………………………………………13
2.1 Malaysian Taxation……………………………….……………………………13
2.2 Consumers………………………..……………………………………………14
2.3 GST…………………………………………………………………………….16
2.3.1 Reasons for Implementing GST……………………………………………..16
2.3.2 Significance of GST…………………………………………………………18
2.3.3 Mechanism of GST……………………………………………………….....19
2.3.4 GST rate in the ASEAN countries…………………………………………..24
2.3.5 Implementation of GST……………………………………………………..25
2.4 Theory…………………………………………………………………………26
2.4.1 Theory of Planned Behavior (TPB)………………..……………………….26
2.5 Dependent Variable……………………………………………………………28
2.6 Antecedent and Independent variables ………………………………………..29
2.6.1 Attitude………………………………………………………………………29
2.6.2 Rule Observance Behavior……………………………………………..…....31
2.6.3 Perception of fairness of GST…………………………………………..…...32
2.6.4 Subjective Norm……………………………………………………………..34
2.6.5 Perceived behavioral control (PBC)…………………………………………35
2.6.6 Level of GST Knowledge………………………………………………...….36
2.6.7 Self-Efficacy…………………………………………………………………37
2.7 Theoretical Framework………………………………………………………...39
2.8 Factors Affecting Level of Acceptance of GST………………………………..41
2.8.1 Studies on Goods & Services Tax…………………………………………...44
2.8.2 Studies on Tax compliance……………………………………………….….44

v
2.8.3 Studies on Intention to Accept…………………………………………….....44
2.8.4 Other Studies……………………………………………………………..…..45
2.9 Hypotheses Development………………………………………………………46
2.9.1 Rule observance behavior and attitude ………………………………………46
2.9.2 Perception of Fairness of GST and attitude…………………………………..46
2.9.3 Level of GST Knowledge and Perceived Behavioral Control………………..47
2.9.4 Self-efficacy and Perceived Behavior Control ……………………………….48
2.9.5 Attitude and Level of Acceptance…………………………………………….50
2.9.6 Subjective Norms and Level of Acceptance………………….……………….51
2.9.7 Perceived Behavioral Control and Level of Acceptance……………………...52
2.10 Summary……………..………………………………………………………..53
CHAPTER 3 RESEARCH METHODOLOGY………………………………………55
3.0 Introduction……………………………………………………………………...55
3.1 Research Design………………………………….……………………………...55
3.1.1 Type of Study……………………………………………………………..…..55
3.1.2 Population and Unit of Analysis……………………………………………...56
3.1.3 Sample Size…………………………………………………………………..58
3.1.4 Sampling Method…………………………………………………………….59
3.1.5 Data Collection Techniques………………………………………………….59
3.1.6 Survey Instrument…………………………………………………………....60
3.1.7 Questionnaire Design………………………………………………………...61
3.2 Measurements of Variables…………………………………………..…….…..63
3.2.1 Measurements of Antecedent Variables and Independent Variables………..63
3.2.2 Level of Tax of Knowledge Scoring………………………………………...64
3.2.3 Measurement of Dependent Variable………………………………………..65

vi
3.3 Pre Test…………………………………………………………………...……67
3.4 Pilot Test….……………………………………………………………………68
3.5 Data Analysis………………………………………………………….……….71
3.5.1 Structured Equation Modeling (SEM)………………………………………71
3.5.2 Covariance-based SEM (CBSEM) against Variance-based SEM
with Partial Least Squares (PLS)……………………………………………72
3.5.3 Statistical Analysis…………………………………………………………..74
3.5.4 Demographic Analysis………………………………………………………74
3.5.5 Common Method Bias………………………………………………………74
3.5.6 Descriptive Analysis………………………………………………………...75
3.5.7 Goodness of Data Test………………………………………………………76
3.5.8 Factor Analysis……………………………………………………………....76
3.5.9 Validity Analysis…………………………………………………………….77
3.5.10 Reliability Analysis………………………………………………………….78
3.5.11 Goodness-of-Fit (GoF)………………………………………………………79
3.6 Summary……………………………………………………………………….79
CHAPTER 4 RESULTS…………………………………………………………….81
4.0 Introduction……………………………………………………………………81
4.1 Response Rate…………………………………………………………………82
4.2 Profile of Respondents…………………………………………………….…..83
4.3 Descriptive Statistics and Multicollinearity ………………………………..…86
4.4 Common Method Bias using Principal Component Analysis ……...…………90
4.5 Data analysis and results ………………………………………………….…..91
4.5.1 Goodness of measures……………………………….………………….......91
4.5.2 Pathway of Each Model Construct………………………………………….92
vii
4.5.3 Construct validity…………………………………………………………...93
4.5.4 Convergent validity…………………………………………………………93
4.5.5 β value and R Square………………………………………………………..94
4.5.6 Discriminant validity………………………………………………………..95
4.5.7 SEM Model…………………………………………………………………95
4.5.8 Results of each model………………………………………………………96
4.5.9 Reliability Analysis………………………………………………………..110
4.5.10 Summary on Validity and Reliability of Models………………………….111
4.5.11 Summary of Hypothesis Testing…………………………………………..113
4.5.12 Goodness-of-Fit……………………………………………………………114
4.6 Summary……………………………………………….…………………….115
CHAPTER 5 DISCUSSIONS AND CONCLUSIONS……………………………116
5.0 Introduction…………………………………………………………………..116
5.1 Recapitulation of the Study Findings………………………………………...116
5.2 Discussion…………………………………………………………………….119
5.2.1 What is the GST acceptance level amongst Malaysians?.............................120
5.2.2 What is the relationship of rule observance behavior and perceptions
of tax fairness with attitude of consumer?...........................................................123
5.2.3 What is the relationship of Self – Efficacy and Level of Tax Knowledge
with Perceived Behavior Control?.........................................................................125
5.2.4 What is the relationship of Attitude, Subjective Norms and
Perceived Behavioral Control with Level of Acceptance? .............................128
5.3 Summary and findings…….……………………………………………………130
5.4 Implications...……………………………………………………………….….131
5.4.1 Theoretical Implication……………………………………………………...131
viii
5.4.2 Practical Implication………………………………………………………...133
5.5 Limitation………………………………………………………….…………...138
5.6 Suggestion for Future Research ………………………………………………..138
5.7 Conclusion……………………………………………………………………...140
REFERENCES……………………………………………………………………….142
APPENDIX A – ECONOMIC REPORT 2010-2014- FEDERAL GOVERNMENT
REVENUE ……………………………………………..................167
APPENDIX B – ECONOMIC REPORT 2010-2014- FEDERAL GOVERNMENT
FINANCE ……………………………………………..................168
APPENDIX C – RESULTS OF MERDEKA CENTRE SURVEY ON GST....……169
APPENDIX D – QUESTIONNAIRE……………………………………………….176
APPENDIX E – PLS ALGORITHM REPORT (PILOT STUDY)………………….187
APPENDIX F – PLS ALGORITHM REPORT……………………………………..188
APPENDIX G – BOOTSTRAPPING PLS REPORT……………………………….199
APPENDIX H – IBM SPSS STATISTICS REPORT……………………………….203

ix
LIST OF TABLES
Page
Table 2.1 Key Studies on Malaysian Goods and Services Tax 42
Table 3.1 Profile of Contacts 60
Table 3.2 Summary of Questionnaire Sections 63
Table 3.3 Sources of measurement of variables 66
Table 3.4 Details of Models for analysis 69
Table 3.5 Cronbach’s Alpha for pilot study 70
Table 4.1 Summary on the Response Rate 82
Table 4.2 Socio-Demographic table – Respondent’s profile 83
Table 4.3 Descriptive Statistics and Correlation Matrix (n=228) 86
Table 4.4 Total Variance Explained 91
Table 4.5 Measurement model of VB-SEM- Model 1 97
Table 4.6 Discriminant Validity- Model 1 98
Table 4.7 Summary of PLS Results – Direct Effects- Model 1 99
Table 4.8 Measurement model of VB-SEM-Model 2 101
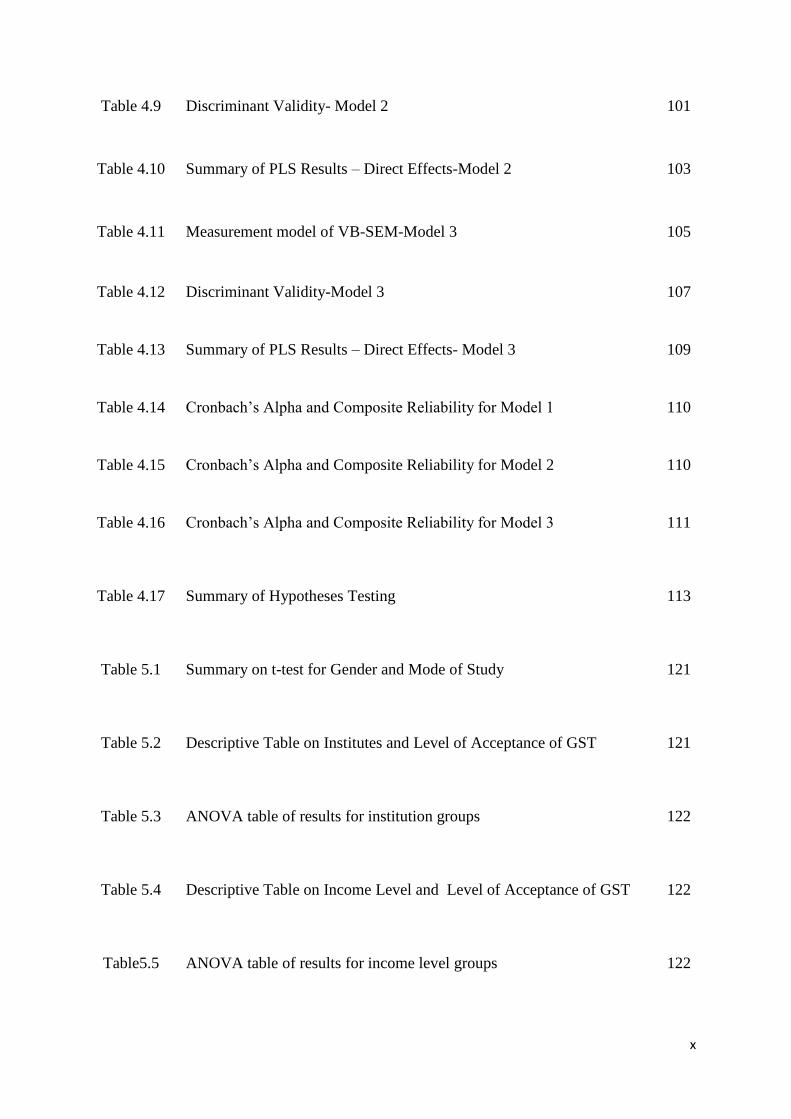
x
Table 4.9 Discriminant Validity- Model 2 101
Table 4.10 Summary of PLS Results – Direct Effects-Model 2 103
Table 4.11 Measurement model of VB-SEM-Model 3 105
Table 4.12 Discriminant Validity-Model 3 107
Table 4.13 Summary of PLS Results – Direct Effects- Model 3 109
Table 4.14 Cronbach’s Alpha and Composite Reliability for Model 1 110
Table 4.15 Cronbach’s Alpha and Composite Reliability for Model 2 110
Table 4.16 Cronbach’s Alpha and Composite Reliability for Model 3 111
Table 4.17
Summary of Hypotheses Testing
113
Table 5.1
Summary on t-test for Gender and Mode of Study
121
Table 5.2
Descriptive Table on Institutes and Level of Acceptance of GST
121
Table 5.3
ANOVA table of results for institution groups
122
Table 5.4
Descriptive Table on Income Level and Level of Acceptance of GST
122
Table5.5
ANOVA table of results for income level groups
122

xi
LIST OF FIGURES
Page
Figure 2.1 Cascading effect -Sales & Service tax 17
Figure 2.2 Cascading effect - Service tax 17
Figure 2.3 Input and output tax 20
Figure 2.4 Standard rated supply 21
Figure 2.5 Zero-rated supply 21
Figure 2.6 Exempt supply 22
Figure 2.7 GST Mechanism- standard rated 22
Figure 2.8 GST rates in the ASEAN countries 25
Figure 2.9 Theoretical Framework 40
Figure 4.1 PLS Pathway for Model 1 92
Figure 4.2 PLS Pathway for Model 2 92
Figure 4.3 PLS Pathway for Model 3 93
Figure 4.4 PLS output for Beta-value and R square value(Model 1) 98

xii
Figure 4.5 PLS output for testing population regression coefficients 100
Figure 4.6 PLS output for Beta-value and R square value – Model 2 102
Figure 4.7 PLS Output for testing population regression coefficients 103
Figure 4.8 PLS output for Beta-value and R square value-Model 3 108
Figure 4.9 PLS Output for testing population regression coefficients 109

xiii
ABSTRAK
Pelaksanaan Cukai Barangan dan Perkhidmatan (GST) pada 1 April 2015 adalah satu
kejayaan bagi Malaysia. Pelaksanaan GST adalah amat penting untuk menyokong
pembangunan negara. Kajian ini telah dibangunkan untuk mengenal pasti faktor-faktor yang
mempengaruhi tahap penerimaan GST oleh pengguna menggunakan’Theory of Planned
Behavior’. Faktor-faktor yang dikaji termasuk Peraturan kelakuan pematuhan, Persepsi
keadilan GST, Aras pengetahuan GST, ‘Self-efficacy’, Sikap, ‘Subjective Norm’ dan
‘Perceived Behavorial Control’. Borang soal selidik telah diedarkan kepada pelajar-pelajar
dalam talian MBA daripada Universiti Sains Malaysia, Universiti KebangsaanMalaysia,
Universiti Malaya dan Universiti Putra Malaysia pada Februari 2015. 228 MBA pelajar
mengambil bahagian dalam kajian ini dan Smart PLS telah digunakan untuk menguji kesahan
dan kebolehpercayaan data dan hipotesis.. Hasil kajian membuat kesimpulan bahawa 6
hipotesis daripada 7 disokong. Tahap penerimaan GST rendah dengan Sikap dan Persepsi
Kawalan Tingkahlaku menjadi pengaruh yang penting. Pematuhan Peraturan Kelakuan dan
Persepsi GST keadilan adalah ‘ántecedent’ yang penting kepada Sikap. Self-efficacy dan
Tahap pengetahuan GST adalah ántecedent’ yang penting kepada ‘Perceived Behavorial
Control’. Kajian menunjukkan bahawa walaupun tahap pengetahuan GST dipertingkatkan di
kalangan pengguna, tahap penerimaan tidak akan bertambah baik tanpa langkah-langkah
berkesan yang diambil untuk meningkatkan persepsi mereka terhadap keadilan GST. Di
samping itu, pemahaman GST tidak akan mencukupi untuk mempengaruhi penerimaan GST.
Pengguna perlu dididik bagaimana untuk menguruskan penggunaan dan kewangan mereka
serta diberikan sokongan yang mencukupi dalam tempoh peralihan ini.
xiv
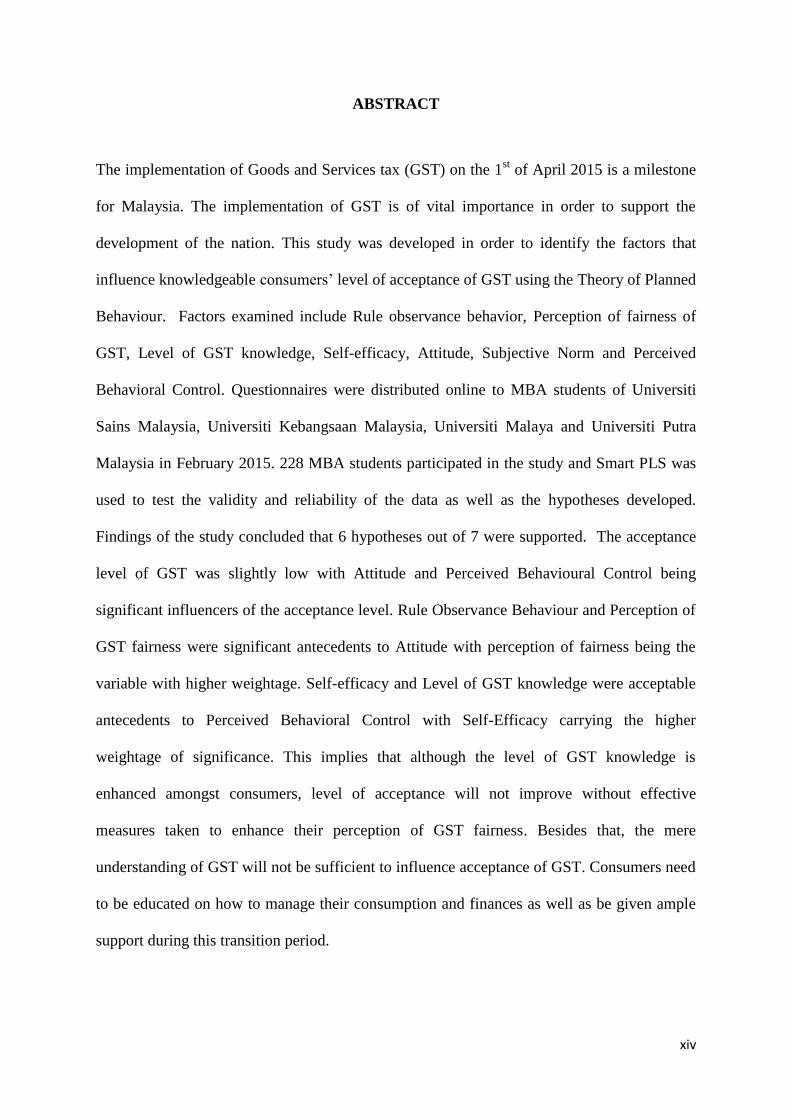
ABSTRACT
The implementation of Goods and Services tax (GST) on the 1st of April 2015 is a milestone
for Malaysia. The implementation of GST is of vital importance in order to support the
development of the nation. This study was developed in order to identify the factors that
influence knowledgeable consumers’ level of acceptance of GST using the Theory of Planned
Behaviour. Factors examined include Rule observance behavior, Perception of fairness of
GST, Level of GST knowledge, Self-efficacy, Attitude, Subjective Norm and Perceived
Behavioral Control. Questionnaires were distributed online to MBA students of Universiti
Sains Malaysia, Universiti Kebangsaan Malaysia, Universiti Malaya and Universiti Putra
Malaysia in February 2015. 228 MBA students participated in the study and Smart PLS was
used to test the validity and reliability of the data as well as the hypotheses developed.
Findings of the study concluded that 6 hypotheses out of 7 were supported. The acceptance
level of GST was slightly low with Attitude and Perceived Behavioural Control being
significant influencers of the acceptance level. Rule Observance Behaviour and Perception of
GST fairness were significant antecedents to Attitude with perception of fairness being the
variable with higher weightage. Self-efficacy and Level of GST knowledge were acceptable
antecedents to Perceived Behavioral Control with Self-Efficacy carrying the higher
weightage of significance. This implies that although the level of GST knowledge is
enhanced amongst consumers, level of acceptance will not improve without effective
measures taken to enhance their perception of GST fairness. Besides that, the mere
understanding of GST will not be sufficient to influence acceptance of GST. Consumers need
to be educated on how to manage their consumption and finances as well as be given ample
support during this transition period.

xv
LIST OF ABBREVIATIONS
ATT Attitude
AVE Average Variance Extracted
BR1M Bantuan Rakyat 1 Malaysia
CBSEM Covariance-based Structural Equation Modelling
CFA Confirmatory Factor Analysis
CMB Common Method Bias
FAQ Frequently Asked Questions
GST Goods & Services Tax
ITA Income Tax Act
LA Level of Acceptance
LTK Level of Tax Knowledge
PBC Perceived Behavorial Control
PLS Partial Least Squares
PTF Perception of Tax Fairness
RMCD Royal Malaysian Customs Department
ROB Rule Observance Behavior
SE Self Efficacy
SEM Structural Equation Modelling
SN Subjective Norms
SST Sales & Services Tax
TPB Theory of Planned Behavior

xvi
UM Universiti Malaya
UKM Universiti Kebangsaan Malaysia
UPM Universiti Putra Malaysia
USM Universiti Sains Malaysia
VAT Value-Added Tax
VBSEM Variance-based Structural Equation Modelling

1
CHAPTER 1
INTRODUCTION
1.0 Introduction
This chapter presents the research framework of the study. It begins with discussing
the background of the study and the problem statement followed by research
objectives and research question. Definition of key terms of major variables will also
be included to enhance understanding of the concepts. The significance of the study
is the contribution of the scope of study to both practical and theoretical
implications. The scope of study focuses on consumers as the Goods and Services
tax being studied is a consumption tax. Manufacturers, retailers and distributors are
able to set off the tax they pay against the tax charged to their customers but
consumers are unable to claim the GST they pay on their consumption. Towards the
end, the chapter will give a brief overview of the remaining chapters in the thesis.
1.1 Background
Malaysian taxation system is divided into two; direct and indirect taxes. Indirect
taxes are controlled by the Royal Malaysian Customs Department (RMCD) and
consist of four parts; customs duties, excise duty, sales tax and service tax. Direct
taxes are administered by the Inland Revenue Board of Malaysia (IRBM). This
comprises individual income taxes, corporate taxes, petroleum income taxes, real
property gains taxes and stamp duty.

2
According to Jeyapalan Kasipillai(2005), taxation is a vital economic tool for
governments to regulate the economy, to revitalize economic growth through the
granting of fiscal incentives and to provide funds for development projects.
Attached in Appendix A is a table which provides information on the federal
government revenue obtained from the Economic Report 2013/2014 of Ministry of
Finance. According to the report, in 2013, 57.6% of the revenue was in the form of
direct taxes while 16.6% was in the form of indirect taxes.
With reference to the second table in the Appendix B, the Economic Report
2013/2014 reports an overall deficit yet again. From the table, it can be seen that
Malaysia faces deficits even from 2010. This has accentuated the desperate need for
Malaysia to develop a more efficient, effective taxation system which will be able to
provide Malaysia with a stable source of revenue.
Since the Sales and Service tax had inherent weaknesses in its system in terms of
generating stable revenue, Malaysia was forced to look into the implementation of
GST. GST is a broader consumption-based tax which is proven to be able to generate
stable revenue for the nation's financial needs. GST is levied on all goods and
services except for essential ones which are exempted from tax, or those which are at
zero-rated tax for now (Palil & Ibrahim, 2011).
Sales tax is an indirect tax levied on certain imported and locally manufactured
goods introduced in 1972. It is also known as manufacturer's tax. It is a single stage

3
tax and 10% sales tax is charged to manufacturers of locally manufactured goods
when goods are sold or for imported goods, at the time when goods are cleared at
Customs. Service tax of 6% was introduced in 1975 and is levied on taxable services
which include prescribed goods, i.e tobacco as well as professional and consultancy
services (Palil & Ibrahim, 2011). The Goods and Services Tax will replace both
these taxes at a rate of 6%. It is also categorized into standard-rated, zero-rated and
tax-exempt items. It is mandatory and involves all Malaysians nationwide as it is a
consumption based tax.
1.2 Problem Statement
Budget 2014 was a milestone budget as the Honourable Prime Minister Dato’ Seri
Najib Tun Razak announced the implementation of Goods and services tax (GST) on
the 1st of April 2015. According to The Star newspaper the Prime Minister in his
budget speech stated that the Government had to take bold measures to overcome the
weaknesses of the current sales and service tax in order to strengthen the fiscal
position of the nation. Thus, after years of detailed and comprehensive studies as
well as views of all segments of society including chambers of commerce, investors,
economists, academicians, consumer associations and NGOs, the government has
decided to implement a fair tax system that benefits all Malaysians, Goods and
Services Tax (GST). The GST was publicized at a rate of 6%, higher than what was
promised in earlier proposals (Singh 2013). However, this rate is the lowest amongst
the ASEAN countries compared with 10% in Indonesia, Vietnam, Cambodia, the
Philippines, and Laos and 7% in Singapore and Thailand.

4
Amongst the main highlights associated with the implementation of GST was that
GST will not be implemented on approximately 40 essential goods and services, the
Government will be assisting the Rakyat with the GST transition period by providing
them with one off cash allowance and a reduction of 1% in individual income tax
rates. The Prime Minister also iterated that the GST is vital in assisting the
Government to generate revenues in an effective way in order to invest in the
development of the country (Lai 2014; New Strait Times, 2014).
Despite the implementation of GST being a topic already put forth many years ago,
the acceptance level amongst Malaysians is poor as represented by the massive rally
organized by a coalition of 89 various parties on May 1 2014. The rally with the
theme “GST: Protest Till It’s Dropped’ was aimed at displaying the protest of
citizens against the implementation of GST and enforced the need of the
Government to first resolve the issue on the high personal debt level of the nation
and minimum wage as well as that the people are currently still adjusting to the hike
in petrol prices and other essential goods. (Star Online, 2014)
Moreover, a survey conducted by the Merdeka Centre in May 2014 of 1009
registered voters comprising 60% Malay, 31% Chinese and 9% Indian concluded
that 62% of Malaysians are not in favour of GST. The respondents were selected on
the basis of random stratified sampling along ethnicity, gender and state of residence
in order to obtain results which are generalizable. At the same time, 64% of the
respondents indicated that they are not aware of the working of the national
economy. To add on, 72% of those with household income less than RM1, 500 and
56% of those with household income between RM1, 501 and RM3,000 do not

5
understand GST. More than half of those who earn between RM3, 000 and RM5,
000 and 67% of those who have a household income of over RM5, 000 understand
the issue.(MerdekaCenter,2015).
Also, 45% of the respondents have indicated that GST is not a fair tax system when
in fact more than 160 countries have successfully implemented GST. According to
the poll, 62% Malays do not understand GST, while less than half of the Chinese
(41%) and Indian (35%) respondents do not understand the issue
(MerdekaCenter,2015).The results of the survey are attached in Appendix C. To
further corroborate this phenomenon, some of the riot participants who were
interviewed by the Star newspaper displayed the same lack of knowledge in the
system and high level of uncertainty in its impact to their daily lives.
Previous studies (Nordiana, 2012; Bidin & Shamsudin, 2013; Ramalingam et al.,
2014) were focused on the compliance of organizations with GST and their adoption
of the GST application systems. Previous studies have also explored the awareness
and acceptance levels of consumers (Saira et al., 2010; Palil & Ibrahim, 2011;
Shamsuddin et al., 2014; Moomal & Zakarian, 2014). However, in the nation’s
current scenario, it is vital for the government to understand the causes of the low
levels of acceptance. In line with that, this study will delve deeper into factors that
are influencing consumers’ acceptance of GST using the well-established Theory of
Planned Behavior. In order to further understand the factors influencing the
consumers’ acceptance of GST, antecedent variables to the attitude and perceived
behavorial control are examined. The antecedent variables determined were Rule
Observance Behaviour, Perception of GST Fairness, Level of GST knowledge and

6
Self-Efficacy. If these antecedent variables together with the other variables
examined in the study (attitude, subjective norm and perceived behavioral control)
proved significant, recommendations can be suggested to ensure a more efficient and
smooth implementation of GST. This is because the relevant authorities can now
identify specific areas for improvement in order to address any acceptance issues
amongst the consumers.
The focus of this study is knowledgeable consumers who are currently pursuing their
Masters in Business Administration. This is because the Merdeka Center survey had
portrayed that there was a higher level of unacceptance amongst private sector
employees, self-employed individuals and those involved in business. Moreover, the
age groups comprising of those in their twenties and thirties showed a higher level of
unacceptance (Merdeka Center, 2015). MBA students will be able to represent the
demographics of the Merdeka Center survey who are not accepting GST. MBA
students are normally within the above-mentioned age group and majority are
employed (Tay, 2001) Moreover, lack of GST acceptance has been associated with
lack of knowledge (Borneo Post Online, 2015; Jalil, 2015; GST Malaysia Info,2014)
and by choosing MBA students we will be able to put that assumption to test as
MBA students are expected to have the required basic knowledge on GST. Thus, for
this study, MBA students will represent the consumers in Malaysia.

7
1.3 Research Objectives
1) To examine the level of acceptance of Goods and Service Tax (GST)
amongst consumers.
2) To examine the relationship between the existence of rule observance
behavior and attitude of consumer.
3) To examine the relationship between perception of GST fairness and attitude
of consumer.
4) To examine the relationship between level of GST knowledge and perceived
behavioral control of consumer.
5) To examine the relationship between self-efficacy and the perceived
behavioral control of consumer.
6) To examine the relationship between attitude of consumers and their level of
acceptance of GST
7) To examine the relationship between subjective norms of consumers and
their level of acceptance of GST
8) To examine the relationship between perceived behavioral controls of
consumers and their level of acceptance of GST
1.4 Research Questions
1) What is the level of acceptance of GST amongst consumers?
2) What is the relationship between rule observance behavior and attitude of
consumer?

8
3) What is the relationship between perception of GST fairness and attitude of
consumer?
4) What is the relationship between the level of GST knowledge of consumers
and perceived behavioral control?
5) What is the relationship between self-efficacy of a consumer and perceived
behavioral control?
6) What is the relationship between attitude of consumers and their level of
acceptance of GST?
7) What is the relationship between subjective norms of consumers and their
level of acceptance of GST?
8) What is the relationship between perceived behavioral control of consumers
and their level of acceptance of GST?
1.5 Definition of Key Terms
1. Level of Acceptance refers to the level of intention to accept (Shamsuddin et al.,
2014).
2. Attitude is an individual’s positive and negative feelings about performing a
target behavior. The feelings are brought about after evaluations conducted based on
beliefs (Fishbein & Ajzen, 1975).
3. Subjective Norm is the individual’s opinion that those who are important to
him/her think that he/she should not perform the behavior in question
(Fishbein&Ajzen, 1975).
9
4. Perceived behavioral control is the perceived internal and external constraints on
behavior or intention to behave (Taylor & Todd, 1995).
5. Rule observance behavior relates to obedience to authority (Trevino, 1986).
6. Perception of fairness is the judgement of individuals that something or someone
is free of biasness and injustice (Saad, 2010).
7. Self-efficacy is an individual’s perception of his/her capability to organize and
execute courses of action required to accomplish selected types of performances
(Bandura, 1986).
8. Level of GST knowledge is an individual’s technical and general knowledge on
the subject matter of GST. (Saad, 2010)
1.6 Significance of Study
Both theoretical and practical implications of the study will be discussed.
1.6.1 Practical Implication
With the Goods and Services Tax finally being implemented, a study of this nature
would be imperative for the government in identifying areas at which they should
improve in and allocate resources to. This is very crucial especially since according
to Deputy Finance Minister Datuk Ahmad Maslan, there is RM250 million budget
10
allocation to educate the public about GST and to facilitate its implementation (Ian,
2014 ; Malaysian Insider, 2014).
This will therefore enable the Royal Malaysian Customs Department to undertake
measures for a smooth and effective transition to the GST system for consumers and
the Government as a whole. This includes enhancing their current support system
and enforcement measures (Kasipillai, 2013; Tan, 2009; Tan, 2014; Choo, 2014).
Previous studies (Saira et al., 2010; Palil & Ibrahim, 2011) have been conducted on
an exploratory mode as the GST implementation was not finalized. Other studies
Shamsuddin et al. (2014) and Moomal & Zakarian (2014) studied on the correlation
between awareness and acceptance. However, all these studies were not backed up
by a theory. Nordiana (2012), Bidin & Shamsudin (2013) and Ramalingam et al.
(2014), conducted a study on the compliance with GST and adoption of GST
application system of corporate tax collectors. Thus, this study would be the first
study to examine the factors that influence the acceptance level of consumers at large
amidst the announcement of the confirmed implementation of GST on 1 April 2015.
The key idea to understand here is that with corporate tax payers, their compliance is
harped on because under the GST implementation they are required to file in taxes to
the Royal Customs on a monthly or quarterly basis. Although they bear expenses on
preparing infrastructure and staff to ensure compliance to GST, which is usually a
one-off expenditure, it is the consumers who bear the tax burden of GST and
corresponding price hikes. The findings of this study will ultimately provide insight

11
to the Consumers’ association on the information they can disseminate to the
consumers in order to assist them to accept and adapt to the implementation of GST.
1.6.2 Theoretical Implication
Although the implementation of GST has been decided upon-1 April 2015, however,
the acceptance level of consumers is still low. As such, the only issue at hand now is
to handle the transition process as smoothly as possible.
For this to be a success, the theory of planned behavior comes in handy to explain
the various possible factors to be addressed in order to enhance the acceptance of
GST amongst consumers. Previously this theory has been used to study corporate tax
payers’ compliance to GST (Nordiana, 2012; Bidin & Shamsudin, 2013) but through
this research, the theory will be extended to understand the factors that contribute
towards the acceptance of GST by consumers. Consumers do not need to comply
with the GST but rather just accept it as the tax will already be embedded in prices of
goods and service. In this case, the study will examine the consumers’ level of
acceptance of GST by determining their intention to accept GST because at the time
of data collection GST has not been implemented yet.
Hence, this study will test the theory’s rigidity in instances where the intention to not
behave in a certain way does not enable the respondent to escape from the behavior
itself.
12
Antecedent variables are also used in this study to enhance the explanatory power of
the Theory of Planned Behavior. With these antecedent variables, the research will
be able to demonstrate very specific key areas for improvement that the government
should allocate resources to. The antecedents were Rule Observance Behavior,
Perception of GST Fairness, Self-Efficacy and Level of GST Knowledge.
1.7 Organization of the remaining chapters
This research is made up of a total of five chapters in order to present the study in a
systematic manner. The next chapter, Chapter two presents an overview of previous
literature on the variables put forth. This then leads to the development of the
theoretical framework and hypotheses for this study.
Chapter three consists of the research methodology, research design, data collection
methods and data measurement methods that will be employed for this study.
Chapter four presents the findings of this study where the goodness of the data used
is confirmed and the hypotheses developed are tested.
The final chapter, Chapter 5 will discuss the implications of the findings, practical
and theoretical applications of this study, limitations of the study, future research
suggestions and the conclusion.

13
CHAPTER 2
LITERATURE REVIEW
2.0 Introduction
This chapter aims to examine all existing literature on the content, theory and latent
variables of this study as well as the relationships being examined in relation to
Goods and Services Tax which will be implemented come 1st April 2015.This will
then lead to the formation of the theoretical framework and the development of the
hypotheses.
2.1 Malaysian Taxation
The British colonialism introduced taxes into the Federation of Malaya in 1947
which has resulted in the taxation system in Malaysia today (Singh, 1999). At first,
the Income Tax Ordinance 1947 was gazetted as the fundamental act yet this was
accordingly changed and replaced by Income Tax Act 1967 (ITA) with effect from
January 1, 1968. At that time, ITA combined the three acts of income taxation in
particular Sabah Income Ordinance 195633, Sarawak Inland Revenue Ordinance
196034 and Income Tax Ordinance 194735. As of now, ITA 1967 is the fundamental
act to administer direct taxes in Malaysia including individual and corporate income
tax (Palil, 2010).

14
The Lembaga Hasil Dalam Negeri or the Inland Revenue Board (IRB) is the tax
authority which oversees the operationalization of direct taxes in Malaysia. Other
than ITA, the IRB are also accountable for supervision, assessment, collection and
enforcement of petroleum taxes, real property gain taxes and stamp duties. The
indirect taxation system is controlled by the Royal Malaysian Customs (RMC). This
includes customs duties, excise duty, sales tax and service tax (Palil, 2010).
2.2 Consumers
In previous research, (Nordiana, 2012; Bidin & Shamsudin, 2013; Ramalingam et
al., 2014) their scope of study was on industrial taxpayers such as manufacturers,
retailers and distributors. The focus was on businesses that were registered under
GST compliance. In this study, the scope of study is on consumers, individuals who
consume goods with taxes already embedded in the pricing. Thus, the matter of non-
compliance or evasion does not exist in this context. In this study, MBA students
will be representing the consumers as majority of them are within the age group and
employment status highlighted in the Merdeka Center Survey of those who had a
higher percentage of not accepting GST.
An in-depth discussion of GST in the following component will highlight the very
fact that although GST will be charged at different stages, in the end the burden will
be on the consumer (Voon, 2013). The implementation of GST will have quite a
significant impact on consumers especially since according to the Report on
Household Expenditure by the Department of Statistics Malaysia, average monthly
expenditure per household has increased from RM 1,161 in 2004 up to RM 2,190 in

15
2010. Even without GST implemented, consumers are facing an increase in
expenditure by 89% over 6 years. Thus, it is vital to study the perceptions and
acceptance of GST by these Malaysian consumers and the factors that are
influencing their perceptions.
Moreover, according to Bank Negara, Personal/Household Debt is standing at an
alarming rate of 83% of Gross Domestic Product of the nation compared to a 70% in
2009 and the debt to household income ratio is standing at an alarming 140%
(Joseph, 2013). Additional statistics creates more concern over this implementation
of GST. The increase in GDP of 5.1% in 2012 is less than half of the growth of
household debt of 12% in 2012, indicating severe unsustainability (Joseph, 2013).
Consumers are already high in debt pre-GST and it is worrying to imagine the
impact on consumers’ post-GST, where prices of goods and services are expected to
increase.
Hence, with the undertaking of this study, the reasons for knowledgeable consumers
accepting or not accepting GST can be determined and consequently influence the
channeling of resources towards customizing assistance and support for the
consumers in the most effective way.

16
2.3 GST
Goods and Services Tax or GST is a tax on consumption based on a value-added
concept. In a nutshell, the more you consume the more tax you pay. Unlike the
present sales tax or service tax which is a single stage tax, GST is a multi-stage tax.
The tax is not a cost to the intermediaries since they are able to claim back GST
incurred in their business operations. GST is imposed on goods and services at every
stage in the supply chain including situations in which the good or service is
imported. It is not a new tax but instead is a tax to replace the current Sales Tax and
Service Tax (SST). GST is also known as VAT, Value-Added Tax in certain
countries (RMCD, 2013)
2.3.1 Reasons for implementing GST
The key reason for many countries adopting GST/VAT is the inefficiency of the
current tax system in financially supporting the development of the nation’s
economy. The same scenario occurred here in Malaysia and the Ministry of Finance
has studied and confirmed that the implementation of GST can overcome the various
weaknesses under the current Sales & Service Tax system. These weaknesses
include tax compounding and cascading, transfer pricing and reliefs on certain goods
(RMCD, 2013).

17
Figure 2.1: Cascading effect -Sales & Service tax (RMCD, 2013)
Figure 2.2: Cascading effect - Service tax (RMCD, 2013)
In 1990, direct taxes contributed to 35.2% of the nation’s revenue whilst indirect
taxes contribute to 36.7%. The contributions of both categories of taxes were equal
but trade liberalization policies were amended causing major inequality in the
contribution of direct and indirect taxes. This was clearly depicted in 2012 when the
contribution from direct tax was 56.4% and indirect tax 17.2%. At this point of time,
Malaysia relies profoundly on direct taxes and petroleum revenues, a situation which
economic experts do not recommend. According to these experts, over-dependence
on only certain taxes will have an adverse effect on the nation’s financial position.
Hence, to eliminate these adverse effects this is an appropriate time for the
Government to engage in an overall tax reform and implement GST. (RMCD, 2013)

18
2.3.2 Significance of GST
GST was introduced by the government in the 2005 budget but postponed to a later
date. Following that, the GST Bill was tabled for the First Reading in the Dewan
Rakyat in December 2009 but in 2010 the implementation was postponed again.
However, the implementation of GST is inevitable to support the nation’s long term
economic growth and the pressure was on the government to ensure a smooth
transition to GST. In order to do this, the Government has to take into account the
welfare and concerns of the society as a whole so that it is well-received (RMCD,
2013).
With this in mind, the Government had undertaken social impact studies of the
implementation of GST. To ease the tax burden on the consumers, certain goods and
services which are indispensable to the low and middle income group have been
proposed not to be subjected to GST. To add on, basic items such as poultry, rice,
flour, meat, vegetable, sugar, flour, cooking oil, residential and agricultural
properties, health services and education will not be subjected to GST (RMCD,
2013).
GST is a more transparent, competent, effective and less bureaucratic taxation
system. The double taxation phenomenon under the Sales & Services Tax regime is
eliminated with GST in place. From a business point of view, they are able to reduce
costs as they now can claim back the GST incurred which was not possible under the
SST regime. A company which back then had to absorb the sales and service taxes

19
2.3.3 Mechanism of GST
The mechanism of GST can be examined from the consumers’ and businesses’ point
of view.
(a) Business
GST is charged on the supply of goods and services made in Malaysia and on the
imports of goods and services into Malaysia. GST is charged on the selling price of
the goods or services and only the GST amount will be forwarded to the
Government. The GST value is representative of the value added to the goods or
services at each level of the supply chain. The value added is the value added to a
raw material or purchases before selling the new or improved product or service. To
operationalize this, GST adopts a credit offset mechanism whereby GST charged
on the output of the business is offset against the GST paid on the goods or services
acquired as inputs by the business. Along these lines, a company will be charged
GST by its suppliers and simultaneously, the company will charge GST to its
paid can now claim the GST paid from the Customs. The net effect is definitely a
reduction in costs for these companies (RMCD, 2013).
Exportation of goods and services are not subjected to GST which will in return
ensure Malaysian exports are competitive in the global market. Consequently, this
will improve the Gross Domestic Product of the nation (News Strait Times, 2015)
With GST in place, shadow economy activities such as illegal trading, black money
and tax evasion can be curbed. (Schneider & Frey, 2000 ; MalayMail Online, 2015)

20
customers. GST charged on output is called output tax and GST incurred on
purchase is called input tax. This offsetting mechanism is to guarantee GST paid by
businesses are recoverable leading to a reduction is cost. Most importantly, this
ensures there’s no double taxation and the net tax effect on the end consumer is only
6%. (RMCD, 2013)
Diagram 2.3: Input and output tax (RMCD, 2013)
(b) Consumers
GST-registered businesses will collect GST from consumers on the goods and
services purchased. There are three types of supplies listed under GST which
are(Examples are derived from Royal Malaysian Customs Guide on Supply
under GST):
(i) Standard rated supplies are taxable supplies of goods and services which are
subject to a positive rate of 6%. Examples of these supplies are sales of
commercial properties, vehicles, accessories and packaged food items.
(ii) Zero rated supplies are taxable supplies which are subject to a zero rate.

21
Examples of zero-rated supply are fresh vegetables, live animals, books and
exports of goods and services. Businesses dealing with zero-rated supplies are
still able to claim the input taxes incurred.
(iii) Exempt supplies are non-taxable supplies which are not subject to GST.
However, the GST paid on input by the businesses cannot be claimed as tax
credit. Examples of exempt supply of services are domestic transportation of
passengers for mass public transports, private education and private health
services. Examples of exempt supplies of goods are residential properties, land
for agricultural and land for general use.
Below is an illustration showing how GST works:
Diagram 2.4: Standard rated supply (RMCD, 2013)
Diagram 2.5: Zero-rated supply (RMCD, 2013)
22
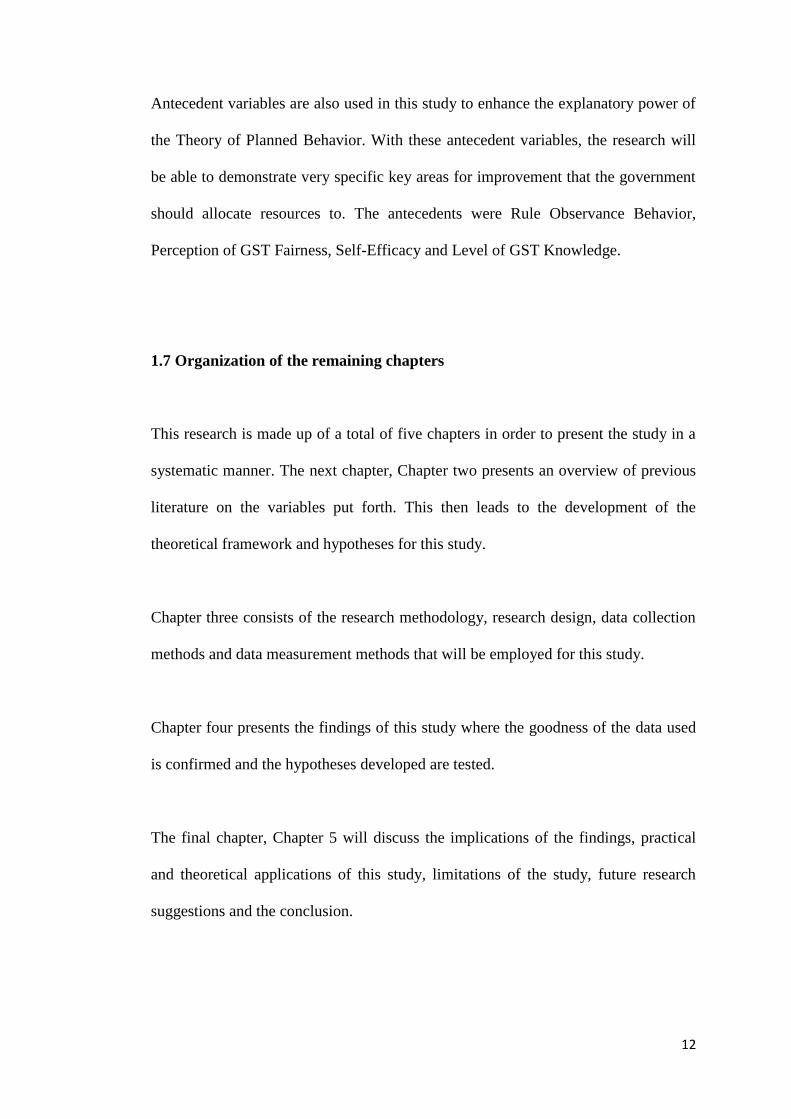
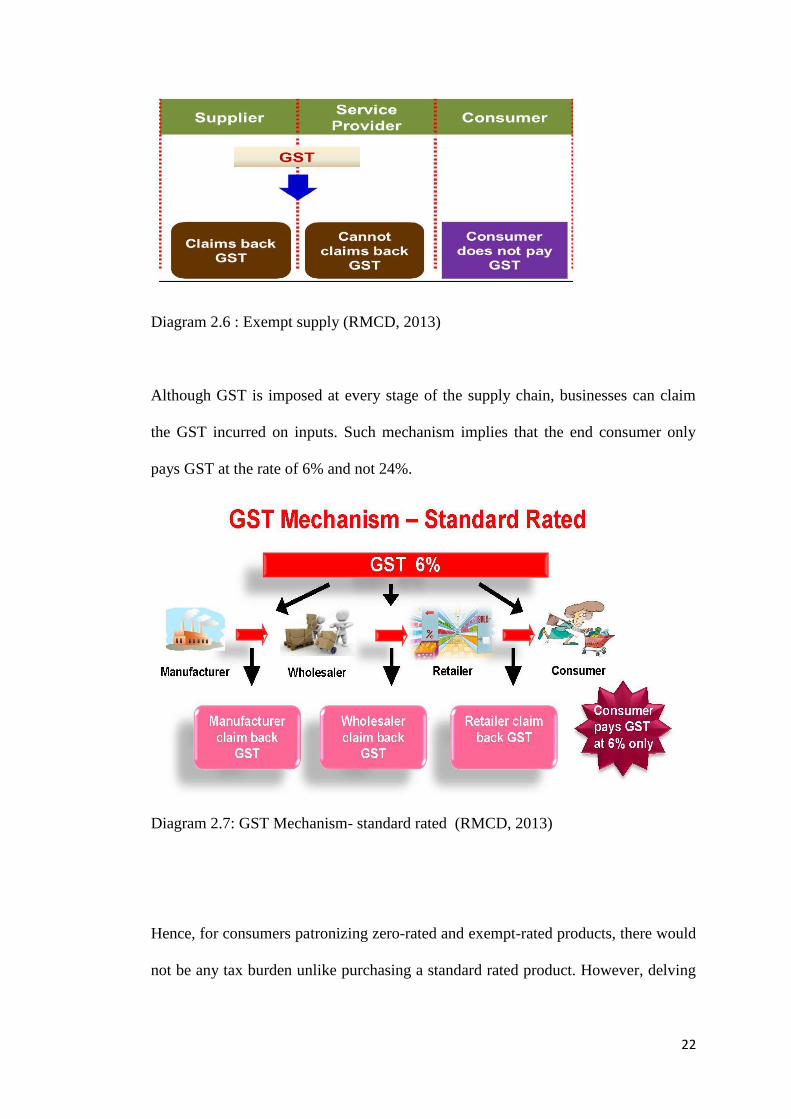
Diagram 2.6 : Exempt supply (RMCD, 2013)
Although GST is imposed at every stage of the supply chain, businesses can claim
the GST incurred on inputs. Such mechanism implies that the end consumer only
pays GST at the rate of 6% and not 24%.
Diagram 2.7: GST Mechanism- standard rated (RMCD, 2013)
Hence, for consumers patronizing zero-rated and exempt-rated products, there would
not be any tax burden unlike purchasing a standard rated product. However, delving

23
deeper, the consumer should understand that producers of exempt rated goods and
services cannot claim back their incurred input GST and will have no choice but to
channel the cost to the consumers by increasing prices. For example, a private
education institute will have to pay their suppliers GST for purchases of
infrastructure and maintenance services but will not be able to claim this GST
expense from the customs as their service is considered an exempt rated service.
However, the institute is now incurring higher costs than pre-GST implementation
and will have to increase their selling prices as well to cover the costs incurred.
An equally important point to understand is that GST, if well-implemented
should not result in increase of prices of all standard-rated products and
services. With the discussions below, an understanding can be obtained on the
three main implications of standard-rated GST on consumers.
Scenario 1:
10% SALES TAX abolished, 6% GST implemented
The sales tax of 10% is a business to business transaction and this tax burden is
usually embedded in the final pricing to end consumers. With the
implementation of GST, consumers should end up paying less because a
product manufactured or imported now is subject to 6% GST rather than 10%
Sales Tax.
24
Scenario 2:
6% SERVICE TAX abolished, 6% GST implemented
While most consumers don’t experience the direct effect of the 10% Sales Tax,
most of them would have paid for the 6% Service Tax. In the scenario of
consumers engaging in service for which they were previously charged 6%, the
implementation of GST will not impose any price increase on items.
Consumers will be paying the same.
Scenario 3:
No Service or Sales Tax previously, GST 6% implemented
As GST is a broad-based taxation system, more sectors of the economy are
covered as compared to under the SST regime such as the paper and printing
industry, food preparation industry, medical and educational equipment
industry as well as repackaging industry. (Customs Guide Book,2003) Unless
the goods or services are zero-rated, prices of goods not previously covered
under SST will now be affected. Consumers will have to pay a higher price.
2.3.4 GST rates in the ASEAN countries
The GST rate of 6% suggested is the lowest in comparison to our neighboring
countries. Although Singapore initially introduced GST at 3% but the current GST
rate is 7%.

25
The following are the GST rates among the ASEAN countries:
Figure 2.8: GST rates in the ASEAN countries (RMCD, 2013)
2.3.5 Implementation of GST
Budget 2014 has announced the confirmed implementation of GST on 1st April
2015. Many steps are undertaken to ensure the smooth implementation of GST.
Currently the Ministry of Finance is conducting a series of awareness program on
GST to the public and businesses. The aim of this awareness program is to help the
public and business to have a better understanding on the proposed GST model in
Malaysia, the mechanism and steps taken by the Government to overcome issues
raised concerning GST. (RMCD, 2013)
The people need to know that GST is charged and collected on all taxable goods and
services produced in the country including imports. Only businesses registered under
GST can charge and collect GST. GST collected on output must be remitted to the

26
Government. However, businesses are allowed to claim the input tax credit.
From the nation’s point of view, Minister in the Prime Minister's Department, Datuk
Seri Idris Jala stated that GST implementation is projected to result in additional
revenue of RM20 billion to RM27 billion, at maturity. At maturity refers to the point
in time when every Malaysian starts to contribute towards the GST. The additional
revenue thus can be used to enhance the well-being of Malaysians as a whole
(Xavier, 2013).
2.4 Theory
A theory in essence is a tested general proposal, universally regarded as correct,
that can be used as a principle of explanation and prediction for a scenario (Oxford
Dictionary, 2015). This study employs the Theory of Planned Behavior to determine
the consumers’ acceptance behavior of GST. The theory is used to support the
framework of this study. Antecedent variables are added in to enable better
explanation of the components of TPB. Detailed discussion will be done in following
sections.
2.4.1 Theory of Planned Behavior (TPB)
Through his article "From intentions to actions: A theory of planned behavior", Icek
Ajzen put forth the Theory of Planned Behavior in 1985. This theory was expanded
from the theory of reasoned action proposed by Martin Fishbein together with Icek
Ajzen in 1975. (Azjen 1991) The theory of reasoned action portrays behavioral

27
intention as antecedent to actual behavior. Behavioral Intention is determined by two
independent variables; attitude and subjective norms.
In the Theory of planned behavior, to take into account conditions of variable
control, an additional construct was included- Perceived Behavioral Control. This
particular component reflects the respondent’s perception of how much control they
have over the behavior. (Taylor & Todd, 1995) Therefore, according to TPB,
intention to behave in a certain way is determined by the attitude towards the
behavior, subjective norms and perceived behavioral control. The TPB is highly
valuable due to the fact that it can be used in numerous applications and has a more
powerful predictive framework compared to TRA (Ajzen, 1991)
Predicting behavior is the ultimate objective of TPB thus it does not explain the
behavior (Conner & Sparks, 2005). The TPB model is not restricted to predicting
behaviors in information systems (Davis et al., 1989) and other human behaviors
(Paris &Broucke, 2008; Guo et al., 2007; and Chang, 1998), but is also useful in
explaining tax compliance behavior (Saad, 2010; Palil & Ibrahim 2011). Research on
tax compliance has tried to prove this theory in a number of countries. Trivedi &
Shehata (2005) proved the Theory of Planned Behavior in Canada, Bobek and
Hatfield (2003) proved it in the USA, Damayanti (2012) proved it in Indonesia and
this study aims at proving the applicability of this theory in the context of Malaysian
Goods and Services Tax.

28
2.5 Dependent Variable
In this study, level of acceptance of Goods & Services Tax has been identified as the
dependent variable of the study. Level of acceptance of GST is measured by the
individual’s intention to accept GST. Intention is defined as being mentally
determined to accept GST (Hung, Chang & Yu, 2005). Level of acceptance is simply
the level of agreement of the individual with the implementation of GST. The TPB
advocates that the intention to behave in a certain manner is highly influenced by the
attitude towards the behavior in question, whether or not those who are influential to
the respondents have the behavioral intention-subjective norm and perceived
behavioral control- the ease or difficulty of performing the behavior caused by
internal and external constraints (Ajzen, 1991; Sommer, 2011).
The type of behavior impacts the degree of intention-behavior uniformity. Findings
confirmed that intentions are significant predictors of an action. The intention to
behave in a certain way is a sufficient proxy measure of behavior. Previous studies
have concurred that intention to comply with tax obligations explains an individual’s
decision to comply with tax obligations (Bidin & Shamsudin 2013; Saad, 2010;
Trivedi et al.,2005; Palil & Ibrahim,2011). Cheng, Lam & Yeung (2006) also argued
that for a survey-based research design, measurement of behavioral intention is more
appropriate than actual behavior.

29
2.6 Antecedent and Independent variables
Independent variables of this study consist of attitude, subjective norm and perceived
behavioral control. Antecedent variables consist of rule observance behavior,
perception of GST fairness, level of GST knowledge and self-efficacy.
2.6.1 Attitude
Attitude is an individual’s assessment of performing a behavior. The evaluation can
be either positive or negative (Fishbein & Ajzen, 1975). Attitude towards behavior is
defined as a function of an individual’s beliefs towards a behavior and a subjective
evaluation of that behavior (Fishbein & Ajzen, 1975). The belief component captures
a person’s perceptions about a certain behaviour. Many studies confirmed the
correlation between attitudes and behavioral intention. (Wan et al., 2012) It is highly
related to behavioral intention because individuals form intentions to perform
behaviors towards which they have positive feelings. Ajzen (1991) specifies that
attitudes towards compliance reflect feelings of favour and disfavour towards
behavior, in this case level of acceptance of GST.
Any attitude is a hypothetical or latent variable rather than an immediately
observable variable. It is, in other words, an abstraction. The concept of attitude does
not refer to any one specific act or response of an individual, but it is an abstraction
from a large number of related acts or responses. When we state that a certain
individual, A, has a less favorable attitude towards GST than another individual, B,

30
we mean that A's words and actions are consistently less favorable to GST than B's
words and deeds (Jones, 1970).
There are a number of functional approaches to attitude and the approach applicable
to this study would be the adjustive function. This function of attitude has relevance
in the realm of behavioral theory. It follows from the nature of the adjustive function
of attitudes that the clarity, consistency and nearness of rewards and punishments are
important factors in the acquiring of new attitudes. In this case, the possible rewards
and benefits from GST could be an important factor in consumers acquiring a
positive attitude towards GST (Jones, 1970)
Social psychologists agree that an attitude involves at least three things
(Culbertson,1986):
1. An attitude object which may be physical or an abstraction. In this context, it
is the GST.
2. A set of beliefs that the object is either good or bad. Hence in this case it
would be the belief of whether GST is good or bad.
3. A tendency to behave towards the object so as to keep or eliminate it. This
refers to the acceptance of GST.
Using belief-based attitudes measurements in a taxation context will result in
attitudes explaining compliance behavior (Bobek, 1997). Thus, it is anticipated in
this study that a positive attitude towards the GST tax system would encourage

31
consumers to be accepting of it. In this study, we have considered two antecedents to
attitude, namely Rule Observance Behaviour and Fairness Perception.
Attitude is operationalized in previous studies (Loo et al.,2007 & Bobek 1997) by
determining the individual’s positive or negative feeling towards the behavioral
intention. The same concept is applied here to determine the beliefs and perspectives
that these consumers have on GST.
2.6.2 Rule Observance Behavior
Rule Observance Behaviour is an act or instance of following a rule. Trevino (1986)
discussed a model of ethical decision making wherein situational and individual
moderators interact with an individual’s cognitions to determine ethical or unethical
behavior.
One situational moderator included in the framework is “obedience to authority”.
Obedience is a form of social influence where an individual acts in response to a
direct order from another individual, who is usually an authority figure. (McLeod,
2007) Rule Observance Behavior is studied as an antecedent to attitude in this study.
Previous study (Sarina et al., 2007) measured the obedience of auditors to authority
and rules whilst another previous study (Jeffrey &Weatherholt, 1996) measured the
rule observance behavior amongst corporate accountants. This study will undertake

32
the same operationalization of this variable as it is a straightforward and simple
variable.
2.6.3 Perception of fairness of GST
The term fairness relates to the justification and validity a consumer assigns to
the burden of the GST. The term perception of fairness is used here because each
individual has a different perspective of the fairness of the taxation system which
does not conclude on the ultimate fairness of the system (Jones, 2009).
Previous studies indicate that fairness perceptions can take various forms. The first
dimension that can be looked at is the vertical fairness, which stresses that different
tax rates should be enforced for taxpayers with different economic situations (Erich
et al., 2006). This would result in higher income earners paying tax at higher rates
than low-income earners. The next dimension is horizontal fairness, defined as ‘the
equal treatment of equally circumstanced individuals’ (Michael, 1978). In this
horizontal fairness dimension, taxpayers of similar economic positions should pay
the same amount of tax. Horizontal and vertical fairness are derived from the
Distributive Justice Theory (DJT) which argues that individuals in similar
circumstances must be treated in an equivalent manner without compromising their
individual needs.
Besides vertical and horizontal fairness, a study on the US tax system brought forth
the concept of procedural fairness and policy fairness (Bobek, 1997). Procedural

33
fairness relates to the procedure engaged to reach distribution outcomes while policy
fairness deals with the content of the tax law. Moving on, exchange fairness is a very
significant dimension (Gilligan & Richardson, 2005; Gerbing, 1988), which
represents the exchange of contribution and benefit between taxpayers and
government. In simple terms, the exchange fairness dimension highlights that
taxpayers will have fair perceptions of the tax system if the benefits received from
the government are justifiable compared to their tax contributions. Other dimensions
of fairness include a preference for either progressive or proportional taxation
(Turman, 1995), personal fairness, tax rate fairness, special provisions and general
fairness (Gilligan & Richardson, 2005; Richardson, 2005a; Christensen &
Weichrich, 1996; Christensen et al., 1994; Gerbing, 1988). The above review on
studies of tax fairness suggests approximately ten dimensions of fairness.
However, in this study, only two dimensions are identified to be important in
assessing the fairness of the GST system; general fairness, exchange fairness (Saad,
2010) General fairness simply measures individuals’ judgments whether the GST tax
system is generally fair or not while exchange fairness is concerned with a mutual
exchange between taxpayers and the government. The rest of the dimensions would
not be applicable as GST is a tax on consumption and not income. Perception of
fairness of GST is studied as an antecedent to attitude.
In general, equity theory is engaged when studying tax fairness. Equity
theory explains relational satisfaction in terms of fairness perceptions of distributions
of resources within interpersonal relationships (Jones, 2009).

34
2.6.4 Subjective Norm
Subjective norm reflects the level of influence significant referents have on
individuals. In this case, the influence would be in reference to accept or not accept
the implementation of GST. Ajzen (1991) describes subjective norm as ‘the
perceived social pressure to perform or not to perform the behaviour’ or ‘an
individual’s perception that important others would approve or disapprove of his or
her performing a behaviour’ Subjective norm addresses the individual’s belief that
others in their support network want them to support or oppose GST, and their
motivation to comply with the views of those persons. This is simply known as the
social influence component of decision making.
According to the theory of planned behavior, the support of significant others will
influence consumer’s acceptance of GST. The opinions of peers are critical in
shaping the views of individuals due to the necessity for interpersonal support during
a time of change (Gerpott, 1990) and the effects of information processing on
socialization (Salancik and Pfeffer, 1978) In this context, subjective norms in
intention to accept GST refer to how other consumers feel about the subject matter.
As subjective norm is related to significant referents, peers and family members are
taken up as the influential referents (Damayanti, 2012).
No antecedents were identified for the subjective norm as influences from peers and
family members would have the same impact and thus would not provide additional
insight. The same measurements used in Bhattacherjee (2000) were used for this

35
study as the two main areas of peers and family members have to be covered in order
to have a valid measurement.
2.6.5 Perceived behavioral control (PBC)
PBC is the latest and unique construct of the TPB and can be linked to behavior both
directly and indirectly through intentions. The direct impact is the actual control an
individual has over behavioral performance whilst indirect impact refers to the
motivational influence of control on behavior. In this case study, we are looking at
the indirect link of perceived behavioral control and behavior through the intention
to behave.
Perceived behavioural control reflects an individual’s perception on the ease or
difficulty in performing a particular behaviour. In a more detailed explanation, PBC
refers to an individual perception of accessibility of resources or opportunity
necessary for performing the behavior (Ajzen, 1985; Ajzen & Madden, 1986) Ajzen
(1991) stipulates that high perceived behavioural control results in a behaviour being
easy to perform, while one that is difficult to perform is low in perceived behavioural
control.
There are internal and external perceived behavioral controls. The internal factors
refer to individual’s disposition which includes the amount of information a person
has. The external factors determine the extent to which circumstances support or
inhibit the performance of behavior (Ajzen, 2001) PBC has to be customized to the

36
type of behavioral issues under study (Sparks et al., 1997). Perceived behavioral
control is the perception of the resources, knowledge and ability to perform the
behavior (Giantari, 2013). In this case, the two antecedents to PBC are level of tax
knowledge and self-efficacy. Both are internal perceived behavioral controls.
Previous studies (Sarina et al., 2007; Nordiana 2012) operationalized this variable by
examining the perceived internal and external constraints on behavior or intention to
behave. The same measurement is undertaken here in order to measure the
constraints or resources that individuals face or have in accepting GST.
2.6.6 Level of GST Knowledge
A voluntary tax compliance system is effectively functional only with tax knowledge
(Kasipillai, 2000). The tendency to not comply with tax whether intentionally or
unintentionally increases with the lack of knowledge. This was proposed by
McKerchar (1995) who studied small business taxpayers. She concluded that
taxpayers were not even aware of their tax knowledge deficit and this might lead to
unintentional non-compliance behavior.
An earlier study by Harris (1989) separated tax knowledge into fiscal awareness and
technical knowledge. Saad (2010) has divided tax knowledge into four categories but
only two are applicable here as we are not discussing compliance bur rather just
acceptance. The two are general knowledge and technical knowledge. Previous

37
studies have evidenced that general tax knowledge has a very close relationship with
taxpayers’ ability to understand and appreciate the laws and regulations of taxation.
(Singh, 2003). This can also be translated for the purpose of this case study, to the
fact that with the general and technical knowledge on GST, consumers will be able
to manage their consumption better in order to minimize the impact of the GST on
their expenses especially since many essentials are tax-exempt and zero-rated. Level
of tax knowledge is taken as an antecedent to perceived behavorial control in this
study.
This variable is measured both in a technical and practical way in this study and it is
customized to GST issues.
2.6.7 Self-Efficacy
Self-efficacy is associated with effective behavioral strategies and this has led to this
concept being studied as an influence to improved performance in various situations.
(Ben-Ami et al., 2014) Self-efficacy theory postulates that individuals judge their
ability to cope effectively with challenges when faced with environmental demands.
Based on this judgment, individuals initiate behavioral strategies to manage
challenges efficiently and attain desired outcomes (Bandura, 1997). Self-efficacy is
the confidence an individual has of his/her competence to perform specified tasks
(Bandura, 1997). It is a well-researched concept originating from the Social
Cognitive Theory (Bandura, 1986). Self-efficacy is comparable to self-confidence
however self-efficacy is more situational in nature. Self –confidence is more task-

38
specific whilst self-efficacy is a dynamic paradigm that changes over time depending
on new information and experiences (Schmidt & Karsten, 2015).
Previous studies (Schmidt &Karsten, 2015; Kraft et al.,2005; Kulviwat et al., 2014;
Ben-Ami et al., 2014;) had investigated this concept of self-efficacy in various
situations and have concluded that it is indeed a significant factor in those situations.
Thus, in this study, self-efficacy is in relation to the consumers’ judgement on how
well they will be able to cope with their lifestyles even with the implementation of
GST. This might include their perception of the costs and benefits involved as they
will have to set behavioral strategies. (Raghuram, 2003; Beauregard,2012) Self-
efficacy is studied as an antecedent to perceived behavioral control.
Self-efficacy was measured by previous research by enabling respondents to judge
their own capabilities to organize and execute their intention. (Kulviwat, 2014; Ben-
Ami, 2014) In this study, hence, this variable is measured by the individual’s
judgement of their ability to manage their lifestyles and finances with GST in place.

39
2.7 Theoretical Framework
In order to have a scientific and systematic research of this subject matter, a
theoretical framework has been formed. The theoretical framework is developed
using the Theory of Planned Behavior model as the underlying foundation. The
dependent variable of the framework is Level of Acceptance of GST. The
independent variables are based on the components of Theory of Planned Behavior
which are Attitude, Subjective Norms and Perceived Behavioral Control. Following
that, antecedent variables are determined and included to enhance the value of the
research. Antecedent variables are included only for Attitude and Perceived
Behavioral Control. The antecedent variables for attitude are Rule Observance
Behavior and Perception of GST Fairness whilst the antecedent variables to
perceived behavioral control are Level of GST knowledge and Self-efficacy.

40
Figure 2.9 Theoretical Framework

41
2.8 Factors Affecting Level of Acceptance of GST
Reading the literature, there are 3 main streams of literature that can be used for the
basis of this study. There are studies examining factors affecting compliance of GST,
factors affecting level of tax compliance and factors affecting level of acceptance of
products or systems, other than tax or GST. There are also a few other studies which
use the latent variables in this study in a different context. These studies have also
been used to support the hypotheses development involving the antecedent variables
and independent variables.

42
Table 2.1: Key Studies on Malaysian Goods and Services Tax
Author/Year Title Location Theory IV DV Methodology Findings
ZainolBidin and
FaridahwatiMohdSha
msudin/
2013
Using Theory of
Reasoned
Action to
Explain
Taxpayer
Intention to
Comply with
Goods and
Services Tax
(GST)
Malaysia Theory of
Reasoned
Action
1) Attitudes
2) Subjective
Norms
Compliance
with GST
Structured
questionnaires
that were
distributed to a
sample of 103
taxpayers
(corporates) with
the assistance of
the Department of
Royal Malaysian
Custom
Department in
Kedah and Perlis.
1) Subjective norms
and attitude
influenced the
manufacturers’
intention to
comply with
GST.
2) Subjective norm
was found to be
the strongest
factor for
successful GST
implementation
3) R square = 28%
NordianabintiRamli/
2012
The Perception
of Taxpayers
toward Goods
and Services
Tax (GST)
Implementation
Malaysia Theory of
Planned
behaviour
1) Attitude
2) Subjective
norm
3) Perceived
Behavioural
Control
4) Law &
enforcement
Intention to
comply with
GST
Structured
questionnaires
that were
distributed to a
sample of 150
with the
assistance of the
Department of
Royal Malaysian
Custom
Department in
Kedah and Perlis.
1) Subjective norms
and law &
enforcement
influence
intention.
2) Subjective Norm
is the strongest
factor.
3) R square = 28%
Mohd Rizal Palil and
MohdAdha Ibrahim /
2011
The Impacts Of
Goods And
Services Tax
(GST) On
Middle Income
Malaysia Theory of
Planned
behaviour
1) Demographics
2) Respondents’
readiness,
acceptance
Intention to
comply with
GST
Data was
collected through
a structured
survey among
middle income
1) This study
suggested that
many
respondents were
worried on their

43
Author/Year Title Location Theory IV DV Methodology Findings
Earners In
Malaysia
andperceptions.
3) Respondents’
behaviour
toward the
implementation
of GST
earners (RM
2000- RM 4000)
from various
organizations
including
government and
private sectors
from various
locations in Kuala
Lumpur,
Malaysia.
purchasing
power
particularly
among the
middle income
earners.
2) The study
provides the
government with
a number of
measures to be
undertaken for a
smooth process.
44
2.8.1. Studies on Goods & Services Tax
Table 2.1 shows the studies that have been conducted on GST which were referred to
in the hypothesis development of this study. As can be seen the studies conducted
are focusing on corporate tax payers who need to comply with the collection of GST
for the government. The Theory of Planned behavior is used in those studies and
hence can contribute significantly to the hypothesizing of latent variables’
relationships in this study.
2.8.2 Studies on Tax compliance
Studies on tax compliance have used Theory of Planned Behavior in the Western
context (Jones, 2009; Bobek & Hatfield, 2003) and Asian context (Damayanti, 2012;
Saad, 2010). Previous studies (Harris, 1989; Hanno &Violette, 1996; Bobek, 1997;
Tan & Chin Fatt, 2000; Richardson & Sawyer, 2001; Seidl & Traub, 2001; Loo et
al., 2007; Hai & See, 2011; Thomas, 2012; Devos, 2014; Boonyarat, 2014; Schmidt
& Karsten, 2015) all have dwelled in the various factors that affect tax compliance
amongst corporates and individuals. These studies also look into the various factors
that affect attitudes and perceived behavioral control towards tax compliance.
Amongst the common factors looked at were tax knowledge, tax fairness and self-
efficacy.
2.8.3 Studies on Intention to Accept/Level of Acceptance
As this study looks at the acceptance of GST, previous studies on acceptance, usage
and adoption were analyzed. Previous studies use the Theory of Planned Behavior to

45
study the acceptance of various subject matters such as technology, employee union,
systems and online applications (Teo & Lee, 2010; Vijayasarathy, 2003; Dawkins &
Frass, 2005; Sarina et al., 2007) Theory of Reasoned Action is also used in the study
of acceptance of computer usage (Shimp& Kavas, 1984). Through these studies,
relationships between attitude, subjective norms and perceived behavioural control
on acceptance can be examined and used to develop the hypotheses of this study.
Also, previous research (Kulviwat, 2014; Chiou, 1998) discussed the antecedents to
perceived behavioural control namely knowledge level and self-efficacy in the
context of technology and product acceptance.
2.8.4 Other Studies
Other studies in different contexts were examined in order to support the antecedents
to attitude and perceived behavioural control. Previous studies (Guthrie &
Schwoerer, 1994; Droomers et al., 2004; Raghuram et al.2003, Beauregard, 2012;
Ben-Ami et al., 2014) studied the relationship between self-efficacy and other factors
including perceived behavioural control. This is highly relevant to this study.
Trevino (1986) and Sarina et al., 2007) looked at the antecedents to attitude which
was significant in the formation of the hypotheses pertaining attitude in this study.

46
2.9 Hypotheses Development
Hypotheses development is done by first examining the relationship between the
antecedent variables, independent variables and dependent variable based on
previous literature.
2.9.1 Rule observance behavior and attitude
Rule observance behavior points to the obedience to authority whilst attitude
displays favour or disfavor to behave in a certain way. Being obedient to the
authorities reflects the belief that the law is above all. Goods and services tax is in
accordance to the laws of Malaysia and enforced by the Royal Malaysian Customs
Department. Hence, this rule observance behavior will influence a consumer’s
attitude towards GST (Sarina et al., 2007; Trevino, 1986).
The study hypothesizes that:
H1: Rule Observance Behavior will positively affect attitude to accept GST
2.9.2 Perception of Fairness of GST and attitude
Perception of GST fairness in this study only looks at general fairness and exchange
fairness. Previous study, mainly Saad (2010) advocated that positive fairness

47
perceptions are the antecedent of a positive attitude. This would mean that taxpayers,
or in this case, consumers with positive perceptions on the fairness of the GST
system are more likely to have positive attitudes towards the tax system and
consequently encourage them to accept it. According to Strumpel (1986), positive
attitudes resulting from perceived fairness of the tax system play an important part in
the level of tax compliance within a nation (Tan & Chin-Fatt, 2000). In the 1960s
itself, Strumpel’s fiscal psychology identified ‘willingness to cooperate” as a
variable in their model. This variable relates individual’s perception of tax fairness
and attitudes towards GST (Devos, 2014).
Tax burdens which are perceived as generally fair by taxpayers is an indication of
the taxpayers’ satisfaction with the current tax system which will result in enhanced
positive attitude towards the system. (Thomas, 2012; Seidl & Traub, 2001)
Therefore the study hypothesizes that:
H2: Perception of GST fairness will positively influence attitude to accept GST
2.9.3 Level of GST Knowledge and Perceived Behavioral Control
Knowledge comes in handy because individuals have an increased perception of
uncertainty when faced with a situation of change. (Saad, 2010; Palil,2010). An
understanding of the events causing the change directly impacts the level of stress
experienced by those involved in change efforts and the extent to which they support

48
change (Tetrick and LaRocco, 1987).Given evidence that tax knowledge affects
understanding of taxpayers, an obvious next that has been raised by previous
researchers (Saad, 2010; Harris, 1989) is whether enhancement of tax knowledge
will increase perceived behavioural control. In order to enhance the perceived
behavioral control in purchasing the right products, an individual’s high objective
product knowledge becomes an important factor of consideration (Chiou, 1998). The
same concept can be applied in this context. To understand the events that had
caused the implementation of GST, consumers will need to have the necessary tax
knowledge be it technical or practical.
Perceived behavioral control deals with how taxpayers perceive relative easiness and
difficulty in complying with tax obligations. As taxation is inherently a complicated
matter, it is more likely that taxpayer’s control over non-compliance with tax
obligations is influenced by resources. Based on this argument, it is appropriate to
investigate the impact of tax knowledge (resources) on perceived behavioral control.
Therefore, it is hypothesized that:
H3: Level of GST knowledge positively influences perceived behavioral control
2.9.4 Self-efficacy and Perceived Behavior Control
As a comparatively new concept in academic research, self-efficacy is derived from
the social cognitive theory advanced by the social psychologist Albert Bandura

49
(1986, 1997). In his words, self-efficacy is a state of self-regulation according to
which individuals develop self-disciplined behavior and seek to improve their
performance.
From previous study, (Guthrie and Schwoerer, 1994; Kulviwat, 2014; Ben-Ami et
al.,2014) self-efficacy has been viewed as a criterion for the individuals in question
to determine if they had the skills or ability to deal with the challenges arising from
the behavior. Previous research has indicated that self-efficacy is positively
associated with an individual’s disposition to participate in tasks and cope effectively
when faced with task-related difficulties (Schmidt & Karsten, 2015). Droomers et al.
(2004) singled out self-efficacy as an antecedent to perceived behavorial control and
proved it to be significant.
Raghuram et al.’s (2003) study of telecommuters supports these propositions with
those higher in self-efficacy reporting better adjustment and greater use of
structuring behaviors (Beauregard, 2012).
Consumers who are confident with their ability to manage the challenging lifestyle
post-GST implementation will have a higher perception of their control over the
behavior in question. This will lead to acceptance of GST compared to consumers
with lesser level of self-efficacy (or level of confidence).
The study hypothesizes that:
H4: Self-efficacy will positively influence perceived behavioral control

50
2.9.5 Attitudes and Level of Acceptance
According to theory of planned behavior, attitudes are believed to have a direct
effect on behavioral intention, in this scenario, the level of acceptance. Janzen (1988)
has named attitude as an important criteria in predicting and describing human
behavior. In the 1960’s, the “tax mentality” concept was introduced by Schmolders.
This concept concluded that the more positive a taxpayer’s attitude towards paying
tax, the greater their inclination to pay tax (Devos, 2014). Many researchers
following that have found attitudes to be a significant predictor of behavioral
intention (Jones, 2009; Teo & Lee, 2010; Hai & See, 2011; Bidin & Shamsudin,
2013) Beliefs of individuals influence their attitude towards an outcome which goes
on to influence their intention to perform the behavior. (Vijayasarathy, 2003) In the
context of taxation, Hanno and Violette (1996) used TRA as a theoretical basis and
reported that attitudes had a significant relationship with tax compliance intention.
In another study, Loo et al., (2007) also reported that attitudes towards tax system
positively influenced compliance behavior. They hypothesized that a positive
attitude towards the tax system would encourage taxpayers to comply. This can also
be translated as the positive attitude towards a tax system being able to encourage
consumers to accept the tax system itself. The same concept was advocated in an
Asian context by Damayanti (2012) in Indonesia and Boonyarat et al. (2014) in
Thailand.

51
Therefore, this study hypothesizes that taxpayers with positive attitudes towards the
tax system will increase their level of acceptance of GST.
H5: Attitudes towards GST are positively related to level of acceptance of GST.
2.9.6 Subjective Norms and Level of Acceptance
According to theory of planned behavior, subjective norms also influence behavioral
intention directly. In previous studies, many have found a significant effect of
subjective norms on behavioral intention (Hanno&Violette, 1996; Shimp & Kavas,
1984; Hai & See, 2011).An assessment of factors affecting compliance from 1986 to
1997 reveals agreement with peers as a significant influencer (Richardson & Sawyer,
2001).
In the context of taxation, Hanno and Violette (1996) found a significant and positive
effect of subjective norms on behavioural intention. Similarly, Bobek (1997) found
that the effect of subjective norm on compliance behaviour in a business simulation
scenario was significant. A comparative study in Australia, Singapore and the US by
Bobek and Hatfield (2003) also concluded that subjective norm is an influential
factor in explaining tax compliance behaviour. In an Indonesian taxation system
study by Damayanti (2012), subjective norm was the most influential factor for tax
compliance reflecting the collectivist culture in her country.

52
In the context of GST acceptance behavior, this study expects that subjective norms
will positively influence consumers’ level of acceptance of GST. Therefore, the
study hypothesizes that:
H6: Subjective norms are positively related to level of acceptance of GST
2.9.7 Perceived Behavioral Control and Level of Acceptance
Perceived behavioral control reflects an individual’s perception on the ease or
difficulty in performing a particular behavior (Ajzen, 1991). An individual with high
perceived behavioral control will be more likely to perform the behavior in context
than an individual with lower perceived behavioral control. A relevant illustration
would be that individuals who have high perceived behavioral control over
performing a daily physical exercise are more likely to do the exercise compared to
those with lower perceived behavioral control (Ajzen, 2006). Perceived behavioral
control has significant influence on intentions to behave based on assumption that
perceived behavioral control by an individual will have suggestions on the person's
motivation (Ajzen, 2002). In tax compliance behavior research, when a taxpayer
believes that he or she can successfully complete and file the tax return forms with
Inland Revenue without any mistakes, the person seems to have a high perceived
behavioral control and is more likely to comply with their tax obligations (Saad,
2010).

53
In this study, perceived behavioral control is the individual’s assessment of the
barriers they are likely to face and their ability to overcome those barriers when
accepting GST. The higher the individual’s PBC, the more likely the individual is to
accept GST (Dawkins & Frass, 2005; Damayanti, 2012). Bobek and Hatfield (2003)
have concluded that the behavioral control influences intentions based on the notion
that perceived behavioral control by an individual will have effects on the person's
motivation.
Therefore, the study hypothesizes that:
H7: Perceived behavioral control is positively related to the level of acceptance
of GST
2.10 Summary
To recap, this study is using the Theory of planned behavior to examine the factors
that influence consumers’ acceptance of GST which will be implemented on 1st April
2015. The theoretical framework of this study is made up of four antecedent
variables, 3 independent variables and one dependent variable.
The dependent variable is the level of acceptance of GST measured through the
intention to accept GST. The antecedent variables are Rule Observance Behavior,
Perception of GST fairness, Level of GST knowledge and Self-efficacy.

54
The independent variables are Subjective Norms of consumers, Attitude of
consumers and Perceived Behavioral Control of consumers. These were in line with
the components of the Theory of Planned Behavior.

55
CHAPTER 3
RESEARCH METHODOLOGY
3.0 Introduction
This chapter illustrates the methodology of the study which will comprise of research
design, type of study, population and unit of analysis, sampling size, sampling
method, data collection methods and data analysis methods.
3.1 Research Design
This is a quantitative research and thus, the research will be using primary data
obtained by means of questionnaire answered by selected respondents. The research
approach here is based on the deductive method as we are applying an established
theory in a current existing issue (Sekaran, 2003) In the deductive approach, theory
and hypotheses generation is the first step followed by operationalization of the
concepts in the theory and scientific assessments of the concepts (Lancaster, 2005)
In the next section, we will explore in detail the population of the study, sample size,
sampling method and measurements of variables in the questionnaire.
3.1.1 Type of Study
The study in essence is a correlational study as it examines the relationships between
the before-mentioned antecedent variables, independent variables and dependent
56
variable. Its aim is to study the extent of influence the antecedent variables have on
the independent variables and consequently the impact of the independent variables
on the dependent variable (Haron et al., 2011).
This study can also be considered as an exploratory study as it is the first to explore
the factors influencing acceptance of GST of consumers in Malaysia using the
Theory of Planned Behavior since the official announcement of its implementation
on 1st April 2015. Exploratory studies come in handy when researchers are
interested in examining possible relationships in the general aspect and allow the
method and the data to determine the type of relationship between the variables (Hair
et al., 2006).
The study setting is non-contrived since its respondents are to answer on issues that
are already existent in their natural environment. There are no man-made or lab
experiments.
The time horizon of this study is cross-sectional as it will be conducted over a period
of three months, in order to answer the research questions in place (Haron et al.,
2011).
3.1.2 Population and Unit of Analysis
As the GST is a consumption tax and not income tax, the study aims at
understanding the acceptance level of consumers in Malaysia. This covers a huge
population of Malaysia as consumers refer to any individual who purchases goods or

57
services for personal, domestic or household purpose, use or consumption. Hence, to
conduct a more specific study, the population of this study has been narrowed down
to Malaysian consumers who are currently pursuing their Masters in Business
Administration.
This is because MBA students are highly representative of the categories of
individuals portrayed in the Merdeka Center survey with high levels of unacceptance
of GST. The Merdeka Center survey had portrayed that there was a higher level of
unacceptance amongst private sector employees, self-employed individuals and
those involved business. Moreover, the age groups comprising of those in their
twenties and thirties showed a higher level of unacceptance. (Merdeka Center, 2015)
Majority of MBA students fall in those categories of age and occupation (Tay,
2001).
Besides that, the research requires the respondents to have a clear understanding of
the mechanism of GST, and it is assumed that MBA students would have the basic
understanding required to attempt the technical questions in the questionnaire. It
would be interesting to study if the assumption is in fact true, that MBA students do
have the basic knowledge on the mechanisms of GST. Without this control, there
will be too many variations in the respondents affecting the findings of this research.
With these focused respondents, the study will also be able to test common
assumption that the lack of GST acceptance is due to lack of knowledge (Borneo
Post Online, 2015; Jalil, 2015; GST Malaysia Info, 2014)

58
The success of the research can only be ensured if the sample taken is highly
representative of the population targeted. To obtain a representative sample of the
population mentioned, MBA students from Universiti Sains Malaysia, Universiti
Kebangsaan Malaysia, Universiti Malaya and Universiti Putra Malaysia were
targeted as all these public universities are Research Universities since 2006 and
have established business schools. (Ministry of Education, 2012). Although
Universiti Teknologi Malaysia is also a Research University, it was not included in
this list as it had only joined the research university cluster in 2010. (Ministry of
Education, 2012) Hence, to maintain the similarity within the selected universities
only the four first research universities were selected.
Thus, the unit of analysis is Malaysian individuals who are consumers in general and
are currently pursuing their Masters in Business Administration in either USM,
UKM, UM and UPM. Consumers as defined before are those who acquire goods or
services for personal, domestic or household purpose, use or consumption. Hence, all
respondents are treated as consumers.
3.1.3 Sample Size
The minimum number of respondents is to be at least ten times the total number of
variables to be analyzed.(Hair et al, 2014) Thus, in this case, it would mean that
since there are 8 variables to be examined, a sufficient sample size would be, 8*10 =
80. As the rate of response is usually 20%, at least 400questionnaires must be
distributed (Voorhis & Morgan, 2007).

59
3.1.4 Sampling Method
The sampling technique used is non-probability sampling; convenience sampling,
namely snowball sampling. Convenience sampling is a non-probability sampling
technique and respondents are selected because of the convenient accessibility and
proximity to the researcher (Haron et al, 2011)
Snowball sampling is when a group of people recommend participants for a study
based on personal acquaintances. Those participants then recommend other
participants hence building up like a snowball rolling down a hill. If the researcher is
opting for respondents who have to meet certain criteria to participate, then snowball
sampling can be used to ease data collection. It is known as a purposive sampling
and if executed correctly can approximate a random sample (Cohen & Arieli, 2011)
3.1.5 Data Collection Techniques
An online questionnaire was designed using the survey monkey online template. Link
to the online survey was sent out through email with a cover letter to one contact
person in each university-UKM, UPM and UM.As for USM, the email link was sent
out personally by the researcher. Details of the contacts are as follows:

60
Table 3.1: Profile of Contacts
University Number of Contacts Contacts’ profile
UPM 1 2nd
Year MBA student, part time
UM 1 3rd
Year MBA student, full time
UKM 1 3rd
Year MBA student, full time
The cover letter explained the objective of the study and assured confidentiality of
the responses. The cover letter is attached in Appendix D. They were then requested
to send out the email to their MBA batch mates. A period of two weeks was given
for the online survey link to be distributed. Reminder emails were sent after two
weeks to the contacts who in turn sent out reminder emails to their contacts to ensure
that the data collection fulfills the sample size needed.
An online survey is the most effective method to reach out to respondents of
different geographical areas. Hence it is the most logical instrument of data
collection for respondents from UKM, USM, UM and UPM who vary in their
geographical locations.
3.1.6 Survey Instrument
The instrument or tool used for this study is questionnaire. The questionnaire was
divided into FIVE sections, Section A to Section E in order to systematically collect
data for the measurement of the latent variables of the theoretical framework. There
are a total of 67 items to be answered in the questionnaire. Section D and E were

61
self-developed by the researcher to obtain relevant information for this research.
Detailed discussions of the sections and its construct will be discussed in the next
sections.
3.1.6 Questionnaire Design
A set of the questionnaire is attached in Appendix D.
The questionnaire was designed with the intention to gather relevant data for the
purpose of the study. Hence, the questionnaire was constructed with the theoretical
framework as a base, ensuring that each latent variable in the theoretical framework
is measured scientifically.
The questionnaire consists of FIVE sections, Section A to Section E, and clear
instructions on how to attempt the questions are stated in each section. This will
assist the respondents in understanding what is required from them.
A Likert scale is highly useful in ranking responses for each indicator of a latent
variable. It is ordinal in nature and is usually based on a five-point or seven-point
scale. (Likert, 1932) Previous research which measured the perceptions of the latent
variables in this study used the Likert Scale. (Saad, 2010; Sarina; 2007; Ben-Ami
2014), For the purpose of this study, a five-point Likert-type scale (Strongly
Disagree, Disagree, Neutral, Agree and Strongly Agree) was used for measurements
in Section B.

62
Section A of the questionnaire was entitled Demographic Profile and aimed at
gathering relevant demographic characteristics of the respondents to be used for
profiling of the respondents. The main aim is also to ensure the respondents fulfill
the criteria of the unit of analysis mentioned, they are; Malaysians currently pursuing
Masters in Business Administration.
Section B measured the antecedent variables, independent variables and dependent
variable based on a 5 point Likert Scale from (1) strongly disagree to (5) strongly
agree. Section B has 7 subsections which represent three antecedent variables; Rule
Observance Behaviour, Perception of GST Fairness and Self-Efficacy, three
independent variables; Attitude, Subjective Norms and Perceived Behavioural
Control and the dependent variable; Level of Acceptance.
Section C and Section D was fully dedicated to the measurement of Level of Tax
knowledge pertaining Goods and Services Tax (GST). Section C comprised of ten
technical questions which required the respondents’ agreement on the statements
given by circling YES if they agree and NO if they disagree.
Section D was made up of 5 short scenarios. The scenarios depicted real-life
situations and the respondents were required to identify the GST supply category and
the corresponding tax rate. The respondent had to tick the box with the right answer
for Part A and Part B for each scenario. This is to evaluate the respondent’s practical
knowledge of GST.

63
Section E consists of open-ended questions which aimed at gathering valued
opinions and feedbacks of respondents. This section would be pivotal for Chapter 5
when the researcher provides recommendations based on the findings from Chapter
These open-ended questions provide the respondents with an avenue to give relevant
and honest opinions and views.
Table 3.2 Summary of Questionnaire Sections
Section Purpose No of
measurement
items
A Demographic Profile 12
B Measurement of Antecedent variables, Independent
variables and Dependent variable using Likert scale
30
C Level of Tax Knowledge through technical questions 10
D Level of Tax Knowledge through scenario based
questions
10
E Open ended questions on opinions 5
Total 67 Items
3.2 Measurements of Variables
This section will indicate the source of the measurements used for the various latent
variables in the various sections of the questionnaire.
3.2.1 Measurement of Antecedent Variables and Independent Variables
Measurement of attitude has been adapted from Bhattacherjee (2000) and Loo et al
(2007) with modifications made to the content to suit the study of acceptance of
GST.
64
Attitude has two antecedent variables; Rule Observance Behaviour and Perception of
fairness of GST. Measurements of Rule Observance Behaviour was adapted from
Jeffrey &Weatherholt (1996) whilst perception of tax fairness was adapted from
Saad (2010) using the instruments of measurements for general fairness and
exchange fairness and customized to GST context.
Perceived behavioral control has two antecedent variables; self-efficacy and level of
tax knowledge. Measurements for Perceived Behavorial Control were adopted from
Ajzen (2013) modified for the GST context. For self-efficacy, measurements were
adapted from Kulviwat (2014) and Ben-Ami (2014) with adjustments to suit the
subject matter of GST. The measurement of level of tax knowledge will be discussed
in detailed in the next section.
Subjective Norm was adapted from Bhattacherjee(2000).The content was also
modified to suit this study and broadened to include peers and family influences.
3.2.2 Level of Tax of Knowledge Scoring
Level of tax knowledge measurements were conducted through two sections,
technical knowledge and practical knowledge. The technical knowledge concept was
adapted from Saad (2010), however, the items in the questionnaire were modified to
suit the study of acceptance of GST which means the questions have to test
consumers' technical knowledge on GST. The construct of these questions were
based on Royal Malaysian Customs Department’s Frequently Asked Questions

65
section on GST. A Yes or No question format was used for the tax knowledge quiz.
For each correct answer, one point will be given, with maximum marks any one
person can obtain being set at ten for the ten questions.
For the practical knowledge, real-life scenarios were self-developed for the
respondent to answer. For each scenario, the respondent chooses the correct GST
supply category- standard, zero or exempt (Part A) and the corresponding tax rate –
6%, 0% or none (Part B). One mark is given for each correct answer in Part A and
Part B with the maximum marks any one person can obtain being 10 marks, 5 marks
each for Part A and Part B.
For the level of tax knowledge section, the correct answers of the respondents are
calculated and a grade over 100% is given. For instance, if a person answers 5
questions correctly in Section C and 5 questions correctly in Section D, his/her total
marks would be 10 out of 20. The total marks for the Section C and Section D is 20.
Hence, his/her marks would be 10/20 * 100% = 50%. Thus continuous data is
collected for this section and analyzed.
3.2.3 Measurement of Dependent Variable
The dependent variable of level of acceptance of GST is measured using instruments
developed on our own based on the adaptations from Bhattacherjee (2000). It is on
5-point Likert scale with 2 items. As such a study had not been conducted,
measurements of this latent variable could not be validated based on the review of
literature.

66
In this study, the context of the adapted questions were changed to suit the subject
matter. For instance for the questionnaire items for the dependent variable on level of
acceptance, ‘I intend to accept GST’ is used instead of the original version of ‘I
intend to use the e-commerce services’ as stated in Bhattacherjee (2000). Another
example would be that for perception of GST fairness, in Saad (2010) it was stated
that ‘I believe everyone pays their fair share of income tax under the current income
tax system’. However, for the purpose of this study adaptations were made and the
question was ‘I believe everyone pays their fair share of tax under the proposed GST
system’.A summary of the measurement of variables is presented in Table 3.4.
Table 3.3 Sources of measurement of variables
Section Variable No of
items
Source
A Demographic Q1- Q12 Self-developed
B Antecedent Variables to Attitude
(i) Rule Observance Behavior Q1-Q5 Adapted- Jeffrey
&Weatherholt (1996)
(ii)Perception of fairness Q1-Q6 Adapted -Saad (2010)
Independent Variables
(iii) Attitude Q1 – Q2
Q3 – Q5
Adapted–Bhattacherjee(2000)
Adapted- Loo et al (2007)
(iv) Subjective Norms Q1 – Q5 Adapted- Bhattacherjee(2000)
Antecedents to Perceived Behavioral Control
(v)Self-Efficacy Q1- Q2
Q3- Q4
Adapted Kulviwat (2014)
Adapted Ben-Ami (2014)
(vi)Perceived behavioral
control
Q1-Q3 Adapted – Ajzen (2013)
Dependent Variable
(vii) Behavioral Intention Q1-Q2 Adapted – Ajzen (2013)
C Antecedents to Perceived Behavioral Control
(viii)Level of Tax Knowledge
– Technical Questions
Q1-Q2
Q3-Q10
Adapted- Saad(2010);
RMCD GST FAQ(2014)
D (ix) Level of Tax Knowledge
– Scenario-based Questions
Q1-Q10 Self-developed
E (x) Open-ended questions Q1-Q5 Self-developed

67
3.3 Pre Test
To determine the consistency and reliability of the questions in measuring the
variables, a pre-test is conducted. The pre-test is also aimed at assessing the
respondents’ understanding of the questions in the questionnaire designed.
Five USM MBA students and 2 Academicians were selected to read through the
questionnaire and a discussion on their understanding of the questions was held.
Based on their feedback, some questions were restructured (without affecting the
content) and supportive information was added for clarity. An example of this was
for the behavioral intention measurement questions where a few of these respondents
did not understand the meaning of acceptance of GST. Hence, the researcher added
in an informative line explaining that acceptance of GST refers to the level of
agreement of the respondent with GST despite it being a mandatory implementation
and not the act of paying GST.
Following that, two experts in the area of Goods and Services Tax, Partners of
Stephen & Co (A MIA registered Audit & Tax firm were approached to help assess
Section C and Section D on level of tax knowledge. They were able to understand
and were in agreement with the questions asked, thus no changes were made.

68
3.4 Pilot Test
Finally, after fine-tuning of the questionnaire, 32 respondents were selected for the
pilot study based on convenience sampling. Out of the 32 respondents, 29 were USM
students, 1 was an UKM student, 1 was a UM student and 1 was a UPM student.
Besides analyzing their responses for consistency and reliability, the clarity of the
questionnaire was also confirmed with the respondents. All the 32 respondents
confirmed that they fully understood the questions when answering them.
These pilot study respondents were clearly identified and when the questionnaire
was distributed for the collection of actual data, extra precaution was taken to make
sure that the online questionnaire was not attempted by these individuals.
The completed questionnaires were then analyzed using the PLS-SEM version 3 to
obtain the Cronbach Alpha values. These values are indicators of the reliability and
internal consistency of the variables.
The framework will be analyzed in three models for a more systematic study of the
reliability and validity of all latent variables as well as their relationships. With the
theoretical framework drilled down to the antecedents, a more conducive discussion
can be made on the antecedents to attitude and perceived behavioural control. Details
of each model are presented in the table below:

69
Table 3.4 Details of Models for analysis
Model Model Name Latent Variables
1 Antecedents to Attitude to
accept GST
1. Perception of GST fairness
2. Rule Observance Behaviour
3. Attitude to accept GST
2 Antecedents to Perceived
Behavioural Control
1. Self-efficacy
2. Level of GST knowledge
3. Perceived Behavioural Control
3 Whole Model 1. Perception of GST fairness
2. Rule Observance Behaviour
3. Self-efficacy
4. Level of GST knowledge
5. Attitude to accept GST
6. Perceived Behavioural Control
7. Subjective Norms
8. Level of Acceptance
Hence, as there are three models for this study, the Cronbach’s Alpha was measured
for each variable in all three models. The value of the Cronbach’s Alpha has to be
above 0.7 for the variable to be accepted as reliable and consistent. (Hair et al.,
2014).
The table in the next page presents the values for the variables in all three models.

70
Table 3.5 Cronbach’s Alpha for pilot study
Model 1
Variables Cronbach’s Alpha
Attitude 0.926
Perception of Tax Fairness 0.936
Rule Observance Behaviour 0.894
Model 2
Variables Cronbach’s Alpha
Level Of Tax Knowledge 1.000
Self-Efficacy 0.833
Perceived Behavioural Control 0.878
Model 3
Variables Cronbach’s Alpha
Attitude 0.898
Level of Acceptance 0.868
Level of Tax Knowledge 1.000
Perceived Behavioural Control 0.878
Perception of Tax Fairness 0.920
Rule Observance Behaviour 0.848
Self-Efficacy 0.833
Subjective Norms 0.885
As can be seen from the table, all the Cronbach Alpha values are above 0.7
indicating that the variables are consistent and can be reliably used for the purpose of
this study. For Level of Tax Knowledge the Cronbach Alpha is valued at 1 because it
is measured by the total marks obtained through 20 technical and practical questions.
On the other hand, the other variables are measured by 2-6 question items on a
Likert-scale.
Through this pilot study, we will be able to avoid inconvenience to respondents as
well as minimize the removal of questions through factor and reliability analysis of
the actual data collection.

71
3.5 Data Analysis
All data collected has to be analyzed to attain the research objectives, answer the
research questions and accept or reject the hypotheses developed. The data were
analyzed using two statistical softwares; IBM Statistical Package for Social Sciences
(SPSS) version 22 and Smart Partial Least Squares (SmartPLS) in Structural
Equation Modelling (SEM) version 3.0.
SPSS will be used to analyze and summarize the respondents’ demographic profile
whereas SmartPLS will be used to examine and conclude on the hypotheses
developed in the earlier chapter based on the theoretical framework and its variables.
The data will be examined in 3 models as explained in the above section. SPSS is
also used in Chapter 5 to further examine the demographic profiles to investigate
future research potentials.
3.5.1 Structured Equation Modeling (SEM)
SEM is a relatively new approach for testing multivariate models with empirical
data. It incorporates both factor analysis and path analysis indicating that it deals
with concepts and observed variables. The concept of SEM has been widely used for
the past 20 years in anthropology, education, political sciences and economics.
(Wold, 1980; Fornell&Bookstein, 1982) SEM enables the integration of both
observed variables, also known as indicators, and latent variables, also known as
constructs. Constructs cannot be measured directly and has to be measured through

72
one or more observed variables or indicators. (Rosipal & Kramer, 2006) In a
nutshell, as a second generation data analysis technique, SEM allows researchers to
develop unobserved Latent Variables, model relationships among Latent Variables,
identify observed variables for each latent variable and statistically test theoretical
assumptions against empirical data (Hair et al., 2014)
3.5.2 Covariance-based SEM (CBSEM) against Variance-based SEM with
Partial Least Squares (PLS)
Covariance-based SEM (CBSEM) is the most well-known SEM technique. This
technique aims to minimize the differences between the covariances between the
samples and the theoretical model. The statistical objective here is to obtain
goodness-of-fit but this on its own does not imply a good model. (Rosipal& Kramer,
2006)
In comparison, the variance-based partial least squares technique aims at obtaining
determinate values of the latent variables for analytical purposes. Using the scores of
all latent variables, the PLS algorithm maximizes the proportion of variance in the
dependent variable that is explained by the predictor variables. Hence, this indicates
that VB-SEM with PLS is developed to maximize prediction and not goodness-of-
fit. (Rosipal & Kramer, 2006)
For this study, the software of SmartPLS 3.0 is used to apply variance-based SEM
with PLS analysis. With the collected data, the PLS algorithm is employed to

73
estimate the path coefficients and other relevant parameters in order to maximize
explained variance or minimize unexplained variances. (Hair et al., 2014) Following
that, bootstrapping is conducted to examine the coefficient for the significance of the
path modelling. In this step, random samples with replacement are extracted from the
data and used to estimate the path model numerous times under slightly changed data
patterns. This resampling approach is used to approximate the t-value which is
highly relevant information to the study. (Hair et al., 2014) Significance of t-values
is as depicted:
i) t-value of 1.645 is significant at a significance level of 5% (α = 0.05, one-
tailed)
ii) t-value of 2.33 is significant at a significance level of 1% (α = 0.01, one-
tailed)
One-tailed test is used for this study as the hypotheses are all directional indicating
clearly that is a positive relationship between the antecedent variable and the
independent variable as well as between the independent variable and the dependent
variable.
Amongst the justifications of using VB-SEM with PLS for this research are (Wold,
1980; Fornell& Bookstein, 1982):
i) The model of this study has formative constructs
ii) The data is not normally distributed
iii) This is an exploratory study
74
iv) The model is based wholly on one theory, the Theory of Planned Behaviour
3.5.3 Statistical Analysis
IBM SPSS Statistics version 22 is used here to assist with the analysis of other data.
It is a comprehensive statistical tool for analyzing data in order to generate reports,
charts, trends, plots and statistic which are relevant to the user. It is highly capable of
handling a large amount of data and transactions making it a common statistical tool
in the practical world. (Hair et al., 2014) In this research, SPSS is used for the
demographic analysis.
3.5.4 Demographic Analysis
An analysis on the demographic characteristics of the respondents is conducted. The
summary of the analysis enables the researcher to be aware of the proportion of
respondents in the various demographic categories, such as age, mode of study,
institute of education, position and income level.
3.5.5 Common Method Bias
Common method bias takes place when measurements of all latent variables;
antecedent, independent and dependent are gathered from different sources.
Common method bias can occur when using similar scales with the same number of
response options. (Podsakoff et al., 2003) Variance resulting from the measurement
75
method will lead to systematic errors and distort the relationship amongst the
theoretical constructs (Chandra et al., 2011). Common method biasness is possible in
this research as all variables are measured in one self-administered questionnaire
conducted during the same period.
Principal Component Analysis is conducted on all question items of the variables in
the research under the Harman’s single-factor test of common method biasness. This
analysis will enable the researcher to determine if any one general factor explains
majority of the variance in the model (Podsakoff et al., 2003). Common method bias
is not present when the first component accounts for less than 50% of the total
variance and the last, largest component accounts for more than 50% of the total
variance. When common method bias is not present, it indicates that the
questionnaire is authentic, scientific and there is no ambiguity in the questionnaire
3.5.6 Descriptive Analysis
Before proceeding to the in-depth analysis of the relationship between the constructs,
descriptive analysis is conducted. Through descriptive analysis, the mean and
standard deviation of all the questions can be obtained. This will enable the
researcher to understand the overall response of the respondents towards the various
question items. (Podsakoff et al., 2003) For the purpose of this study, this analysis
will answer the first research question on the acceptance level amongst consumers
with GST.

76
Correlation between the various constructs was calculated to determine if
multicollinearity exists. Multicollinearity is present when two or more predictor
variables are highly correlated which will affect the accuracy of the model.
(Podsakoff et al., 2003)
3.5.7 Goodness of Data Test
The goodness of the data is determined by examining the data for reliability and
validity. A measure may be correct but not consistent which is why both reliability
and validity testing must be conducted. The quality of the results of this study is
highly influenced by the results of these tests. (Sekaran, 2000)
3.5.8 Factor Analysis
Factor Analysis is conducted to examine and outline the underlying structure
amongst the constructs in the analysis. It is a data reduction method where an
attempt is taken to reduce the number of original factors to a smaller set of factors
that measure the construct without loss of information (Hair et al., 2010) Factor
Analysis is conducted for the following reasons:
1) To determine the correlation between the many questions used to measure a
variable. The more correlated the questions are, the better they measure the
variable together.

77
2) It is a dimension reduction method in which it removes questions in the
variable measurement which is not appropriate.
3) It is used to measure the validity of subjective measurement, latent variables.
There is confirmatory factor analysis (CFA) and exploratory factor analysis. CFA is
used to validate the factor structure of a set of observed variables. The correlations
between the factors are validated to ensure that the constructs are conforming to the
pre-established theory. Confirmatory Factor Analysis leads to the validity testing of
the constructs. (Hair et al., 2010)
3.5.9 Validity Analysis
Validity is defined as the capability of a scale to measure what it is supposed to
measure (Zikmund, 2003). It is important as mentioned in the goodness of data
section to ensure the quality of the results obtained from these measurements. The
construct validity is examined to determine the quality of the results achieved from
the measurements undertaken fitting the theory presented in the research. (Sekaran,
2000) The management theory selected should support the framework. Construct
validity is examined through convergent validity and discriminant validity.
Convergent validity tests if the measures of the same construct are highly correlated.
This is done by looking at the main outer loadings of each question item within the
construct, the Composite reliability and the Average Variance Extracted (AVE)
value. The main outer loadings and AVE must be above 0.5 whilst the composite
reliability value must be higher than 0.7 in order to confirm the presence of
convergent validity. (Hair et al., 2014)

78
Discriminant validity concludes that the measures of a construct are not highly
correlated with other constructs. It is employed to ensure that the constructs which
are not supposed to be related to each other are in fact not related. (Hair et al., 2014)
Discriminant validity is examined through a construct where none of the inter-
construct correlations are greater than the square root value of the AVE of the
constructs. The discriminant validity table can be seen in Chapter Four. (Fornell &
Laracker, 1981; Hair et al., 2014)
3.5.10 Reliability Analysis
Reliability is the extent to which measures are influenced by random error and
produce consistent results. (Zikmund, 2003) Reliability is also referred to as internal
consistency within the question items of the variables. Higher reliability values
indicate that the question items are consistently measuring the same latent concept.
(Shin, Collier & Ilson, 2000)
Reliability is measured using Cronbach’s Alpha which is designed to examine the
average correlation of question items to assess its reliability. (Santos, 1999)
Composite reliability also works on the same concept as Cronbach’s Alpha. For both
Cronbach’s Alpha and Composite reliability, the value has to be more than 0.7 in
order for the scale to be maintained.

79
3.5.11 Goodness-of-Fit (GoF)
The Goodness-of-Fit (GoF) statistical model examines how well the model fits into a
set of constructs. (Tenenhaus, Vinzi, Chatelin&Lauro, 2005; Maydeu-Olivares &
Garcia-Forero, 2010) It is determined through the following formula:
GoF= √ (AVE x R2)
The GoF value is between 0 and 1 and the higher the value, the more accurate the
path model estimates would be. (Abd-El-Fattah &Fakhroo, 2012) GoF values can be
used to determined effect sizes and any value above 0.36 has a large effect size.
(Cohen,1988: Abd-El-Fattah & Fakhroo,2012)
3.6 Summary
In summary, this chapter explained that this is a quantitative research and that the
research instrument is a self-administered online questionnaire. The unit of analysis
of this research is Malaysian Masters in Business Administration (MBA) students
from USM, UKM, UM and UPM.
The sample size has to be a minimum of 80 respondents and each section of the
questionnaire and its measurement operationalization was discussed. Sources of the
question items of each construct were also discussed. The pilot study included clarity
testing, expert’s review and reliability testing on responses by 32 respondents.

80
The data collected will be analyzed using IBM SPSS Statistics and SmartPLS
version 3.0 (VB-SEM with PLS) in 3 models. These two statistical tools were
examined and the various analyses that will be conducted were discussed. Amongst
them were demographic analysis, descriptive analysis, common method bias, validity
testing, reliability testing and goodness-of-fit measurement. The results of the
abovementioned analyses will be presented in the next chapter.

81
CHAPTER FOUR
RESULTS
4.0 Introduction
This chapter sets out to present the results of data analysis. A comprehensive data
analysis is performed in order to determine the dimensionality of items under the
respective constructs, the reliability of the instruments, the measure of fitness for the
proposed model, the goodness of a fitted model, and the appropriate statistical
analysis procedures to address the research questions as well as to test the
corresponding research hypotheses. Hence, the organization of this chapter is as
follows:
1. The demographic variables are examined to provide a clear description of the
sample characteristics.
2. To measure the goodness of data, validity and reliability testing is conducted.
3. Validity testing involved Confirmatory Factor Analysis where convergent
and discriminant validity is tested. The required data for this analysis can be
obtained from the PLS Algorithm step in SmartPLS 3.0
4. Structural Equation Modeling (SEM) statistical technique will be used to test
the hypotheses developed from the theoretical framework.
5. The Global fit or Goodness of fit value calculated to confirm suitability of
model.

82
4.1 Response Rate
Table 4.1: Summary on the Response Rate
University Number of MBA
students in batch
Number of
respondents
Unusable Usable
responses
Response
Rate
USM 212 94 8 86 40.57%
UPM 145 53 2 51 35.17%
UM 194 46 3 43 22.16%
UKM 200 51 3 48 24.00%
TOTAL 751 244 16 228 30.35%
As mentioned in the third chapter, the unit of analysis of this study is Malaysian
consumers pursuing their Masters in Business Administration in four universities;
USM, UPM, UKM and UM. The researcher had sent to one contact in UM, UKM as
well as UPM and 200 contacts in USM. These contacts were then requested to send
the link of the online questionnaire to their batch mates. Hence the response rate was
determined in reference to the total number of MBA batch mates for the contacts in
each university. Table 4.1 has concluded that the total response rate is 30.35%
whilst a breakdown displays that USM had 40.57% response rate, UPM had 35.17%,
UM had 22.16% and UKM had 24%. This is clearly explained by the fact that the
researcher had more convenient access to USM students as compared to the other
four universities.

83
4.2 Profile of Respondents
This section displays a summary of the respondents and their socio-demographic
characteristics. The unit of analysis of this study is MBA students from USM, UPM,
UKM and UM.
Table 4.2: Socio-Demographic table – Respondent’s profile
Demographic Categories No. of
Respondents
Percentage
(%)
Age
18-25 9 3.9
26-40 210 92.1
41-60 9 3.9
Total 228 100.0
Gender
Male 106 46.5
Female 122 53.5
Total 228 100.0
Mode
Full Time 32 14.0
Part Time 196 86.0
Total 228 100.0
Institution
Universiti Sains Malaysia 86 37.7
Universiti Kebangsaan
Malaysia 48 21.1
Universiti Malaya 43 18.9
Universiti Putra Malaysia 51 22.4
Total 228 100.0

84
Table 4.2: Socio-Demographic table – Respondent’s profile (continued)
Demographic Categories No. of Respondents Percentage (%)
Employment Not Applicable (Full time) 32 14.0
Self-Employed 8 3.5
Owner of Business 5 2.2
Working in an
Organization 181 79.4
Unemployed 2 9
Total 228 100.0
Position
Not Applicable (Full time) 32 13.6
Top Management 3 1.3
Finance/ Accounts
Manager 7 3.5
Marketing/ Sales Manager 24 10.5
Technical/ Operations
Manager 22 9.6
Others: Executives 92 40.4
Others: Teachers 7 3.1
Others: Professionals 41 18%
Total 228 100.0
Income
Not Applicable (Full time) 32 13.6
RM 1000 - RM 5000 126 55.3
RM 5001- RM 10000 34 15.4
RM 10001 - RM 15000 33 14.5
> RM 15000 3 1.3
Total 228 100.0
Table 4.2 provides a clear insight of the respondents based on the demographic
questions posed in the questionnaire. Three filter questions were in place to ensure
the respondents match the unit of analysis. The questions were:
1) Question 3 – Nationality
2) Question4 – Current Level of Education

85
3) Question 5 – Please indicate the programme you are enrolled in
Only respondents who were Malaysian and currently pursuing Postgraduate
education in Masters of Business Administration were accepted.
From the table, we can notice that most of the respondents are between the ages of
26 to 40. This is crucial information as we are able to first understand the age group
which is pursuing MBA in this country. More importantly, it is consumers within
this age group that are highly resistant against GST as depicted in Merdeka Centre
Survey. Hence, it is interesting to be able to gather their current, up-to-date opinion
on the same matter.
We can also gather that we have a slightly higher number of female respondents than
male. The respondents also comprise more of part time students are mostly in other
positions besides the ones mentioned in the position list. Amongst the responses
under the category ‘Others’ were technical executives, human resource executives,
engineers, IT executives, pharmacists, teachers and auditors. Higher number of
respondents fell in the RM 1000- RM 5000 income level category.
The findings on the demographic profiles further enhance our study because majority
of our respondents can be categorized as the middle-income group based on their
income level and employment status as well as position. Protests by the general
public and many articles pertaining GST have expressed the concern that the middle-
income group will be the one hit the worst by GST in Malaysia, at least in early
stages. (Zamhari, 2014) With respondents loading on this middle-income group, the

86
results of this research would give us a crystal clear understanding of their opinions
and thoughts in relation to GST making the findings of this research very significant
and applicable.
4.3 Descriptive Statistics and Multicollinearity
Table 4.3 Descriptive Statistics and Correlation Matrix (n=228)
Correlations
Variable
Scale Mean
Standard
Deviation LTK
Ave
ROB
Ave
PTF
Ave
ATT
Ave
SN
AveS
E
Ave
PBC
Ave
LA
VIF
LTK 0-100 76.34 14.33 1 1.16
Ave ROB 1-5 3.66 0.70 .190
** 1
1.41
Ave PTF 1-5 2.86 0.84 .209
**
.449*
*
1 1.95
Ave ATT 1-5 3.14 0.95 .306
**
.500*
*
.637**
1
3.50
Ave SN 1-5 3.00 0.70 .106
.495*
*
.630**
.676
** 1
2.53
Ave SE 1-5 3.24 0.72 .041
.233*
*
.302**
.475
**
.270**
1
1.43
Ave PBC 1-5 2.91 1.02 .143
*
.437*
*
.605**
.783
**
.706**
.488*
*
1 3.55
AveLA 1-5 2.94 1.08
.375*
*
.526*
*
.651**
.824*
*
.64
2**
.371**
.756*
*
1
**. Correlation is significant at the 0.01 level (1-tailed).
*. Correlation is significant at the 0.05 level (1-tailed).
Table 4.3 shows descriptive information on all the latent variables of this research
model. This descriptive information was gathered using the average values of the
latent variables explaining why the variables have the prefix Ave before their
abbreviation, for instance; AveATT which stands for Average Attitude. The
descriptive information includes the scale on which the variable was measured, the
mean of the responses for each variable based on the measurement scale and the
standard deviation. The correlation matrix is also attached followed by the VIF
(Variation Inflation Factor) values.

87
The mean of responses for Level of GST knowledge was 76.34 on a scale of 1 to
100. As the level of tax knowledge is being measured by the score the respondent
obtains out of 20 questions, this mean indicates that the level of tax knowledge
amongst the respondents is high. This confirms the assumption held earlier that
MBA students are expected to have a sound basic knowledge of the Goods and
Services Tax. The standard deviation of 14.33 is small as it is less than 20% of the
maximum point of the scale. It implies that the respondents are agreeing amongst
themselves, confirming once again that MBA students are in fact, in general,
knowledgeable in the technical and practical aspects of GST.
For Rule Observance Behaviour, its mean is 3.66 indicating that the respondents are
those who have the higher tendency to observe and obey rules, believing that rules
will lead the improvement. The standard deviation is low at 0.70 indicating a high
level of agreement in the respondents’ responses.
For Perception of GST Fairness, the mean is quite low at 2.86 indicating
disagreement amongst the respondents. Hence, it can be concluded that the
respondents do not view the Goods and Services taxation system and the
management of taxes collected as a fair system. The standard deviation of 0.84,
being below 1, once again indicates that the respondents are in consensus of this
opinion.
For Attitude, the mean of 3.14 indicates borderline positive feelings amongst
respondents with reference to GST. As an overview, the respondents are only in

88
slight agreement that GST is a wise decision and they feel slightly positive about it.
The standard deviation of 0.95, although being slightly high, still indicates that there
are no significant variations in the responses of participants.
The subjective norms mean is at 3.00 indicating absolute neutrality. Respondents are
neutral on perceptions that their peers and family members would affect their own
views and decisions. This is highly appropriate to the respondents of this study as
they are MBA students who are believed to have a higher intellect hence not relying
on the opinions of others to make decisions. The standard deviation of 0.70 reiterates
that the respondents are collectively disagreeing on this matter.
The mean for Self-Efficacy is 3.24 which indicates that the respondents have only
slightly high levels of self-efficacy. The respondents are not very confident that they
have the required capabilities to manage through the GST. A low standard deviation
for Self-Efficacy confirms that the respondents are agreeing amongst themselves.
The mean for Perceived Behavioural Control is slightly low at 2.91. This indicates
that the respondents feel that there are internal and external constraints on them with
the implementation of GST. A higher standard deviation of 1.02 for PBC displays
that there were significant variations between opinions and that this opinion was not
generalized.
Finally, the mean of Level of Acceptance answers our first Research Question on the
current level of acceptance of GST amongst consumers. Respondents have tilted
towards the disagreement of accepting GST with the mean of 2.94. However the

89
standard deviation is above 1 at 1.08 indicating that there are significant variations
between opinions.
Moving on to the correlation matrix, it is vital in determining the correlation between
the latent variables to ensure multicollinearity does not exist. Multicollinearity will
affect the accuracy of the model and its measurements. A high correlation should
only be present between independent variables and dependent variable and in this
case, antecedent variables and independent variables. This is because a high
correlation between predictor and dependent variables strengthens the relationship
and the pathway between them. From the correlation matrix, it is clear that Attitude
has the highest positively significant correlation with Level of Acceptance of GST (r
= 0.824, p<0.01) followed by Perceived Behavorial Control (r = 0.756, p<0.01).
However, predictor variables should have low correlations in order to eliminate the
multicollinearity effect. The common threshold is that the correlation value between
two predictor variables should not exceed 0.7. From the table above, Attitude and
Subjective norms have a high correlation with Perceived behavioural control, 0.783
and 0.706 respectively. In order to test for multicollinearity, the Variance Inflation
Factoris is tested for the predictor variables. A VIF value of less than five eliminates
any possible existence of multicollinearity. (Groebner et al, 2014) As can be seen
from the table, all VIF values are below 5 confirming that multicollinearity does not
exist in the data set of this research.

90
4.4. Common Method Bias using Principal Component Analysis
Using the principal component analysis, the authenticity of the data is examined.
This test must be conducted in view of the fact that the questionnaire is constructed
based on inputs from the literature of a variety of authors. According to (Podsakof et
al., 2003), Common method bias (CMB) is the bias of measurement error variance
that can affect the validity of relationships assumed between the indicators of
different variables. Harman’s one-factor (or single-factor) test is used here by
running factor analysis with all the question items of the model.
In the current study, 30 components were extracted for 30 question items of the
model using principal component analysis in the first factor run (Appendix H-2).
The indicator on non-CMB is the first and last value of the Rotation Sums of
Squared Loadings Cumulative % in Table 4.4. The first component should be less
than 50% and the last component should be more than 50%. (Podsakof et al., 2003)
In this case, the first seven components significantly explain the variance in the data
and have Eigen value of more than one which is why the cumulative loadings stop at
7th
component. To add on, component 1 is 24.022% which is less than 50% and the
last component, component 7 is 76.110%. These results confirm the authenticity of
the data and that it is scientific in such a manner that the respondents fully
understand what the question is trying to convey.

91
4.5 Data analysis and results
4.5.1 Goodness of measures
The two important criteria used for testing goodness of measures are validity and
reliability. According to Sekaran and Bougie (2010), reliability is an assessment of
how dependable weighing instrument measures any concept it is weighing,
meanwhile validity is an examination of how fit an equipment which is built
measures the certain concept it is intended to weigh. As this study consists of 3
models, the validity and the reliability of each model will be examined separately.
Table 4.4 Total Variance Explained
Component
Initial Eigenvalues
Extraction Sums of Squared
Loadings
Rotation Sums of Squared
Loadings
Total
% of
Variance
Cumulative
% Total
% of
Variance
Cumulative
% Total
% of
Variance
Cumulative
%
1 12.941 41.746 41.746 12.941 41.746 41.746 7.447 24.022 24.022
2 2.671 8.616 50.362 2.671 8.616 50.362 4.108 13.251 37.273
3 2.342 7.554 57.916 2.342 7.554 57.916 3.776 12.182 49.455
4 1.871 6.037 63.953 1.871 6.037 63.953 3.061 9.875 59.330
5 1.491 4.809 68.762 1.491 4.809 68.762 1.996 6.439 65.769
6 1.222 3.941 72.703 1.222 3.941 72.703 1.911 6.164 71.932
7 1.056 3.407 76.110 1.056 3.407 76.110 1.295 4.177 76.110
Extraction Method: Principal Component Analysis.

92
4.5.2 Pathway of Each Model Construct
MODEL 1
Figure 4.1: PLS Pathway for Model 1
MODEL 2
Figure 4.2 : PLS Pathway for Model 2

93
MODEL 3
Figure 4.3: PLS Pathway for Model 3
4.5.3 Construct validity
Construct validity shows on how the results acquired from the use of the measure
fit the theories around which the test is developed (Sekaran&Bougie, 2010).
Construct validity is examined through two methods; convergent and discriminant
validity.
4.5.4 Convergent validity
Next, the convergent validity was tested which is the degree to which multiple items
which evaluate the same concept are agreeable. Hair et al. (2010) suggested that the
94
factor loadings, composite reliability and average variance extracted were used to
examine convergence validity. A model with main loadings above 0.5, composite
reliability of above 0.7 and Average Variance Extracted (AVE) of above 0.5 indicate
a highly valid model. Composite reliability values depict the degree to which the
construct indicators denote the variable (Hair et al., 2010). Composite reliability acts
as a proxy to Cronbach’s alpha in order to test the internal consistency of these
variables. The average variance extracted (AVE) weighs the variance held by the
indicators relative to measurement error, and it should be higher than 0.50 to endorse
using a construct (Barclay et al., 1995). These values will be displayed in the
measurement model table which is obtained after running the PLS Algorithm in
SmartPLS 3.0.
4.5.5 β value and R Square
The β value appears on the pathway between the antecedent variables to independent
variable or independent variables to dependent variable. This β value indicates the
strength of the relationship of the two variables being connected by the pathway. The
higher the β value, more weightage is given to the relationship.
PLS provided statistics indicating how well the model predicted the relationships
stated in the hypothesis. PLS also provided an indication of the predictive power of
this research model, or the squared multiple correlation (R2) value for each
endogenous variable. (Rosipal& Kramer, 2006) The R2 value found in PLS is
equivalent to the R2 value in a multiple regression model, which represents the

95
amount of variance explained by the independent variables confined within the
model (Barclay et al., 1995). It is also known as the coefficient of determination with
a higher value indicating the model to have a higher predictive power.
4.5.6 Discriminant validity
Discriminant validity signifies the degree to which one construct is dissimilar from
all other constructs in the instrument. The method for examining adequate
discriminant validity is in line with the Fornell-Larcker criterion. (Fornell&Larcker,
1981) Discriminant validity was assessed by ensuring that the diagonal elements
were significantly higher than the off-diagonal values in the corresponding rows and
columns. Items should load more strongly on their own constructs in the model, and
the average variance shared between each construct and its measures should be
greater than the variance shared between the construct and other constructs (Hair et
al., 2014). Discriminant validity is adequate when constructs have an AVE loading
greater than 0.5, which means that at least fifty percent of measurement variance was
captured by the construct (Hair et al., 2014). In the matrix, the diagonal elements in
bold are the square root of the AVE and the off- diagonal elements are the
correlations between constructs.
4.5.7 SEM Model
This model obtained from the bootstrapping function of SmartPLS provides the beta-
coefficient values, standard error values, which in turn will provide the t-values and

96
significance level. These values are highly significant for testing and supporting the
hypotheses developed. The threshold for t-values and its significance is as follows:
iii) t-value of 1.645 is significant at a significance level of 5% (α = 0.05, one-
tailed)
iv) t-value of 2.33 is significant at a significance level of 1% (α = 0.01, one-
tailed)
4.5.8 Results of each model
For each model we will present the findings for Convergent Validity, Discriminant
Validity, R square, Reliability and the Hypothesis testing results.

97
(i) Model 1
TABLE 4.5 Measurement model of VB-SEM – Model 1
MODEL
VARIABLE
LATENT
VARIABLE
INDICATOR
QUESTION
ITEMS
MAIN
LOADING
COMPOSITE
RELIABILITY AVE
IV1
RULE
OBSERVANCE
BEHAVIOUR
ROB1 0.897
0.9283 0.7220
ROB2 0.905
ROB3 0.825
ROB4 0.808
ROB5 0.809
IV2
PERCEPTION
OF GST
FAIRNESS
PTF1 0.897
0.8842 0.5708
PTF2 0.837
PTF3 0.501
PT4 0.918
PT5 0.689
PT6 0.592
DV ATTITUDE
ATT1 0.932
0.9369 0.7493
ATT2 0.925
ATT3 0.752
ATT4 0.819
ATT5 0.886
This table displays that the main loading for all question items for the variables in
model 1 is above 0.5 allowing the question items to be retained. The composite
reliability for all three variables are more than 0.7 and the AVE value is more than
0.5. These results confirm that this model has convergent validity as well as internal
consistency.

98
TABLE 4.6: Discriminant Validity – Model 1
Similar latent variables should have higher correlation whilst different latent
variables should have less correlation. It is a symmetrical table and hence will only
either have above or below value. The measurement model validated adequate
discriminate validity, since the diagonal loadings were significantly greater than the
off-diagonal loadings in the corresponding rows and columns.
Figure 4.4: PLS output for Beta-value and R square value (Model 1)
Latent
Variable ATT PTF ROB
ATT 0.866
PTF 0.668 0.756
ROB 0.510 0.462 0.850

99
The β value indicates the strength between the two latent variables, both here show
significant β values as they are above 0.2. (Hair et al., 2010) The R square is 49.9%
which is significant. 49.9% of changes in the attitude of the respondent is explained
by their rule observance behavior and their perception of tax fairness. .
Table 4.7 Summary of PLS Results – Direct Effects (Model 1)
As the t-statistic values for both Hypothesis 1 and 2 are 3.853 and 10.280
respectively, the hypotheses are significant at 1% significance level. Concurrently,
the p value for both hypotheses is 0.000.
Hypothesis Path β value Standard Error t Statistics p Value Decision
1 ROB -> ATT 0.256 0.067 3.853 0.000 Supported
2 PTF -> ATT 0.550 0.054 10.280 0.000 Supported

100
Figure 4.5: PLS output for testing population regression coefficients (beta values) –
Model 1

101
(ii) Model 2
TABLE 4.8 Measurement model of VB-SEM – Model 2
MODEL
VARIABLE LATENT VARIABLE
INDICATOR
QUESTION
ITEMS
MAIN
LOADING
COMPOSITE
RELIABILITY AVE
IV1 SELF-EFFICACY
SE1 0.867
0.941 0.699 SE2 0.824
SE3 0.854
SE4 0.799
IV2 LEVEL OF TAX
KNOWLEDGE NOT APPLICABLE 1.000 1.000
DV
PERCEIVED
BEHAVIOURAL
CONTROL
PBC1 0.950
0.903 0.842 PBC2 0.870
PBC3 0.931
This table displays that the main loading for all question items for the variables in
model 2 is above 0.5 allowing the question items to be retained. The composite
reliability for all three variables are more than 0.7 and the AVE value is more than
0.5. These results confirm that this model has convergent validity as well as internal
consistency. For Level of Tax knowledge, the values are not applicable as it is
measured by one absolute value and not a series of question items.
TABLE 4.9: Discriminant Validity- Model 2
Latent
Variable LTK PBC SE
LTK 1.000
PBC 0.151 0.917
SE 0.043 0.514 0.836

102
The measurement model confirmed adequate discriminate validity, since the
diagonal loadings were significantly greater than the off-diagonal loadings in the
corresponding rows and columns.
Figure 4.6: PLS output for Beta-value and R square value (Model 2)
The β value indicates the strength between the two latent variables. The value
between self-efficacy and perceived behavioral control is more than 0.2 indicating
significant strength whilst tax knowledge and perceived behavioral control is less
than 0.2 indicating less significant relationship (Hair et al., 2010)
The R square is 28.1% which is indicates that 28.1% of changes in the perceived
behavioural control of the respondent is explained by their self-efficacy and level of
tax knowledge.

103
Table 4.10 Summary of PLS Results – Direct Effects (Model 2)
Hypothesis 3 has a t-statistic value of 2.272 which is more than 1.65 but less than
2.33 making the hypothesis supported at the 5% significance level. Hypothesis 4 has
a t-statistic value of 10.117 which is way above 2.33 confirming that the hypothesis
is supported at the 1% significance level .
Figure 4.7: PLS Output for testing population regression coefficients (Model 2)
Hypothesis Path β value Standard Error t Statistics p Value Decision
3 LTK -> PBC 0.129 0.057 2.272 0.024 Supported
4 SE -> PBC 0.509 0.050 10.117 0.000 Supported
104
(iii)Model 3
Table 4.11 displays that the main loading for all question items for the variables in
model 3 is above 0.5 allowing the question items to be retained. The composite
reliability for all eight variables; antecedent, independent and dependent are more
than 0.7 and the AVE value is more than 0.5. These results confirm that this model
has convergent validity as well as internal consistency. For Level of Tax knowledge,
the values are not applicable as it is measured by one absolute value and not a series
of question items.
One question item was dropped, which was SN 5 for Subjective norms as it had a
main loading of 0.482 which was less than the cut-off value of 0.5.

105
MODEL
VARIABLE LATENT VARIABLE
INDICATOR
QUESTION ITEMS MAIN LOADING
COMPOSITE
RELIABILITY AVE
IV1 ATTITUDE
ATT1 0.931
0.937 0.750
ATT2 0.923
ATT3 0.748
ATT4 0.825
ATT5 0.889
IV2 SUBJECTIVE NORMS
SN1 0.850
0.856 0.602 SN2 0.676
SN3 0.669
SN4 0.884
IV3 PERCEIVED BEHAVIOURAL
CONTROL
PBC1 0.950
0.941 0.842 PBC2 0.873
PBC3 0.929
DV LEVEL OF ACCEPTANCE OF GST LA1 0.961
0.954 0.911 LA2 0.948
IV1 SELF-EFFICACY
SE1 0.867
0.941 0.699 SE2 0.824
SE3 0.854
SE4 0.799
TABLE 4.11 Measurement model of VB-SEM – Model 3

106
Table 4.11 Measurement Model of VB-SEM – Model 3 (continued)
AV2
PERCEPTION OF TAX FAIRNESS
PTF1 0.897
0.8842 0.5708
PTF2 0.837
PTF3 0.501
PT4 0.918
PT5 0.689
PT6 0.592
AV3 SELF-EFFICACY
SE1 0.867 0.941 0.699
SE2 0.824
SE3 0.854
SE4 0.799
AV4 LEVEL OF TAX KNOWLEDGE NOT APPLICABLE 1.000 1.000
AV1 RULE OBSERVANCE BEHAVIOUR
ROB1 0.897
0.9283 0.7220
ROB2 0.905
ROB3 0.825
ROB4 0.808
ROB5 0.809

107
Table 4.12 Discriminant Validity – Model 3
The measurement model confirmed adequate discriminate validity, since the
diagonal loadings were significantly greater than the off-diagonal loadings in the
corresponding rows and columns
LATENT VARIABLE ATT LA LTK PBC PTF ROB SE SN
ATT 0.866
LA 0.833 0.955
LTK 0.311 0.372 1.000
PBC 0.793 0.772 0.150 0.918
PTF 0.666 0.666 0.216 0.607 0.756
ROB 0.509 0.533 0.192 0.452 0.461 0.850
SE 0.486 0.390 0.043 0.513 0.319 0.249 0.836
SN 0.698 0.683 0.127 0.757 0.619 0.478 0.304 0.776

108
Figure 4.8: PLS output for Beta-value and R square value (Model 3)
The Beta value indicates the strength between the two latent variables that are
connected through a path. The beta value here for all pathways are significant as a
common indicator of significance is a value of 0.2 and above. (Hair et al., 2010)
The R square is 73.2% which is very significant as it implies that 73.2% of changes
in the respondent’s level of acceptance of GST is explained by their attitude,
subjective norms and perceived behavioural control with the antecedent variables of
perception of tax fairness, rule observance behaviour, self-efficacy and level of tax
knowledge present. This is most probably the case because the Theory of Planned
Behaviour which was the theory supporting the framework of this model is a well-
LA

109
established and concrete theory applicable in any context, even in such an
unexplored context of Malaysian GST acceptance.
Table 4.13 Summary of PLS Results – Direct Effects (Model 3)
Hypotheses 5 and 7 both have t-statistic values which are way above 2.33 which
indicate that both the hypotheses are supported at 1% significane level. The p value
is in fact 0.000 and 0.001 respectively, concurring the significance level stated.
However, Hypotheses 6 is not supported as the t-statistic value is below 1.65 which
is the minimum threshold.
Figure 4.9: PLS Output for testing population regression coefficients – Model 3
Hypothesis Path Beta value Standard Error t Statistics p Value Decision
5 ATT -> LA 0.570 0.061 9.379 0.000 Supported
6 SN -> LA 0.100 0.062 1.625 0.105 Not Supported
7 PBC -> LA 0.243 0.076 3.207 0.001 Supported
LA

110
4.5.9 Reliability Analysis
Cronbach’s Alpha has been widely used to measure the internal consistency of
variables in a model. The following tables have summarized the Cronbach Alpha
values for each variable. All the values are above the threshold value of 0.7
(Nunnally and Berstein, 1994). This confirms that all measurements of the variables
are reliable and have significant internal consistency.
Table 4.14: Cronbach’s Alpha and Composite Reliability for Model 1
Latent Variable Cronbach’s Alpha Number of indicator
items
Attitude 0.915 5
Perception of Tax Fairness 0.839 6
Rule Observance
Behaviour 0.903 5
Table 4.15: Cronbach’s Alpha and Composite Reliability for Model 2
Latent Variable Cronbach’s Alpha Number of indicator
items
Level of Tax Knowledge Not applicable 20
Perceived Behavioral
Control 0.907 3
Self-Efficacy 0.858 4
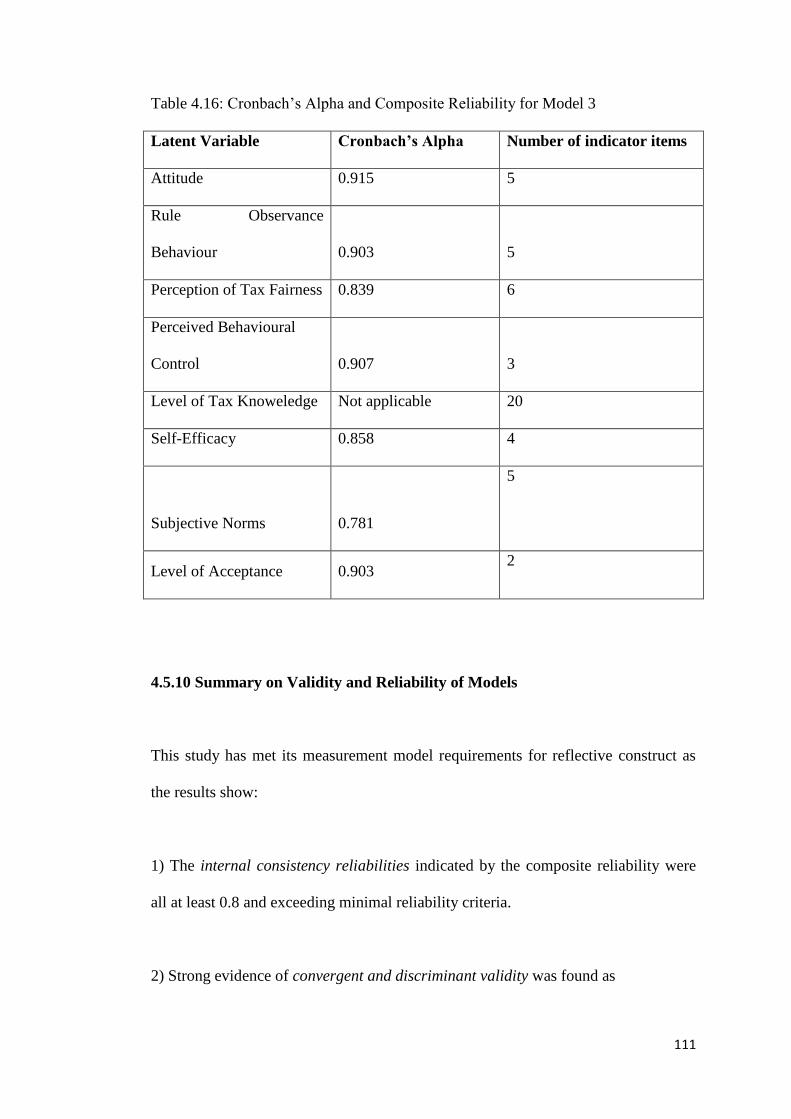
111
Table 4.16: Cronbach’s Alpha and Composite Reliability for Model 3
Latent Variable Cronbach’s Alpha Number of indicator items
Attitude 0.915 5
Rule Observance
Behaviour 0.903 5
Perception of Tax Fairness 0.839 6
Perceived Behavioural
Control 0.907 3
Level of Tax Knoweledge Not applicable 20
Self-Efficacy 0.858 4
Subjective Norms 0.781
5
Level of Acceptance 0.903 2
4.5.10 Summary on Validity and Reliability of Models
This study has met its measurement model requirements for reflective construct as
the results show:
1) The internal consistency reliabilities indicated by the composite reliability were
all at least 0.8 and exceeding minimal reliability criteria.
2) Strong evidence of convergent and discriminant validity was found as

112
a) the square root of the average variance extracted for each construct was greater
than 0.70 (i.e., AVE > 0.50) and greater than the correlation between that construct
and other constructs (without exception)
b) the factor structure matrix shows that all items exhibited high loadings (>0.50) on
their perspective constructs and no items loaded higher on constructs they were not
intended to measure.
Therefore, it was determined that this instrument had achieved acceptable levels of
validity and reliability. Overall, the measurement instruments exhibited sufficiently
properties to support valid testing of the proposed structural model.
Following that, the structural model was assessed and the hypotheses were tested
based on the t-values.

113
4.5.11 Summary of Hypothesis Testing
4.17 Summary of Hypothesis Testing
Hypothesis Statement Results
1 Rule Observance Behavior will positively
affect attitude to accept GST
Supported
2 Perception of GST fairness will positively
influence attitude to accept GST
Supported
3 Level of GST knowledge positively
influences perceived behavioral control
Supported
4 Self-efficacy will positively influence
perceived behavioral control
Supported
5 Attitudes towards GST are positively
related to level of acceptance of GST.
Supported
6 Subjective norms are positively related to
level of acceptance of GST
Not Supported
7 Perceived behavioral control is positively
related to the level of acceptance of GST
Supported

114
4.5.12 Goodness-of-Fit
The Goodness of Fit (GoF) for the present research is determined as below:
GoF = √ ( AVE x R2
)
This measurement will be done for all three models. The AVE values can be
obtained from the Measurement model table. The R2 value can be obtained from the
PLS output image.
Model 1 – Antecedent Variables to Attitude
Average AVE = (0.7220+0.5708+0.7493) / 3 = 0.6807
R2 = 0.499
GoF = √ ( 0.6807 x 0.499)
= 0.5828
Model 2 – Antecedent Variables to Perceived Behavorial Control
Average AVE = (0.699+0.842+1.000)/ 3 = 0.847
R2 = 0.281
GoF = √ (0.847 x 0.281)
= 0.4879

115
Model 3 – Full Framework
Average AVE = (0.7220+0.5708+0.699+0.842+1.000+0.750+0.602+0.911)/8 =
0.72614
Average R2 = (0.281+0.499+0.732)/3 = 0.504
GoF = √ (0.7261 x 0.504)
= 0.6049
The calculated values for Model 1, 2 and 3 are 0.5828, 0.4879 and 0.6049
respectively. All these values exceed the threshold value of 0.36 indicating that
goodness of fit is sufficient. All three models of this research are highly significant
as the constructs of the model fit in well.
4.6 Summary
In this chapter, necessary statistical tests were conducted and as a result the models
were proven to be valid and reliable with a significant explanatory power.
Hypotheses 1 to 7 were all accepted except for Hypotheses 6 concerning the
relationship between subjective norms and behavioral intention.

116
CHAPTER 5
DISCUSSIONS AND CONCLUSIONS
5.0 Introduction
This chapter will summarize the study and will discuss the findings of the study.
Implications of the study will also be discussed followed by discussions on the
limitations of the study and suggestions for future research. Finally the chapter will
end with a conclusion of the study.
5.1 Recapitulation of the Study Findings
The purpose of this study was to answer the following research questions:
1) What is the level of acceptance of GST amongst consumers?
2) What is the relationship between rule observance behavior and attitude of
consumer?
3) What is the relationship between perception of GST fairness and attitude of
consumer?
4) What is the relationship between the level of GST knowledge of consumers
and perceived behavioral control?
5) What is the relationship between self-efficacy of a consumer and perceived
behavioral control?
6) What is the relationship between attitude of consumers and their level of
acceptance of GST?

117
7) What is the relationship between subjective norms of consumers and their
level of acceptance of GST?
8) What is the relationship between perceived behavioral control of consumers
and their level of acceptance of GST?
This research is conducted in conjunction with the latest implementation of Goods&
Services Tax in Malaysia on 1st April 2015. Goods & Service Tax was a move made
by the government in order to regularize and systemize the revenue generation of the
government. From the government’s viewpoint, GST is the most logical transition
for the tax collection system in Malaysia especially since all neighboring countries
have already implemented GST.
However, the acceptance of Malaysian consumers with the concept of GST was
projected as low due to the numerous protests and the preliminary survey conducted
by the Merdeka Centre. Whilst some consumers are agreeable with the
implementation of GST, some are not agreeable. The government is in the
impression that the lack of acceptance is due to the lack of knowledge on the
mechanisms of GST and they have taken all measures to educate the general public
on GST (Borneo Post Online, 2015; Jalil,2015; GST Malaysia Info,2014)
This research is hence aimed at first gauging the level of acceptance amongst
consumers and even more interestingly, this study has focused its respondents to
MBA students. This augments the quality of the research because we are studying a
group of people who are assumed to have a sound knowledge in GST as it would be
highly related to their career and intellectual level.

118
The research seeks to identify the crucial factors that influence the acceptance of
GST amongst these specified consumers. What are the issues or elements that will
result in a consumer agreeing with the concept of GST or otherwise? In search of the
answers to this vital question, the Theory of Planned Behavior came in view as a
theory which can be used to conduct a study on the subject matter. Being a well-
established theory, used to support many research frameworks in numerous contexts,
the Theory of Planned Behavior formed the base to the theoretical framework of this
research. In addition, the components of the TPB were further examined and
antecedent variables to the Attitude and Perceived Behavioral Control factors were
included. These antecedent variables were crucial to understand the practical
implications of the Theory of Planned Behaviour. The antecedent variables lead to
the independent variables and these antecedent variables are concepts that can be
easily understood by consumers.
For instance, just saying attitude of consumers is theoretically viable however the
practical implication is limited. However, when we include antecedent variables and
prove that these antecedent variables lead to a positive attitude towards GST
implementation, the government and related authorities will be able to practically
address the issue. In this context, Rule observance Behavior and Perception of Tax
Fairness are antecedent variables to Attitude. From the findings of the research, the
related authorities will be able to engage in practical solutions to address consumers’
perception of tax fairness and rule observance behavior in order to improve their

119
attitude towards GST instead of not having a clear guideline on how to address the
issue.
In order to answer the research questions of the study, the framework hence consists
of four antecedent variables, three independent variables and one dependent variable.
The antecedent variables in this study are rule observance behaviour, perception of
tax fairness, level of tax knowledge, self-efficacy, the independent variables are
attitude, subjective norm and perceived behavioural control and the dependent
variable is the level of acceptance of GST. It is vital to note here that the acceptance
of GST refers to the level of agreement to the implementation of GST and not the act
of paying GST. These variables were then measured through an online questionnaire
with various sections designed to ensure a systematic data collection for each
variable. 228 MBA students took place from USM, UKM, UM and UPM with the
proportion of respondents being 86, 48, 43 and 51 respectively. The data collected
from these respondents were analyzed using the SmartPLS version 3 and IBM SPSS
Statistics to study the relationships between the various variables.
5.2 Discussion
In this section, the relationships between the antecedent variables, independent
variable and dependent variable and their respective implications are discussed based
on the research questions.

120
5.2.1 What is the GST acceptance level amongst Malaysians?
The acceptance level amongst Malaysian consumers who are MBA students was
determined through this study. The acceptance level was determined through the
intention of the consumer to accept GST as during the time of data collection GST
had not been implemented. The time period of data collection was in February 2015.
Hence, in this situation the behavioral intention component of the Theory of Planned
Behavior was the acceptance level of these Malaysian consumers. For level of
acceptance, the average score was 2.94 confirming slightly low level of acceptance
of GST amongst these consumers who were MBA students. This is because it is
below 3 which is the neutral point of the scale. Any mean value above 3 indicates
agreement and below 3 indicates disagreement (Boone & Boone, 2012).
In order to study the impact of the various demographic characteristics on the
respondents’ level of acceptance of GST, independent t-tests as well as one-way
Analysis of Variance (ANOVA) were conducted.
An independent t-test was conducted to compare whether two groups have different
averages in terms of their level of acceptance of GST. A one-way ANOVA is used
also to compare means but for three or more groups using the F-distribution. IBM
SPSS statistics software version 22 is once again employed for this analysis. For the
purpose of the t-test and one way ANOVA, each group should have at least 30
samples for an appropriate analysis.

121
Hence, t-tests were conducted on Gender and Programme Mode whilst one-way
ANOVA was conducted for Institution and Income. The findings of the tests are
presented in Tables 5.1 to 5.5 and the outputs of the analysis are attached in the
appendix.
Table 5.1 Summary on t-test for Gender and Mode of Study
Dimensions Groups N Mean Std Dev t Sig(2-
tailed)
Gender Male 105 3.0762 1.09145 1.736 0.084
Female 122 2.8279 1.05973
Mode of
Study
Full time 32 2.7031 1.08404 -1.373 0.171
Part time 196 2.9847 1.07406
As the significance level for both dimensions is more than 0.05, the differences in
mean between the groups are not significant. It can be concluded that the intention to
accept does not vary irrespective of gender and mode of study. Full time students
who are not working have the same level of intentions to accept as part time
students.
Table 5.2 Descriptive Table on Institutes and Level of Acceptance of GST
Dimensions Groups N Mean Std Dev
Institute USM 86 2.6977 0.99493
UKM 48 2.8542 0.96733
UM 43 2.8256 1.09590
UPM 51 3.5490 1.09661
Total 228 2.9452 1.07753

122
Table 5.3 ANOVA table of results for institution groups
Sum of
Squares df Mean Square F Sig.
Between Groups 24.877 3 8.292 7.782 .000*
Within Groups 238.688 224 1.066
Total 263.565 227
Significant at 1%
From table 5.3, it can be seen that there is a significant difference in mean of GST
acceptance amongst students in the various institutes; USM, UKM, UM and UPM.
From Table 5.2 it can be seen that UPM students have a much higher acceptance
level of the implementation of GST.
Table 5.4 Descriptive Table on Income Level and Level of Acceptance GST
Dimensions Groups N Mean Std Dev
Income Level No Income 34 2.7353 1.06767
1000 – 5000 126 2.9405 1.16894
5001 – 10000 35 3.1143 .68691
10001 – 15000 33 3.0000 1.06800
Total 228 2.9452 1.07753
Table 5.5 ANOVA table of results for income level groups
ANOVA
Sum of
Squares df Mean Square F Sig.
Between
Groups 2.601 3 .867 .744 .527
Within Groups 260.964 224 1.165
Total 263.565 227

123
From Table 5.5, it can be seen that there is no significant difference between the
different income level groups. This means an unemployed student and a student with
a monthly income have the same level of intention to accept GST. Income level does
not seem to influence their intention to accept GST.
5.2.2 What is the relationship of rule observance behavior and perceptions of
tax fairness with attitude of consumer?
The relationship of Rule Observance Behaviour and Perception of Tax Fairness with
Attitude of consumer is discussed under one section as these three latent variables
were examined in one model, Model 1 in chapter 4.
Attitude is the positive or negative feeling a consumer has regarding GST which is a
result of their belief system (Fishbein&Ajzen, 1975). It can be seen from the
descriptive statistics that attitude is 3.14 with a standard deviation lower than 1. This
points out that the respondents are in agreement as standard deviation is low and that
they have a slightly positive feeling towards the implementation of GST. This is
because on a Likert Scale, 3 marks neutrality and any value below inclines towards
low level of acceptance of GST and any value above inclines low level of acceptance
of GST. With effective measures taken, the attitude of consumers towards
acceptance of GST can be further enhanced.

124
Rule observance behavior refers to an individual’s tendency to conform to rules
(Trevino, 1986). In this study, rule observance behavior is treated as an antecedent
variable to attitude. The rule observance behavior mean was 3.66 with a low
standard deviation indicating that the respondents in general, were those who obeyed
rules and believe that rules bring about improvements. The results of this study
concluded that rule observance behavior positively affects attitude and that is why
Hypothesis 1 was supported. This is in line with previous research conducted that
tests the relationship between rule observance behavior and attitude (Sarina et al.,
2007; Jeffrey &Weatherholt, 1996).
In order to further enhance the rule observance behavior amongst Malaysians, the
authorities can opt to increase their understanding of certain rules and the purpose of
those rules. If consumers are able to understand the positive effects of the
implementation of certain rules, their rule observance behavior will increase
Perception of tax fairness refers to the opinion that the consumers have on the
fairness level of the taxation system (Saad, 2010). This was also taken as an
antecedent variable to attitude. The average response on the perception of tax
fairness was at 2.86 indicating that the respondents do not perceive the tax system as
fair. The low standard deviation confirms that all respondents are in agreement with
the low perception of tax fairness. This is a very important point to note as a low
perception of tax fairness can only be enhanced with the direct involvement of
government authorities. The consumers need to be transparently informed on the
allocation of the taxes they have paid and the returns they are obtaining from the tax
they have paid. The positive relationship between perception of tax fairness and

125
attitude, reflected in Hypothesis 2, was confirmed as significant. Hence, this study
inferences that the more positive the perception of tax fairness, the more positive the
attitude towards the acceptance of GST. Findings from previous studies have
concluded with the same positive relationship (Thomas, 2012; Seidl & Traub, 2001;
Saad, 2010; Tan & Chin-Fatt, 2000)
Rule observance behavior and perception of tax fairness are able to explain 49.9% of
variance in a consumer’s attitude as the R square for Model 1 is 49.9%. This is a
significant value and confirms that these two factors are appropriate antecedent
variables to attitude. The beta weight for perception of tax fairness is higher
(β=0.550) than the beta weight of Rule Observance Behaviour (β=0.256). This
explains that the perception of tax fairness is a critical factor to be considered in
influencing consumers’ attitude.
This explains the phenomenon that although the rule observance behavior of
respondents is high, the positive attitude is not equally high because of the low
perception of tax fairness. Consumers are not going to accept GST as they value the
fairness of the taxation system more than obeying the rules itself.
5.2.3 What is the relationship of Self – Efficacy and Level of Tax Knowledge
with Perceived Behaviour Control?

126
The relationship of Self – Efficacy and Level of Tax Knowledge with Perceived
Behaviour Control of consumers is discussed under one section as these three latent
variables were examined in one model, Model 2 in chapter 4.
Perceived behavioural control is the consumer’s discernment on how easy or
difficult it is to perform a specific act. (Ajzen& Madden, 1986) In this case, the
respondents’ responses to the questionnaire have inferred that they have a slightly
low perceived behavioural control at an average of 2.91. However, the standard
deviation of slightly higher than 1 shows that the level of agreement on the low
perceived behavioural control is not evenly spread across all respondents. This
slightly low value of perceived behavioural control indicates that these specified
consumers foresee internal and external constraints to them agreeing with the
implementation of GST.
Self-Efficacy plays a key role in enhancing the perceived behavioural control of an
individual as proven by Raghuram(2003) and Beauregard(2012). In this research,
self-efficacy refers to the judgments of respondents of their own capability in
managing their finances, consumption and expenditure as well as adapting to GST.
The mean self-efficacy amongst the respondents was 3.24 with a low standard
deviation giving an inference that the respondents in general slightly agreed that they
possess the self-efficacy required for the adaptation to the GST. This slight lack of
self-efficacy amongst the consumers should be a concern of the government
authorities as it will cause higher levels of debts and financial issues if consumers are
not assisted effectively.

127
The findings of this research have established that there is a positive relationship
between self-efficacy and perceived behavioral control. Hypothesis 3 has been
supported by the findings from the data analysis. The positive relationship between
self-efficacy and perceived behavioral control was also proven in previous studies,
(Raghuram,2003; Schmidt & Karsten, 2015; Kulviwat (2014). The self-efficacy of
respondents has to be enhanced in order to increase their perceived behavioural
control.
Level of tax knowledge for the purpose of this study was evaluated through two
sections, technical questions on the mechanisms of GST and scenario-based practical
questions. These two sections will be able to gauge the respondents’ level of
understanding in the subject matter of GST. The average score of respondents is
76.34% with a standard deviation of 14%. This is quite a positive outcome as it
states that, the respondents in general without any significant variances, have a sound
and good level of knowledge on GST. This has also proven that all the efforts taken
by the government to educate the public through seminars has had positive effects on
this group of respondents.
The relationship between level of tax knowledge and perceived behavioural control
has proven to be positive as hypothesis 4 has been accepted. Hence, an increase in
the level of tax knowledge will inevitably increase the consumer’s perceived
behavioural control. This is in line with previous research by Saad (2010) and Chiou
(1998).

128
With the abovementioned antecedent variables, the relevant authorities will have a
clearer idea on how to address this issue of lack of perceived behavioural control
amongst the consumers.
Self-efficacy and level of tax knowledge are able to explain 28.6% of variance in a
consumer’s perceived behavioural control as the R square for Model 2 is 28.6%.
Although lower than Model 1’s R square, it is still a noteworthy value and indicates
that these two factors are antecedent variables to perceived behavioural control.
(Filho et al, 2011) The beta weight for self-efficacy is significantly higher (β=0.506)
than the beta weight of Level of tax knowledge (β=0.148) concluding that self-
efficacy has higher influential power on the consumers’ perceived behavioral
control. This explains the phenomenon that although the level of tax knowledge of
respondents is high, the perceived behavioral control is not equally high because of
the lower level of self-efficacy amongst the respondents.
5.2.4 What is the relationship of Attitude, Subjective Norms and Perceived
Behavioral Control with Level of Acceptance?
The average scores for attitude, subjective norms and perceived behavioral control
were 3.14, 3.00 and 2.91 respectively. As the mean value for attitude is slightly
above 3 it indicates slight agreement. Subjective norm has a mean value of 3
indicating absolute neutrality. Perceived behavorial control is slightly low at 2.91.
The average score for level of acceptance of GST was 2.94 indicating slightly low
level of acceptance.
129
From the coefficient of determination value, it can be seen that attitude, subjective
norms and perceived behavioural control together explain 73.2% of the variation in
behavorial intention of the respondents. This is a highly significant value endorsing
that the Theory of Planned Behaviour is a fundamentally concrete theory which can
be used in any context.
From the findings of the data analysis, the relationship between attitude and
perceived behavioural control with behavioral intention has been proven to be
significant. The beta weight for attitude is significantly higher (β=0.570) than the
beta weight of perceived behavorial control (β=0.243) illustrating that attitude is the
better predictor of intention to accept GST. This critical information now
emphasizes the importance of cultivation of attitude in support of Goods and
Services Tax in order to increase the acceptance level amongst the consumers.
Hence, looking into the antecedent variables of attitude, the government should
allocate resources and probably undertake drastic measures to increase the
perception of tax fairness amongst the consumers. This in turn will cultivate a
positive attitude towards the concept of GST and ultimately result in a higher
acceptance level. Previous studies, Hanno and Violette (1996), Wan et al. (2012) and
Loo et al (2007) concluded in the same way.
The influence of perceived behavioral control is weaker but still important. Inclusion
of perceived behavioural control in the Theory of Reasoned Action has led to the
formation of Theory of Planned behavior, enhancing its explanatory power
extensively. (Taylor&Todd, 1995) As mentioned by Sparks et al. (1997), several
researchers have customized the measurements of perceived behavioural control to

130
the behavioral issue in concern in the particular study. In this case, the measurements
of the perceived behavorial control was tailor-made to suit the GST scenario and
antecedent variables were identified to enable easier understanding on the
operationalization of perceived behavioral control. Previous studies have found
similar findings (Bobek and Hatfield, 2003; Damayanti,2012).
In contrast, Hypothesis 6 which was testing the relationship between subjective
norms and behavioural intention was not supported. Subjective norm is the
individual’s perception that those who are important to him/her think he/she should
not perform the behavior in question. (Fishbein&Ajzen,1975) Hence, it is concluded
that subjective norms had no significant effect on the intention of respondents to
accept GST. This is in contrast with previous studies, (Damayanti, 2012; Bobek,
1997;Nordiana, 2012) but at the same time coherent with other studies which found
no relationship between subjective norms and intention to behave. (Mathieson, 1991;
Chau & Hu, 2001).This could be explained by the fact that the respondents were all
MBA students with a high intellectual level. Individuals with a high intellectual level
have a lower tendency of being influenced by peers and family on issues and
decision making as they are able make sound decisions based on their perceptions
and beliefs.
5.3 Summary of findings
An empirical research was conducted to determine the factors which influence the
acceptance level of consumers with Goods and Services Tax in Malaysia. The
Theory of Planned Behavior was employed to examine the significance of attitude,

131
subjective norms and perceived behavior control as factors influencing acceptance of
GST. However, only attitude and perceived behavorial control had a significant
effect on the behavioral intention of consumers to accept GST.
In addition to antecedent variables to attitude and perceived behavorial control were
also identified to enable easier practical application of the research. The antecedent
variables to attitude were rule observance behavior and perception of tax fairness
with the latter having a more significant influence compared to the former. With the
perceived behavior control of the consumers, its antecedent, self-efficacy had a
higher explanatory power than the other antecedent variable; level of tax knowledge.
These specific and clear findings will act as stepping stone for the relevant
authorities to understand the effective measures that can be undertaken to improve
the acceptance level amongst consumers.
5.4 Implications
The implication of this study is an important discussion as it will make sense of the
purpose of conducting this particular research. This section will also discuss the
impact and contribution of the outcomes of this research. Thus, the implications of
this research can be viewed from two major points; theoretical implication and
practical implication.
5.4.1 Theoretical Implication

132
This study has used Theory of Planned Behavior to examine the perceptions of
consumers with regards to GST. This study attempted to study the factors
influencing the consumers’ acceptance of Goods and Services Tax in Malaysia. Most
studies pertaining GST in Malaysia has been related to tax collectors; companies and
their compliance level. (Bidin & Shamsudin, 2013; Nordiana, 2012; Palil & Ibrahim,
2011) Other studies have examined the awareness and acceptance level towards
GST. This study will however be the first to examine the factors affecting the
acceptance level using an established theory such as TPB. This research attempts to
enhance the academic awareness in the field of Goods & Services Tax in Malaysia.
An honest effort has been made to apply a well-established theory to a local and very
current context to further strengthen the validity of the theory. In addition, this study
has also examined the antecedents to Attitude and Perceived Behavioral Control.
With these antecedents, the explanatory power and applicability of the research
enhances multiple times.
Using Theory of Planned Behavior, the model was able to explain 73.2% of the
variance in the intention of consumers to accept GST. This significant statistical
indicator confirms that this model is also appropriate in predicting the Malaysian
consumers’ acceptance intention of the newly implemented Goods & Services Tax.
Previous study by Nordiana (2012) which used Theory of Planned Behavior to
examine the compliance behavior amongst corporate taxpayers reported a coefficient
of determination of 22%. This study on consumers has a higher and more significant
coefficient of determination which indicates the significance of the independent
variables on the dependent variable.

133
5.4.2 Practical Implication
Goods and Services Tax is a consumption tax and hence will ultimately have a
significant impact on consumers. Thus, a study which is consumer-centric will
provide significant practical implications which will be able to solve the issues faced
at this point of time. The outcome of the research has confirmed a slightly low level
of acceptance of GST despite the efforts taken by the government. This definitely
indicates that a new approach has to be undertaken to address this issue and this
research will be able to provide an idea on the current mindset of the consumers.
As Rule Observance behavior has a significant impact on consumers’ attitude toward
Goods and Services Tax, effort should be taken to further enhance this behavior
amongst consumers. Currently, the government is emphasizing on the eradication of
corruption which will lead to an improvement in the compliance of rules by citizens
and authorities. This is because enforcement will be enhanced by the authorities.
However, citizens can always find a way around rules if this rule observance
behavior is not embedded in them. The relevant authorities have to take more
effective steps to ensure rule compliance. According to Burgess (1996), following
rules is a mindset and in order to influence it, steps have to be taken in the early
years of an individual’s life. Hence, school children must be exposed to the various
rules in place and most importantly be aware of the reasoning and justifications of
those rules. They must be taught to appreciate these rules which will lead to higher
rule observance behaviors. For the immediate scenario, the rules' reasoning and the

134
justification for abiding by those rules should be focused on in the strongest possible
way. Burgess (1996) has suggested that we should emphasize on the negative
consequences for other people if rules are not obeyed. The government can even go
further to introduce a merit system to motivate citizens to obey rules. A simple
example that can be considered would be that the local authorities can commit that
for every vehicle which does not receive a single summon in three years is entitled to
free renewal of road tax on the 3rd
year. Once there is a strong enough reason, rule
observance behaviour of citizens will be enhanced. (Burgess, 1996)
This research has indicated perception of tax fairness is low amongst consumers and
it is the factor that significantly influences attitude of consumers. Once consumers
view themselves as victims of fiscal inequity, they lose trust in the fairness of the
taxation system. (Siahaan, 2012) Thus, the government has to undertake effective
measures that enable the consumers to clearly view the uses of the taxes collected as
well as to be able to obtain benefits from the country in return of the tax paid. From
the open-ended questions, it can be gathered that the distribution of ‘Bantuan Rakyat
1 Malaysia’ (BRIM) was not viewed as a fair distribution of the tax collected as the
respondents felt that the tax collected should be used to enhance medical, education
and welfare services for all. The concept of BRIM was also not applauded as it is a
very short term solution for a change which is going to be permanent;
implementation of GST. Many of the respondents suggested that further reductions
in income tax rates would be better as currently the high-income and middle-income
earners are highly affected as they have to pay both income and consumption tax.
The low-income earners will be benefiting as the GST is multiple-rate system and

135
hence a lot of daily grocery items highly used by the low income earners has been
stated as zero-rated. Other suggestion in contrast to BRIM also included increasing
job opportunities, subsidies, education assistance, business start-up assistance and
technical skills providers. The government has to focus on transparent distributive
justice-the fair allocation of resources to ensure the consumers are able to reap basic
benefits for the tax that they are paying. (Boonyarat et al, 2014) The transparency of
the collection of income tax and its allocations had led the Jordanian taxation system
to be viewed as fair by its citizens. (Khasawneh, 2008)
The government has been harping on educating the public on the mechanisms of
GST and as a result of it the knowledge level was concluded as high in this research.
Now that they have educated the current consumers, the education ministry should
be proactive and move towards educating school children and undergraduates on
GST. This is so that the concept of GST is already in-built and they are able to
understand and acknowledge it as a necessity for the government. These individuals
are going to be the next generation of consumers and embedding this knowledge in
them will better prepare them to deal with GST. With all these knowledge being
imparted to these future consumers, they will not perceive anymore constraints in
accepting GST.
For perceived behavioral control, it was learnt that a higher weightage should be
placed on the self-efficacy levels of the consumers. Hence, although their knowledge
of GST and its implications were high, consumers were not confident that they will
be able to manage the situation especially their finances once GST has been
implemented. In this case, the government should look into improving the self-

136
efficacy levels of consumers. This can only be improved if the consumers have the
self-confidence that they possess the required skills and abilities to manage their
finances and expenditure with the implementation of GST. It is a perception that they
make of themselves and can only be enhanced by changes in their own personal
perceptions. Thus, besides being given knowledge on the mechanisms and purpose
of GST, the government can opt to utilize the given budget of RM 250 million on
educating consumers in managing their consumption and finances. A very practical
example would be that, when a consumer understands the basic rule that only a
company earning above RM500,000 will have to comply with the collection to GST,
they can always opt to shop in smaller shops to avoid GST. Consumers who
understand that the GST is merely replacing the sales and services tax will
understand that for certain services they are paying the same amount of tax and for
certain items they are indeed paying less than before when 10% tax was imposed.
The savings here is then transferred over to other items for which now they have to
pay a GST of 6%. . They should also be informed about the differences between
sales and service tax and GST.
Attitude towards GST is slightly positive and working towards improving this would
inevitably result in better acceptance of GST. To enhance this, the government has to
undertake the challenging task of creating a positive feeling towards GST amongst
consumers. The first and foremost action that must be undertaken by the government
is to improve their support system for the consumers. This transition time is the most
critical time and the government must employ as much manpower as possible to
answer consumer’s queries and complaints. Effort and care must be taken to ensure
the hotlines are available at all times and immediate, transparent actions are taken

137
against complaints. This sincerity in supporting consumers through this transition
will definitely result in the consumers feeling more positive about GST and the
authorities. To add on, it must be communicated to the consumers that all
neighboring countries have already implemented GST successfully and this will
prompt the consumers to feel more positively towards GST and its contributions to
the nation.
Perceived behavorial control is slightly low amongst the consumers indicating that
these consumers perceive internal and external constraints in them accepting GST.
Currently, the government has taken the well-applauded move to look into the
service charge that a number of outlets were charging. The government now has
made it mandatory for these outlets to clearly display their collective agreement with
its employees and the service they will be rendering to their customers in order for
the outlet to include the service charge. (Idris, 2015) The same modus operandi can
be implemented in other areas to make this new implementation easy for the
consumers. Another way would be for the government to enforce display of
information on whether the particular item is standard rated or zero rated. In the
current situation, consumers at many outlets are only aware of the GST implication
on the product when the payment is made and receipt is generated. If the authorities
make it mandatory for the display of the GST rate of the product, it will make it
easier on the consumer to be able to choose their products and manage their
consumption. Furthermore, it should also be made mandatory for outlets to clearly
display their GST compliance status; whether or not it is GST registered so that
consumers can make an informed decision to patronize their outlet. With these

138
measures in place, the constraints for consumers are reduced and they would find it
easier to accept GST. .
5.5 Limitations
There are a few noteworthy limitations to this study. Firstly, the unit of analysis of
this study has been confined to consumers who are currently pursuing their MBA in
the four selected universities. This may affect the generalizability of the study as
well as representation of all consumers’ intention to accept GST.
The second limitation was that convenience sampling was used due to lack of
support from the various graduate business school administrators. Convenience
sampling also may affect the generalizability of the findings.
Another limitation is that the timing of the research coincides with the transition of
GST implementation. Data was collected pre-GST but the findings were developed
post-GST, this might have an effect on the perceptions of the knowledgeable
consumers.
5.6 Suggestions for Future Research
First and foremost, the limitations discussed above should be addressed in future
research. A more wide spread population of respondents using random sampling
methods will provide highly representative findings.

139
Future research can opt to study the acceptance level amongst different categories
consumers. Amongst the categories they can look at are consumers with an
undergraduate degree or below and also consumers who are not educated. The latter
would be an interesting study as the level of tax knowledge amongst uneducated
consumers can also be examined.
Furthermore, the differences in mean within the four universities can be further
explored to understand the cause of the difference, be it geographical distribution,
academic exposure, work exposure, state government efforts or other reasons.
To add on, a similar study should be conducted after the actual implementation of
Goods & Services tax to study the responses of consumers after having experienced
GST for them. This research obtained responses from consumers on a perception-
basis whereas a follow-up research would produce more relevant responses.
Longitudinal studies can be conducted to study the differences in attitude, subjective
norms and perceived behavioral control across initial acceptance and continuance
stages.
For future research, it could be suggested that the perception of tax fairness be
evaluated using the Giligan & Richardson’s (2005) 21 item tax fairness perception
scale covering all fairness dimensions. This will enable the researcher to analyze in
detail the tax fairness perceptions of respondents and specific areas of improvement.
Finally, the research model in this study has managed to explain 73.2% of variation
in behavorial intention. However, 26.8% of the variation still remains unexplained.

140
Looking at other tax compliance studies, future research can look at other predictor
variables such as tax complexity (Saad, 2010) and law enforcement (Nordiana,
2012).
5.7 Conclusion
In view of the current turmoil amongst consumers with the implementation of Goods
& Services Tax, this research was undertaken to shed some light on the concerns of
consumers. Although, the consumers in this research were restricted to those
currently pursuing their MBA in either USM, UKM, UM or UPM, it acts as stepping
stone towards many more extensive research in this very new field of GST in
Malaysia. Previous researchers on an international level had studied compliances to
income tax submissions whilst Malaysian studies on GST had focused on the tax
collectors- companies’ compliance to GST.
In order to make sense of the various factors that influence these consumers in
intending to accept GST, the renowned Theory of Planned Behavior was employed.
Being an expansively tested theory, it once again proved to be a significant and
appropriate theory in this context as well. This was determined through statistical
measures. In addition to that, antecedent variables to the attitude and perceived
behavorial control components of the theory were identified. This is to enhance the
contribution of this research as practitioners would then be able to understand the
formation of attitude and perceived behavorial control. By understanding this, they

141
can then engage in practical methods of enhancing these components of attitude and
perceived behavorial control.
From the statistical analysis, significant factors were identified and recommendations
were given on improvement methods that can be undertaken. The theoretical and
practical implications of this study are significant as it is in relation to a current and
less-explored subject matter. This one research has provided new and interesting
insight to the actual concerns and issues of the consumers which if addressed
effectively by the authorities will lead to better acceptance of GST. Consumers now
have to focus on utilizing the knowledge they have on GST to manage their
consumption. Only by managing their consumption will they be able to reduce the
tax burden incurred.

142
REFERENCES
Abd-El-Fattah, S. M., &Fakhroo, H. A. (2012). The Relationship among
PaternalPsychological Control and Adolescents’ Perfectionism and Self-
Esteem: A Partial Least Squares Path Analysis. Psychology, 3(5), 428-439.
Ajzen, I. (1985) From intentions to actions: A theory of planned behavior. IN
KUHL, J. & BECKMANN, J. (Eds.) Springer series in social psychology.
Berlin, Springer.
Ajzen, I. (1988). Attitudes, personality, and behavior. Chicago: Dorsey Press.
Ajzen, I. (1991). The theory of planned behavior.Organizational Behavior and
Human Decision Processes. Vol 50 179-211 doi: 10.1016/0749-
5978(91)90020-T
Ajzen, I. (2001). Nature and operation of attitudes.Annual Review of Psychology.
Vol. 52, 27-58.
Ajzen, I. (2002). Perceived behavioral control, self-efficacy, locus of control, and
thetheory of planned behavior. Journal of Applied Social Psychology.
32, 665-683.
Ajzen, I. (2006). Constructing a TpB Questionnaire: Conceptual and Methodological
Considerations.Retrieved from http://www.people.umass.edu/.
143
Ajzen, I. (2013). Constructing a theory of planned behavior questionnaire.
[electronic resource]. Amherst, MA, USA: University of Massachusetts.
Retrieved from http://people.umass.edu/aizen/tpb.html
Ajzen, I. and Madden, T.J. (1986). Prediction of goal-directed behaviour: attitudes,
intentions, and perceived control. Journal of Experimental Social
Psychology. Vol. 22, 453-74
Bandura, A. (1986). Social foundations of thought and action: A Social Cognitive
Theory, Prentice Hall, Englewood Cliffs, NJ.
Bandura, A. (1997). Self-efficacy: toward a unifying theory of behavioral change.
Psychological Review, 84, 191-215 Retrieved from
http://www.uky.edu/~eushe2/Bandura/Bandura1977PR.pdf
Barclay, D., Thompson, R., & Higgins, C. (1995). The Partial Least Squares (PLS)
Approach to Causal Modeling: Personal Computer Adoption and Use an
Illustration. Technology Studies, 2(2), 285-309.
Beauregard, T.A. (2012) Perfectionism, self-efficacy and OCB: the moderating role
of gender. Personnel Review. 41(5), 590-608

144
Ben-Ami,M., Hornik,J., Eden,D. &Kaplan,O.(2014). Boosting consumers’
self-efficacy byrepositioning the self.European Journal of Marketing. 48
(11/12), 1914 – 1938 Doi: 10.1108/EJM-09-2010-0502
Bernama (2014, May 30), GST implementation to add up to RM27b to Malaysia's
income.NewStraitTimes. Retrieved from: http://www.nst.com.my/latest/gst-
implementation-to-add-up-to-rm27b-to-malaysia-s-income-1.280974
Bernama (2013, October 25). Budget 2014: Full text of Prime Minister's speech The
Star Online Retrieved from http://www.thestar.com.my/News/Nation/2013
/10/25/Budget-2014-PM-speech.aspx/
Bernama (2015, April 1) Malaysia joins the ranks of many in embracing the GST.
News Strait Times Online Retrieved from http://www.nst.com.my/node/78934
Bernama (2015, February 25). Ahmad Maslan: GST will help reduce black economy.
Malaymail Online Retrieved from fromhttp://www.themalaymailonline.com
/article /ahmad-maslan-gst-will-help-reduce-black-economy
Bernama(2014, February 10) ‘Price of 24 selected daily essentials at 881 premises
nationwide’ NewStraitTimes Retrieved from:
http://www.nst.com.my/latest/price-of-24-selected-daily-essentials-at-881-
premises-nationwide-1.481400

145
Bhattacherjee, A. (2000). Acceptance of e-commerce services: The case of electronic
brokerages. IEEE Transactions on Systems, Man, and Cybernetics: Part A.
Systems and Humans. 30(4), 411–420
Bidin,Z&Shamsudin,F.M. (2013). Using Theory of Reasoned Action to Explain
Taxpayer Intention to Comply with Goods and Services Tax (GST). Middle-
East Journal of Scientific Research 17 (3), 387-394. DOI:
10.5829/idosi.mejsr.2013.17.03.12167
Bobek D.D. and Hatfield R.C. (2003) An Investigation of the Theory of Planned
Behavior and the Role of Moral Obligation in Tax Compliance. Behavioral
Research in Accounting. Vol. 15, No. 1 13-38.
Bobek, D.D. (1997). Tax Fairness: How do individuals Judge Fairness and What
Effect Does It Have on Their Behaviour. Unpublished PHD thesis, University
of Florida
Boone, H.N. & Boone, D.A. (2012).Analyzing Likert Data. Journal of Extension.50(2)
Retrieved from http://www.joe.org/joe/2012april/pdf/JOE_v50_2tt2.pdf
Boonyarat,N., Sofian,S. &Wadeecharoen,W. (2014). The Antecedents of Taxpayers
Compliance Behavior and the Effectiveness of Thai Local Government Levied
Tax. IBT Journal of Business Studies. 10 (1), 23-39

146
Burgess, C.N.W. (1996) Identifying the Wilful Traffic Offender. Unpublished
MsCDissertation, University of Exeter.
Chandra, S., Theng, Y. L., O’Lwin, M., & Foo, S. (2011).Examining Trust for
Organizational Collaborations via the Virtual World.Journal of Computer
Mediated Communication.
Chang, M. K. (1998). Predicting Unethical Behavior: A Comparison of the Theory of
Reasoned Action and the Theory of Planned Behavior.Journal of Business
Ethics. 17 1825-1834.
Cheng,T.C.E., Lam,D.Y.C. &Yeung,A.C.L. (2006). Adoption of internet banking: An
empirical study in HongKong. Decision support systems.42(3) 1558-1572
Retrieved from:
http://www.sciencedirect.com/science/article/pii/S0167923606000066
Chiou, J.S. (1998). The Effects of Attitude, Subjective Norm, and Perceived
Behavioral Control on Consumers’ Purchase Intentions: The Moderating
Effects of Product Knowledge and Attention to Social Comparison
Information. Proceedings of the National Science Council, Republic of
China.9(2), 298-308 Retrieved from
http://citeseerx.ist.psu.edu/viewdoc/download?doi=10.1.1.202.7526&rep=rep1
&type=pdf

147
Choo, T.S. (2014) ‘The battle for GST acceptance’ theSundaily Retrieved from:
http://www.thesundaily.my/node/251014
Christensen, A. L. &Weichrich S.G. (1996). Tax fairness: Different Roles, Different
Perspectives.Advances in Taxation. 8, 27-61.
Christensen, A. L., Weichrich, S.G. &Gerbing-Newman, M.D. (1994). Impact of
Education on Perceptions of Tax Fairness.Advances in Taxation. 6, 63-97.
Cohen, J (1988). Statistical Power Analysis for the Behavioural Sciences (2nd
ed.).
New Jersey: Lawrence Erlbaum Associates.
Cohen,N. &Arieli,T. (2011) Field research in conflict environments: Methodological
challenges and snowball sampling. Journal of Peace Research 48(4), 423-435
Doi: 10.1177/0022343311405698
Conner, M., and Sparks, P. (2005).The theory of planned behaviour and health
behaviours.In M. Conner & P. Norman (Eds.).Predicting Health Behaviour:
Research and Practice with Social Cognition Models. 2, 170–222
Culbertson, H.M. (1968). What is an attitude? Journal of cooperative extension. 79-84
Retrieved from http://www.joe.org/joe/1968summer/

148
Customs Guide Book (2003). Sales Tax Procedures - Series No 3. Retrieved from
http://www.ctim.org.my/file/news/15/00539_Customs%20Guide%20Book%2
0Series%20No.%203%20-%20Sales%20Tax%20Procedures.pdf
Damayanti, T.W. (2012). Changes On Indonesia Tax Culture, Is There A Way?
Studies Through Theory Of Planned Behavior. Journal of Arts, Science &
Commerce.Vol 3(4) 8-15
Davis, F. D., Bagozzi, R.P. &Warshaw P.R. (1989) User Acceptance of Computer
Technology: A Comparison of Two Theoretical Models. Management Science.
35: 982-1003.
Davis,F.D. (1989). Perceived usefulness, perceived PEOU and user acceptance of
information technology.MIS Quarterly. 13(3), 319-40
Dawkins.C.E. and Frass J.W. (2005). Decision of union workers to participate in
employee involvement: an application of the theory of planned behavior.
Employee Relations. 27(5), 511-531
Department of Statistics Malaysia (2011, August 28) Household Expenditure Trend
1993/94 - 2009/10 Retrieved from
http://www.statistics.gov.my/index.php?r=column/cthemeByCat&cat
=120&bul_id=RVVlT0tWVG03TDdCcEtXV29CNkZndz09&menu_id=amVo
WU54UTl0a21NWmdhMjFMMWcyZz09

149
Devos,K. (2014). Factors Influencing Individual Taxpayer Compliance
Behaviour.Doi: 10.1007/978-94-007-7476-6
Droomers,M., Schrijvers, C.T.M., Mackenbach, J.P. (2004) Educational differences in
the intention to stop smoking:Explanations based on the Theory of Planned
Behaviour. European Journal of Public Health. 14, 194-198. Retrieved from
http://www.ncbi.nlm.nih.gov/pubmed /15230509
Economic Report 2013/2014 ‘Federal Government Finance’ Ministry of Finance
Malaysia Retrieved from:
http://www.treasury.gov.my/pdf/economy/er/1314/jp6_2.pdf
Economic Report 2013/2014 ‘Federal Government Revenue’ Ministry of Finance
Malaysia Retrieved from:http://www.treasury.gov.my/pdf/economy/er/
1314/jp6_3.pdf
Erich, K., A. Niemirowski&Wearing,A. (2006). Shared Subjective Views, Intent
to Cooperate and Tax Compliance: Similarities between Australian Taxpayers
and TaxOfficers. Journal of Economic Psychology. 27(4) 502-517
Filho, D.B.F., Silva,J.A. & Rocha, E. (2011) What is R2 all about? Leviathan –
Cadernos de PesquisaPolítica. 3, 60-68

150
Fishbein, M., &Ajzen, I. B. (1975). Belief, attitude, intention and behavior: an
introduction to theory and research. Reading, MA: Addison-Wesley
Fornell, C., &Bookstein, F. L. (1982). Two structural equation models: LISREL and
PLS appliead to consumer exit-voice theory. Journal of Marketing
Research.19, 440–452.
Fornell, C., &Laracker, D. F. (1981).Evaluating structural equation models with
unobservable variables and measurement error.Journal of Marketing Research,
18(3), 39-50.
Frey,B.S. &Schneider,F.(2000) Informal and Underground Economy Encyclopedia of
Social and Behavioral Science. Amsterdam: Elsevier Science Publishing
Company.
Gerbing, M. D. (1988). An Empirical Study of Taxpayer Perceptions of Fairness.
Unpublished PhD thesis, University of Texas, Austin.
Gerpott, T.J. (1990). Intracompany job transfers: an exploratory two sample study of
the buffering effects of interpersonal support. Prevention in Human
Services.Vol. 8,139-58.
Giantari, G.A.K., Zain,D., Rahayu,M. &Solimun (2013). The role of perceived
behavioral control and trust as mediator of experience on online purchasing
intentions relationship a study on youths in denpasar city

151
(Indonesia).International Journal of Business and Management Invention.
2(1), 30-38 Retrieved from
http://www.ijbmi.org/papers/Vol%282%291/Version_3/D213038.pdf
Gilligan, G. and G. Richardson (2005). Perceptions of Tax Fairness and Tax
Compliance in Australia and Hong Kong: A Preliminary Study. Journal of
FinancialCrime.12(4) 331-343.
Groebner,D.F., Shannon,P.W. &Fry,P.C. (2014) Business Statistics. Edinburgh Gate,
Essex: Pearson Education Limited.
Guo, Q., C. A. Johnson, J. B. Unger, et al. (2007). Utility of the Theory of Reasoned
Action and Theory of Planned Behavior for Predicting Chinese Adolescent
Smoking.Addictive Behaviors. 32(5) 1066-1081.
Guthrie, J.P. &Schwoerer, C.E. (1994).Individual and contextual influences on self-
assessed training needs.Journal of Organizational Behavior. 15, 405-22
Hai, O.T. & See, L.M. (2011).Behavioral Intention of Tax Non-Compliance among
Sole-Proprietors in Malaysia.International Journal of Business and Social
Science.2(6), 142-152
Hair, J. F., Hult, G. T. M., Ringle, C. M., &Sarstedt, M. (2014).A Primer on Partial
Least Squares Structural Equation Modeling (PLS – SEM). Thousand Oaks:
Sage.

152
Hair, J., Babin, W., & Anderson, R. (2010).Multivariate data analysis (7th ed.). Upper
Saddle River, N.J.: Prentice Hall.
Hair, J.F., Black, W.C., Babin, B.J., Anderson, R.E., &Tatham, R.L. (2006).
Multivariate Data Analysis, 6th Ed., New Jersey: Pearson Prentice Hall
Hanno, M. D., &Violette, G. R. (1996).An Analysis of Moral and Social Compliance
on Taxpayer Behaviour.Behavioural Research in Accounting. 8
Haron,H., Khalid,S.N.A and Ganesan,Y. (2011) A handbook for Business Research
Methods. Petaling Jaya: Pearson Malaysia Sdn. Bhd.
Harris, T.D. (1989). The effect of type of tax knowledge on individuals’ perceptions
of fairness and compliance with the federal income tax system: An empirical
study.
PhD Thesis, University of South Carolina.
Hung,S.Y., Chang,C.M. and Yu,T.J. (2006). Determinants of user-acceptance of
the e-government services: The case of online tax filing and payment
system. GovernmentInformation Quarterly. Volume 23 (1) 97-122
Retrieved fromhttp://www.sciencedirect.com/science
?_ob=ArticleListURL&_method=list&_ArticleListID=782942896&_sort
=r&_st=13&view=c&md5=4e76b1e2bbb644386fb4b284cb3f59ac&searc
htype=a

153
Ian, L.S. (2014, May 15). You don’t understand GST, so don’t protest, says deputy
finance minister. The Malaysian Insider Retrieved from
http://www.themalaysianinsider.com/malaysia/article/you-dont-understand-
gst-so-dont-protest-says-deputy-finance-minister
Idris,A.A. (2015, April 6) Hotel, restaurants cannot impose service charges without
collective agreements. New Strait Times Online Retrieved from
http://www.nst.com.my/node/79570
Income Tax Act Malaysia (1967).
Jalil, H. (2015, March 16). Consumers lack knowledge on new tax regime.
theSundaily. Retrieved from http://www.thesundaily.my/news/1356200
Jeffrey,C. &Weatherbolt, N. (1996). Ethical development, professional commitment
and rule observance attitudes; a study of CPAs and corporate
accountants.Behavioral Research in Accounting. 8, 8-31
Jones, C.R. (2009) Understanding and improving use-tax compliance: A theory of
planned behavior approach. Graduate Theses and Dissertations.University of
South Florida Retrieved from http://scholarcommons.usf.edu/etd/2032
Jones, John F. (1970). The Theory of Attitude Formation and Change and Its
Application to Social Group Work.United College Journal, Vol. 8 21-28.

154
Retrieved from
http://web.psych.utoronto.ca/psy320/Required%20readings_files/week2-2.pdf
Joseph, S. (2013, August 19). Malaysia’s household debt situation.KiniBiz. Retrieved
from http://www.kinibiz.com/story/issues/44119/malaysia%E2%80%99s-
household-debt-situation-2.html
Kasipillai, J. (2000). A Practical Guide to Malaysian Taxation-Current Year
Assessment. Kuala Lumpur: McGraw-Hill.
Kasipillai,J. (2005) ‘ A comprehensive guide to Malaysian Taxation, Malaysia :
McGraw Hill Education
Kasipillai, J. (2013) ‘Gearing GST towards public acceptance’ The Star Online
Retrieved from: http://www.thestar.com.my/Business/Business-
News/2013/10/19/Gearing-GST-towards-public-acceptance-A-more-efficient-
way-of-taxation.aspx/
Khasawneh,A., Obeidat, M.I. & Al-Momani,M.A. (2008). Income Tax Fairness and
the Taxpayers’ Compliance in Jordan.Journal of Economic and Administrative
Sciences. 24(1) 15-39 Doi: 10.1108/10264116200800002
Kraft,P., Rise,J., Sutton,S. &Roysamb,E. (2005). Perceived difficulty in the theory of
planned behaviour: Perceived behavioural control or affective attitude? British
Journal of Social Psychology.44, 479–496

155
Kulviwat S., Bruner II G.C., Hall R. &Neelankavil J.P. (2014). Self-Efficacy as an
Antecedent of Cognition and Affect In Technology Acceptance. Journal of
Consumer Marketing. 31 (3), 190-199.Retrieved
fromhttp://www.emeraldinsight.com/doi/abs/10.1108/JCM-10-2013-0727
Lack of clarity on GST leads to much confusion. (2015, April 2). Borneo
PostOnline.Retrieved from http://www.theborneopost.com/2015/04/02/lack-of-
clarity-on-gst-leads-to-much-confusion/
Lai, D. (2014, October 28) Countdown to GST theSundaily Retrieved from
http://www.thesundaily.my/news/866844
Lancaster, G. (2005) Research Methods in Management. Retrieved from
http://books.google.com.my/books?id=lDZ9RlrvUk8C&printsec=frontcover&
source=gbs_ge_summary_r&cad=0#v=onepage&q&f=false
Likert, R. (1932). A Technique for the Measurement of Attitudes.Archives of
Psychology, 22(140), 1-55.
Loo,E.C., McKrechar, M. &Hansford,A. (2007) The Effect of Introduction of Self-
Assessment on Tax Knowledge of Individual Taxpayers in Malaysia: Survey
Findings. Paper presented at the Accounting Studies International Conference,
Kuala Lumpur, Malaysia.

156
Maydeu-Olivares, A., & Garcia-Forero, C. (2010).Goodness-of-Fit Testing.
International Encyclopedia of Education, 7, 190-196.
McKerchar, M. (1995). Understanding small business taxpayers: Their sources of
information and level of knowledge of taxation. Australian Tax Forum.12(1),
25-41.
McLeod,S. (2007). Simply Psychology. Retrieved from http://www.simplypsychology
.org/obedience.html
MerdekaCenter (2014, April).Majority of Malaysians do not understand or accept the
GST. Retrieved from http://www.merdeka.org/pages/02_research.html
Michael, L. G. (1978). Tax Avoidance, Horizontal Equity and Tax Reform: A
Proposed Synthesis.Southern Economic Journal. 44(4) 798-812.
Ministry of Education Malaysia (2012) Public Institutions OfHigher Education (Pihe).
Retrieved from http://www.moe.gov.my/v/ipta
Moomal,A. &Zakaria,Z. (2014). Awareness, Acceptance and Expectations of
Malaysian Consumers towards Goods and Services Tax (GST).Journal of
Contemporary Management Sciences.Vol 4 (2) 15-27 Retrieved from
http://jmsciences.com/Presentation/Client/detail.aspx?id=252

157
Nordiana, R. (2012) The perception of taxpayers toward goods and services tax (GST)
implementation. Unpublished thesis, University Utara Malaysia Retrieved
from http://etd.uum.edu.my/3247/3/NORDIANA_RAMLI.pdf
Nunnally, J. C., & Bernstein, I. H. (1994), Psychometric Theory (3rd
ed.) New York:
McGraw Hill.
Official Website Malaysia Goods and Services Tax (GST), Royal Malaysian Customs
Department Retrieved from: http://gst.customs.gov.my/en/Pages/default.aspx
Oxford Dictionaries (2015) English Language-Theory Retrieved from
http://www.oxforddictionaries.com/ms/definisi/bahasainggeris/theory?searchD
ictCode=all
Palil, M.R. & Ibrahim, M.A. (2011).The Impacts of Goods and Services Tax (GST) on
Middle Income Earnests in Malaysia.World Review of Business Research .Vol.
1.No. 3. July 2011. 192-206. Retrieved from http://www.wbiconpro.com/213-
Rizal.pdf
Palil, M.R. (2010). Tax knowledge and tax compliance determinants in self-
assessment system in Malaysia.Thesis submitted to University of Birmigham
Paris, H., and S. V. Broucke (2008).Measuring Cognitive Determinants of Speeding:
An Application of the Theory of Planned Behavior.Transportation Research
Part F: Traffic Psychology and Behavior. 11(3) 168-180.

158
Podsakoff, P. M., Mackenzie, S. B., Lee, J. Y., &Podsakoff, N. P. (2003). Common
method biases in behavioural research: a critical review of the Literature and
Recommended Remedies. Journal of Applied Psychology, 88(5), 879-903.
Raghuram, S., Wiesenfeld, B.M. and Garud, R. (2003). Technology enabled work: the
role of self-efficacy in determining telecommuter adjustment and structuring
behavior. Journal of Vocational Behavior.63, 180-98.
Ramalingam, L., Noor, N.F.M. &Azmi, A.A.C. (2014).The Unified Theory of
Acceptance and Use of Technology (UTAUT) and the Goods and Service Tax
(GST) Application System.Research Journal of Applied Sciences, Engineering
and Technology 8(17), 1911-1916. Retrieved from:
http://www.maxwellsci.com/print/rjaset/v8-1911-1916.pdf
Richardson, G. (2005a). A Preliminary Study of the Impact of Tax Fairness
Perception Dimensions on Tax Compliance Behaviour in Australia.Australian
TaxForum.20(3): 407-434.
Richardson, M., & Sawyer, A. (2001).A taxonomy of the tax compliance literature:
Further findings, problems and prospects. Australian Tax Forum. 16(2), 137-
320.

159
Rosipal, R., & Kramer, N. (2006).Overview and Recent Advances in Partial Least
Squares. In. Craig Saunders C, Grobelnik M, Gunn J, Shawe-Taylor J,
eds.Subspace, Latent Structure and Feature Selection: Statistical and
Optimization Perspectives Workshop (SLSFS 2005). New York: Springer-
Verlag; 2006, 34-51.
Royal Malaysian Customs (2013) ‘Malaysia Goods and Services Tax – Guide on
Supply’ Retrieved from:http://gst.customs.gov.my/en/rg
/SiteAssets/industry_guides_pdf/GST%20GUIDE%20ON%20SUPPLY%20Fi
nal%20Draft%202013%20050613%20G5%20PARA%20Treatment.pdf
Royal Malaysian Customs Department- Malaysia Goods & Services Tax (GST).
(2013, February 15) GST Guide- General. Retrieved from
http://gst.customs.gov.my/en/rg/Pages /rg_gen.aspx
Saad, N. (2010). Fairness Perceptions and Compliance Behaviour: The Case of
Salaried Taxpayers in Malaysia after Implementation of the Self-Assessment
System eJournal of Tax Research Volume 8, Number 1 32-63 Retrieved from
http://www.austlii.edu.au/au/ journals/eJTR/2010/3.pdf
Saad, N. (2014) Tax Knowledge, Tax Complexity and Tax Compliance: Taxpayers’
View Procedia - Social and Behavioral Sciences, 109, 1069 – 1075 Retrieved
from: http://ac.els-cdn.com/S1877042813052294/1-s2.0-S1877042813052294
main.pdf?_tid=b496988a-f0e2-11e4-98ee00000aab0f6b&acdnat=1430581901
_f3d07e276f21d53cbd25007f4c507887
160
Saira, L., M.A., Zariyawati, M.Am& Yoke-May, L. (2010). An exploratory study of
goods and services tax awareness in Malaysia.Political Managements and
Policies in Malaysia.Universiti Utara Malaysia Sintok, 265-276. Retrieved
from http://core.ac.uk/download/pdf/12118568.pdf
Salancik, G. and Pfeffer, J. (1978).The External Control of Organisations. New York,
NY. Harper & Row.
Santos, J. R. A (1999). Cronbach’s Alpha: A Tool for Assessing the Reliability of
Scales. Journal of Extension.37 (2). Retrieved from
http://www.joe.org/joe/1999april/tt3.php
Sarina,I., Haron,H., Ismail,I. &Vinten,G. (2007) Factors Influencing Auditors
Acceptance of the Practice Review System. Asian Academy of Management
Journal.Vol. 12(2) 57–82
Schmidt,D. &Karsten,R.(2015). Self-efficacy and Tax Research
Performance. Advances in Taxation. 17, 121-140. Retrieved from
http://dx.doi.org/10.1016/S1058-7497(06)17005-2
Seidl,C. &Traub, S. (2001).Taxpayers’ attitudes, behavior, and perception of fairness.
Pacific Economic Review. 6(2), 255-267 DOI: 10.1111/1468-0106.00131

161
Sekaran, U. (2000). Research Methods for Business: A Skill -Building Approach
(3ed.). New York: John Wiley & Sons, Inc
Sekaran, U. (2003). Research methods for business (4th
ed.). Hoboken, NJ: John Wiley
& Sons.
Sekaran, U. and Bougie, R. (2010).Research Methods for Business; A Skill Building
Approach. 5th Ed. New York: John Wiley and Sons.
Shamsuddin, A., Ruslan, M.I.M., Halim, A.A., Zahari,N.F. &Fazi, N.F.M. (2014).
Educators’ Awareness And Acceptance Towards Goods And Services Tax
(Gst) Implementation In Malaysia: A Study In Bandar Muadzam Shah,
Pahang. International Journal of Business, Economics and Law. Vol 4 (1) 1-10
Retrieved from http://ijbel.com/wp-content/uploads/2014 /06/KLB4103-
Amanuddin-Muhammad-Ishfaq-Afifah-Nur-
FatinEDUCATORS%E2%80%99-AWARENESS-AND-ACCEPTANCE.pdf
Shimp,T. and Kavas,A. (1984). The Theory of Reasoned Action Applied to computer
usage. Journal of Consumer Research. 15, 325-343.
Shin, H., Collier, D.A., & Wilson, D.D. (2000). Supply management orientation and
supplier or buyer performance. Journal of operations management, 18, 317-
333.

162
Siahaan, F.O.P. (2012). The Influence of Tax Fairness and Communication on
Voluntary Compliance: Trust as an Intervening Variable. International Journal
of Business and Social Science. 3(21) 191-198 Retrieved from
http://ijbssnet.com/journals/Vol_3_No_21_November_2012/20.pdf
Singh V (2003). Malaysian Tax Administration. 6th ed. Kuala Lumpur: Longman
Singh, V. (1999).Malaysian Tax Administration. 4th ed. Kuala Lumpur: Longman.
Singh, V. (2013, October 27) Budget 2014: Bold and Yet Cautious? theSundaily
Retrieved from http://www.thesundaily.my/news/866620
Sommer,L. (2011). The Theory Of Planned Behaviour And The Impact Of Past
Behaviour. International Business & Economics Research Journal. Volume
10 (1) 91-110
Sparks,P., Gothrie,C.A. &Shepherd,R. (1997). The dimensional structure of the
perceived behavioral control construct.Journal of Applied Social Psychology.
27, 418-438
Tan, L. M., & Chin-Fatt, C. (1999).The Impact of Tax Knowledge on the Perceptions
of Tax Fairness and Attitudes towards Compliance.Massey University,
Department of Accountancy and Business Law.

163
Tan,B. (2014, May 16) Umno Youth to assist the government in explaining about
GST NewStraitTimes Retrieved from: http://www.nst.com.my/latest/umno-
youth-to-assist-the-government-in-explaining-about-gst-1.598731
Tan, E. (2009) What Malaysian consumers want TheEdge Retrieved from:
http://www.theedgemalaysia.com/media-a-advertising/146966-what-
malaysian-consumers-want.html
Tay, A. (2001). Management's perception of MBA graduates in Malaysia. Journal of
Management Development. 20(3), 258-274
Taylor, S., & Todd, P. (1995).Assessing it usage: the role of prior
experience.Management Information Systems Quarterly. 19(3), 561–570.
Tenenhaus, M., Vinzi, V. E., Chatelin, Y. M., Lauro, C. (2005).PLS path
modelling.Computational Statistics & Data Analysis, 48, 159-205.
Teo,T. & Lee, C.B. (2010). Explaining the intention to use technology among student
teachers.Campus-Wide Information Systems. 27(2), 60 – 67 Doi
10.1108/10650741011033035
Tetrick, L.E. and Larocco,J.M (1987). Understanding, prediction, and control as
moderators of the relationships between perceived stress, satisfaction, and
psychological well-being. Journal of Applied Psychology.72, 538-43.

164
The Malaysian Insider (2014, April 20) ‘Putrajaya to spend RM1.66 million in 2 months to
brief public on GST’ Retrieved from: http://www.themalaysianinsider.com/malaysia/article
/government-to-spend-rm1.66-million-in-2-months-to-brief-public-on-gst
The Star Online (2014, May 1) Thousands at May Day rally against GST’ Retrieved
from http://www.thestar.com.my/News/Nation/2014/05/01/May-Day-anti-
GST-rally-Kuala-Lumpur/
Thomas,C. (2012). Assessing Tax Fairness Dimensions in a Small Developing
Economy.Business and Economics Journal. 62.
Trevino, L. (1986). Ethical decision making in organizations: A person-situation
Interactionist model. Academy of Management Review, 601–617.
Trivedi, U.V., Shehata, M. &Mestelman, S.(2005) Attitudes, Incentives, and Tax
Compliance. Canadian tax journal. vol. 53, no 1
Turman, G. T. (1995). Perceptions of Vertical Equity and Noncompliant Income Tax
Behaviour: An Experimental Test of Inequity Theory. Unpublished PhD thesis.
Virginia Commonwealth University, Virginia.
Vijayasarathy L.R. (2003). Predicting consumer intentions to use on-line shopping:
the case for an augmented technology acceptance model.Information and
Management.

165
Voon, S. (2013) GST: Good or Bad?TheEdge Retrieved from
http://www.theedgemalaysia.com/personal-finance/257920-gst-good-or-
bad.html
Voorhis, W.V. & Morgan, C.R. (2007). Understanding Power and Rules of Thumb
for determining sample sizes. Tutorials in Quantitative Methods for
Psychology. 3(2), 43-50.
Wan,C., Cheung,R., Shen, G.Q. (2012). Recycling attitude and behaviour in university
campus: a case study in Hong Kong.Facilities. Vol. 30 (13/14) 630 - 646
Doi: 10.1108/02632771211270595
Why Do People Find It Hard To Accept GST If It Really Is Beneficial? (2015,
November 28) GST Malaysia Info. Retrieved from
http://gstmalaysiainfo.com/people-find-hard-accept-gst-really-beneficial/
Wold, H. (1980).Model construction and evaluation when theoretical knowledge is
scarce.In J. Kmenta, & J. B. Ramsey (Eds.).Evaluation of econometric
models.47–74.
Xavier,J.A. (2013,October 29) Will GST increase govt revenue? New Strait
TimesOnline Retrieved from http://www.nst.com.my/opinion/columnist/will-gst-
increase-govt-revenue-1.387243

166
Zamhari,A. (2014, April 10) Think tank: Middle-class biggest losers with GST.
MalaysiaKini. Retrieved from http://www.malaysiakini.com/news/259644
Zikmund, W. G. (2003). Business Research Method (8th ed.). Cincinnati, Ohio:
Thomson/South-Western.

167
APPENDIX A
ECONOMIC REPORT 2010-2014 - FEDERAL GOVERNMENT REVENUE

168
APPENDIX B
ECONOMIC REPORT 2010-2014 - FEDERAL GOVERNMENT FINANCE

169
APPENDIX C
RESULTS OF MERDEKA CENTRE SURVEY ON GST

170

171

172

173

174

175

176
APPENDIX D – QUESTIONNAIRE
31 January 2015
Dear Sir/Madam,
FACTORS INFLUENCING CONSUMERS’ LEVEL OF ACCEPTANCE WITH
GOODS & SERVICES TAX (GST)
I am conducting a research on the above topic as part of the requirement for my Masters in
Business Administration programme with the Graduate School of Business, UniversitiSains
Malaysia. The main objective of the research is to gather your perceptions on the Goods &
Services Tax (GST) which will be implemented in Malaysia from 1st April 2015. Even
though our government has made a decision to implement GST, we would like to gather your
level of acceptance or agreement with it.
The questionnaire would take only about 15 minutes of your time and it would contribute
significantly to the success of this research. Strict confidentiality is assured.
For any queries on the research, you can email me, Shalene at [email protected] or call
at 016-4178005.
If you are interested in the findings of this research, kindly note down your email address at
the bottom of the filled questionnaire. The summary of the findings will be e-mailed to you.
I would like to thank you in advance for your kind support and participation.

177
Yours Sincerely,
--------------------------------- ------------------------------- -------------------------------
(ShaleneKalyanasundaram) (Professor HasnahHaron) (DrYulitaHanumIskandar)
MBA Student Supervisor Co-Supervisor

178
Dear Respondents,
There are FIVE sections in the questionnaire, Section A to Section E. Kindly answer all
sections.
SECTION A: Demographic Profile
Please tick on the box which fits your profile.
1. Age
18-25 41-60
26-40 61 and above
2. Gender
Male Female
3. Nationality
Malaysian Others
4. Current Level of Education
Diploma Others
Pre- University Please specify:
__________________
Undergraduate
Postgraduate

179
5. Please indicate the programme that you are enrolled in
MBA Others
Please specify:
________________________
DBA
PhD
6. Please indicate your mode of study
Full Time
Part Time
7. If your response to No. 5 is MBA, please indicate the following:
Institute
8. If your response to Question 6 is part time, please indicate whether you are (You can
tick more than one):
Self-employed Working in an organization
Owner of Business Unemployed

180
9. If your response to No. 8 was “Working in an Organization”, please indicate your
position level:
Top Management (CEO, President, General Manager)
Finance/ Accounts Manager
Marketing/Sales Manager
Technical/Operations Manager
Others
Please Specify: _________________________________
10. Income Level
RM 1000 – RM 5000 RM 10001 – RM 15000
RM 5001 – RM 10000 > RM 15001

181
SECTION B
Goods and Services Tax (GST) will be implemented in Malaysia on 1st April 2015. GST is a
consumption tax based on value-added concept. It is a multi-stage tax and is imposed on all
goods and services except for those exempted.
Please read each statement carefully and indicate your degree of agreement with it by
circling the appropriate number on the 5- point scale given below. Please give your
honest opinion.
1 2 3 4 5
Strongly Disagree Neutral Agree Strongly
Disagree (D) (N) (A) Agree
(SD) (SA)
(i) Rule Observance Behaviour
Rule observance behavior relates to obedience to authority.
Statements SD D N A SA
1 I always stick to the letter of
rules
1 2 3 4 5
2 I always check to see that I am
following rules
1 2 3 4 5
3 I expect others to follow rules 1 2 3 4 5
4 I have to follow strict rules at all
times
1 2 3 4 5
5 I belief rules lead to
improvement
1 2 3 4 5

182
(ii) Perception of tax fairness
Fairness perception is the judgement of individuals that something or someone is free of
biasness and injustice
Statements SD D N A SA
1 I believe the government utilizes a reasonable amount of
tax revenue to achieve social goals, such as the provision
of benefits for low-income families.
1 2 3 4 5
2 I believe everyone pays their fair share of tax under the
proposed GST system
1 2 3 4 5
3 I think the government spends sufficient tax revenue
onnecessary welfare assistance.
1 2 3 4 5
4 I will receive fair value from the government in return
for my GST paid
1 2 3 4 5
5 It is fair that low-income earners receive more benefits
from the government compared to high-income earners.
1 2 3 4 5
6 The GST that I have to pay isfair considering the
benefits I receive from the government. 1 2 3 4 5
(iii)Attitude
Attitude is an individual’s positive and negative feelings about performing a target behavior.
The feelings are brought about after evaluations conducted based on beliefs.
Statements SD D N A SA
1. GST is a good implementation for the improvement of
the country
1 2 3 4 5
2. GST is a wise decision for the country and its Citizens 1 2 3 4 5
3. I am willing to pay taxes as it would help my country. 1 2 3 4 5
4. I would feel guilty if I do not accept the implementation
of GST
1 2 3 4 5
5. I am comfortable with the implementation of GST 1 2 3 4 5
(iv) Subjective Norm
Subjective Norm is the individual’s perception that most people who are important to
him/her think he/she should not perform the behavior in question.
Statements SD D N A SA
1. My peers would think that I should accept GST 1 2 3 4 5
2. My peers would accept GST 1 2 3 4 5
3. My family members would think that I should accept
GST
1 2 3 4 5
4. My family members would accept GST 1 2 3 4 5

183
5. I am very particular of what my peers and family think
of me
1 2 3 4 5
(v) Self-Efficacy
Self-efficacy is defined as people’s judgments of their capabilities to organize and execute
courses of action required to attain designated types of performances.
Statements SD D N A SA
1. I would be able to manage my finances even with the
implementation of GST
1 2 3 4 5
2. I will be able to manage consumption in order to avoid
my GST burden
1 2 3 4 5
3. I believe in my ability to spend within my means even
with implementation of GST.
1 2 3 4 5
4. Managing my expenditure is not a problem for me 1 2 3 4 5
(vi) Perceived Behavioral Control
Perceived behavioral control is the perceived internal and external constraints on behavior
or intention to behave
Statements SD D N A SA
1. It is easy for me to accept GST 1 2 3 4 5
2. There are no barriers that would prevent me from
accepting GST
1 2 3 4 5
3 I have no problems in accepting GST 1 2 3 4 5
(vii) Level of Acceptance
Level of Acceptance refers to the level of intention to accept
Please note that acceptance of GST refers to your level of agreement that GST should
be implementedand not your act of paying GST.
Statements SD D N A SA
1. I intend to accept GST 1 2 3 4 5
2. I intend to help others accept GST 1 2 3 4 5

184
SECTION C(with marks stated – Correct Answer : 1 ; Wrong Answer : 0)
Please read each statement carefully and indicate your degree of agreement with it by
circling either
1 (YES) or 2 (NO).
(viii) Level of Tax Knowledge
No Questions YES NO
1 The GST is a legitimate way for the government to collect revenue to
manage an economy
1 0
2 The GST is tax based on consumption and not income 1 0
3 The GST is not a new tax, it is to replace the Sales & Service Tax
(SST)
1 0
4 Companies earning RM 500,000 per annum/year is subjected to the
collection of GST
1 0
5 GST will be implemented from 1st January 2016 0 1
6 A standard rated product will be imposed with 5% GST. 0 1
7 The three categories of products is Zero-rated, Standard rated and
Exempt-rated
1 0
8 I will be paying the same amount of tax under GST for professional
services because I initially had to pay 6% service tax for the service
1 0
9 I do not have to pay GST for zero rated and exempted products 1 0
10 There is no difference between zero-rated and exempt rated products 0 1
SECTION D(with marks stated – Correct Answer : 1 ; Wrong Answer : 0)
This section provides you with 5 short scenarios.
Pleasereadthescenarioscarefullyandtickyourchoiceofanswer in Part A (oneansweronly)
withregardstotheGoods/Servicescategoryandtickyourchoiceofanswer in Part B
(oneansweronly), withregardstothetaxratefortheGoods/Servicescategorythat you
haveticked in Part A.
Part A : Goods/ Servicessupplycategoryindicatingwhethertheproduct/service in
thescenarioissubjectedtostandard-rated GST, zero-rated GST or isexemptrated.
Part B : Thetaxratethattheproducts/serviceswill be subjectedto ; None, 0% or 6%

185
SECTION E
Kindly provide us with your views and comments on the statements and questions posed
below.
1. Your views on other government initiatives that can be taken to lessen the
burden of GST. Amongst the current initiatives are the distribution of Bantuan
Rakyat 1 Malaysian (BRIM) and reduction of income tax percentage for
individuals.
_____________________________________________________________________
_____________________________________________________________________
_____________________________________________________________________
_____________________________________________________________________
____________________________________________________________________
2. ‘Government initiatives should encompass all groups of people and not only to
low income group’. Your views on the above statement.
Scenarios Part A Part B
Goods/Servicessupplycategory Taxrate
Standard
rated
Zero rated Exempt
rated
6% 0% None
En Mat had an accidentand had
toundergosurgery in a localprivate hospital.
Theserviceprovidedbythe hospital tohimis:
0 0 1 0 0 1
AuntyLimwenttothebookstoretobuyherthre
edaughtersrevisionbooksfortheirschoolsubj
ects.
Thebooksboughtareunderthecategoryof :
0 1 0 0 1 0
MrLingambrought his
familyoutfordinnertohavethefamous
‘Penang FriedChicken’.
Thefriedchickenwill be:
1 0 0 1 0 0
Swee An wenttothemarkettobuy 2
kilogramsofchicken. Thechickenwill be: 0 1 0 0 1 0
Markbrought his
familyforChristmasshoppingat a
clothingstore. Theclothesare:
1 0 0 1 0 0

186
_____________________________________________________________________
_____________________________________________________________________
_____________________________________________________________________
_____________________________________________________________________
____________________________________________________________________
3. In your opinion, who will be affected most by the implementation of GST in
Malaysia. Why?
_____________________________________________________________________
_____________________________________________________________________
_____________________________________________________________________
_____________________________________________________________________
____________________________________________________________________
_____________________________________________________________________
4. In your opinion, will there be an increase in price with the implementation of
GST? Why?
_____________________________________________________________________
_____________________________________________________________________
_____________________________________________________________________
_____________________________________________________________________
____________________________________________________________________
_____________________________________________________________________
5. Other Comments
_____________________________________________________________________
_____________________________________________________________________
_____________________________________________________________________
_____________________________________________________________________
____________________________________________________________________
_____________________________________________________________________
THANK YOU FOR YOUR PARTICPATION

187
APPENDIX E –PLS ALGORITHM REPORT (PILOT STUDY)
Cronbachs Alpha
Model 1
Model 2
Model 3
Cronbachs Alpha
ATT 0.898
PTF 0.920
ROB 0.848
Cronbachs Alpha
LTK 1.000
PBC 0.878
SE 0.833
Cronbachs Alpha
ATT 0.898
BI 0.868
LTK 1.000
PBC 0.878
PTF 0.920
ROB 0.848
SE 0.833
SN 0.885

188
APPENDIX F –PLS ALGORITHM REPORT
MODEL 1
Path Coefficients
ATT PTF ROB
ATT
PTF 0.550
ROB 0.256
Outer Loadings
ATT PTF ROB
ATT1 0.932
ATT2 0.925
ATT3 0.752
ATT4 0.819
ATT5 0.886
PTF1 0.897
PTF2 0.837
PTF3 0.501
PTF4 0.918
PTF5 0.689
PTF6 0.592
ROB1 0.897
ROB2 0.905
ROB3 0.825
ROB4 0.808
ROB5 0.809

189
R Square
Average Variance Extracted (AVE)
AVE
ATT 0.749
PTF 0.571
ROB 0.722
R Square
ATT 0.499 R Square Adjusted
R Square
ATT 0.494

190
Composite Reliability
Cronbachs Alpha
Cronbachs Alpha
ATT 0.915
PTF 0.839
ROB 0.903
Discriminant Validity
Fornell-Larcker Criterion
ATT PTF ROB
ATT 0.866
PTF 0.668 0.756
ROB 0.510 0.462 0.850
Composite Reliability
ATT 0.937
PTF 0.884
ROB 0.928

191
MODEL 2
Path Coefficients LTK PBC SE
LTK 0.129
PBC
SE 0.509
Outer Loadings LTK PBC SE
LTK 1.000
PBC1 0.950
PBC2 0.870
PBC3 0.931
SE1 0.867
SE2 0.824
SE3 0.854
SE4 0.799
R Square
R Square
PBC 0.281
R Square Adjusted

192
R Square
PBC 0.275
Average Variance Extracted (AVE) AVE
LTK 1.000
PBC 0.842
SE 0.699
Composite Reliability
Composite Reliability
LTK 1.000
PBC 0.941
SE 0.903

193
Cronbachs Alpha Cronbachs Alpha
LTK 1.000
PBC 0.907
SE 0.858
Discriminant Validity Fornell-Larcker Criterion
LTK PBC SE
LTK 1.000
PBC 0.151 0.917
SE 0.043 0.514 0.836
MODEL 3
Outer Loadings (Before removal of SN5)
ATT LA LTK PBC PTF ROB SE SN
ATT1 0.931
ATT2 0.923
ATT3 0.748
ATT4 0.825
ATT5 0.889
LA1 0.961
LA2 0.948
LTK 1.000
PBC1 0.950
PBC2 0.873
PBC3 0.928
PTF1 0.897
PTF2 0.837

194
PTF3 0.501
PTF4 0.918
PTF5 0.689
PTF6 0.592
ROB1 0.897
ROB2 0.904
ROB3 0.825
ROB4 0.808
ROB5 0.809
SE1 0.867
SE2 0.824
SE3 0.854
SE4 0.799
SN1 0.855
SN2 0.648
SN3 0.642
SN4 0.892
SN5 0.489
Path Coefficients (After removal of Sn5) ATT LA LTK PBC PTF ROB SE SN
ATT 0.570
LA
LTK 0.128
PBC 0.243
PTF 0.548
ROB 0.257
SE 0.508
SN 0.100

195
Outer Loadings (After removal of SN5) ATT LA LTK PBC PTF ROB SE SN
ATT1 0.931
ATT2 0.923
ATT3 0.748
ATT4 0.825
ATT5 0.889
LA1 0.961
LA2 0.948
LTK 1.000
PBC1 0.950
PBC2 0.873
PBC3 0.929
PTF1 0.897
PTF2 0.837
PTF3 0.501
PTF4 0.918
PTF5 0.689
PTF6 0.592
ROB1 0.897
ROB2 0.904
ROB3 0.825
ROB4 0.808
ROB5 0.809
SE1 0.867
SE2 0.824
SE3 0.854
SE4 0.799
SN1 0.850
SN2 0.676
SN3 0.669
SN4 0.884
R Square R Square
ATT 0.496
LA 0.732
PBC 0.280

196
R Square Adjusted
R Square
ATT 0.491
LA 0.728
PBC 0.273
Average Variance Extracted (AVE) AVE
ATT 0.750
LA 0.911
LTK 1.000
PBC 0.842
PTF 0.571
ROB 0.722
SE 0.699
SN 0.602

197
Composite Reliability
Composite Reliability
ATT 0.937
LA 0.954
LTK 1.000
PBC 0.941
PTF 0.884
ROB 0.928
SE 0.903
SN 0.856
Cronbachs Alpha Cronbachs Alpha
ATT 0.915
LA 0.903
LTK 1.000
PBC 0.907
PTF 0.839
ROB 0.903
SE 0.858
SN 0.781

198
Discriminant Validity
Fornell-Larcker Criterion
ATT LA LTK PBC PTF ROB SE SN
ATT 0.866
LA 0.833 0.955
LTK 0.311 0.372 1.000
PBC 0.793 0.772 0.150 0.918
PTF 0.666 0.666 0.216 0.607 0.756
ROB 0.509 0.533 0.192 0.452 0.461 0.850
SE 0.486 0.390 0.043 0.513 0.319 0.249 0.836
SN 0.698 0.683 0.127 0.757 0.619 0.478 0.304 0.776

199
APPENDIX G – BOOTSTRAPPING PLS REPORT
MODEL 1
Path Coefficients
Mean, STDEV, T-Values, P-Values
Original Sample (O)
Sample Mean (M)
Standard Error (STERR)
T Statistics (|O/STERR|)
P Values
PTF -> ATT 0.550 0.551 0.054 10.280 0.000
ROB -> ATT 0.256 0.256 0.067 3.853 0.000
Outer Loadings Mean, STDEV, T-Values, P-Values
Original Sample (O)
Sample Mean (M)
Standard Error (STERR)
T Statistics (|O/STERR|)
P Values
ATT1 <- ATT 0.932 0.932 0.009 101.798 0.000
ATT2 <- ATT 0.925 0.926 0.013 70.915 0.000
ATT3 <- ATT 0.752 0.753 0.046 16.387 0.000
ATT4 <- ATT 0.819 0.819 0.033 24.716 0.000
ATT5 <- ATT 0.886 0.887 0.020 45.373 0.000
PTF1 <- PTF 0.897 0.897 0.015 59.627 0.000
PTF2 <- PTF 0.837 0.836 0.023 36.395 0.000
PTF3 <- PTF 0.501 0.503 0.079 6.324 0.000
PTF4 <- PTF 0.918 0.918 0.012 75.332 0.000
PTF5 <- PTF 0.689 0.688 0.044 15.735 0.000
PTF6 <- PTF 0.592 0.590 0.080 7.391 0.000
ROB1 <- ROB 0.897 0.896 0.023 38.466 0.000
ROB2 <- ROB 0.905 0.903 0.018 49.252 0.000
ROB3 <- ROB 0.825 0.821 0.033 25.138 0.000

200
ROB4 <- ROB 0.808 0.809 0.025 32.900 0.000
ROB5 <- ROB 0.809 0.804 0.042 19.460 0.000
MODEL 2
Path Coefficients Mean, STDEV, T-Values, P-Values
Original Sample (O)
Sample Mean (M)
Standard Error (STERR)
T Statistics (|O/STERR|)
P Values
LTK -> PBC 0.129 0.132 0.057 2.272 0.024
SE -> PBC 0.509 0.515 0.050 10.117 0.000
Outer Loadings Mean, STDEV, T-Values, P-Values
Original Sample (O)
Sample Mean (M)
Standard Error (STERR)
T Statistics (|O/STERR|)
P Values
LTK <- LTK 1.000 1.000 0.000
PBC1 <- PBC 0.950 0.950 0.010 90.954 0.000
PBC2 <- PBC 0.870 0.868 0.038 22.635 0.000
PBC3 <- PBC 0.931 0.932 0.011 87.608 0.000
SE1 <- SE 0.867 0.867 0.020 43.119 0.000
SE2 <- SE 0.824 0.823 0.030 27.397 0.000
SE3 <- SE 0.854 0.852 0.033 26.156 0.000
SE4 <- SE 0.799 0.798 0.041 19.274 0.000

201
MODEL 3
Path Coefficients Mean, STDEV, T-Values, P-Values
Original Sample (O)
Sample Mean (M)
Standard Error (STERR)
T Statistics (|O/STERR|)
P Values
ATT -> LA 0.570 0.574 0.061 9.379 0.000
LTK -> PBC 0.128 0.128 0.056 2.304 0.022
PBC -> LA 0.243 0.236 0.076 3.207 0.001
PTF -> ATT 0.548 0.555 0.053 10.422 0.000
ROB -> ATT 0.257 0.252 0.059 4.361 0.000
SE -> PBC 0.508 0.509 0.052 9.792 0.000
SN -> LA 0.100 0.105 0.062 1.625 0.105
Outer Loadings Mean, STDEV, T-Values, P-Values
Original Sample (O)
Sample Mean (M)
Standard Error (STERR)
T Statistics (|O/STERR|)
P Values
ATT1 <- ATT 0.931 0.931 0.010 93.594 0.000
ATT2 <- ATT 0.923 0.923 0.014 66.727 0.000
ATT3 <- ATT 0.748 0.745 0.047 15.881 0.000
ATT4 <- ATT 0.825 0.823 0.033 24.663 0.000
ATT5 <- ATT 0.889 0.889 0.018 48.547 0.000
LA1 <- LA 0.961 0.962 0.005 181.620 0.000
LA2 <- LA 0.948 0.947 0.012 78.141 0.000
LTK <- LTK 1.000 1.000 0.000
PBC1 <- PBC 0.950 0.950 0.010 91.050 0.000
PBC2 <- PBC 0.873 0.873 0.033 26.446 0.000
PBC3 <- PBC 0.929 0.929 0.011 85.535 0.000
PTF1 <- PTF 0.897 0.898 0.015 59.512 0.000
PTF2 <- PTF 0.837 0.836 0.024 34.524 0.000
PTF3 <- 0.501 0.495 0.082 6.149 0.000

202
PTF
PTF4 <- PTF 0.918 0.919 0.012 78.190 0.000
PTF5 <- PTF 0.689 0.688 0.045 15.375 0.000
PTF6 <- PTF 0.592 0.587 0.080 7.404 0.000
ROB1 <- ROB 0.897 0.895 0.023 39.664 0.000
ROB2 <- ROB 0.904 0.903 0.017 53.435 0.000
ROB3 <- ROB 0.825 0.822 0.031 26.963 0.000
ROB4 <- ROB 0.808 0.808 0.025 31.928 0.000
ROB5 <- ROB 0.809 0.805 0.039 20.636 0.000
SE1 <- SE 0.867 0.866 0.018 48.809 0.000
SE2 <- SE 0.824 0.822 0.032 26.130 0.000
SE3 <- SE 0.854 0.850 0.033 25.923 0.000
SE4 <- SE 0.799 0.797 0.042 19.247 0.000
SN1 <- SN 0.850 0.854 0.025 34.663 0.000
SN2 <- SN 0.676 0.669 0.077 8.819 0.000
SN3 <- SN 0.669 0.664 0.078 8.580 0.000
SN4 <- SN 0.884 0.886 0.018 48.018 0.000

203
APPENDIX H – IBM SPSS STATISTICS REPORT
APPENDIX H -1:Frequencies of Demographics
Statistics
Age Gender Nationality Education Programme Mode
N Valid 228 228 228 228 228 228
Missing 0 0 0 0 0 0
Institution Employment Position Income
N Valid 228 228 228 228
Missing 0 0 0 0
Frequency Table
Age
Frequency Percent Valid Percent
Cumulative
Percent
Valid 18-25 9 3.9 3.9 3.9
26-10 210 92.1 92.1 96.1
41-60 9 3.9 3.9 100.0
Total 228 100.0 100.0

204
Gender
Frequency Percent Valid Percent
Cumulative
Percent
Valid Male 106 46.5 46.5 46.5
Female 122 53.5 53.5 100.0
Total 228 100.0 100.0
Nationality
Frequency Percent Valid Percent
Cumulative
Percent
Valid Malaysian 228 100.0 100.0 100.0
Education
Frequency Percent Valid Percent
Cumulative
Percent
Valid Postgraduate 228 100.0 100.0 100.0
Programme
Frequency Percent Valid Percent
Cumulative
Percent
Valid MBA 228 100.0 100.0 100.0

205
Mode
Frequency Percent Valid Percent
Cumulative
Percent
Valid Full Time 32 14.0 14.0 14.0
Part Time 196 86.0 86.0 100.0
Total 228 100.0 100.0
Institution
Frequency Percent Valid Percent
Cumulative
Percent
Valid UniversitiSains Malaysia 86 37.7 37.7 37.7
UniversitiKebangsaan
Malaysia
48 21.1 21.1 58.8
Universiti Malaya 43 18.9 18.9 77.6
Universiti Putra Malaysia 51 22.4 22.4 100.0
Total 228 100.0 100.0
Employment
Frequency Percent Valid Percent
Cumulative
Percent
Valid Not Applicable 32 14.0 14.0 14.0
Self-Employed 8 3.5 3.5 17.5
Owner of Business 5 2.2 2.2 19.7
Working in an Organization 181 79.4 79.4 99.1

206
Unemployed 2 .9 .9 100.0
Total 228 100.0 100.0
Position
Frequency Percent Valid Percent
Cumulative
Percent
Valid Not Applicable 31 13.6 13.6 13.6
Top Management 3 1.3 1.3 14.9
Finance/ Accounts Manager 8 3.5 3.5 18.4
Marketing/ Sales Manager 24 10.5 10.5 28.9
Technical/ Operations
Manager
22 9.6 9.6 38.6
Others 140 61.4 61.4 100.0
Total 228 100.0 100.0
Income
Frequency Percent Valid Percent
Cumulative
Percent
Valid Not Applicable 31 13.6 13.6 13.6
RM 1000 - RM 5000 126 55.3 55.3 68.9
RM 5001- RM 10000 35 15.4 15.4 84.2
RM 10001 - RM 15000 33 14.5 14.5 98.7
> RM 15000 3 1.3 1.3 100.0

207
Income
Frequency Percent Valid Percent
Cumulative
Percent
Valid Not Applicable 31 13.6 13.6 13.6
RM 1000 - RM 5000 126 55.3 55.3 68.9
RM 5001- RM 10000 35 15.4 15.4 84.2
RM 10001 - RM 15000 33 14.5 14.5 98.7
> RM 15000 3 1.3 1.3 100.0
Total 228 100.0 100.0

208
APPENDIX H- 2 Total Variance Explained
Compone
nt
Initial Eigenvalues
Extraction Sums of
Squared Loadings
Rotation Sums of
Squared Loadings
Total
% of
Varian
ce
Cumulati
ve % Total
% of
Varian
ce
Cumulati
ve %
Tota
l
% of
Varian
ce
Cumulati
ve %
1 12.94
1
41.746 41.746
12.94
1
41.746 41.746
7.44
7
24.022 24.022
2
2.671 8.616 50.362 2.671 8.616 50.362
4.10
8
13.251 37.273
3
2.342 7.554 57.916 2.342 7.554 57.916
3.77
6
12.182 49.455
4
1.871 6.037 63.953 1.871 6.037 63.953
3.06
1
9.875 59.330
5
1.491 4.809 68.762 1.491 4.809 68.762
1.99
6
6.439 65.769
6
1.222 3.941 72.703 1.222 3.941 72.703
1.91
1
6.164 71.932
7
1.056 3.407 76.110 1.056 3.407 76.110
1.29
5
4.177 76.110
8 .780 2.515 78.625
9 .756 2.440 81.065
10 .579 1.867 82.932
11 .554 1.788 84.720
12 .495 1.597 86.317

209
13 .442 1.427 87.744
14 .416 1.342 89.086
15 .394 1.272 90.357
16 .361 1.164 91.522
17 .328 1.059 92.581
18 .319 1.028 93.609
19 .276 .891 94.500
20 .249 .804 95.304
21 .217 .699 96.003
22 .203 .653 96.657
23 .188 .606 97.263
24 .167 .540 97.803
25 .150 .482 98.286
26 .115 .370 98.656
27 .104 .337 98.993
28 .093 .299 99.292
29 .081 .262 99.554
30 .078 .252 99.807
31 .060 .193 100.000
Extraction Method: Principal Component Analysis.

210
APPENDIX H-3: Independent t- tests
GENDER
Group Statistics
Gender N Mean Std. Deviation Std. Error Mean
AveLA MALE 105 3.0762 1.09145 .10651
FEMALE 122 2.8279 1.05973 .09594
Independent Samples Test
Levene's Test
for Equality of
Variances t-test for Equality of Means
F Sig. t df
Sig.
(2-
tailed)
Mean
Difference
Std. Error
Difference
95% Confidence
Interval of the
Difference
Lower Upper
AveLA Equal
variances
assumed
.207 .650 1.736 225 .084 .24832 .14304 -.03354 .53018
Equal
variances not
assumed
1.732 217.922 .085 .24832 .14335 -.03422 .53086
MODE
Group Statistics
Mode N Mean Std. Deviation Std. Error Mean
AveLA FULL TIME 32 2.7031 1.08404 .19163
PART TIME 196 2.9847 1.07406 .07672
Independent Samples Test

211
Levene's Test for
Equality of
Variances t-test for Equality of Means
F Sig. t df
Sig. (2-
tailed)
Mean
Difference
Std. Error
Difference
95% Confidence
Interval of the
Difference
Lower Upper
AveLA Equal
variances
assumed
1.237 .267 -
1.373 226 .171 -.28157 .20505 -.68561 .12248
Equal
variances not
assumed
-
1.364 41.563 .180 -.28157 .20642 -.69827 .13513
APPENDIX H-4: One-Way ANOVA
INSTITUTION
Descriptives
AveLA
N Mean
Std.
Deviation Std. Error
95% Confidence Interval for
Mean
Minimum Maximum Lower Bound Upper Bound
USM 86 2.6977 .99493 .10729 2.4844 2.9110 1.00 5.00
UKM 48 2.8542 .96733 .13962 2.5733 3.1350 1.00 5.00
UM 43 2.8256 1.09590 .16712 2.4883 3.1628 1.00 5.00
UPM 51 3.5490 1.09661 .15356 3.2406 3.8574 1.00 5.00
Total 228 2.9452 1.07753 .07136 2.8046 3.0858 1.00 5.00
ANOVA
AveLA
Sum of Squares df Mean Square F Sig.
Between Groups 24.877 3 8.292 7.782 .000
Within Groups 238.688 224 1.066
Total 263.565 227

212
INCOME
Descriptives
AveLA
N Mean
Std.
Deviation Std. Error
95% Confidence Interval for
Mean
Minimum Maximum Lower Bound Upper Bound
.00 34 2.7353 1.06767 .18310 2.3628 3.1078 1.00 4.50
1.00 126 2.9405 1.16894 .10414 2.7344 3.1466 1.00 5.00
2.00 35 3.1143 .68691 .11611 2.8783 3.3502 2.00 4.50
3.00 33 3.0000 1.06800 .18592 2.6213 3.3787 1.50 5.00
Total 228 2.9452 1.07753 .07136 2.8046 3.0858 1.00 5.00
ANOVA
AveLA
Sum of Squares df Mean Square F Sig.
Between Groups 2.601 3 .867 .744 .527
Within Groups 260.964 224 1.165
Total 263.565 227


![The Drowsy Chaperone Program [2012] - USM Digital ...](https://static.fdokumen.com/doc/165x107/6322912f887d24588e044a66/the-drowsy-chaperone-program-2012-usm-digital-.jpg)