Highlight of important product characteristics for consumers. Comparison of three sensory...
12
Highlight of important product characteristics for consumers. Comparison of three sensory descriptive methods performed by consumers Bénédicte Veinand a,⇑ , Caroline Godefroy b , Christel Adam b , Julien Delarue c a Givaudan Schweiz AG, Winterthurerstrasse, CH-8310 Kemptthal, Switzerland b Givaudan France Arômes SAS, 55 rue de la voie des Bans BP24, F-95102 Argenteuil, France c Laboratoire de Perception Sensorielle et Sensométrie, AgroParisTech, 1 Avenue des Olympiades, F-91744 Massy Cedex, France article info Article history: Received 20 November 2008 Received in revised form 7 February 2011 Accepted 27 February 2011 Available online 3 March 2011 Keywords: Consumer vocabulary Descriptive analysis Method comparison Projective Mapping Flash Profile Repertory Grid abstract In consumer research, Repertory Grid is widely used in order to gain insights into consumer perception in a structured way and to link it to product characteristics. Flash Profile and Projective Mapping are two new sensory methods that can be conducted with consumers. This study aimed at comparing these three methods in order to get knowledge about how French consumers perceive the flavour of a range of lemon ice teas. Generalised Procustes Analysis and Multivariate Analysis of Variance allowed us to assess the correspondence between the sensory maps obtained with the three methods. Advantages and limits of each method are discussed. Besides, our results show that contrary to what is usually expected, sensory profiles performed by consumers lead to a predominant use of objective terms as well as a consensual use of a number of terms. This study thus opens perspectives for the development of descriptive analysis with consumer panels. Ó 2011 Elsevier Ltd. All rights reserved. 1. Introduction In sensory studies, consumer tests traditionally focus on the he- donic measure while the quantitative description of product sen- sory properties is carried out using sensory profiling techniques, normally with a trained group of subjects (see O’Mahony (1995) for a discussion of Sensory Evaluation II and of Consumer Research). For instance it is traditionally recommended during hedonic tests, not to ask consumers a sensory description of the evaluated product. It is also hazardous to ask them to rate optimal sensory characteristics they are looking for (e.g. using Just About Right scales) because such questions are known to bias the hedonic response (Popper, Rosenstock, Schraidt, & Kroll, 2004) which is usually the most important information to get from consumer tests in an industrial perspective. However, whenever time and budget constraints allow it, these sensory descriptive questions can be asked at the very end of the test or in a separate session. Although Husson, Le Dien, and Pagès (2001) and Worch, Lê, and Punter (2010) presented evidence that sensory profiles from con- sumers show fairly good consensus, reproducibility and discrimi- nation, it is frequently considered that descriptive analysis cannot be carried out with consumers. Several limitations may ex- plain this seldom use of consumer-based descriptive approaches: (1) The semantic interpretation of the consumer descriptive terms can be very complex because of the number and the diversity of generated terms. Because of the absence of train- ing, these terms are usually not linked with any specific def- initions or references. It thus makes it difficult to deduce a consensual use of terms (Sieffermann, 2000). Conversely, when a list of attributes is imposed to the consumers, there is no guarantee that they will understand these attributes in a similar way, and maybe not the way the experimenter thinks they will do. Examples of such sensory misunder- standings are common in flavour development. (2) When they freely describe a food product, consumers often use composite notions that may refer to benefits, which are consequences of consuming the product (e.g. thirst quenching, filling up) and that are usually mixed up with hedonic considerations. Therefore, it is usually hard for food developers to know how these concepts can be translated into specific product characteristics (Van Kleef, van Trijp, & Luning, 2005). (3) Another challenge is to avoid interviewers influencing asses- sors during the experiment. This influence may result of the history, the experience and the background of the interview- ers and can only be overcome by using specific methodolo- gies (Kelly, 1955). (4) At last, the analysis of large descriptive data sets has long been a breakdown in the use of consumer based descriptive 0950-3293/$ - see front matter Ó 2011 Elsevier Ltd. All rights reserved. doi:10.1016/j.foodqual.2011.02.011 ⇑ Corresponding author. Fax: +41 0 52354 06 99. E-mail address: [email protected] (B. Veinand). Food Quality and Preference 22 (2011) 474–485 Contents lists available at ScienceDirect Food Quality and Preference journal homepage: www.elsevier.com/locate/foodqual
-
Upload
agroparistech -
Category
Documents
-
view
0 -
download
0
Transcript of Highlight of important product characteristics for consumers. Comparison of three sensory...

Food Quality and Preference 22 (2011) 474–485
Contents lists available at ScienceDirect
Food Quality and Preference
journal homepage: www.elsevier .com/locate / foodqual
Highlight of important product characteristics for consumers. Comparisonof three sensory descriptive methods performed by consumers
Bénédicte Veinand a,⇑, Caroline Godefroy b, Christel Adam b, Julien Delarue c
a Givaudan Schweiz AG, Winterthurerstrasse, CH-8310 Kemptthal, Switzerlandb Givaudan France Arômes SAS, 55 rue de la voie des Bans BP24, F-95102 Argenteuil, Francec Laboratoire de Perception Sensorielle et Sensométrie, AgroParisTech, 1 Avenue des Olympiades, F-91744 Massy Cedex, France
a r t i c l e i n f o
Article history:Received 20 November 2008Received in revised form 7 February 2011Accepted 27 February 2011Available online 3 March 2011
Keywords:Consumer vocabularyDescriptive analysisMethod comparisonProjective MappingFlash ProfileRepertory Grid
0950-3293/$ - see front matter � 2011 Elsevier Ltd. Adoi:10.1016/j.foodqual.2011.02.011
⇑ Corresponding author. Fax: +41 0 52354 06 99.E-mail address: [email protected]
a b s t r a c t
In consumer research, Repertory Grid is widely used in order to gain insights into consumer perception ina structured way and to link it to product characteristics. Flash Profile and Projective Mapping are twonew sensory methods that can be conducted with consumers. This study aimed at comparing these threemethods in order to get knowledge about how French consumers perceive the flavour of a range of lemonice teas. Generalised Procustes Analysis and Multivariate Analysis of Variance allowed us to assess thecorrespondence between the sensory maps obtained with the three methods. Advantages and limits ofeach method are discussed. Besides, our results show that contrary to what is usually expected, sensoryprofiles performed by consumers lead to a predominant use of objective terms as well as a consensual useof a number of terms. This study thus opens perspectives for the development of descriptive analysis withconsumer panels.
� 2011 Elsevier Ltd. All rights reserved.
1. Introduction
In sensory studies, consumer tests traditionally focus on the he-donic measure while the quantitative description of product sen-sory properties is carried out using sensory profiling techniques,normally with a trained group of subjects (see O’Mahony (1995)for a discussion of Sensory Evaluation II and of ConsumerResearch). For instance it is traditionally recommended duringhedonic tests, not to ask consumers a sensory description of theevaluated product. It is also hazardous to ask them to rate optimalsensory characteristics they are looking for (e.g. using Just AboutRight scales) because such questions are known to bias the hedonicresponse (Popper, Rosenstock, Schraidt, & Kroll, 2004) which isusually the most important information to get from consumer testsin an industrial perspective. However, whenever time and budgetconstraints allow it, these sensory descriptive questions can beasked at the very end of the test or in a separate session.
Although Husson, Le Dien, and Pagès (2001) and Worch, Lê, andPunter (2010) presented evidence that sensory profiles from con-sumers show fairly good consensus, reproducibility and discrimi-nation, it is frequently considered that descriptive analysiscannot be carried out with consumers. Several limitations may ex-plain this seldom use of consumer-based descriptive approaches:
ll rights reserved.
(B. Veinand).
(1) The semantic interpretation of the consumer descriptiveterms can be very complex because of the number and thediversity of generated terms. Because of the absence of train-ing, these terms are usually not linked with any specific def-initions or references. It thus makes it difficult to deduce aconsensual use of terms (Sieffermann, 2000). Conversely,when a list of attributes is imposed to the consumers, thereis no guarantee that they will understand these attributes ina similar way, and maybe not the way the experimenterthinks they will do. Examples of such sensory misunder-standings are common in flavour development.
(2) When they freely describe a food product, consumers oftenuse composite notions that may refer to benefits, whichare consequences of consuming the product (e.g. thirstquenching, filling up) and that are usually mixed up withhedonic considerations. Therefore, it is usually hard for fooddevelopers to know how these concepts can be translatedinto specific product characteristics (Van Kleef, van Trijp, &Luning, 2005).
(3) Another challenge is to avoid interviewers influencing asses-sors during the experiment. This influence may result of thehistory, the experience and the background of the interview-ers and can only be overcome by using specific methodolo-gies (Kelly, 1955).
(4) At last, the analysis of large descriptive data sets has longbeen a breakdown in the use of consumer based descriptive

B. Veinand et al. / Food Quality and Preference 22 (2011) 474–485 475
analyses. Improved computer and software performancesmay now facilitate this step.
Alternatively, marketing and consumer research professionalsoften use qualitative techniques to try to understand consumers’perceptions and to find new gaps on the market. Among widelyused consumer research methods, focus groups can be quoted forthe large amount of semantic information they may provide. How-ever, their interpretation relies on the moderator’s expertise and afull objective analysis of the verbatim is tedious. Interestingly,Dransfield, Morrot, Martin, and Ngapo (2004) used computerisedtextual analysis in order to facilitate the interpretation of focusgroup outcome.
The Repertory Grid Method (RG) is another method that is usedin sensory consumer science with consumers in order to collectrelevant and understandable information about what consumersperceive (Andani, Jaeger, Wakeling, & Macfie, 2001; Russel & Cox,2004; Thomson & McEwan, 1988). This method is based on Kelly’sclinical psychological Theory of Personal Constructs (Kelly, 1955).The construct elicitation in Repertory Grid consists in presentingproducts randomly grouped in triads to participants and askingthem to describe with their own words how two products of eachtriad are alike or different from the third. Then they are told toscore the intensity of their own constructs for all the products.The Repertory Grid seems to be both efficient and easy to run, tosuch an extent that it can be used with children between 8 and11 years old (Baxter, Jack, & Schroder, 1998).
The recent development of quick sensory characterisation tech-niques somehow qualifies the dichotomy between qualitative con-sumer research and sensory profiling with trained panellists. Theuse of these new techniques has been attempted with consumers.These quick sensory methods are expected to be useful in order toask consumers to express and to quantify how they perceive foodproducts. Several attempts in this direction have been made for20 years. As suggested by Guy, Piggott, and Marie (1989) FreeChoice Profiling has been used with consumers (Delahunty,McCord, O’Neil & Morrissey, 1997; Deliza, MacFie, & Hedderley,2005; Elmore & Heymann, 1999; Jack & Piggott, 1991/2; Piggot,Paterson, Fleming, & Sheen, 1991/2; Thamke, Dürrschmid, & Rohm,2009). Because of their easiness of application, the Flash Profile(FP) and the Projective Mapping (PM) were also recently testedwith consumers (note that PM was used in the past with untrainedsubjects but not in a consumer research perspective).
The Flash Profile is a technique developed by Sieffermann(2000) which combines Free-Choice Profiling with a comparativeevaluation of the product set. This method consists in asking theassessors to use their own descriptive terms in order to rank thetasted products for each of these terms. The fact that assessorshave a simultaneous access to the whole sample set forces themto focus on the differences they perceive in order to generate onlydiscriminant attributes. Eladan, Gazano, Ballay, and Sieffermann(2005) used this method with consumers to describe fragrances.In their study, a Flash Profile of fine fragrances was indeed con-ducted in parallel with expert panellists (9 professional perfumers)and with targeted consumers (89 untrained participants). Similar-ities and differences between the two types of panels were ob-served for the fragrance sensory descriptions but the studyopened perspectives for the translation of consumers’ words intoexperts’ descriptions and vice versa.
The Projective Mapping is a comparative sensory descriptivemethod previously used in cognitive psychology by Goldstone(1994) in which the subjects are asked to use their own criteriato position objects directly on a map according to the rule thatthe closer two objects are placed on the map, the closer their per-ceived characteristics. More recently, the same approach has beenused by Pagès (2003) for wine tasting and was referred to as the
Napping technique. This name emphasises the intuitiveness of thistask by reference to the French word for tablecloth ‘‘nappe’’ insteadof map. PM data are analysed by using Multidimensional Scaling orGeneral Procrustes Analysis, whereas Napping consensual sensorymaps are obtained by Multiple Factorial Analysis. The use of Pro-jective Mapping with consumers was tested by Risvik, McEwan,and Rodbotten (1997) to analyse dried soups and by Barcenas,Perez Elortondo, and Albisu (2004) for the description of ewes’milk cheeses. In their studies, Risvik et al. and Barcenas et al. com-pared the results of a sensory conventional profiling performed byexpert panellists with the results of a Projective Mapping per-formed by a small group of untrained participants (respectively 8and 12 subjects). Both studies showed that trained panellists andconsumers described the main characteristics of the food samplesin a similar way, which was however not the case for subtledifferences. It should be noted that Repertory Grid, Flash Profileand Projective Mapping are all comparative in nature, at least inthe first steps of the product evaluation. Interestingly, these tech-niques originate from different scientific fields (i.e. psychology orsensory science) but they may find useful applications in consumerresearch. Thomson and McEwan (1988) early discussed the possi-bilities of a method like the Repertory Grid to investigate consumerperceptions of foods. Some authors have compared the results ofconventional sensory profile performed with trained panellistswith those obtained using such descriptive methods with consum-ers (Repertory Grid (Andani et al., 2001) or Projective Mapping(Barcenas et al., 2004; Risvik et al., 1997)). However, so far littlehas been done to compare different descriptive methods con-ducted with consumers in terms of efficiency and relevance.Moussaoui and Varela (2010) recently compared Free Sorting, Pro-jective Mapping, Flash Profile and Repertory Grid conducted withconsumers and QDA with a trained panel.
The objective of this work was to test and to compare Flash Pro-file (FP), Projective Mapping (PM) and Repertory Grid (RG), in theview of getting insights into French consumers’ perception of theflavour of a range of lemon ice teas. The study was conducted inthe perspective of flavour development. Lemon ice tea was thusthought to be an interesting choice, because the products mainlydiffer in terms of flavour and because the matrix is relatively sim-ple. We thus expected that the participants would focus on the fla-vour rather than on the texture (or else) differences.
We aimed to compare the sensory maps obtained with eachmethod as well as the descriptive terms elicited from the consum-ers. We also investigated the degree of consensus among consum-ers for the most frequently used terms. Since we were eager toevaluate the feasibility of these techniques in actual developmentprojects, we paid special attention to the practical aspects.
2. Materials and methods
2.1. Products
Eight lemon ice teas from the European market were selectedfrom a preliminary study done with three colleagues from the sen-sory team in order to ensure a wide diversity in terms of flavourand a good representation of the market bestsellers. The product1 was from the Swiss market, the product 4 from the Italian marketand the other ones were from the French market.
Products were chosen with a very similar and recent use-bydate to avoid any modification of the original flavour profile atthe time of the experiment. One product was duplicated (samples8 and 9) in order to evaluate the panel repeatability.
The products were stored at 4 �C in their original packaging andplaced at room temperature ten minutes before the testing ses-sions. For all experiments, the samples were then presented in
476 B. Veinand et al. / Food Quality and Preference 22 (2011) 474–485
100 mL plastic cups coded with a three digit number. If consumersneeded a higher quantity of one or of several products to completetheir task, the corresponding cups were refilled by the interview-ers. Mineral water was at assessors’ disposal to rinse their palatebetween the samples.
2.2. Assessors
A total of 125 French regular lemon ice tea consumers with noprevious experience in sensory evaluation were recruited in theParisian neighbourhood by advertisement in the local newspaper.A significant incentive was given to the participants. Overall theywere between 18 and 60 years old. The participants were split intothree groups, one for each experiment. Nine men and 33 womenparticipated to the RG; 14 men and 29 women participated tothe FP; 9 men and 31 women participated to the PM.
2.3. Sessions
Three days were necessary to conduct the three experiments.Each day was dedicated to one experiment. All the sessions wereperformed in standardised individual sensory booths.
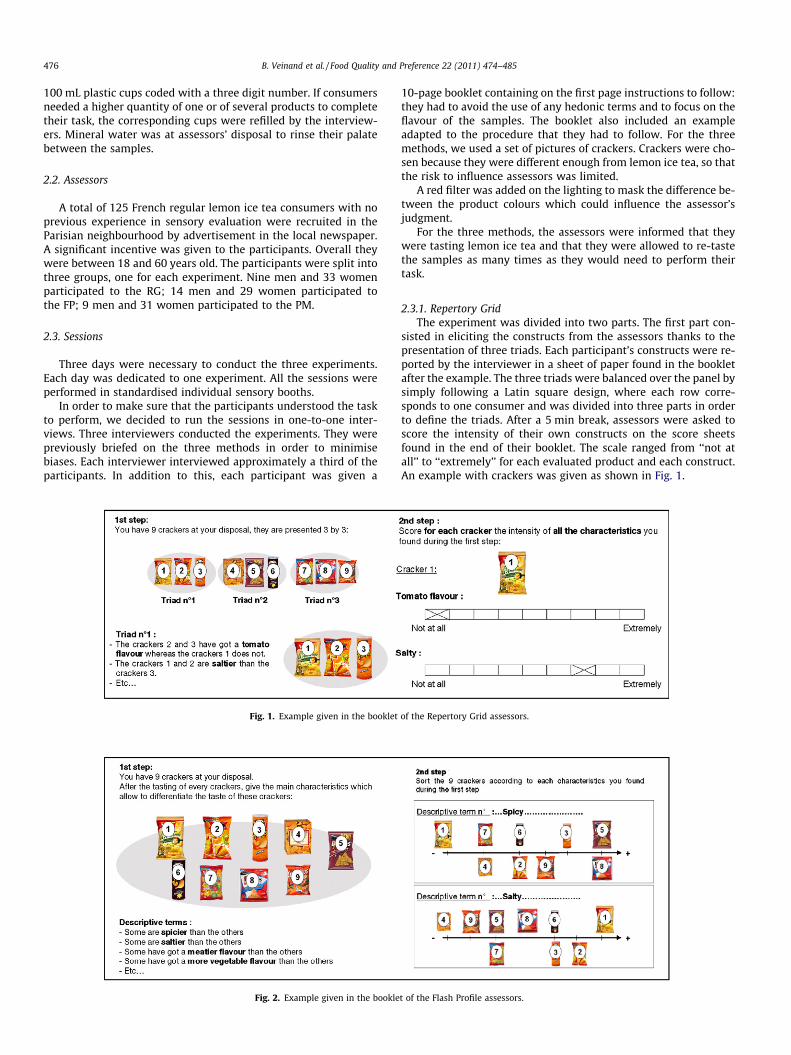
In order to make sure that the participants understood the taskto perform, we decided to run the sessions in one-to-one inter-views. Three interviewers conducted the experiments. They werepreviously briefed on the three methods in order to minimisebiases. Each interviewer interviewed approximately a third of theparticipants. In addition to this, each participant was given a
Fig. 1. Example given in the booklet
Fig. 2. Example given in the bookle
10-page booklet containing on the first page instructions to follow:they had to avoid the use of any hedonic terms and to focus on theflavour of the samples. The booklet also included an exampleadapted to the procedure that they had to follow. For the threemethods, we used a set of pictures of crackers. Crackers were cho-sen because they were different enough from lemon ice tea, so thatthe risk to influence assessors was limited.
A red filter was added on the lighting to mask the difference be-tween the product colours which could influence the assessor’sjudgment.
For the three methods, the assessors were informed that theywere tasting lemon ice tea and that they were allowed to re-tastethe samples as many times as they would need to perform theirtask.
2.3.1. Repertory GridThe experiment was divided into two parts. The first part con-
sisted in eliciting the constructs from the assessors thanks to thepresentation of three triads. Each participant’s constructs were re-ported by the interviewer in a sheet of paper found in the bookletafter the example. The three triads were balanced over the panel bysimply following a Latin square design, where each row corre-sponds to one consumer and was divided into three parts in orderto define the triads. After a 5 min break, assessors were asked toscore the intensity of their own constructs on the score sheetsfound in the end of their booklet. The scale ranged from ‘‘not atall’’ to ‘‘extremely’’ for each evaluated product and each construct.An example with crackers was given as shown in Fig. 1.
of the Repertory Grid assessors.
t of the Flash Profile assessors.

Fig. 3. Example given in the booklet of the Projective Mapping assessors.
B. Veinand et al. / Food Quality and Preference 22 (2011) 474–485 477
2.3.2. Flash ProfileIn a first step, assessors were told to find descriptive terms
which differentiated the products. All the descriptive terms werelisted by the interviewer on a blank sheet of the assessor’s booklet.After a 5 min break, they were asked to rank the products accord-ing to each descriptive term they found previously and reportedthose ranks on the score sheets of their booklet. The example withcrackers was placed at the beginning of the booklet to help them tounderstand their task (Fig. 2). The Flash Profile method proposedby Sieffermann (2000) includes a small inter-session, during whichassessors are communicated the list of the descriptive terms gen-erated by the other assessors and may update their own list if de-sired. However, most recent applications of Flash Profile no longerinclude this step (Sieffermann, personal communication). For thesake of the organisation simplicity, this updating session was thusnot proposed to our assessors.
2.3.3. Projective MappingFirstly assessors were asked to directly position the samples
according to their perceived similarity or dissimilarity on an A3format sheet of paper, placed in front of them. Then participantswere told to describe with their own words the products or thegroups of products they made previously and to write ‘‘labels’’ con-taining the product codes and the corresponding descriptive termson the sheet of paper. This step is derived from the Ultra-Flash Pro-file (Pagès, 2003). The example of crackers adapted to ProjectiveMapping is available in Fig. 3. For PM data collection, each con-sumer map was converted into coordinates using two arbitraryaxes (x and y) whose origin was placed in the left bottom cornerof the paper sheet for convenience (Pagès, 2003).
2.4. Statistical analysis
Each of the three data sets was submitted to Generalised Proc-ustes Analysis (GPA) (Gower, 1975). This multivariate procedureallows handling data from assessors using their own vocabularyand yields a score plot (consensual product map) where generalflavour directions can be described using the loadings. Concerningthe PM data, the x and y coordinates of each consumer were ana-lysed as two separate variables. Only descriptive terms which werewell correlated (R2 > 0.5) with the PCs 1, 2 and 3 (in RG and FP)were considered to be relevant for interpretation (Andani et al.,2001).
Agglomerative Hierarchical Clustering (AHC) (Euclidian dis-tances, Ward’s criterion) was performed on the consensual data
resulting from the GPA in order to identify product clusters foreach experiment.
A Multivariate ANOVA (MANOVA) was also used in order todetermine the quality of the product discrimination obtained foreach method, in a similar way as Delarue and Sieffermann (2004)did with CVA. The Wilks’ Lambda associated to this MANOVA, withthe Fisher’s F and its p-value, provides some information about theproduct overall discrimination: the smaller the Lambda, the morethe products are differentiated.
The Regression Vector coefficient (RV) (Robert & Escoufier,1976) was used to measure the degree of correlation betweenthe consensus spaces derived from GPA on the three methods(Delarue & Sieffermann, 2004; Risvik, McEwan, Colwill, Rogers, &Lyon, 1994; Risvik et al., 1997). RV values are comprised between0 and 1. The closer to 1 is the RV, the more similar are the twoconfigurations.
All multidimensional data treatments were performed using theXLSTAT� add-in for Microsoft Excel� (Addinsoft, version 7.5), withthe exception of GPA that was performed on Senstools� (OP&PProduct Research BV, version 3.1.4).
3. Results and discussion
3.1. Practical aspects
Assessors needed on average 1 h and 10 min to perform the RG,50 min to perform the FP, and 40 min for the PM. The RG was moretime consuming than the other methods because of its rating step.Indeed, during this stage, assessors had to give a total of 54 scores(9 products � about 6 descriptive terms), although FP assessorshad to perform an average of five rankings (mean of descriptiveterms per assessor) on nine products. Also we might hypothesisethat PM necessitates less in-depth analytical ‘‘processing’’ duringthe first step of the task during which only the overall sensoryimpression is used. The quantity of ice tea drunk by the consumerswas also dependent on each method. It was much more importantfor the RG and the FP sessions than for the PM sessions. ThereforeRG and FP assessors, who often asked for cup refill, reported to bemore tired and saturated than the PM assessors. Moreover, this dif-ference of duration and ice tea consumption was also felt by theinterviewers who had to manage longer sessions (e.g. organisethe refill of the cups). A practical implication is that more subjectshad to go to the restrooms during RG and FP sessions compared tothe PM subjects.
Regarding the three protocols, the PM was the most difficultmethod to explain for the interviewers and the most difficult to
478 B. Veinand et al. / Food Quality and Preference 22 (2011) 474–485
understand for assessors. Indeed, in the everyday life, rating orranking may be felt as more intuitive tasks than the constructionof a map, at least in France.
Repertory Grid
010203040506070
1 2 3 4 5 6 7 8Dimensions
Per
cent
age
ofV
aria
nce
Flash Profile
010203040506070
1 2 3 4 5 6 7 8Dimensions
Per
cent
age
ofV
aria
nce
Projective Mapping
010203040506070
1 2Dimensions
Per
cent
age
ofV
aria
nce
1 2
Fig. 4. Distribution of variance per dimension for each method.
Fig. 5. Score plots of the consensus obtained from the Generalised Procustes Analysis peFlash Profile (FP) and to Projective Mapping (PM).
Even if the PM was the least time consuming method for asses-sors, it was the longest method for interviewers because of thetime needed for data collection. Indeed it was much longer forthem to measure all the product coordinates for each consumer’sPM map than to directly collect the product scores or ranks fromthe RG and FP assessors’ score sheets. Henceforth, this step canbe greatly speed up by the use of dedicated interfaces providedin most sensory acquisition softwares.
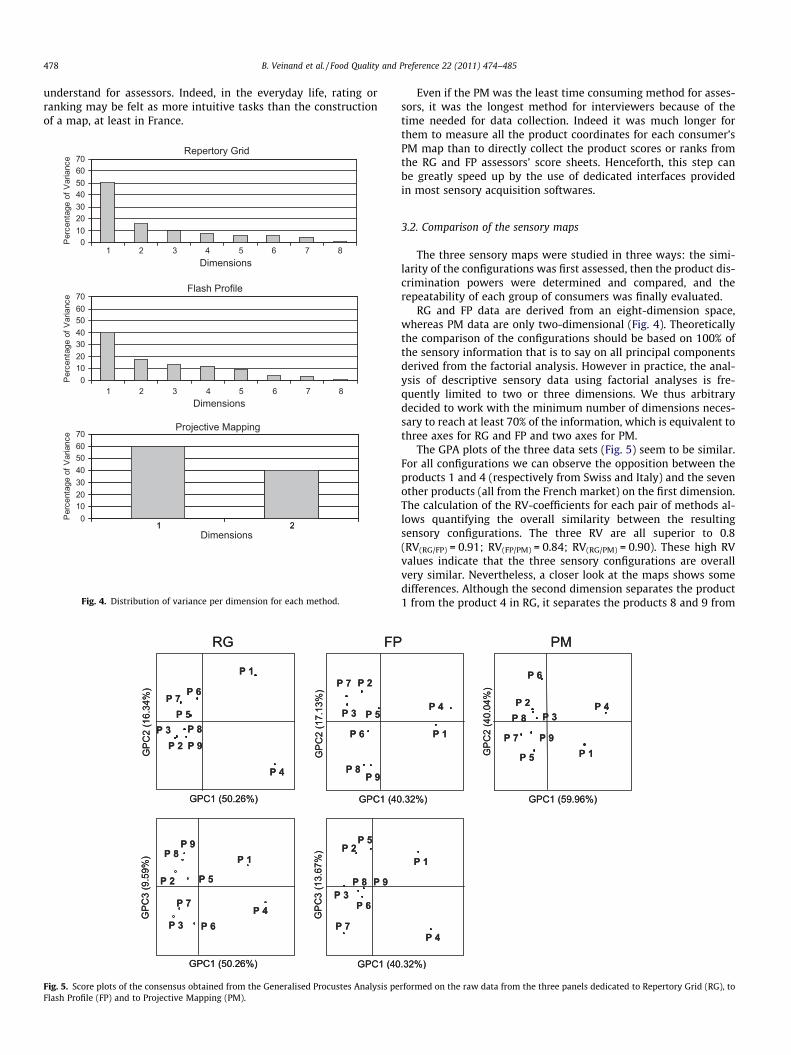
3.2. Comparison of the sensory maps
The three sensory maps were studied in three ways: the simi-larity of the configurations was first assessed, then the product dis-crimination powers were determined and compared, and therepeatability of each group of consumers was finally evaluated.
RG and FP data are derived from an eight-dimension space,whereas PM data are only two-dimensional (Fig. 4). Theoreticallythe comparison of the configurations should be based on 100% ofthe sensory information that is to say on all principal componentsderived from the factorial analysis. However in practice, the anal-ysis of descriptive sensory data using factorial analyses is fre-quently limited to two or three dimensions. We thus arbitrarydecided to work with the minimum number of dimensions neces-sary to reach at least 70% of the information, which is equivalent tothree axes for RG and FP and two axes for PM.
The GPA plots of the three data sets (Fig. 5) seem to be similar.For all configurations we can observe the opposition between theproducts 1 and 4 (respectively from Swiss and Italy) and the sevenother products (all from the French market) on the first dimension.The calculation of the RV-coefficients for each pair of methods al-lows quantifying the overall similarity between the resultingsensory configurations. The three RV are all superior to 0.8(RV(RG/FP) = 0.91; RV(FP/PM) = 0.84; RV(RG/PM) = 0.90). These high RVvalues indicate that the three sensory configurations are overallvery similar. Nevertheless, a closer look at the maps shows somedifferences. Although the second dimension separates the product1 from the product 4 in RG, it separates the products 8 and 9 from
rformed on the raw data from the three panels dedicated to Repertory Grid (RG), to

Repertory Grid
0
0.100
0.200
0.300
0.400
0.500
0.600
0.700
0.800Dendrogram
P1 P4 P6 P3 P7 P2 P5 P8 P9
Dissimilarity
0.200
0.300
0.400
0.500
0.600
Dissimilarity Dendrogram Flash Profile
B. Veinand et al. / Food Quality and Preference 22 (2011) 474–485 479
the other products in FP. Moreover product 1 and product 4 areseparated on the third dimension in the case of FP. The study ofthe PM map is less straightforward than that of the RG and FPmaps. Accordingly, the RV showed that the product configurationsof FP and RG are more similar to each other than is the PM config-uration with any of the two other methods.
The product discrimination varied from a method to another.Examination of the Wilks’ Lambda from the MANOVA (Table 1)confirms that the products were more discriminated with RG andwith FP than with PM. Detailed MANOVA results show that allthe between-groups squared Mahalanobis distances are significantin the case of RG and FP. Note that this high discriminating poweris partly due to the high number of assessors (respectively 42 and43 subjects). The discrimination ability is slightly lower in PM. Ineffect, only the products 1, 4 and 6 are significantly different fromthe other products in PM. The number of PM assessors is also high(40 subjects), yet the fact that in this case individual sensory con-figurations are necessary two-dimensional may decrease thepower of the test, and may explain why several between-groupssquared Mahalanobis distances are not significant. However, theTable 1 shows that the discrimination power of RG and FP was stillbetter than PM when only the first two dimensions are taken intoaccount. Other reasons could explain the lesser PM discriminationability. One of them could be the understanding difficulties felt bythe PM assessors by comparison with RG and FP assessors. Anotherhypothesis could be linked to the fact that some PM subjects actu-ally positioned the products following a two-step process: firstafter having tasted all the products, they placed the most differingproducts (or groups of products) far apart on their sheet of paper(in this case the products 1 and 4 were opposed to other products,the latter being generally positioned closer to themselves). In a sec-ond step, it is very likely that such assessors proceeded to a morefinely tuned analysis of each product positioning by comparisonto neighbouring products hence resulting in a local re-positioning.Should such behaviour occur, this would mean that the corre-sponding maps are not Euclidian at all. In contrast, RG assessorswere told to focus on all the similarities and dissimilarities whichexist among the products and FP assessors were told to strictly usediscriminant attributes to rank the products. These two methodsthus forced them to go deeper in their ‘‘analytical’’ view of theproducts compared to the PM and we may also hypothesise thatthey were less prone to decision bias.
In order to analyze the results more thoroughly, we decided torun a cluster analysis on the GPA consensus configuration fromeach experiment and to look at the corresponding dendrograms(Fig. 6) These dendrograms show dissimilarities between RG and
Table 1Wilks’ Lambda test per method. The F-value is computed according to Rao’sapproximation.
1a RepertoryGrid (100% ofinformation)
Flash Profile(100% ofinformation)
Napping(100% ofinformation)
Lambda 0.004 0.005 0.489DF 1 64 64 16DF 2 2094 2146 700F (observed
value)51.9 (p < 0.0001) 49.2 (p < 0.0001) 18.8 (p < 0.0001)
1b RepertoryGrid (axes1 and 2)
Flash Profile(axes 1 and 2)
Napping(axes 1 and 2)
Lambda 0.160 0.174 0.489DF 1 16 16 16DF 2 736 754 700F (observed value) 69.1 (p < 0.0001) 65.7 (p < 0.0001) 18.8 (p < 0.0001)
FP in the way the products are clustered. In the case of RG, the dif-ference between the products 1 and 4 with the other products ishighlighted but the seven French products are not very differenti-ated. Whereas in the case of FP the difference between the prod-ucts 1 and 4 with the other products is less marked but theseven French products are more differentiated. This observationleads us to think that the RG scoring step drove assessors to focuson major differences between the products whereas the FP rankingstep perhaps helped assessors to assess minor differences as well.Besides, the dendrograms underline that the product 6 is distantfrom the other products in RG but grouped with the products 8and 9 in FP.
Thanks to the duplicated products (products 8 and 9), it is pos-sible to have an idea of the repeatability of the groups of consum-ers. The score plots obtained from the GPA (Fig. 5) and thedendrograms obtained from the AHC (Fig. 6) show that the prod-ucts 8 and 9 were perceived to be similar by the three panels,which meant that assessors could be globally considered as repeat-able. The interpretation of the Figs. 5 and 6 is less clear in PM thanin RG and FP, but the squared Mahalanobis distance between theproducts 8 and 9 is not significant in PM, that is why we consideredthat the PM panel was also repeatable.
Projective Mapping
0
0.100
P1 P4 P2 P5 P3 P7 P6 P8 P9
0
0.100
0.200
0.300
0.400
0.500
0.600
Dissimilarity Dendrogram
P1 P4 P6 P3 P2 P8 P5 P7 P9
Fig. 6. Agglomerative Hierarchical Clustering carried out on the three consensusproduct configurations.

Table 3Objective characteristics are in grey and hedonic oriented terms in white. Englishtranslations are presented for information in italics.
480 B. Veinand et al. / Food Quality and Preference 22 (2011) 474–485
3.3. Consumer vocabulary
We decided to divide the vocabulary analysis into two parts. Wewill first compare the assessors’ vocabulary productivity across thethree methods. The second part deals with the sensory meaning ofthe descriptive terms; the question being: do assessors use theirterms in a similar way? In other words: do they associate a givendescriptive term to the same underlying concept, both withinand across the three methods? This search for consensual termsprovides some insights in the characteristics which differ amongthe products.
3.3.1. Consumer vocabulary elicitationThe first observation is that more descriptive terms were
generated using RG and PM than using the FP. Each method indeedallowed producing 61, 58 and 34 different terms respectively. RGsubjects generated a mean of six terms, PM subjects a mean ofseven terms and FP subjects a mean of five terms. The number ofterms varied from 3 to 9 in RG, from 2 to 9 in FP and from 4 to10 in PM.
The higher number of terms generated in RG and PM is not sur-prising as RG was initially conceived as a tool for increasing verbal-ization. During PM, it was relatively easy for assessors to finddescriptive terms to explain their product positioning withoutany constraints implied by rating or ranking tasks. Whereas FPassessors were told to only use attributes which discriminate thewhole set of products. It was thus logical that they were lessproductive.
For the three methods, the most frequently elicited terms werethe same: ‘‘citron’’ (lemon), ‘‘sucré’’ (sweet), ‘‘acide’’ (sour), ‘‘thé’’(tea), ‘‘amer’’ (bitter) (Table 2). It is important to underline thatthese five descriptive terms could be considered as objective prod-uct characteristics, which means that consumers had a rather goodunderstanding of the primary task they were asked to perform,especially avoiding hedonic terms. This also indicates that thesecharacteristics were probably the most relevant to describe theproduct flavour. The use of these five terms could be expected asthe subjects were informed that they were tasting ‘‘lemon ice teas’’and one could expect that these terms would be spontaneously ci-ted to describe those products without even tasting them.
A distinction can be made between objective terms (i.e. nothedonic, not related to abstract benefits) and subjective terms.
Table 2Number of citations of the descriptive terms elicited in common by assessors ofRepertory Grid (RG), Flash Profile (FP) and Projective Mapping (PM). Objectivecharacteristics are in grey and hedonic oriented terms in white. English translationsare presented for information in italics.
Interestingly we can underline that for the three methods, the pro-portions of objective terms corresponded to approximately threequarters of all terms (the frequencies of objective term elicitationwere respectively: 73% for RG, 75% for FP and 67% for PM). Approx-imately 30% of terms were subjective, some were positivelyhedonic oriented terms (benefits) such as: ‘‘rafraîchissant’’ (refresh-ing), ‘‘désaltérant’’ (thirst quenching), and others were negativelyhedonic oriented terms like ‘‘artificial’’ (artificial), ‘‘médicament’’(medicine) (Tables 2–4). The high proportion of objective charac-teristics could provide a lot of information to flavour developersabout the product flavour and indicates that consumers have acertain analytical ability. This was better than expected, since thegeneral idea is that consumers use more hedonic or imaged terms.Regarding these results, this preconceived idea about consumersshould be moderated.
Besides, we can underline that some assessors used some qual-ifiers such as ‘‘fort en goût’’ (strong in taste), ‘‘peu citron’’ (slightlylemon), ‘‘peu sucré’’ (slightly sweet), ‘‘peu fruité’’ (slightly fruity),‘‘peu acide’’ (slightly sour)’’. The combination of low intensity anddescriptive term was especially found in PM. RG and FP assessorshad the possibility to rate the intensity of each attribute, thanksto intensity scales or rankings, which was not the case for PMassessors. Besides, the product description in PM was performedafter the product positioning and no indication was given regard-ing the intensity of their sensations. As a result the products weremore often described by the absence of a characteristic than by thepresence of a characteristic. During the second step of PM (whichcorresponds to the Ultra-Flash technique described by Pagès,2003) the participants spontaneously used bipolar notions. In away, this is similar to the vocabulary elicitation process duringthe first step of RG.
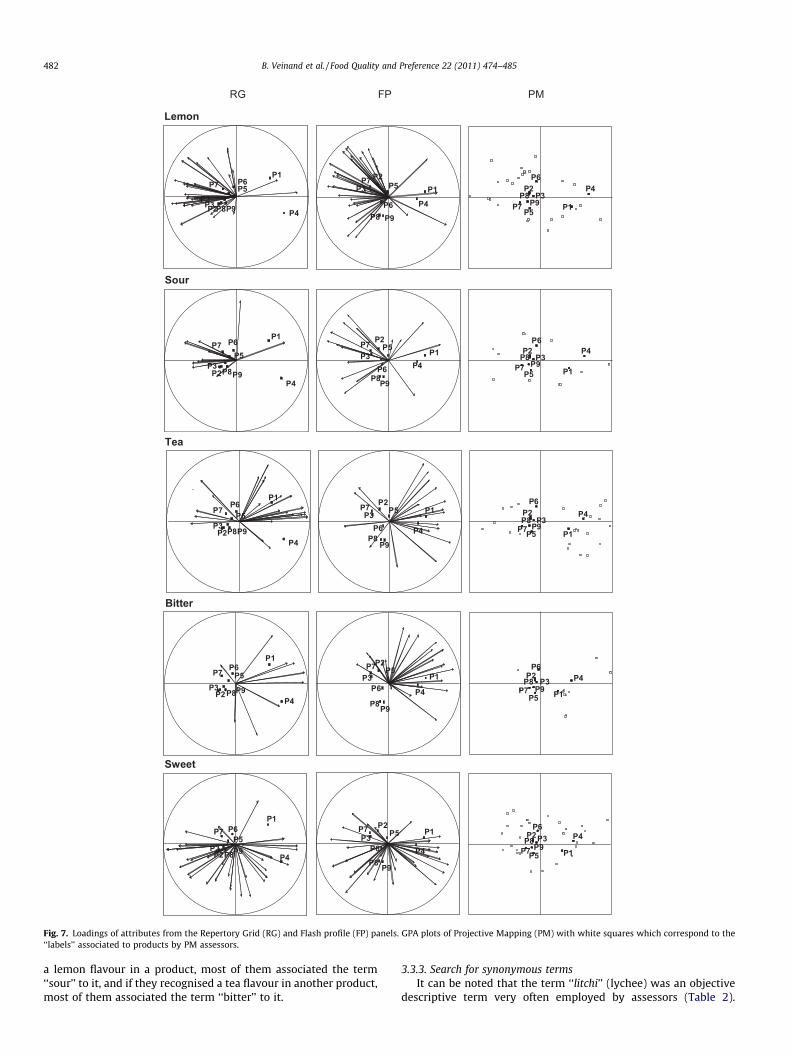
3.3.2. Consumer consensus vocabularyWe studied the loadings of attributes from RG and FP in order to
investigate the consensual use of the same words by several asses-sors. Because the computation of loadings was not possible in PM,the product configuration of each assessor was directly associatedto its label configuration. In other words, each label coordinates

Table 4Number of citations of the flavour descriptive terms specifically used for the evaluation of the products with each method (RG: Repertory Grid, FP: Flash Profile, PM: ProjectiveMapping). Intrinsic characteristics are in grey and hedonic oriented terms in white. English translations are presented for information in italics.
B. Veinand et al. / Food Quality and Preference 22 (2011) 474–485 481
were assumed to be the same than its associated product coordi-nates. However, even if this means allowed visualising the descrip-tive terms on the GPA map, it must be analysed differently than theloadings of RG and FP. Indeed, in PM, several points associated tothe same word could belong to the same assessor; whereas in RGand FP, two vectors associated to the same word necessarily belongto different assessors.
We investigated the consensual use for several terms, especiallythe five most frequently elicited terms (Fig. 7). For a broadersemantic analysis, some meta-descriptors were created on asemantic basis (Frost, Dijksterhuis, & Martens, 2001). The firstmeta-descriptor Lemon was formed with the following terms:‘‘citron’’ (lemon), ‘‘citronné’’ (lemon-like), ‘‘bonbon citron’’ (lemoncandy), ‘‘limonade’’ (lemonade)’’. Lemon was quite consensuallyused within the three methods, especially for RG and FP. We cansee that all the descriptors which belong to the meta-descriptorLemon point in the sensory direction opposite to products 1 and4. Moreover it was interesting to find that the terms ‘‘acide’’ (sour)and ‘‘acidulé’’ (tangy) which belong to the meta-descriptor Sourpoint approximately in the same sensory direction than those ofLemon. This correlation does not appear in PM.
Even if the term Sweet (French term ‘‘sucré’’) was among themost frequently elicited by the consumers, it was not consensuallyemployed. It is quite surprising because Sweet is among the mostused term in any sensory descriptive study. Sweetness is so com-mon that it is generally thought as a well-shared and consensualbasic taste characteristic. We thus expected that assessors agreedin the use of this term. This lack of consensus could be explainedby three non-exclusive hypotheses. The first one would be of phys-iological and psychological nature. The sweet taste perception dif-fers among human beings. Taste–flavour interactions may alsocontribute to these differences. The second hypothesis would bemethodological: assessors could simply not manage to evaluatethe difference of sweetness in the products because all the prod-ucts were very sweet, because the number of products was highand possibly because of physiological adaptation. Finally, the thirdhypothesis would be that assessors spontaneously generated theterm Sweet because all the products were obviously very sweet.
But then if the products weren’t so different in terms of sweetness,no sorting would be possible and assessors reached a deadlock,although on the basis of our knowledge of these products, the lat-ter hypothesis seems very unlikely.
The meta-descriptor Tea (‘‘thé’’ (tea), ‘‘feuilles de thé’’ (tealeaves), ‘‘thé refroidi’’ (cold tea) and ‘‘thé glacé’’ (ice tea)) was alsoquite consensually used by most of the consumers: it was moreassociated with the products 1 and 4 than the other products bythe consumers. The same consensual correlation between the termBitter and the products 1 and 4 could be underlined for the threemethods.
Interestingly, Bitter and the meta-descriptor Sour do not pointin the same direction, indicating that these terms refer to separatesensory meanings. Indeed, assessors mainly linked Sour with Lem-on and Bitter with Tea. This observation contradicts the precon-ceived idea that untrained subjects often mix up the terms‘‘sour’’ and ‘‘bitter’’. O’Mahony, Goldenberg, Stedmon & Alford(1979) studied the confusion in the use of taste adjectives ‘‘sour’’and ‘‘bitter’’ with American and English assessors. In their experi-ments, assessors tasted samples of NaCl, sucrose, citric acid andquinine sulphate at different concentrations and in random order.Then, they were told to write the codes corresponding to the sam-ples in the appropriate column of a response sheet labelled‘‘sweet’’, ‘‘sour’’, ‘‘salty’’, ‘‘bitter’’, ‘‘peppermint’’ and ‘‘tasteless’’.O’Mahony et al. concluded that the confusion between ‘‘sour’’and ‘‘bitter’’ exists but it occurred more at lower concentrationsthan at higher ones. In our study, the levels of sourness and bitter-ness were probably high enough in the evaluated ice teas to bewell recognised by the assessors. O’Mahony et al. also added thatAmerican and English people confuse the terms ‘‘sour’’ and ‘‘bitter’’because the description of lemon as bitter is common in Englishand that it is reinforced by the names of soft drinks such as ‘‘bitterlemon’’. Lemon is rather described as ‘‘sour’’ by French people andno soft drink called ‘‘bitter lemon’’ can be found on the French mar-ket. Besides it is quite well-known by French people that tea can bedescribed as ‘‘bitter’’. These assumptions that Lemon is ‘‘sour’’ andtea is ‘‘bitter’’ might have helped French assessors to avoidconfusion between ‘‘sour’’ and ‘‘bitter’’. Indeed, if they recognised
Lemon
P1
P4
P6P5
P9P8P2P3
P7
P30
P1
P4P6P9P8
P5P7P3
P2
P1
P4P6
P2P8 P3P9P7 P5
Sour
P1
P4
P6P5
P9P8P2
P7
P3P1
P4P6P9P8
P5P7P3
P2
P1
P4P6
P2P8 P3P9P7
P5
Tea
P1
P4
P6P5
P9P8P2
P7
P3
P1
P4P6
P9P8
P5P7P3
P2
P1
P4P6
P2P8 P3P9P7P5
Bitter
P1
P4
P6P5
P9P8P2
P7
P3P1
P4P6
P9P8
P5P7P3
P2
P1
P4P6P2P8 P3P9P7
P5
Sweet
P1
P4
P6P5P9P8P2
P7
P3
P1
P4P6
P9P8
P5P7P3
P2
P1
P4P6
P7P5
P2P8 P3P9
RG FP PM
Fig. 7. Loadings of attributes from the Repertory Grid (RG) and Flash profile (FP) panels. GPA plots of Projective Mapping (PM) with white squares which correspond to the‘‘labels’’ associated to products by PM assessors.
482 B. Veinand et al. / Food Quality and Preference 22 (2011) 474–485
a lemon flavour in a product, most of them associated the term‘‘sour’’ to it, and if they recognised a tea flavour in another product,most of them associated the term ‘‘bitter’’ to it.
3.3.3. Search for synonymous termsIt can be noted that the term ‘‘litchi’’ (lychee) was an objective
descriptive term very often employed by assessors (Table 2).

RG
FP
GPC1 (50.26%)
GPC1 (40.32%)
GPC
2 (1
6.34
%)
GPC
3 (1
3.67
%)
litchi
fort en goût
fruits exotiquesfrais
artificiel
fruit é
tamarin
râpeux aspartame
artificiel
artificiel chimique
sec
pas de goût
litchi
caoutchouc
plante
terreux
fort en goût
fruit é
fort en goût
artificiel chimique
menthe
pas de goût
doux
menthe
jasminmiel
artificiel m édicament
litchi
fort en goût
artificiel m édicament
artificiel m édicament
fort en goût parfum
menthecitron vertdoux
fort en go ût
fort en goût
fort
litchi
pas de goût
tisane
fort en goût
P8
P6
P7
P9
P5
P4
P3
P 2P1
.
passion/exotique
âpre
parfum é
naturel
litchi
rafra îchissant
frais
intensit é de go ût
glisse en bouche
fleuri
exotiqueintensit é de go ût
fruit é
mangue
litchi
intensit é de go ût
épic é
chimique
fleur d’oranger
intensit é de go ûtmiel
vieilli
acre
pêche
doux
jasmin
miel
verveine/herbe
parfum é/go ût
frais
fruits exotiques
fruits rouges
aspartame
artificiel
litchi
râpeux
chimique
savon
jasmin
fade
fade
fleurs
pétale rose
pétillant
périm é
chimique
menthe
léger
litchi
fade
fleur
raphia
tisane médicament
fade
médicament
mangue
fruit é
P6
P5
P2P9
P8
P4
P7P3
P1
Fig. 8. Plots of the GPA performed on the consensus data from the Repertory Grid (RG) and the Flash Profile (FP) panels focused on descriptors associated to product 4. Theprevious meta-descriptors (Lemon, Sour, Tea, Bitter and Sweet) were not showed.
B. Veinand et al. / Food Quality and Preference 22 (2011) 474–485 483
Several other terms like ‘‘exotique’’ (tropical) and ‘‘fruits exotiques’’(tropical fruits) could be considered as being synonymous of orvery similar to ‘‘litchi’’. On the basis of Givaudan’s expertise in fla-vour description, we also selected some terms relating to flowersas potential synonymous terms for ‘‘litchi’’ such as ‘‘fleur’’ (flower),‘‘fleuri’’ (flowery), ‘‘jasmin’’ (jasmine), ‘‘pétale de rose’’ (rose petal),‘‘fleur d’oranger’’ (orange blossom), ‘‘miel’’ (honey). Noteworthy,all these terms were exclusively associated to the product 4.
Indeed, the RG and FP loadings of attributes show that all theseterms point in the direction of the product 4 (Fig. 8). Moreover,in the PM raw data, assessors exclusively associated these termsto the product 4: ‘‘litchi’’ (lychee) 9 times, ‘‘exotique/litchi’’(tropical/lychee) 1 time, ‘‘fruits exotiques’’ (tropical fruits) 1 time.
This kind of information was very interesting because all theseterms were objective characteristics and not hedonically orientedterms; they allowed throwing light on the difference between

484 B. Veinand et al. / Food Quality and Preference 22 (2011) 474–485
the products 4 and 1 in term of flavour. Nevertheless, it cannot beexcluded that other terms associated to the product 4, such as ‘‘chi-mique’’ (chemical), ‘‘fruité’’ (fruity), etc.. . . also meant ‘‘litchi’’ forsome consumers or meant another flavour characteristic for otherconsumers which could allow differentiating the product 4 fromthe other ones. The point is that we lack tools to systematicallymake the semantic analysis of the descriptive terms used by asses-sors, as we do not have, for example, any specific definition associ-ated to assessors’ terms.
4. General discussion and conclusion
The objective of this work was to compare Repertory Grid, FlashProfile and Projective Mapping in the view of getting an under-standing about which flavour characteristics are of importancefor consumers. RG is a reference method for sensory descriptiveanalysis with consumers but FP and PM were only recently carriedout with consumers.
This work shows that descriptive analysis can be performed byconsumers providing that few adjustments are made. On a practi-cal point of view, the booklet given to each participant containinginstructions to follow and visual examples of the procedure theyhad to perform helped interviewers to explain the task and asses-sors to understand their task. However, the PM was more difficultto perform with consumers who had difficulties to use the spatialpositioning. Actually, we observed that many of them in fact per-formed a simpler Free-Sorting instead of a real PM. This wouldhave to be formally tested in a future experiment. Anyway theuse of the PM should probably be limited to expert panellists. Inaddition the PM data collection was tiresome for the interviewerswho had to measure all the product coordinates for each con-sumer’s PM map whereas they could directly collect RG scoresand FP ranks on the assessors’ sheets.
Globally the PM data analysis was difficult to compare with theRG and the FP. The first difficulty was met during the comparisonof the sensory maps. Indeed, the PM sensory space is two-dimen-sional whereas the RG and the FP sensory spaces reached eightdimensions. Then, the consumer vocabulary comparison was alsocomplicated because the terms generated by the PM assessorswere studied as ‘‘labels’’ and not as real descriptors like in RGand in FP experiments.
Regarding the comparison of the three sensory maps, the strongopposition between two products and the others may have madetheir matching easier. Besides, the discrimination ability was thehighest for FP and the lowest for PM.
RG and PM allowed eliciting more terms than FP. Most of elic-ited terms described objective product characteristics and few ofthem were subjective benefits brought by the product consump-tion. Given these high proportions of objective terms (superior to70% for the three methods), these results open perspectives forthe development of descriptive analysis with consumer panels. In-deed, consumers who performed RG, FP or PM, were able to givemuch more objective information than we expected. Moreover,several consensual uses of specific terms within the three methodsand the search for synonymous terms provided interesting objec-tive information about the lemon ice tea flavour characteristics.The use of subjective terms was not consensual which backs upour initial categorisation into objective and subjective terms.
To summarise, FP and RG seem to be more efficient at accu-rately capturing consumers’ perceptions, which is consistent withMoussaoui & Varela (2010). In the present study, the bipolar con-struct elicitation appears to be the main strength of the RepertoryGrid. Alternatively, the main strength of the Flash Profile is theranking task. It would thus be interesting to combine these twostrengths and to test them with consumers. A similar combination
was developed by González-Tomás and Costell (2006) who incor-porated the Repertory Grid method in the preliminary step of FreeChoice Profiling.
As it was discussed in a dedicated workshop during the 9th Sen-sometrics Symposium (Punter and Lê, 2008) sensory experts andconsumers may yield very similar outcome. At first sight, such re-sults would lead to the conclusion that consumers can do as well astrained panellists, which some would consider to be good news.However this can also be seen the other way round, that is to saythe good news is that sensory experts’ extensive training doesnot modify their perception of the product set. However, in ouropinion this type of comparison should rather be viewed in termsof complementarities instead of similarity. In the frame of the pres-ent study, the comparison of the consumers’ profiling data with ex-pert sensory profiling data could indeed provide additionalinformation about the quality of the objective flavour descriptionobtained from the consumers, but it could also highlight possibledifferences in the perception of the product set between consum-ers and sensory experts as Moussaoui and Varela (2010) noticed.In the same line of thinking, these new methods appear to be veryefficient at collecting professional experts’ perceptions (e.g. carpilots (Dairou, Priez, Sieffermann, & Danzart, 2003), perfumers(Eladan et al., 2005), bakers and flour specialists (Lassoued,Delarue, Launay, & Michon, 2008), wine professionals (Perrinet al. 2008), culinary professionals (Nestrud & Lawless, 2008)).Additional studies with consumers and with sensory or productexperts will allow us to determine the degree of complementaritiesbetween both sources of sensory information and possibly ways tobetter communicate sensory information between product-makersand users.
References
Andani, Z., Jaeger, S. R., Wakeling, I., & Macfie, H. J. H. (2001). Mealiness in apples:Towards a multilingual consumer vocabulary. Journal of Food Science, 66,872–879.
Barcenas, P., Perez Elortondo, F. J., & Albisu, M. (2004). Projective mapping insensory analysis of ewes milk cheeses: A study on consumers and trained panelperformance. Food Research International, 37, 723–729.
Baxter, I. A., Jack, F. R., & Schroder, M. J. A. (1998). The use of Repertory Grid methodto elicit perceptual data from primary school children. Food Quality andPreference, 9, 73–80.
Dairou, V., Priez, A., Sieffermann, J.M., & Danzart, M. (2003). Modelling of brake feelusing design of experiments, sensory profile and PLS. In: The 5th PangbornSensory Science Symposium, July 20–24, Boston, MA.
Delahunty, C. M., McCord, A., O’Neil, E. E., & Morrissey, P. A. (1997). Sensorycharacterisation of cooked hams by untrained consumers using free-choiceprofiling. Food Quality and Preference, 8, 381–388.
Delarue, J., & Sieffermann, J. M. (2004). Sensory mapping using Flash Profile.Comparison with a conventional descriptive method for the evaluation of theflavour of fruit dairy products. Food Quality and Preference, 15, 383–392.
Deliza, R., MacFie, H., & Hedderley, D. (2005). The consumer sensory perception ofpassion-fruit juice using free-choice profiling. Journal of Sensory Studies, 20,17–27.
Dransfield, E., Morrot, G., Martin, J. F., & Ngapo, T. M. (2004). The application of atext clustering statistical analysis to aid the interpretation of focus groupsinterviews. Food Quality and Preference, 15, 477–488.
Eladan, N., Gazano, G., Ballay, S., & Sieffermann, J.M. (2005). Flash profile andfragrance research: the world of perfume in the consumer’s words. In: Esomar,Fragrance Research Conference, New York, NY, May 15–17.
Elmore, J. R., & Heymann, H. (1999). Perceptual maps of photographs of carbonatedbeverages created by traditional and free-choice profiling. Food Quality andPreference, 10, 219–227.
Frost, B. M., Dijksterhuis, G., & Martens, M. (2001). Sensory perception of fat in milk.Food Quality and Preference, 12, 327–336.
Goldstone, R. (1994). Methods and designs. An efficient method for obtainingsimilarity data. Behaviour Research Methods, Instruments, and Computers, 26,381–386.
González-Tomás, L., & Costell, E. (2006). Sensory evaluation of vanilla-dairy dessertsby repertory grid method and free choice profiling. Journal of Sensory Studies, 21,20–33.
Gower, J. C. (1975). Generalized procustes analysis. Psychometrika, 40, 33–51.Guy, C., Piggott, J. R., & Marie, S. (1989). Consumer profiling of Scotch whisky. Food
Quality and Preference, 1, 69–73.
B. Veinand et al. / Food Quality and Preference 22 (2011) 474–485 485
Husson, F., Le Dien, S., & Pagès, J. (2001). Which value can be granted to sensoryprofiles given by consumers? Methodology and results. Food Quality andPreference, 12, 291–296.
Jack, F. R., & Piggott, J. R. (1991/2). Free choice profiling in consumer research. FoodQuality and Preference, 3, 129–134.
Kelly, G. A. (1955). The Psychology of personal constructs. New York: Norton.Lassoued, N., Delarue, J., Launay, B., & Michon, C. (2008). Baked product texture:
Correlations between instrumental and sensory characterization using FlashProfile. Journal of Cereal Science, 48(1), 133–143.
Moussaoui, K. A., & Varela, P. (2010). Exploring consumer product profilingtechniques and their linkage to a quantitative descriptive analysis. FoodQuality and Preference, 21, 1088–1099.
Nestrud, M. A., & Lawless, H. T. (2008). Perceptual mapping of citrus juices usingprojective mapping and profiling data from culinary professionals andconsumers. Food Quality and Preference, 19, 431–438.
O’Mahony, M., Goldenberg, M., Stedmon, J., & Alford, J. (1979). Confusion in the useof the taste adjectives ‘‘sour’’ and ‘‘bitter’’. Chemical Senses and Flavour, 4,301–318.
O’Mahony, M. (1995). Sensory measurement in food science: Fitting methods togoals. Food Technology, 49, 72–82.
Pagès, J. (2003). Recueil direct de distances sensorielles: application à l’évaluationde dix vins blancs de Val-de-Loire. Sciences des Aliments, 23, 679–688.
Perrin, L., Symoneaux, R., Maître, I., Asselin, C., Jourjon, F., & Pagès, J. (2008).Comparison of three sensory methods for use with the Napping� procedure:Case of ten wines from Loire valley. Food Quality and Preference, 19, 1–11.
Piggot, J. R., Paterson, A., Fleming, A. M., & Sheen, M. R. (1991/2). Consumerperceptions of dark rum explored by free choice profiling. Food Quality andPreference, 3, 135–140.
Popper, R., Rosenstock, W., Schraidt, M., & Kroll, B. J. (2004). The effect of attributequestions on overall liking ratings. Food Quality and Preference, 15, 853–858.
Punter P., & Lê S. (2008). Workshop ‘‘A’’: Consumer descriptive analysis: Myth orReality. In: 9th Sensometrics meeting ‘‘Discover a New World of Data’’, St.Catharines, ON, Canada, July 20–23.
Risvik, E., McEwan, J. A., Colwill, J. S., Rogers, R., & Lyon, D. H. (1994). Projectivemapping: a tool for sensory analysis and consumer research. Food Quality andPreference, 5, 263–269.
Risvik, E., McEwan, J. A., & Rodbotten, M. (1997). Evaluation of sensory profiling andprojective mapping data. Food Quality and Preference, 8, 63–71.
Robert, P., & Escoufier, Y. (1976). A unifying tool for linear multivariate statisticalmethods: the RV-coefficient. Applied Statistics, 25, 257–265.
Russel, C. G., & Cox, D. N. (2004). Understanding middle-aged consumers’perceptions of meat using repertory grid methodology. Food Quality andPreference, 15, 317–329.
Sieffermann, J.M. (2000). Le profil flash – un outil rapide et innovant d’évaluationsensorielle descriptive. In: AGORAL 2000, XIIèmes rencontres « L’innovation : del’idée au succès » (pp. 335–340), Montpellier, France.
Thamke, I., Dürrschmid, K., & Rohm, H. (2009). Sensory description of darkchocolate by consumers. LWT – Food Science and Technology, 42, 534–539.
Thomson, D. M. H., & McEwan, J. A. (1988). An application of the Repertory GridMethod to investigate consumer perceptions of Foods. Appetite, 10, 181–193.
Van Kleef, E., van Trijp, H. C. M., & Luning, P. (2005). Consumer research in earlystages of new product development: a critical review of methods andtechniques. Food Quality and Preference, 16, 181–201.
Worch, T., Lê, S., & Punter, P. (2010). How reliable are the consumers? Comparisonof sensory profiles from consumers and experts. Food Quality and Preference, 21,309–318.