Acceptance-preference-of-consumers-halal-food-sustainable ...
23
Academy of Strategic Management Journal Volume 21, Issue 3, 2022 1 1939-6104-21-3-199 Citation Information: Bachtiar, W.F., Masruroh, N.A., & Asih, A.M.S. (2022). Acceptance and preference of consumer’s on halal food sustainable traceability. Academy of Strategic Management Journal, 21(3), 1-23. ACCEPTANCE AND PREFERENCE OF CONSUMER’S ON HALAL FOOD SUSTAINABLE TRACEABILITY Wildan Fajar Bachtiar, Universitas Gajah Mada Nur Aini Masruroh, Universitas Gajah Mada Anna Maria Sri Asih, Universitas Gajah Mada ABSTRACT Purpose: Food safety traceability issues have developed to become important due to present consumers being more concerned about the quality of edible material. This is because these consumers are more knowledgeable in regularly selecting and buying food for consumption, leading to the concerns of the ingredients and curiosity on all the activities involved within the supply chain (primary production, processing, distribution, retail to the consumer). To have the ability in tracking products and retrieving product-related information, food manufacturers should continuously obtain data and trace movements throughout all stages of the supply chain. This indicates that the methodology for analyzing foodstuffs with information technology systems is fundamental in producing an effective tracking and tracing structure. Therefore, this study aims to evaluate the perception of consumers, including the supply chain actors, on the importance of a traceability system. Design/Methodology/Approach: Data were obtained from 262 Halal food consumers in Indonesia and analyzed using the PLS-SEM method. Also, some analytical techniques data were obtained using exploratory information. The novelty in this study was to determine the acceptance and preference of sustainable traceability of halal food consumers in Indonesia. This precisely determined the essential sustainability and traceability factors for these consumers. Findings: The results showed a mediating role within the halal supply chain and traceability system variables, while preference was not observed with such responsibility. Besides the evaluation of direct and indirect relationships, comparisons were also conducted on the differences in gender and age groups, which were subsequently divided into several main categories. Practical implications: This study showed that traceability system and halal supply chain implementations were significant predictors for the Indonesian Muslim communities. However, non-Muslim countries did not concentrate much to these aspects due to different levels of understanding. Originality/value: The results indicated that the halal supply chain and traceability system were significant predictors for the Indonesian people, which were primarily Islamic. This was based on the integration of these aspects at a relatively low cost, compared to other countries requiring high expenses due to the production of non-halal products. The application of the MGA-Analysis technique was further conducted in this study, indicating an interesting finding that the acceptance of male respondents was based on preference. Also, respondents aged 41-50 agreed that traceability implementation was essential for acceptance within their category. This study is expected to make a practical and academic contribution to business actors in the Halal Industry and further future reports. Keywords: Acceptance, Food Sustainability, Halal Supply Chain, Preference, Traceability System, Type of Consumers.
-
Upload
khangminh22 -
Category
Documents
-
view
1 -
download
0
Transcript of Acceptance-preference-of-consumers-halal-food-sustainable ...

Academy of Strategic Management Journal Volume 21, Issue 3, 2022
1 1939-6104-21-3-199
Citation Information: Bachtiar, W.F., Masruroh, N.A., & Asih, A.M.S. (2022). Acceptance and preference of consumer’s on
halal food sustainable traceability. Academy of Strategic Management Journal, 21(3), 1-23.
ACCEPTANCE AND PREFERENCE OF
CONSUMER’S ON HALAL FOOD SUSTAINABLE
TRACEABILITY
Wildan Fajar Bachtiar, Universitas Gajah Mada
Nur Aini Masruroh, Universitas Gajah Mada
Anna Maria Sri Asih, Universitas Gajah Mada
ABSTRACT
Purpose: Food safety traceability issues have developed to become important due to
present consumers being more concerned about the quality of edible material. This is
because these consumers are more knowledgeable in regularly selecting and buying food for
consumption, leading to the concerns of the ingredients and curiosity on all the activities
involved within the supply chain (primary production, processing, distribution, retail to the
consumer). To have the ability in tracking products and retrieving product-related
information, food manufacturers should continuously obtain data and trace movements
throughout all stages of the supply chain. This indicates that the methodology for analyzing
foodstuffs with information technology systems is fundamental in producing an effective
tracking and tracing structure. Therefore, this study aims to evaluate the perception of
consumers, including the supply chain actors, on the importance of a traceability system.
Design/Methodology/Approach: Data were obtained from 262 Halal food consumers
in Indonesia and analyzed using the PLS-SEM method. Also, some analytical techniques data
were obtained using exploratory information. The novelty in this study was to determine the
acceptance and preference of sustainable traceability of halal food consumers in Indonesia.
This precisely determined the essential sustainability and traceability factors for these
consumers.
Findings: The results showed a mediating role within the halal supply chain and
traceability system variables, while preference was not observed with such responsibility.
Besides the evaluation of direct and indirect relationships, comparisons were also conducted
on the differences in gender and age groups, which were subsequently divided into several
main categories.
Practical implications: This study showed that traceability system and halal supply
chain implementations were significant predictors for the Indonesian Muslim communities.
However, non-Muslim countries did not concentrate much to these aspects due to different
levels of understanding.
Originality/value: The results indicated that the halal supply chain and traceability
system were significant predictors for the Indonesian people, which were primarily Islamic.
This was based on the integration of these aspects at a relatively low cost, compared to other
countries requiring high expenses due to the production of non-halal products. The
application of the MGA-Analysis technique was further conducted in this study, indicating an
interesting finding that the acceptance of male respondents was based on preference. Also,
respondents aged 41-50 agreed that traceability implementation was essential for acceptance
within their category. This study is expected to make a practical and academic contribution
to business actors in the Halal Industry and further future reports.
Keywords: Acceptance, Food Sustainability, Halal Supply Chain, Preference, Traceability
System, Type of Consumers.

Academy of Strategic Management Journal Volume 21, Issue 3, 2022
2 1939-6104-21-3-199
Citation Information: Bachtiar, W.F., Masruroh, N.A., & Asih, A.M.S. (2022). Acceptance and preference of consumer’s on
halal food sustainable traceability. Academy of Strategic Management Journal, 21(3), 1-23.
INTRODUCTION
The Islamic people presently constitute approximately 25% of the world's population
and are still expected to subsequently increase, leading to the size of the global ḥalāl market
to reach $2.6 trillion (Martuscelli et al., 2020). Halal food and beverage are the edible
materials permitted under Islamic law, which focuses on the following issues, ban on toxic
substances and blood, slaughter methods, and animal trillion prohibitions (Mansur et al.,
2022). Besides raising the awareness of halal food producers, consumers also select foods
that do not conflict with religious values, beliefs, and culture (Zailani et al., 2015).
Furthermore, people that prefer a healthy lifestyle are starting to switch to halal food
products, which are known for clean and safe ingredients outside the Muslim community. To
prevent any policy inconsistencies and unnecessary barriers to the global market, the Joint
FAO/WHO Codex Alimentarius Commission has reportedly been adopting general
guidelines since 1997 (scope, definition, criteria, and labeling requirements), for the use of
the term “halal” (Abdallah et al., 2021). Therefore, halal food has the potential for a broader
global market, not only for Muslim consumers (Soesilowati & Yuliana, 2013).
Indonesia is the largest Muslim country in the world, where halal food is mostly
utilized for consumption. Although the need to obtain these edible materials is mandatory for
most Indonesians, there is still an increasing concern regarding the integrity and safety of
halal products. This growing concern towards the legitimacy of food products subsequently
questions the certification conducted by local authorities, for Halal companies. However, the
achievements of supply chain-level transparency are impossible without the participation of
all the concerned stakeholders. Based on the food industry's origin and production process, a
lack of product information is also being observed (Tan et al., 2020). Halal food production
and traceability requirements are essential for raw material providers, manufacturers, and
distributors, to provide Shariah-compliant products manufactured by health and safety
criteria. This indicates the necessity to have a flow or framework that should be followed, to
ensure that all products comply with the required standard. In halal food production,
certification is widely explained and regulated, although other elements are practiced to a
minimum. The implementation of a complete traceability system makes it easier for
companies to apply for halal certification. This is because the food production and processing
methods that follow the principles of halal principles are expected to acquire sustainability
and environmental issues, such as ensuring the safety and cleanliness of a product for
consumption. The three main dimensions for the improvement of traceability implementation
are food security assurance, safety, and quality, as well as risk prevention. In addition,
traceability provides further information on the application of halal standards, verification of
consumers' claims, and delivery of tayyib products to customers (healthiness, healthy, safe,
nutritious, and good quality).
According to Dali et al. (2007), the consumer perceptions of halal logos and materials
were examined, compared to the demographic profile of respondents. The influence of
culture on the perceived value consumers want to feel from buying and using the product.
The results showed that the consumers' perceptions of halal logos and ingredients on product
labels were positive. Despite Indonesia being the largest Muslim country where halal food is
highly consumed, the implementation of a traceability system is still not mandatory.
However, the Halal industrial revolution demands that companies should not only focus on
the content of their products, as consumers also want all the activities contained in the entire
supply chain, to meet the required standards (Omar & Jaafar, 2011). Although a traceability
system is not a top priority for consumers in Muslim countries, producers are still required to
carry out the implementation, considering the existence of the several risks involved. This
indicates the need for halal risk management, which is subsequently in line with industry 4.0,
Academy of Strategic Management Journal Volume 21, Issue 3, 2022
3 1939-6104-21-3-199
Citation Information: Bachtiar, W.F., Masruroh, N.A., & Asih, A.M.S. (2022). Acceptance and preference of consumer’s on
halal food sustainable traceability. Academy of Strategic Management Journal, 21(3), 1-23.
where the increase in the digital revolution leads to the faster distribution of news. Assuming
an error occurs in the production process due to the absence of a sound traceability system,
producers are expected to experience a decrease in consumer confidence, which leads to
product boycott activities that are presently rife.
Several countries are found to be studying alternative methods to improve their food
traceability systems, using a common data platform for their Halal food supply chain.
Therefore, this study aims to evaluate consumer understanding and acceptance of halal food
sustainability and traceability. Also, it aims to determine essential sustainability and
traceability factors for halal food consumers in Indonesia. This study is being conducted to
answer several existing shortcomings, to determine consumer understanding and acceptance
of halal food sustainability and traceability in Indonesia.
LITERATURE REVIEW
The consistency with safety legislation and market requirements are critical to the
food products industry. This is because the supply chain assurance is well-developed in the
high-input food chains delivered to consumers. However, the systems with low inputs such as
organic production or conventional sources are not often guaranteed (Manning & Soon,
2013). This is because a food safety management system is essential to ensure that products
are safe and healthy. Meanwhile, the concept of halal is limited to food safety and quality, as
well as process control, packaging, storage, and delivery (Manning & Soon, 2013). Since the
authenticity of halal food causes concern among consumers, especially Muslims, the integrity
of these products should be monitored for the assurance of consumers' confidence. This
indicates the improvement of food safety with a traceability system, especially a blockchain
solution. According to George et al. (2019) and Liu & Li (2020), a blockchain traceability
framework was created, where the applications were found to be a perfect solution to achieve
quality food security. However, realistic case studies still indicated very few studies and
validation applications. Based on a multidisciplinary and integrated view, a conceptual
framework for food supply chain assessment and product logistics was also introduced by
Manzini & Accorsi (2013). This effectively controlled food products' safety, quality,
sustainability, and efficiency. In addition, a case study was subsequently conducted to apply
this framework to food supply chain assessment, through an integrated approach.
Furthermore, the study of Tieman et al. (2012) stated that product and market characteristics
were essential halal supply-chain management variables. This indicated that a sustainable
supply chain should ensure whether the product was genuinely halal or not, reducing the risk
of non-halal substances contamination. These results were due to halal integrity being the
foundation of the food industry. Protective and preventive measures should also be
considered to ensure that halal food products remained guaranteed, although they underwent
movement in the supply chain, traveled long distances, and experienced various handling
activities. This showed that all parties involved in the supply chain (upstream to downstream)
should bear an individual and collective responsibility, to intentionally and unintentionally
protect halal food products from being cross-contaminated. Therefore, food companies
should implement a traceability system, to ensure the authenticity of the halal product and
understand the importance of the industrial environmental factors, towards enhancing the
integrity of the supply chain.
A traceability system helps to minimize the production and distribution of unsafe/low-
quality products prone to contaminants, leading to the reduction of potential recalls for
harmful products (Aung & Chang, 2014). An essential aspect of building a traceability
system is the realization of the capabilities across multiple synergistic structures, which are
within the entire supply chain. According to Aung & Chang (2014), traceability systems were

Academy of Strategic Management Journal Volume 21, Issue 3, 2022
4 1939-6104-21-3-199
Citation Information: Bachtiar, W.F., Masruroh, N.A., & Asih, A.M.S. (2022). Acceptance and preference of consumer’s on
halal food sustainable traceability. Academy of Strategic Management Journal, 21(3), 1-23.
used as a tool to comply with laws and policies, as well as meet food safety and quality
requirements. Therefore, traceability was considered an adequate safety and quality
monitoring system, which had the potential to increase food chain security and consumer
confidence. In this study, only one-third of the respondents had heard of a food traceability
system, indicating the low level of consumers' knowledge. Although preferences for fruit and
vegetable traceability systems were low, the interest of consumers in its information was still
being observed. Also, it raised the need to effectively communicate with consumers on the
explored requirements to be strengthened. For example, the information regarding food
assurance quality was safer, healthier, or better. Besides the high social and environmental
sustainability risks (and opportunities), traceability is still essential due to the fragmented
production and widespread involvement of various parties in the supply chain. This study
presented an integrative and systematic literature review of 89 peer-reviewed journal articles
related to traceability and sustainability in garment products' global supply chain. Also, it
focused on the industry-enhanced potential of the global supply chain, to explain how
leverage-enabling technologies improved the Triple-Bottom-Line (TBL) performance of
actors across the broad ecosystem. This study conceptually framed sustainable supply chain
management, which referred to traceability as a meta-capability. In addition, it subsequently
contributed to the unexplained question of achieving sustainability in the global supply chain.
Based on Manzini & Accorsi (2013), a new conceptual framework for food supply chain
assessment was introduced. This focused on distribution issues and was supported by
developing a new integrated approach control system in the food supply chain, as outlined in
the framework. However, the concepts provided by Aung & Chang (2014) and Manzini &
Accorsi (2013) did not involve halal and sustainability variables. Moreover, a blockchain-
based framework for supply chain cross-border e-commerce was proposed by Liu & Li
(2020), which supported peer-to-peer transactions between several participants. This
provided trustworthy products and transactions, as well as tweak information. Within this
framework, a multi-supply chain structure was also proposed to store products, transactions,
and logistics information. The study of Mohammed et al. (2017), subsequently provided a
definition and framework of the halal supply chain, which originated from raw materials,
logistics movement activities, warehousing, production, storage, delivery, marketing and
sales, as well as Sharia customer service, where Islamic law provided guidelines for proper
processes.
Food safety is a condition and effort to prevent edible materials from being
contaminated by biological, chemical, and other interferences, which are harmful and lethal
to human health. This indicates that safe, quality and highly nutritious food have a vital role
in growth, maintenance and improvement, as well as health status and increased intelligence.
Based on these conditions, halal food is then defined as all edible materials that are permitted
for consumption under Islamic law. In 2007, the global consumption of halal food was
responsible for 18-20% of food value in more than 148 countries. This indicated that the logic
of the halal system was beyond the binding laws being observed by Muslims, which reflected
the act of worshiping the Creator (Allah). Also, halal food is more than a product attribute for
Muslims due to being compulsory for consumption. However, non-Muslims have the option
to buy these edible materials to address their concerns about food quality (Poniman et al.,
2015). Food traceability is defined as the part of logistic management, which captures, stores,
and transmits sufficient information on food, feed, and productive animals/substances at all
stages in the supply chain. This is mostly based on the security awareness of the products.
Furthermore, a food traceability system is a record-keeping structure that obtains product
attributes, such as quality and safety parameters, which are required for commercial purposes.
When companies incorporate new technologies, these systems often become a source of
sustainable competitive advantage, which are most difficult for competitors to imitate

Academy of Strategic Management Journal Volume 21, Issue 3, 2022
5 1939-6104-21-3-199
Citation Information: Bachtiar, W.F., Masruroh, N.A., & Asih, A.M.S. (2022). Acceptance and preference of consumer’s on
halal food sustainable traceability. Academy of Strategic Management Journal, 21(3), 1-23.
(Epelbaum & Martinez, 2014). In the Halal Assurance System (HAS), traceability is often
found as an essential practice, where the production systems reduce contaminations and
industrial vulnerabilities, especially in the food industry. Additionally, a transparent and
credible halal supply chain depends on a tracking system and cooperation from all partners.
This is because the need for certified producers with HAS is no longer an option, to ensure
market competitiveness and significance (Abd Rahman et al., 2017). Halal Supply Chain
Management (HSCM) is subsequently defined as the maintenance of a network, to extend
integrity from the source to the consumers' purchase point. This indicates that the halal
supply chain model should be adapted from the existing supply chain facilitating Islamic
values (Tieman et al., 2012). Food production and consumption sustainability are found to be
multidimensional, and realized by providing essential goods for overall sustenance. This
shows that the supply chain is associated with environmental and socioeconomic impacts,
which originates from increased consumer demand and consumption model changed, as well
as the idea that cleaner modes of food production involve sustainable intake. However, no
previous study had specifically explained the ideal traceability system, as well as the pattern
of consumer preferences and acceptance of halal food in Indonesia. Therefore, a study needs
to determine the consumer perceptions and acceptance of halal food sustainability and
traceability in Indonesia. This is because most previous studies focused on the acceptance of
halal products by testing the Theory of Planned Behaviour (TPB), with only a few reports
being observed on food supply chain and integrity.
There are two stages in developing a model for halal food consumers, based on the
identification of relationships and patterns of influential factors. The first activity aimed to
determine the factors significantly influencing the perception and acceptance of traceability,
using exploratory techniques and Partial Least Squares SEM. In the SEM-PLS, several
theories were developed for the prediction of hypotheses. This was to ascertain whether these
theories were acceptable for application. In the selection of food products, lifestyle was found
to influence consumers' actions, which were different depending on their backgrounds,
principles, and purchasing powers. These aspects promoted consumers to make purchasing
decisions based on product halalness, food safety, quality assurance, price, and other
attributes. The use of questionnaires also showed the influence of age, educational
background, occupation, and income levels on the different perceptions of a product. Also,
consumers with a healthy lifestyle and high purchasing power prioritized quality and value
over price. In another perspective, consumers have the potential to be price-sensitive than
other attributes, due to having lower purchasing power. Furthermore, the attitude was an
overall evaluation of an individual concept.
Several investigations related to the relationship between consumer perceptions and
purchase intentions were also carried out, based on a case study in a fast-food restaurant. The
result showed that only one-third of the respondents had the awareness of food traceability
systems. Also, it indicated that the consumers' understanding of this system's importance was
still low. This study was subsequently reinforced, which included preferences besides fruit
and vegetable traceability systems, due to the frequent changes in consumer perceptions with
time and prevailing trends. Furthermore, these perceptions are found to have changed with
the development of agro-industrial technology. The implementation of a traceability system
along the supply chain reduced the risk of non-halal contamination, ultimately leading to a
sustainable assurance structure that decreased long-term total costs. Two types of suppliers
were identified, namely traceable (expensive) and untraceable (cheap) suppliers, which
incurred appropriate recalls and higher costs during food safety incidents, respectively. This
indicated that various consumers with traceability awareness were willing to spend more
money on traceable food products. The study also attempted to increase consumer-focused
traceability by increasing the willingness to pay, leading to unintended consequences, such as

Academy of Strategic Management Journal Volume 21, Issue 3, 2022
6 1939-6104-21-3-199
Citation Information: Bachtiar, W.F., Masruroh, N.A., & Asih, A.M.S. (2022). Acceptance and preference of consumer’s on
halal food sustainable traceability. Academy of Strategic Management Journal, 21(3), 1-23.
a decrease in the supply of traceable edible materials. Thus, the hypotheses for the perception
and acceptance model are as follows:
H1: The type of consumers, trackability system, as well as halal supply chain and food
sustainability are partially related to the acceptance of Sustainable Traceability
H1a: Type of consumers is positively related to the acceptance of Halal Food Sustainable
Traceability
H1b: The implementation of a trackability system is positively related to the acceptance of Halal
Food Sustainable Traceability
H1c: The implementation of a halal supply chain is positively related to the acceptance of Food
Sustainable Traceability
H1d: Food product sustainability is positively related to the acceptance of Halal Sustainable
Traceability
H2: The type of consumers, trackability system, halal supply chain, and food sustainability are
partially related to the preference of Sustainable Traceability
H2a: Type of consumers is positively related to the preference of Halal Food Sustainable
Traceability
H2b: The implementation of trackability system is positively related to the preference of Halal Food
Sustainable Traceability
H2c: The implementation of the halal supply chain is positively related to the preference of Food
Sustainable Traceability
H2d: Food product sustainability is positively related to the preference of Halal Sustainable
Traceability
H3: Preference is positively related to the suitability of Halal Food Sustainable Traceability
H4: Type of consumers is positively related to food product sustainability
H5: Type of consumers is positively related to halal supply chain
H6: The implementation of a traceability system is positively related to food product sustainability
H7: Type of consumers is positively related to traceability system implementation
H8: The implementation of traceability system is positively related to halal supply chain
H9: The implementation of the halal supply chain is positively related to food product
sustainability
H10: Preference mediates the relationships between the type of consumers, trackability system,
halal supply chain, food sustainability, and acceptance of Sustainable Traceability
H10a: Preference mediates the relationships between the type of consumers and acceptance of Halal
Food Sustainable Traceability
H10b: Preference mediates the relationships between the trackability system implementation and
acceptance of Halal Food Sustainable Traceability
H10c: Preference mediates the relationships between the halal supply chain implementation and
acceptance of Food Sustainable Traceability

Academy of Strategic Management Journal Volume 21, Issue 3, 2022
7 1939-6104-21-3-199
Citation Information: Bachtiar, W.F., Masruroh, N.A., & Asih, A.M.S. (2022). Acceptance and preference of consumer’s on
halal food sustainable traceability. Academy of Strategic Management Journal, 21(3), 1-23.
H10d: Preference mediates the relationships between the food product sustainability and acceptance
of Halal Sustainable Traceability
H11: The halal supply chain mediates the relationships between the trackability system
implementation and preference of Food Sustainable Traceability
H12: The halal supply chain mediates the relationships between the trackability system
implementation and acceptance of Food Sustainable Traceability
H13: The halal supply chain mediates the relationships between the traceability system
implementation and food product sustainability
H14: The traceability system implementation mediates the relationships between the type of
consumers and the halal supply chain
H15: The trackability system implementation mediates the relationships between the type of
consumers and acceptance of Halal Food Sustainable Traceability
H16: There are significant differences between male and female customers in the relationships of
Sustainable Traceability Framework
H16a: There are significant differences between male and female customers in the relationship of
consumer types on acceptance of Halal Food Sustainable Traceability
H16b: There are significant differences between male and female customers in the relationship of
preference on acceptance of Halal Food Sustainable Traceability
H17: There are significant differences between the ages in the relationships of Sustainable
Traceability Framework
H17a: There are significant differences between the ages in the relationship of trackability system
implementation on the acceptance of Halal Food Sustainable Traceability
H17b: There are significant differences between the ages in the relationship of traceability system
implementation on food product sustainability
H17c: There are significant differences between the ages in the relationship of traceability system
implementation on halal supply chain
H17d: There are significant differences between the ages in the relationship of the halal supply chain
on food product sustainability
METHODS
Data collection was carried out on the consumers of halal food products. To identify
and understand consumer perception and acceptance of Halal Food Sustainable Traceability,
the following parameters were needed, (1) the type and lifestyle of the food consumers, (2)
the applications of the traceability system and Supply Chain Perception, (3) the sustainability
of food products (sustainability), and (4) the demographics of the respondents. Meanwhile, in
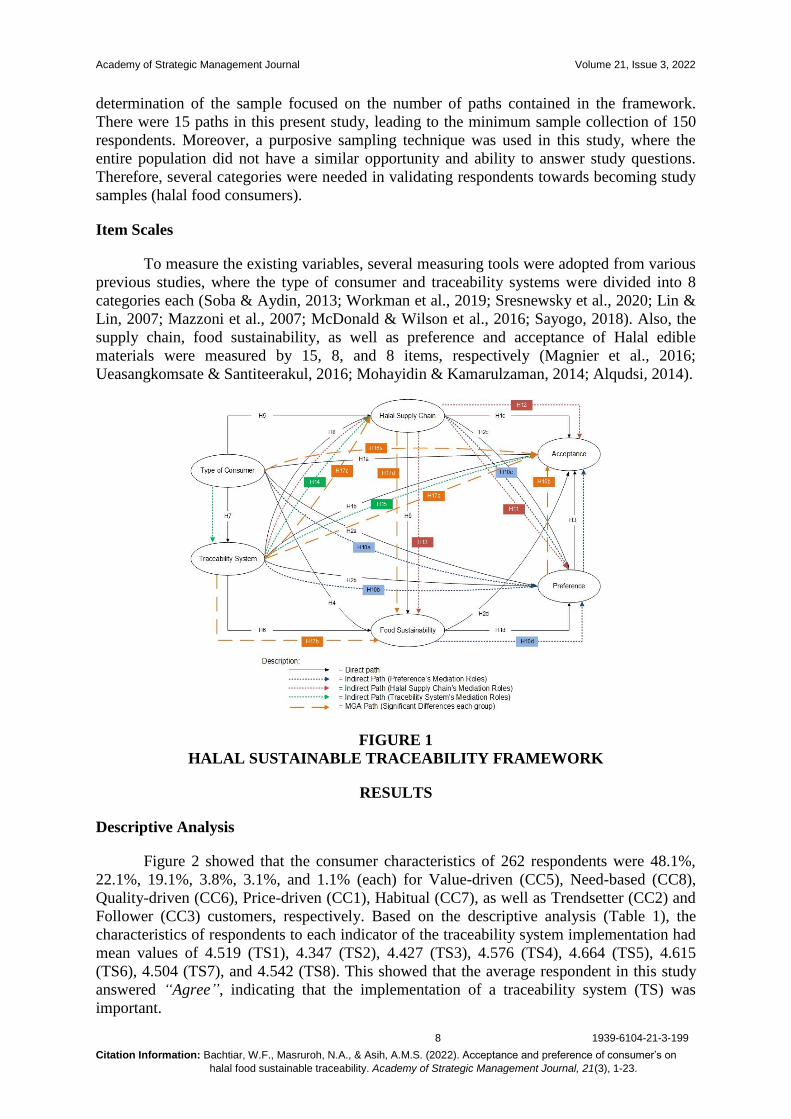
developing the model of traceability for halal food consumers (Figure 1), the relationships
and patterns of the influential factors were identified, using experimental techniques and
Partial Least Squares SEM.
Unit Analysis
Based on this study, the unit of analysis was the consumer of Halal food in Indonesia,
which had a total sample of 262 respondents. According to Hair et al. (2012), the
Academy of Strategic Management Journal Volume 21, Issue 3, 2022
8 1939-6104-21-3-199
Citation Information: Bachtiar, W.F., Masruroh, N.A., & Asih, A.M.S. (2022). Acceptance and preference of consumer’s on
halal food sustainable traceability. Academy of Strategic Management Journal, 21(3), 1-23.
determination of the sample focused on the number of paths contained in the framework.
There were 15 paths in this present study, leading to the minimum sample collection of 150
respondents. Moreover, a purposive sampling technique was used in this study, where the
entire population did not have a similar opportunity and ability to answer study questions.
Therefore, several categories were needed in validating respondents towards becoming study
samples (halal food consumers).
Item Scales
To measure the existing variables, several measuring tools were adopted from various
previous studies, where the type of consumer and traceability systems were divided into 8
categories each (Soba & Aydin, 2013; Workman et al., 2019; Sresnewsky et al., 2020; Lin &
Lin, 2007; Mazzoni et al., 2007; McDonald & Wilson et al., 2016; Sayogo, 2018). Also, the
supply chain, food sustainability, as well as preference and acceptance of Halal edible
materials were measured by 15, 8, and 8 items, respectively (Magnier et al., 2016;
Ueasangkomsate & Santiteerakul, 2016; Mohayidin & Kamarulzaman, 2014; Alqudsi, 2014).
FIGURE 1
HALAL SUSTAINABLE TRACEABILITY FRAMEWORK
RESULTS
Descriptive Analysis
Figure 2 showed that the consumer characteristics of 262 respondents were 48.1%,
22.1%, 19.1%, 3.8%, 3.1%, and 1.1% (each) for Value-driven (CC5), Need-based (CC8),
Quality-driven (CC6), Price-driven (CC1), Habitual (CC7), as well as Trendsetter (CC2) and
Follower (CC3) customers, respectively. Based on the descriptive analysis (Table 1), the
characteristics of respondents to each indicator of the traceability system implementation had
mean values of 4.519 (TS1), 4.347 (TS2), 4.427 (TS3), 4.576 (TS4), 4.664 (TS5), 4.615
(TS6), 4.504 (TS7), and 4.542 (TS8). This showed that the average respondent in this study
answered “Agree”, indicating that the implementation of a traceability system (TS) was
important.

Academy of Strategic Management Journal Volume 21, Issue 3, 2022
9 1939-6104-21-3-199
Citation Information: Bachtiar, W.F., Masruroh, N.A., & Asih, A.M.S. (2022). Acceptance and preference of consumer’s on
halal food sustainable traceability. Academy of Strategic Management Journal, 21(3), 1-23.
Table 1
CHARACTERISTICS OF QUESTIONNAIRE BASED ON VARIABLE HALAL FOOD PRODUCT
IMPLEMENT A TRACEABILITY SYSTEM (TS)
The Measurement Items Mean Standard
Deviation
Additional information on the halal production process (TS 1) 4.519 0.74
Ensuring halal products and processes through the website are useful (TS 2) 4.347 0.855
Link to a company website, describing that the company’s halal practice and process
is very important (TS 3) 4.427 0.815
Link to a government website, verifying that a product truly complies to halal
principle is very important (TS 4) 4.576 0.726
Traceable food provide rich and detailed information (TS 5) 4.664 0.594
Traceable food provide true and accurate information (TS 6) 4.615 0.599
Traceable food provide balanced information (TS 7) 4.504 0.664
The traceability system help me carefully evaluate the products (TS 8) 4.542 0.651
FIGURE 2
CHARACTERISTICS OF CONSUMERS
Table 2
CHARACTERISTICS OF QUESTIONNAIRE BASED ON VARIABLE IMPLEMENT A HALAL
SUPPLY CHAIN PERCEPTION (HC)
The Measurement Items Mean Standard
Deviation
I only buy product that is certified halal (HC1) 4.405 0.931
I select halal even at a high price (HC2) 4.412 0.903
Halal is more important than price and brand (HC3) 4.469 0.881
I am very confident with halal certification from LPPOM MUI (HC4) 4.492 0.74
Popular brand describes the quality of products (HC5) 3.641 1.004
Brand name using the Arabic letter describes product halalness (HC6) 2.74 1.153
All halal logos are trustworthy (HC7) 3.573 1.081
I do not really care about product halalness (HC8) 1.756 1.173
The production, processing, and distribution of Halal meat products involve different
companies at various stages, with service companies providing transport and packaging
(HC9)
4.485 0.818
Food should not contain anything in its preparation, processing, transportation, or
storage, using means or facilities that is unlawful according to Islamic law (HC10) 4.58 0.761
Halal food rules should apply to the food production, storage, transportation,
distribution, preparation, and final consumption (HC11) 4.622 0.698
Halal and non-Halal meat products should be separately stored throughout the Supply
chain, to avoid the risk of Halal product contaminations (HC12) 4.756 0.666
Hygiene and sanitation standards should be adhered to during the processing of Halal
food (HC13) 4.859 0.409
Halal meat products sold at the supermarket and butcher have undergone the true food
requirement of production, handling, and distribution (HC14) 4.302 0.885
Halal meat products are separately transported from the other non-halal goods
throughout the Supply chains and logistics (HC15) 4.645 0.752
10, 4% 3, 1% 3, 1%
4, 2%
126, 48%
50, 0.19
8, 3%
58, 22% Price-driven consumers (CC1)Trendsetter consumers (CC2)Follower consumers (CC3)Novice consumers (CC4)Value-driven consumers (CC5)Quality-driven consumers (CC6)Habitual consumers (CC7)Need-based consumers (CC8)
Academy of Strategic Management Journal Volume 21, Issue 3, 2022
10 1939-6104-21-3-199
Citation Information: Bachtiar, W.F., Masruroh, N.A., & Asih, A.M.S. (2022). Acceptance and preference of consumer’s on
halal food sustainable traceability. Academy of Strategic Management Journal, 21(3), 1-23.
Meanwhile, the responses in each indicator of the Halal Supply Chain Perception
Implementation (Table 2) had mean values of 4.405(HC1), 4.412 (HC2), 4.469 (HC3), 4.492
(HC4), 3.641(HC5), 2.74 (HC6), 3,573 (HC7), 4,485 (HC9), 4.58 (HC10), 4,622 (HC11), 4,756
(HC12), 4,859 (HC13), 4,302 (HC14), 4,645 (HC15) and 1.75 (inverse question; HC8). This
showed that the average respondent in this study answered "Agree", indicating that the
implementation of a Halal Supply Chain Perception (HC) was important. The results showed
that consumers did not previously consider the importance of halal labels, which later became
a concern and an essential factor in purchasing decisions. This required competition among
companies, to provide halal labels to their products and increase the higher-stretching
business. Furthermore, this condition was experienced by the middle-class Muslim market in
Indonesia, which underwent a revolution due to a fundamental shift in the behavior of halal
products. To ensure halal integrity, the implementation of the traceability system was needed,
for consumers to guarantee confidence in the authenticity of the product.
Profile of Respondents
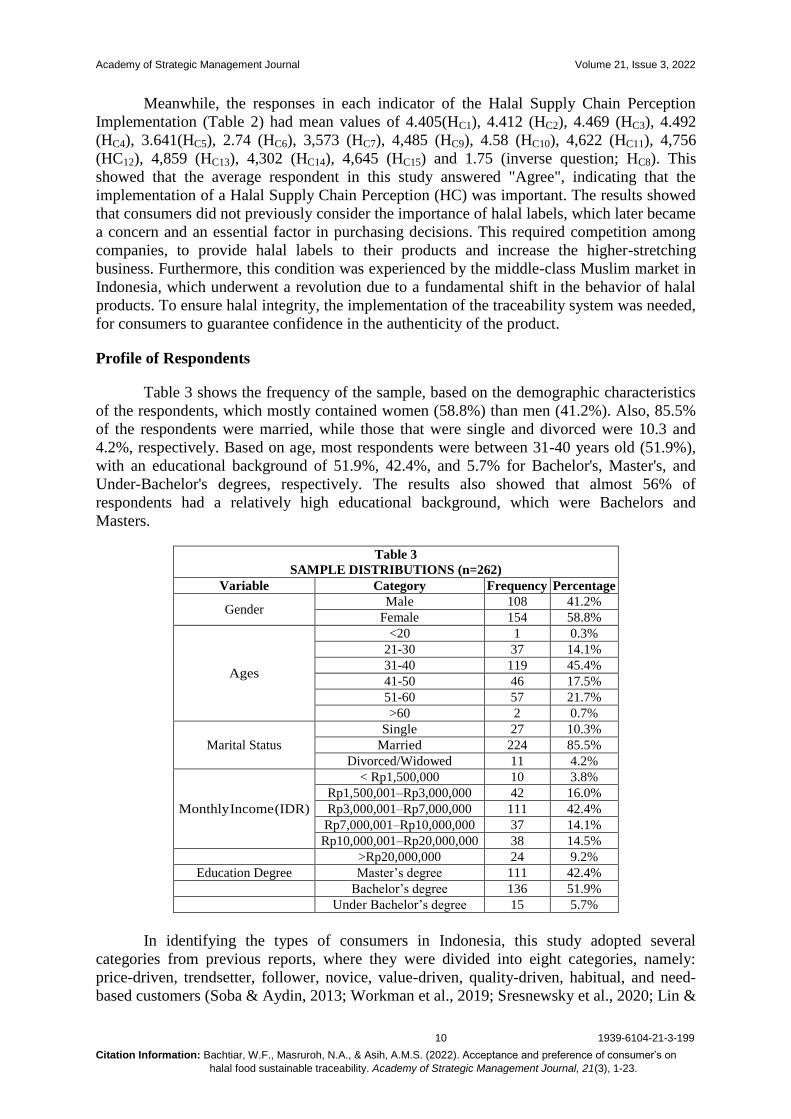
Table 3 shows the frequency of the sample, based on the demographic characteristics
of the respondents, which mostly contained women (58.8%) than men (41.2%). Also, 85.5%
of the respondents were married, while those that were single and divorced were 10.3 and
4.2%, respectively. Based on age, most respondents were between 31-40 years old (51.9%),
with an educational background of 51.9%, 42.4%, and 5.7% for Bachelor's, Master's, and
Under-Bachelor's degrees, respectively. The results also showed that almost 56% of
respondents had a relatively high educational background, which were Bachelors and
Masters.
Table 3
SAMPLE DISTRIBUTIONS (n=262)
Variable Category Frequency Percentage
Gender Male 108 41.2%
Female 154 58.8%
Ages
<20 1 0.3%
21-30 37 14.1%
31-40 119 45.4%
41-50 46 17.5%
51-60 57 21.7%
>60 2 0.7%
Marital Status
Single 27 10.3%
Married 224 85.5%
Divorced/Widowed 11 4.2%
Monthly Income (IDR)
< Rp1,500,000 10 3.8%
Rp1,500,001–Rp3,000,000 42 16.0%
Rp3,000,001–Rp7,000,000 111 42.4%
Rp7,000,001–Rp10,000,000 37 14.1%
Rp10,000,001–Rp20,000,000 38 14.5%
>Rp20,000,000 24 9.2%
Education Degree Master’s degree 111 42.4%
Bachelor’s degree 136 51.9%
Under Bachelor’s degree 15 5.7%
In identifying the types of consumers in Indonesia, this study adopted several
categories from previous reports, where they were divided into eight categories, namely:
price-driven, trendsetter, follower, novice, value-driven, quality-driven, habitual, and need-
based customers (Soba & Aydin, 2013; Workman et al., 2019; Sresnewsky et al., 2020; Lin &

Academy of Strategic Management Journal Volume 21, Issue 3, 2022
11 1939-6104-21-3-199
Citation Information: Bachtiar, W.F., Masruroh, N.A., & Asih, A.M.S. (2022). Acceptance and preference of consumer’s on
halal food sustainable traceability. Academy of Strategic Management Journal, 21(3), 1-23.
Lin, 2007; Mazzoni et al., 2007; Law, 2016; McDonald & Wilson et al., 2016). According to
the number of family members, 60.68% have more than four households. This was supported
by the employment data, with most of the respondents being civil servants and private-sector
workers (86.4% entrepreneurs and 11.1% homemakers), indicating that the purchase of halal
food was for household consumption. Furthermore, most shopping habits were carried out in
traditional markets (55.3%) and modern retail (42.4%). This was based on their respective
locations, which were mostly in residential (54.2%) and suburban (25.2%) areas, where
access to traditional and modern retail markets was highly distributed. Among the eight types
of consumers identified in this study, the majority (48.1% and 19.1%) considered the benefits
and costs incurred, as well as the quality of the halal food products. Meanwhile, others were
concerned with low prices and selected moderate products as a trend. This indicated that the
quality of the product and the benefits obtained by consumers were important in purchasing
halal edible materials in Indonesia. Although a fairly open market with the highest population
of Muslims had 87.2% of 229.6 million people (Global Religious Futures, 2020), the global
halal retail location continued to grow where Indonesia has a great opportunity to participate
in the competition regarding halal food business.
Measurement Model Assessment
The evaluation of the measurement model was carried out to assess the validity and
reliability of the design. In the PLS-SEM method, this model was an outer design containing
a set of relationships between indicators and latent variables (Hair et al., 2014). According to
Hair et al. (2014), the value of the loading factor should be more than 0.70 to assess the
validity of the convergent. Based on the analysis, 17 indicators from a total of 47 measuring
items were below 0.70. However, the remaining 30 items were maintained to measure each of
the intended variables. This was because this study used a reflective measurement model,
where the indicators were a set of representative items reflecting the tested latent variables. In
addition, the elimination of indicators was not much of a problem, due to other factors being
subsequently represented. Therefore, latent variables still had similar interpretations after the
elimination of indicators (Garson, 2016). Furthermore, the analysis continued by observing
the average variance extracted (AVE) value, to test convergent validity with a cut-off above
0.50. This analysis produced several values above 0.05, with 0.640, 0.642, 0.633, 0.838,
0.631, and 1.000 observed for acceptance, food sustainability, halal supply chain, preference,
traceability system, and type of consumers, respectively. Therefore, all variables were valid,
with the ratio implying that the latent factors were responsible for more than 50% of the
reflective indicator variance. However, the AVE was only relevant for reflective
measurement models. When examining the reflective indicators, higher loadings at a narrow
range was very desirable, indicating that all items explained the underlying latent construct
(Chin, 2010). Since there was no problem with convergent validity, the analysis of
discriminant validity was subsequently conducted for each construct.
Wong & Wong (2019) stated that two testing steps were used to measure discriminant
validity, namely the Fornell Larcker criterion and the heterotrait-monotrait ratio of
correlations (HTMT). However, Henseler et al. (2015) suggested that prioritizing the
HMTInference test was better than the Fornell Lacker criterion. This was because of the
criterion failure to identify discriminant validity, especially for significant cases. For this
reason, the HMTinference was often adopted as the test to identify discriminant validity.
Based on this analysis, a bootstrapping procedure with a re-sample of 5000 was initially
executed to obtain the confidence interval (CI) value, which was found to be less than 1.00
(Table 4). This indicated that there was no problem with the discriminant validity (Henseler
et al., 2015). Another analytical method was the cross-loading value, where each correlation
Academy of Strategic Management Journal Volume 21, Issue 3, 2022
12 1939-6104-21-3-199
Citation Information: Bachtiar, W.F., Masruroh, N.A., & Asih, A.M.S. (2022). Acceptance and preference of consumer’s on
halal food sustainable traceability. Academy of Strategic Management Journal, 21(3), 1-23.
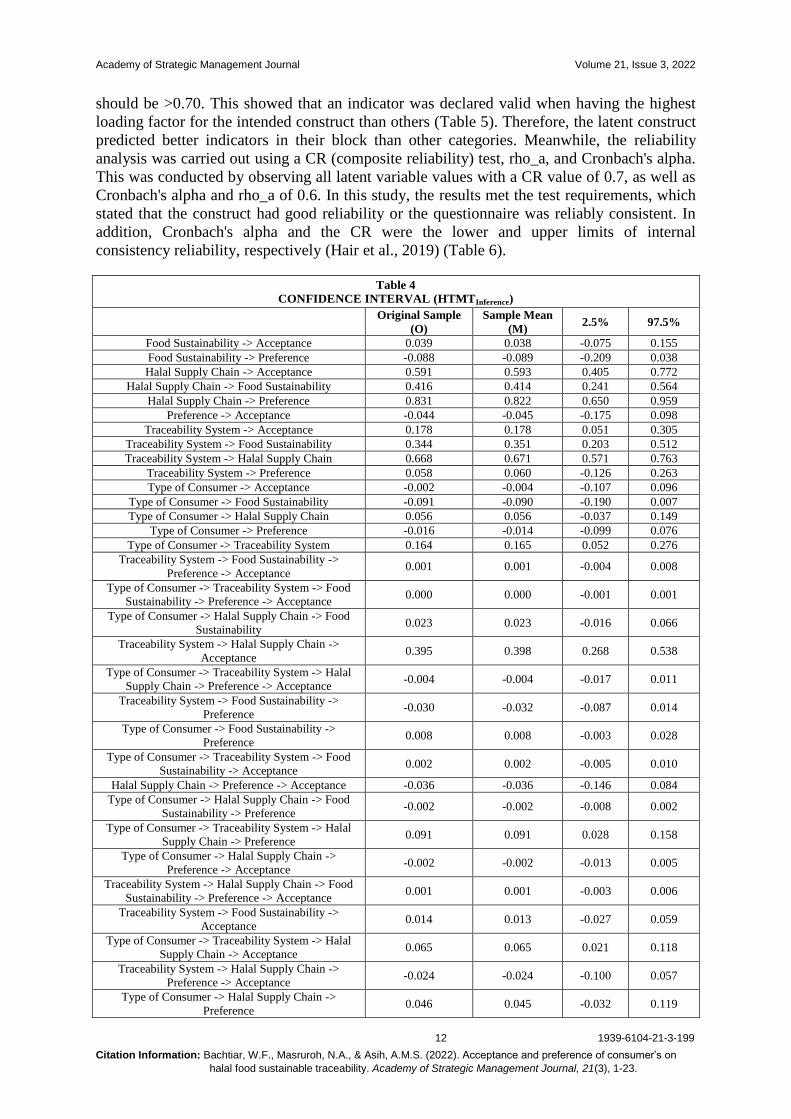
should be >0.70. This showed that an indicator was declared valid when having the highest
loading factor for the intended construct than others (Table 5). Therefore, the latent construct
predicted better indicators in their block than other categories. Meanwhile, the reliability
analysis was carried out using a CR (composite reliability) test, rho_a, and Cronbach's alpha.
This was conducted by observing all latent variable values with a CR value of 0.7, as well as
Cronbach's alpha and rho_a of 0.6. In this study, the results met the test requirements, which
stated that the construct had good reliability or the questionnaire was reliably consistent. In
addition, Cronbach's alpha and the CR were the lower and upper limits of internal
consistency reliability, respectively (Hair et al., 2019) (Table 6).
Table 4
CONFIDENCE INTERVAL (HTMTInference)
Original Sample
(O)
Sample Mean
(M) 2.5% 97.5%
Food Sustainability -> Acceptance 0.039 0.038 -0.075 0.155
Food Sustainability -> Preference -0.088 -0.089 -0.209 0.038
Halal Supply Chain -> Acceptance 0.591 0.593 0.405 0.772
Halal Supply Chain -> Food Sustainability 0.416 0.414 0.241 0.564
Halal Supply Chain -> Preference 0.831 0.822 0.650 0.959
Preference -> Acceptance -0.044 -0.045 -0.175 0.098
Traceability System -> Acceptance 0.178 0.178 0.051 0.305
Traceability System -> Food Sustainability 0.344 0.351 0.203 0.512
Traceability System -> Halal Supply Chain 0.668 0.671 0.571 0.763
Traceability System -> Preference 0.058 0.060 -0.126 0.263
Type of Consumer -> Acceptance -0.002 -0.004 -0.107 0.096
Type of Consumer -> Food Sustainability -0.091 -0.090 -0.190 0.007
Type of Consumer -> Halal Supply Chain 0.056 0.056 -0.037 0.149
Type of Consumer -> Preference -0.016 -0.014 -0.099 0.076
Type of Consumer -> Traceability System 0.164 0.165 0.052 0.276
Traceability System -> Food Sustainability ->
Preference -> Acceptance 0.001 0.001 -0.004 0.008
Type of Consumer -> Traceability System -> Food
Sustainability -> Preference -> Acceptance 0.000 0.000 -0.001 0.001
Type of Consumer -> Halal Supply Chain -> Food
Sustainability 0.023 0.023 -0.016 0.066
Traceability System -> Halal Supply Chain ->
Acceptance 0.395 0.398 0.268 0.538
Type of Consumer -> Traceability System -> Halal
Supply Chain -> Preference -> Acceptance -0.004 -0.004 -0.017 0.011
Traceability System -> Food Sustainability ->
Preference -0.030 -0.032 -0.087 0.014
Type of Consumer -> Food Sustainability ->
Preference 0.008 0.008 -0.003 0.028
Type of Consumer -> Traceability System -> Food
Sustainability -> Acceptance 0.002 0.002 -0.005 0.010
Halal Supply Chain -> Preference -> Acceptance -0.036 -0.036 -0.146 0.084
Type of Consumer -> Halal Supply Chain -> Food
Sustainability -> Preference -0.002 -0.002 -0.008 0.002
Type of Consumer -> Traceability System -> Halal
Supply Chain -> Preference 0.091 0.091 0.028 0.158
Type of Consumer -> Halal Supply Chain ->
Preference -> Acceptance -0.002 -0.002 -0.013 0.005
Traceability System -> Halal Supply Chain -> Food
Sustainability -> Preference -> Acceptance 0.001 0.001 -0.003 0.006
Traceability System -> Food Sustainability ->
Acceptance 0.014 0.013 -0.027 0.059
Type of Consumer -> Traceability System -> Halal
Supply Chain -> Acceptance 0.065 0.065 0.021 0.118
Traceability System -> Halal Supply Chain ->
Preference -> Acceptance -0.024 -0.024 -0.100 0.057
Type of Consumer -> Halal Supply Chain ->
Preference 0.046 0.045 -0.032 0.119

Academy of Strategic Management Journal Volume 21, Issue 3, 2022
13 1939-6104-21-3-199
Citation Information: Bachtiar, W.F., Masruroh, N.A., & Asih, A.M.S. (2022). Acceptance and preference of consumer’s on
halal food sustainable traceability. Academy of Strategic Management Journal, 21(3), 1-23.
Table 4
CONFIDENCE INTERVAL (HTMTInference)
Original Sample
(O)
Sample Mean
(M) 2.5% 97.5%
Food Sustainability -> Preference -> Acceptance 0.004 0.004 -0.011 0.021
Traceability System -> Halal Supply Chain -> Food
Sustainability -> Acceptance 0.011 0.011 -0.021 0.045
Halal Supply Chain -> Food Sustainability ->
Preference -0.036 -0.036 -0.089 0.016
Type of Consumer -> Traceability System -> Halal
Supply Chain -> Food Sustainability -> Preference ->
Acceptance
0.000 0.000 -0.001 0.001
Type of Consumer -> Traceability System -> Halal
Supply Chain -> Food Sustainability -> Acceptance 0.002 0.002 -0.004 0.008
Type of Consumer -> Traceability System ->
Preference 0.010 0.010 -0.022 0.049
Type of Consumer -> Traceability System ->
Preference -> Acceptance 0.000 0.000 -0.004 0.002
Type of Consumer -> Traceability System -> Food
Sustainability 0.057 0.057 0.017 0.109
Halal Supply Chain -> Food Sustainability ->
Preference -> Acceptance 0.002 0.001 -0.005 0.009
Traceability System -> Halal Supply Chain ->
Preference 0.555 0.552 0.410 0.693
Type of Consumer -> Preference -> Acceptance 0.001 0.001 -0.005 0.012
Traceability System -> Preference -> Acceptance -0.003 -0.003 -0.025 0.013
Type of Consumer -> Halal Supply Chain -> Food
Sustainability -> Acceptance 0.001 0.001 -0.003 0.005
Type of Consumer -> Traceability System -> Food
Sustainability -> Preference -0.005 -0.005 -0.017 0.002
Type of Consumer -> Food Sustainability ->
Acceptance -0.004 -0.003 -0.015 0.009
Type of Consumer -> Traceability System -> Halal
Supply Chain 0.110 0.110 0.036 0.187
Type of Consumer -> Halal Supply Chain -> Food
Sustainability -> Preference -> Acceptance 0.000 0.000 0.000 0.001
Type of Consumer -> Food Sustainability ->
Preference -> Acceptance 0.000 0.000 -0.003 0.001
Type of Consumer -> Halal Supply Chain ->
Acceptance 0.033 0.034 -0.020 0.099
Halal Supply Chain -> Food Sustainability ->
Acceptance 0.016 0.016 -0.032 0.068
Type of Consumer -> Traceability System ->
Acceptance 0.029 0.029 0.005 0.062
Type of Consumer -> Traceability System -> Halal
Supply Chain -> Food Sustainability 0.046 0.046 0.012 0.088
Traceability System -> Halal Supply Chain -> Food
Sustainability 0.278 0.277 0.167 0.386
Traceability System -> Halal Supply Chain -> Food
Sustainability -> Preference -0.024 -0.025 -0.062 0.011
Type of Consumer -> Traceability System -> Halal
Supply Chain -> Food Sustainability -> Preference -0.004 -0.004 -0.013 0.001
Structural Model Assessment
After meeting the outer model criteria, the structural design (inner model) analysis
was subsequently carried out. According to Hair et al. (2021), the evaluation of the structural
model (inner model) predicted the relationship between the latent variables. In Hair et al.
(2012) also suggested that the value of inner VIF, predictive relevance (Q2), and model fit
should be adopted, to assess the structural model (inner model). Also, the assumption of
multicollinearity was used to observe no perfect or significant correlation between the
independent variables. This was because the correlation value between the observed variables
Academy of Strategic Management Journal Volume 21, Issue 3, 2022
14 1939-6104-21-3-199
Citation Information: Bachtiar, W.F., Masruroh, N.A., & Asih, A.M.S. (2022). Acceptance and preference of consumer’s on
halal food sustainable traceability. Academy of Strategic Management Journal, 21(3), 1-23.
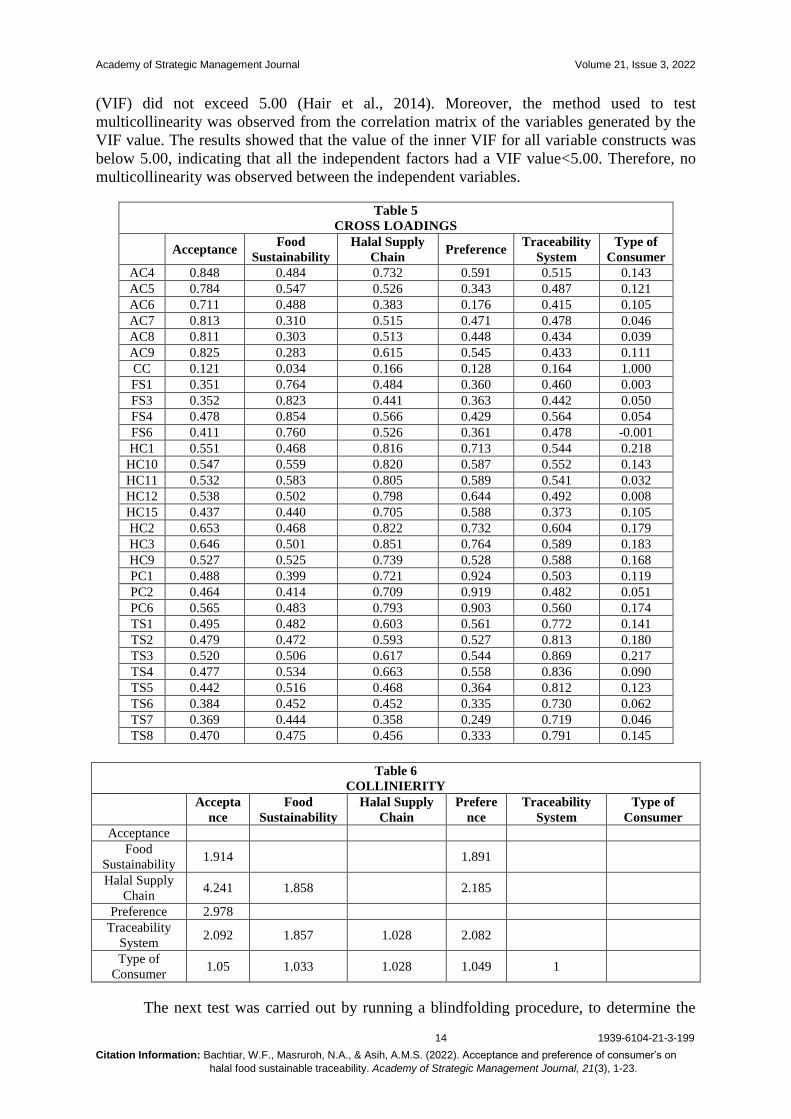
(VIF) did not exceed 5.00 (Hair et al., 2014). Moreover, the method used to test
multicollinearity was observed from the correlation matrix of the variables generated by the
VIF value. The results showed that the value of the inner VIF for all variable constructs was
below 5.00, indicating that all the independent factors had a VIF value<5.00. Therefore, no
multicollinearity was observed between the independent variables.
Table 5
CROSS LOADINGS
Acceptance Food
Sustainability
Halal Supply
Chain Preference
Traceability
System
Type of
Consumer
AC4 0.848 0.484 0.732 0.591 0.515 0.143
AC5 0.784 0.547 0.526 0.343 0.487 0.121
AC6 0.711 0.488 0.383 0.176 0.415 0.105
AC7 0.813 0.310 0.515 0.471 0.478 0.046
AC8 0.811 0.303 0.513 0.448 0.434 0.039
AC9 0.825 0.283 0.615 0.545 0.433 0.111
CC 0.121 0.034 0.166 0.128 0.164 1.000
FS1 0.351 0.764 0.484 0.360 0.460 0.003
FS3 0.352 0.823 0.441 0.363 0.442 0.050
FS4 0.478 0.854 0.566 0.429 0.564 0.054
FS6 0.411 0.760 0.526 0.361 0.478 -0.001
HC1 0.551 0.468 0.816 0.713 0.544 0.218
HC10 0.547 0.559 0.820 0.587 0.552 0.143
HC11 0.532 0.583 0.805 0.589 0.541 0.032
HC12 0.538 0.502 0.798 0.644 0.492 0.008
HC15 0.437 0.440 0.705 0.588 0.373 0.105
HC2 0.653 0.468 0.822 0.732 0.604 0.179
HC3 0.646 0.501 0.851 0.764 0.589 0.183
HC9 0.527 0.525 0.739 0.528 0.588 0.168
PC1 0.488 0.399 0.721 0.924 0.503 0.119
PC2 0.464 0.414 0.709 0.919 0.482 0.051
PC6 0.565 0.483 0.793 0.903 0.560 0.174
TS1 0.495 0.482 0.603 0.561 0.772 0.141
TS2 0.479 0.472 0.593 0.527 0.813 0.180
TS3 0.520 0.506 0.617 0.544 0.869 0.217
TS4 0.477 0.534 0.663 0.558 0.836 0.090
TS5 0.442 0.516 0.468 0.364 0.812 0.123
TS6 0.384 0.452 0.452 0.335 0.730 0.062
TS7 0.369 0.444 0.358 0.249 0.719 0.046
TS8 0.470 0.475 0.456 0.333 0.791 0.145
Table 6
COLLINIERITY
Accepta
nce
Food
Sustainability
Halal Supply
Chain
Prefere
nce
Traceability
System
Type of
Consumer
Acceptance
Food
Sustainability 1.914
1.891
Halal Supply
Chain 4.241 1.858
2.185
Preference 2.978
Traceability
System 2.092 1.857 1.028 2.082
Type of
Consumer 1.05 1.033 1.028 1.049 1
The next test was carried out by running a blindfolding procedure, to determine the

Academy of Strategic Management Journal Volume 21, Issue 3, 2022
15 1939-6104-21-3-199
Citation Information: Bachtiar, W.F., Masruroh, N.A., & Asih, A.M.S. (2022). Acceptance and preference of consumer’s on
halal food sustainable traceability. Academy of Strategic Management Journal, 21(3), 1-23.
value of Q-Squared. This statistic was obtained through the reuse sample technique known as
“Blindfolding”, where the distance of removal was set between 5 and 10. The number of
observations subsequently divided by the distance of removal was found not to be an integer
(Hair et al., 2012). For example, when an omission distance of 7 was selected, every seventh
data point was omitted, indicating that the parameter was estimated with the remaining
values. According to Hair et al. (2014), the omitted data points were replaced with average
values. This was because the estimated parameters predicted the omitted data points, as the
difference between the actual and expected values became the input for the Q2 calculation.
The blindfolding technique was only applied to endogenous constructions with reflective
indicators, indicating the predictive relevance of the pathway model when Q2 became more
significant than zero. Based on the calculation of predictive relevance (Q2), which showed a
value greater than zero (Table 7), the model was observed to have a relevant value.
According to Avkiran & Ringle (2018), the development of a goodness-of-fit index for PLS-
SEM was not entirely successful. Moreover, Henseler & Sarstedt (2013) showed that the
goodness-of-fit (Tenenhaus et al., 2004; Esposito Vinzi et al., 2008) indices were not suitable
for model validation. The PLSc (consistent PLS) ensured the possibility to correct the PLS
bias and subsequently mimic the results, based on the CB-SEM factor model (Bentler &
Huang, 2014; Dijkstra & Schermelleh-Engel, 2014; Dijkstra & Henseler, 2015). In this case,
the fit measures should be adopted, such as standard root mean square residual (SRMR) and
normed fit index (NFI) (Henseler et al., 2014; Andriani & Putra, 2019). This was because the
evaluation of the model fitting in this study was carried out using two test designs, i.e., the
standardized root mean square residual (SRMR) of 0.082 and the normed-fit index (NFI) of
0.706 (70%). The model was considered to have a good fit when the SRMR was below 0.10
(Hair et al., 2014).
Table 7
PREDICTIVE RELEVANCE
SSO SSE Q² (=1-SSE/SSO)
Acceptance 1572.000 1086.954 0.309
Food Sustainability 1048.000 743.787 0.290
Halal Supply Chain 2096.000 1514.631 0.277
Preference 786.000 369.436 0.530
Traceability System 2096.000 2065.113 0.015
Type of Consumer 262.000 262.000
Hypothesis Testing
Data analysis was carried out from the stage of conceptualization to testing the study
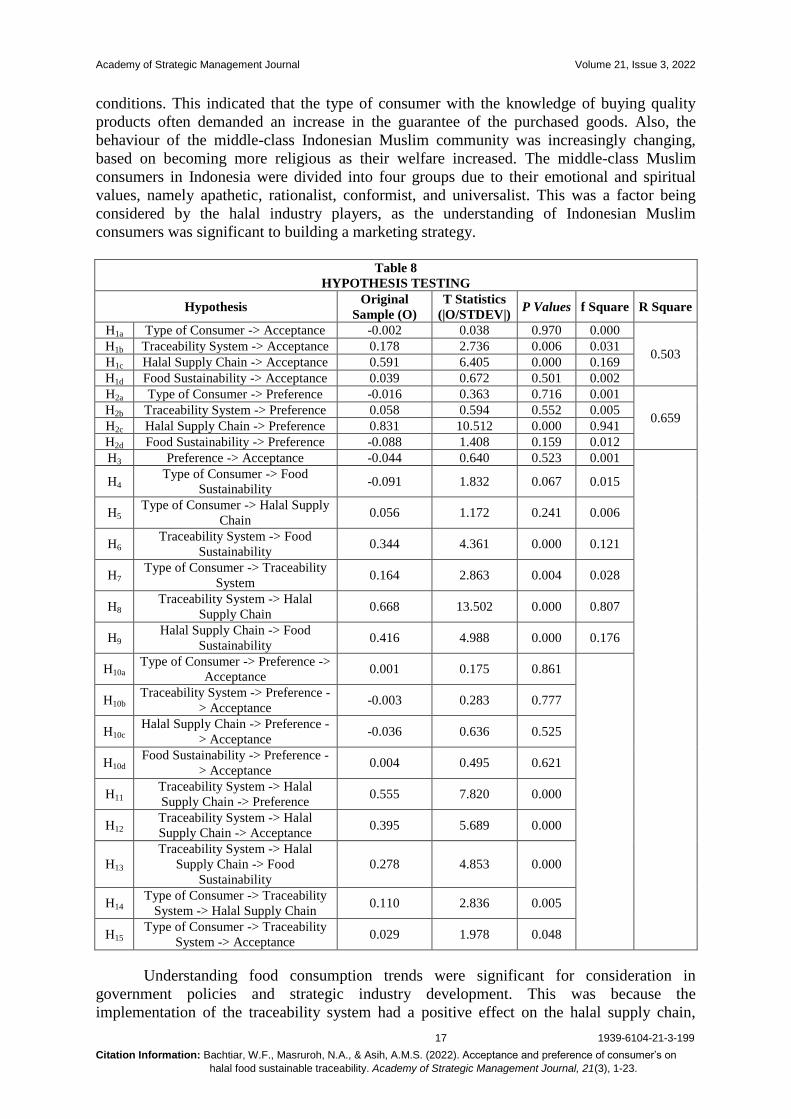
hypothesis, which was used to develop answers to the problem formulation. Based on Table
8, consumer types, food sustainability, and preference were found to have no effect, due to
the p-value being above the 0.05 threshold. However, the traceability system and halal supply
chain were influential with p-values of 0.006 and 0.000 (<0.05), as well as path coefficient
values of 0.178 and 0.591, respectively. This indicated that they had a positive relationship
direction. Therefore, the acceptance of Indonesian consumers increased when they know that
the production process has an excellent traceability system and a strict halal supply chain.
Meanwhile, these acceptances were not based on the type of consumer, food sustainability,
and preference. These were in line with Omar & Jaafar (2011), which found that consumers'
methods of selecting halal products were based on the food ingredients and the halalness of
all activities along the supply chain. The results also showed that the halal supply chain was
the only predictor capable of influencing preference, at a p-value and path coefficient of
0.000 (<0.05) and 0.831, respectively, indicating a positive relationship direction. This
indicated that consumer preferences for halal food sustainable traceability only increased
Academy of Strategic Management Journal Volume 21, Issue 3, 2022
16 1939-6104-21-3-199
Citation Information: Bachtiar, W.F., Masruroh, N.A., & Asih, A.M.S. (2022). Acceptance and preference of consumer’s on
halal food sustainable traceability. Academy of Strategic Management Journal, 21(3), 1-23.
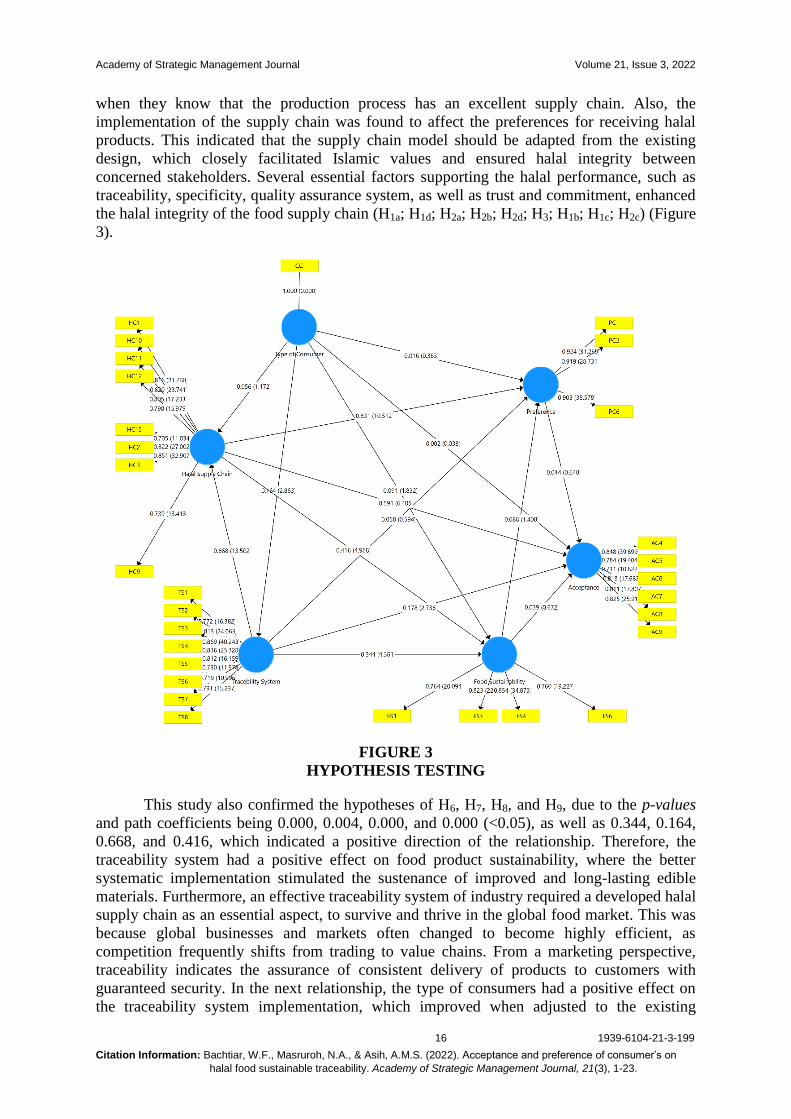
when they know that the production process has an excellent supply chain. Also, the
implementation of the supply chain was found to affect the preferences for receiving halal
products. This indicated that the supply chain model should be adapted from the existing
design, which closely facilitated Islamic values and ensured halal integrity between
concerned stakeholders. Several essential factors supporting the halal performance, such as
traceability, specificity, quality assurance system, as well as trust and commitment, enhanced
the halal integrity of the food supply chain (H1a; H1d; H2a; H2b; H2d; H3; H1b; H1c; H2c) (Figure
3).
FIGURE 3
HYPOTHESIS TESTING
This study also confirmed the hypotheses of H6, H7, H8, and H9, due to the p-values
and path coefficients being 0.000, 0.004, 0.000, and 0.000 (<0.05), as well as 0.344, 0.164,
0.668, and 0.416, which indicated a positive direction of the relationship. Therefore, the
traceability system had a positive effect on food product sustainability, where the better
systematic implementation stimulated the sustenance of improved and long-lasting edible
materials. Furthermore, an effective traceability system of industry required a developed halal
supply chain as an essential aspect, to survive and thrive in the global food market. This was
because global businesses and markets often changed to become highly efficient, as
competition frequently shifts from trading to value chains. From a marketing perspective,
traceability indicates the assurance of consistent delivery of products to customers with
guaranteed security. In the next relationship, the type of consumers had a positive effect on
the traceability system implementation, which improved when adjusted to the existing
Academy of Strategic Management Journal Volume 21, Issue 3, 2022
17 1939-6104-21-3-199
Citation Information: Bachtiar, W.F., Masruroh, N.A., & Asih, A.M.S. (2022). Acceptance and preference of consumer’s on
halal food sustainable traceability. Academy of Strategic Management Journal, 21(3), 1-23.
conditions. This indicated that the type of consumer with the knowledge of buying quality
products often demanded an increase in the guarantee of the purchased goods. Also, the
behaviour of the middle-class Indonesian Muslim community was increasingly changing,
based on becoming more religious as their welfare increased. The middle-class Muslim
consumers in Indonesia were divided into four groups due to their emotional and spiritual
values, namely apathetic, rationalist, conformist, and universalist. This was a factor being
considered by the halal industry players, as the understanding of Indonesian Muslim
consumers was significant to building a marketing strategy.
Table 8
HYPOTHESIS TESTING
Hypothesis Original
Sample (O)
T Statistics
(|O/STDEV|) P Values f Square R Square
H1a Type of Consumer -> Acceptance -0.002 0.038 0.970 0.000
0.503 H1b Traceability System -> Acceptance 0.178 2.736 0.006 0.031
H1c Halal Supply Chain -> Acceptance 0.591 6.405 0.000 0.169
H1d Food Sustainability -> Acceptance 0.039 0.672 0.501 0.002
H2a Type of Consumer -> Preference -0.016 0.363 0.716 0.001
0.659 H2b Traceability System -> Preference 0.058 0.594 0.552 0.005
H2c Halal Supply Chain -> Preference 0.831 10.512 0.000 0.941
H2d Food Sustainability -> Preference -0.088 1.408 0.159 0.012
H3 Preference -> Acceptance -0.044 0.640 0.523 0.001
H4 Type of Consumer -> Food
Sustainability -0.091 1.832 0.067 0.015
H5 Type of Consumer -> Halal Supply
Chain 0.056 1.172 0.241 0.006
H6 Traceability System -> Food
Sustainability 0.344 4.361 0.000 0.121
H7 Type of Consumer -> Traceability
System 0.164 2.863 0.004 0.028
H8 Traceability System -> Halal
Supply Chain 0.668 13.502 0.000 0.807
H9 Halal Supply Chain -> Food
Sustainability 0.416 4.988 0.000 0.176
H10a Type of Consumer -> Preference ->
Acceptance 0.001 0.175 0.861
H10b Traceability System -> Preference -
> Acceptance -0.003 0.283 0.777
H10c Halal Supply Chain -> Preference -
> Acceptance -0.036 0.636 0.525
H10d Food Sustainability -> Preference -
> Acceptance 0.004 0.495 0.621
H11 Traceability System -> Halal
Supply Chain -> Preference 0.555 7.820 0.000
H12 Traceability System -> Halal
Supply Chain -> Acceptance 0.395 5.689 0.000
H13
Traceability System -> Halal
Supply Chain -> Food
Sustainability
0.278 4.853 0.000
H14 Type of Consumer -> Traceability
System -> Halal Supply Chain 0.110 2.836 0.005
H15 Type of Consumer -> Traceability
System -> Acceptance 0.029 1.978 0.048
Understanding food consumption trends were significant for consideration in
government policies and strategic industry development. This was because the
implementation of the traceability system had a positive effect on the halal supply chain,

Academy of Strategic Management Journal Volume 21, Issue 3, 2022
18 1939-6104-21-3-199
Citation Information: Bachtiar, W.F., Masruroh, N.A., & Asih, A.M.S. (2022). Acceptance and preference of consumer’s on
halal food sustainable traceability. Academy of Strategic Management Journal, 21(3), 1-23.
which subsequently had a significant influence on food product sustainability. The better the
implementation of the traceability system, the higher the improvement of the halal supply
chain, which sustainably maintains the sustainability of food products. In the food trade, the
demands of the globalization era promoted the integrity of the product chain, including
security issues and information on the origin of raw materials to quality problems. Consumers
also demanded verifiable evidence of traceability, as an essential criterion of food safety
quality and assurance. To overcome this requirement, there was a need for a traceability
system with the ability to provide information on the origin, processing, retail, and final
destination of foodstuffs (Aung & Chang, 2014). The results also showed no effect on H4 and
H5, due to having a p-value above 0.05. In the indirect relationship, the preference variable
was not able to mediate the association (no mediation effects) between the four predictors
(Type of Consumer, Traceability System, Halal Supply Chain, and Food Sustainability) and
the acceptance of Halal Food Sustainable Traceability. This indicated that preference did not
act as a mediating variable between the existing relationships (H10a, H10b, H10c, & H10d). The
existence of a preference did not also boost the existing predictors to affect the acceptance of
Halal Food Sustainable Traceability, as it only worsened the existing conditions due to
everyone having their own bias. Preferences from close people also often provided
consumers with a sense of security, when carrying out purchasing decisions, especially the
selection of food products. Besides that, information and communication technology played
an essential role in facilitating food safety policies, by encouraging positive changes in
consumers' behaviors.
Besides preference, two variables also acted as mediators in this study, namely the
halal supply chain and the traceability system. The supply chain was found to fully mediate
(H11) the relationship between the traceability system and preference. This was in line with
the discovery of a direct relationship (H2b) that indicated no effect when not through the halal
supply chain. This variable was then found to partially mediate (H12) the relationship between
the traceability system and acceptance, indicating the determination of an influential direct
association (H1b). Also, the role of the halal supply chain partially mediated (H13) the
relationship between the traceability system and food sustainability, through the discovery of
an effective direct association (H6). This indicated that the presence or absence of a halal
supply chain influenced the acceptance and the relationship between traceability system and
food sustainability. Meanwhile, the role of the traceability system fully mediated (H14; H15)
the relationship between the type of consumer to the supply chain and acceptance. This is in
line with the discovery of an insignificant direct relationship (H5; H1a). Therefore, food
production and processes supporting halal principles met sustainability and environmental
issues, including the assurance of a product's safety and cleanliness for consumption. The
three main dimensions for the improvement of traceability implementation were food safety
assurance, security and quality, as well as risk prevention. In addition, traceability provided
further information on the application of several halal standards have been applied, allowed
the verification of consumers' claims, and ensured the delivery of tayyib products to
customers (healthy, safe, nutritious, and good quality).
Multi-Group Analysis (MGA) Assessment
Multi-Group Analysis (MGA) was used to test predefined data groups, to determine
the existence of significant differences across group-specific parameter estimates, including
outer weights and loadings as well as path coefficients (Hair et al., 2021). When the groups
are known, MGA also tested for the variations between the different classes in two identical
models. The ability to identify the presence/absence of multigroup differences was anchored
in the PLSPM technique (Hair et al., 2021).

Academy of Strategic Management Journal Volume 21, Issue 3, 2022
19 1939-6104-21-3-199
Citation Information: Bachtiar, W.F., Masruroh, N.A., & Asih, A.M.S. (2022). Acceptance and preference of consumer’s on
halal food sustainable traceability. Academy of Strategic Management Journal, 21(3), 1-23.
Table 9
MGA ANALYSIS GENDER
Hypothesis p-Value-diff (Male vs Female)
H16a Type of Consumer -> Acceptance 0.031
H16b Preference -> Acceptance 0.032
Based on Table 9, there were differences between the male and female groups,
regarding the relationship between the type of consumer and preference for acceptance. This
was because the p-value difference was 0.031 and 0.032 (<0.05), indicating that H16a and H16b
were confirmed. In Table 10, the acceptance of male respondents was not based on the type
of consumer. However, this variable was very important for female respondents, to receive
halal food sustainable traceability. Another interesting thing found in this study was the
acceptance from male respondents, regarding the preference, which was found to be opposite
in female participants.
Table 10
BOOTSRAPPING RESULTS OF GENDER
Path p-Value (Male) p-Value (Female)
Type of Consumer -> Acceptance 0.178 0.046
Preference -> Acceptance 0.017 0.555
Based on Table 11, there were differences between the groups of respondents above
50 years and 41-50, regarding the relationship between the traceability system and
acceptance. This was because the p-value difference was 0.032, indicating that H17a was
accepted in the comparison of these groups (>50 and 41-50 years) and rejected in other
classes. In addition, the comparisons of age group above 50 and 31-40 years found
differences in the relationship between the traceability system and food sustainability. This
was because the p-value difference was 0.043, indicating that H17b was accepted in the
comparison of these groups (>50 and 31-40 years), and rejected in other analysis.
Table 11
MGA ANALYSIS AGES
Hypothesis
p-Value
new
(Diatas 50
Tahun vs
Usia 21 -
30 Tahun)
p-Value new
(Diatas 50
Tahun vs
Usia 31 -
40Tahun)
p-Value
new
(Diatas 50
Tahun vs
Usia 41 -
50 Tahun)
p-Value new
(Dibawah 30
Tahun vs
Usia 31 -
40Tahun)
p-Value new
(Dibawah 30
Tahun vs
Usia 41 - 50
Tahun)
p-Value new
(Usia 31 -
40Tahun vs
Usia 41 - 50
Tahun)
H17a
Traceability
System ->
Acceptance
0.511 0.738 0.032 0.654 0.432 0.074
H17b
Traceability
System -> Food
Sustainability
0.084 0.043 0.268 0.792 0.340 0.306
H17c
Traceability
System ->
Halal Supply
Chain
0.241 0.194 0.857 0.003 0.422 0.198
H17d
Halal Supply
Chain -> Food
Sustainability
0.117 0.047 0.551 0.968 0.254 0.148
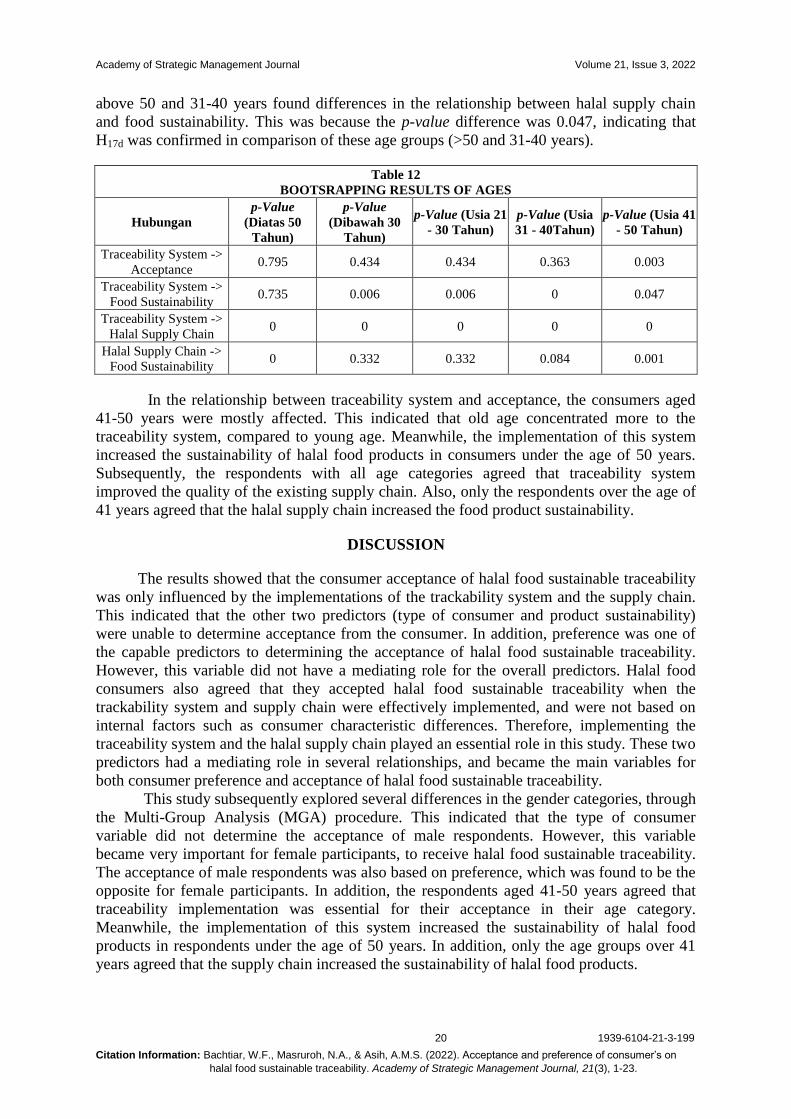
Based on Table 12, the age groups below 30 and 31-40 years found significant
differences in the relationship between traceability system and halal supply chain. This was
because the p-value difference was 0.003, indicating that hypothesis H17c was confirmed in
the comparison of these age groups (<30 and 31-40 years). Furthermore, the age groups
Academy of Strategic Management Journal Volume 21, Issue 3, 2022
20 1939-6104-21-3-199
Citation Information: Bachtiar, W.F., Masruroh, N.A., & Asih, A.M.S. (2022). Acceptance and preference of consumer’s on
halal food sustainable traceability. Academy of Strategic Management Journal, 21(3), 1-23.
above 50 and 31-40 years found differences in the relationship between halal supply chain
and food sustainability. This was because the p-value difference was 0.047, indicating that
H17d was confirmed in comparison of these age groups (>50 and 31-40 years).
Table 12
BOOTSRAPPING RESULTS OF AGES
Hubungan
p-Value
(Diatas 50
Tahun)
p-Value
(Dibawah 30
Tahun)
p-Value (Usia 21
- 30 Tahun)
p-Value (Usia
31 - 40Tahun)
p-Value (Usia 41
- 50 Tahun)
Traceability System ->
Acceptance 0.795 0.434 0.434 0.363 0.003
Traceability System ->
Food Sustainability 0.735 0.006 0.006 0 0.047
Traceability System ->
Halal Supply Chain 0 0 0 0 0
Halal Supply Chain ->
Food Sustainability 0 0.332 0.332 0.084 0.001
In the relationship between traceability system and acceptance, the consumers aged
41-50 years were mostly affected. This indicated that old age concentrated more to the
traceability system, compared to young age. Meanwhile, the implementation of this system
increased the sustainability of halal food products in consumers under the age of 50 years.
Subsequently, the respondents with all age categories agreed that traceability system
improved the quality of the existing supply chain. Also, only the respondents over the age of
41 years agreed that the halal supply chain increased the food product sustainability.
DISCUSSION
The results showed that the consumer acceptance of halal food sustainable traceability
was only influenced by the implementations of the trackability system and the supply chain.
This indicated that the other two predictors (type of consumer and product sustainability)
were unable to determine acceptance from the consumer. In addition, preference was one of
the capable predictors to determining the acceptance of halal food sustainable traceability.
However, this variable did not have a mediating role for the overall predictors. Halal food
consumers also agreed that they accepted halal food sustainable traceability when the
trackability system and supply chain were effectively implemented, and were not based on
internal factors such as consumer characteristic differences. Therefore, implementing the
traceability system and the halal supply chain played an essential role in this study. These two
predictors had a mediating role in several relationships, and became the main variables for
both consumer preference and acceptance of halal food sustainable traceability.
This study subsequently explored several differences in the gender categories, through
the Multi-Group Analysis (MGA) procedure. This indicated that the type of consumer
variable did not determine the acceptance of male respondents. However, this variable
became very important for female participants, to receive halal food sustainable traceability.
The acceptance of male respondents was also based on preference, which was found to be the
opposite for female participants. In addition, the respondents aged 41-50 years agreed that
traceability implementation was essential for their acceptance in their age category.
Meanwhile, the implementation of this system increased the sustainability of halal food
products in respondents under the age of 50 years. In addition, only the age groups over 41
years agreed that the supply chain increased the sustainability of halal food products.
Academy of Strategic Management Journal Volume 21, Issue 3, 2022
21 1939-6104-21-3-199
Citation Information: Bachtiar, W.F., Masruroh, N.A., & Asih, A.M.S. (2022). Acceptance and preference of consumer’s on
halal food sustainable traceability. Academy of Strategic Management Journal, 21(3), 1-23.
CONCLUSION
This study showed that traceability system and halal supply chain implementations
were significant predictors for the Indonesian Muslim communities. However, non-Muslim
countries did not concentrate much to these aspects due to different levels of understanding.
This was because they viewed halal products as clean, healthy, and delicious products,
indicating their support for the knowledge of these edible materials. Moreover, these were
quality products based on the concept of halalan thoyyiban (halal and healthy), due to
integrating Good Manufacturing Practices (GMP) and HACCP. In Indonesia, the production
of non-halal food was still highly unproduced, for integration to be conducted at a relatively
low cost. Meanwhile, enormous costs were highly incurred in non-Muslim countries still
producing much non-halal products. Therefore, the implementations of traceability systems
and supply chains required expensive infrastructures, which directly impacted the selling
price of halal products. This was because companies need to have a good understanding of
when they want to integrate halal supply chains for different markets. Based on this study, the
main predictors of preference and acceptance of halal food sustainable traceability were
developed and analyzed. Also, each of the existing mediating roles were tested by comparing
Multi-Group (MGA) technique with several categories of respondent groups, such as gender
and age. However, some limitations still have to be evaluated in this study, where the cost
needed in implementing halal food sustainable traceability was not considered. Another
limitation was the comparisons of limited respondent groups. For this reason, further studies
on the existing shortcomings should be deeply reviewed, to obtain a more comprehensive
result.
ACKNOWLEDGEMENT
This study was funded by RTA 2021 grant number 3190/UN1/DITLIT/DIT-
LIT/PT/2021 from Universitas Gadjah Mada, Indonesia.
REFERENCES
Abd Rahman, A., Singhry, H.B., Hanafiah, M.H., & Abdul, M. (2017). Influence of perceived benefits and
traceability system on the readiness for Halal Assurance System implementation among food
manufacturers. Food Control, 73, 1318-1326.
Abdallah, A., Rahem, M. A., & Pasqualone, A. (2021). The multiplicity of halal standards: a case study of
application to slaughterhouses. Journal of Ethnic Foods, 8(1), 1-15.
Alqudsi, S.G. (2014). Awareness and demand for 100% halal supply chain meat products. Procedia-Social and
Behavioral Sciences, 130, 167-178.
Andriani, R., & Putra, W.B.T.S. (2019). The intersection of marketing and human resources dicipline: employer
brand equity as a mediator in recruitment process. International Journal of Innovative Science and
Research Technology (4), 465-475.
Aung, M.M., & Chang, Y.S. (2014). Traceability in a food supply chain: Safety and quality perspectives. Food
control, 39, 172-184.
Avkiran, N.K., & Ringle, C.M. (2018). Partial least squares structural equation modeling: Recent advances in
banking and finance.
Bentler, P.M., & Huang, W. (2014). On components, latent variables, PLS and simple methods: Reactions to
Rigdon's rethinking of PLS. Long Range Planning, 47(3), 138-145.
Chin, W.W. (2010). How to write up and report PLS analyses. In Handbook of partial least squares (pp. 655-
690). Springer, Berlin, Heidelberg.
Dali, N.R.S.M., Sulaiman, S., Samad, A.A., Ismail, N., & Alwi, S.H. (2007). Halal products from the consumers
perception. An online survey. In Proceeding of the Islamic Entrepreurship Conference, KolejUniversiti
Islam Malaysia.
Dijkstra, T.K., & Henseler, J. (2015). Consistent and asymptotically normal PLS estimators for linear structural
equations. Computational Statistics & Data Analysis, 81, 10-23.
Academy of Strategic Management Journal Volume 21, Issue 3, 2022
22 1939-6104-21-3-199
Citation Information: Bachtiar, W.F., Masruroh, N.A., & Asih, A.M.S. (2022). Acceptance and preference of consumer’s on
halal food sustainable traceability. Academy of Strategic Management Journal, 21(3), 1-23.
Dijkstra, T.K., & Schermelleh-Engel, K. (2014). Consistent partial least squares for nonlinear structural
equation models. Psychometrika, 79(4), 585-604.
Epelbaum, F.M.B., & Martinez, M.G. (2014). The technological evolution of food traceability systems and their
impact on firm sustainable performance: A RBV approach. International Journal of Production
Economics, 150, 215-224.
Esposito Vinzi, V., Amato, S., & Trinchera, L. (2008). PLS path modeling: Recent developments and open
issues for model assessment and improvement. Handbook of Partial Least Squares-Concepts, Methods
and Applications’, Springer, Berlin, Heidelberg, New York.
Garson, G.D. (2016). Partial least squares. Regression and structural equation models.
George, R.V., Harsh, H.O., Ray, P., & Babu, A.K. (2019). Food quality traceability prototype for restaurants
using blockchain and food quality data index. Journal of Cleaner Production, 240, 118021.
Hair Jr, J.F., Hult, G.T.M., Ringle, C.M., & Sarstedt, M. (2021). A primer on partial least squares structural
equation modeling (PLS-SEM). Sage publications.
Hair Jr, J.F., Sarstedt, M., Hopkins, L., & Kuppelwieser, V.G. (2014). Partial least squares structural equation
modeling (PLS-SEM): An emerging tool in business research. European Business Review, 26(2), 106-
121 Hair, J.F., Ringle, C.M., Gudergan, S.P., Fischer, A., Nitzl, C., & Menictas, C. (2019). Partial least squares
structural equation modeling-based discrete choice modeling: An illustration in modeling retailer
choice. Business Research, 12(1), 115-142.
Hair, J.F., Sarstedt, M., Ringle, C.M., & Mena, J.A. (2012). An assessment of the use of partial least squares
structural equation modeling in marketing research. Journal of the Academy of Marketing
Science, 40(3), 414-433.
Henseler, J., & Sarstedt, M. (2013). Goodness-of-fit indices for partial least squares path
modeling. Computational Statistics, 28(2), 565-580.
Henseler, J., Dijkstra, T.K., Sarstedt, M., Ringle, C.M., Diamantopoulos, A., Straub, D.W., Ketchen Jr, D.J.,
Hair, J.F., Hult, G.T., & Calantone, R.J. (2014). Common beliefs and reality about PLS: Comments on
Rönkkö and Evermann (2013). Organizational Research Methods, 17(2), 182-209.
Henseler, J., Ringle, C.M., & Sarstedt, M. (2015). A new criterion for assessing discriminant validity in
variance-based structural equation modeling. Journal of the Academy of Marketing Science, 43(1), 115-
135.
Liu, Z., & Li, Z. (2020). A blockchain-based framework of cross-border e-commerce supply
chain. International Journal of Information Management, 52, 102059.
Magnier, L., Schoormans, J., & Mugge, R. (2016). Judging a product by its cover: Packaging sustainability and
perceptions of quality in food products. Food Quality and Preference, 53, 132-142.
Manning, L., & Soon, J.M. (2013). GAP framework for fresh produce supply. British Food Journal.
Mansur, A.R., Oh, J., Lee, H.S., & Oh, S.Y. (2022). Determination of ethanol in foods and beverages by
magnetic stirring-assisted aqueous extraction coupled with GC-FID: A validated method for halal
verification. Food Chemistry, 366, 130526.
Manzini, R., & Accorsi, R. (2013). The new conceptual framework for food supply chain assessment. Journal of
Food Engineering, 115(2), 251-263.
Martuscelli, M., Serio, A., Capezio, O., & Mastrocola, D. (2020). Safety, quality and analytical authentication of
ḥalāl meat products, with particular emphasis on Salami: A review. Foods, 9(8), 1111.
Mazzoni, P., Hristova, A., & Krakauer, J.W. (2007). Why don't we move faster? Parkinson's disease, movement
vigor, and implicit motivation. Journal of Neuroscience, 27(27), 7105-7116.
McDonald, M., & Wilson, H. (2016). Marketing plans: How to prepare them, how to profit from them. John
Wiley & Sons.
Mohammed, A., Wang, Q., & Li, X. (2017). A cost-effective decision-making algorithm for an RFID-enabled
HMSC network design: A multi-objective approach. Industrial Management & Data Systems, 117(9),
1782-1799.
Mohayidin, M.G., & Kamarulzaman, N.H. (2014). Consumers' preferences toward attributes of manufactured
halal food products. Journal of International Food & Agribusiness Marketing, 26(2), 125-139.
Omar, E.N., & Jaafar, H.S. (2011). Halal transportation in the food industry-A conceptual model. In IEEE
Symposium on Business, Engineering and Industrial Applications (ISBEIA) (pp. 384-389). Langkawi.
Poniman, D., Purchase, S., & Sneddon, J. (2015). Traceability systems in the Western Australia halal food
supply chain. Asia Pacific Journal of Marketing and Logistics, 27(2), 324-348
Sayogo, D.S. (2018). Online traceability for halal product information: Perceptions of Muslim consumers in
Indonesia. Journal of Islamic Marketing, 9(1), 99-116.
Soba, M., & Aydin, M. (2013). Product placement efficiency in marketing communication
strategy. International Journal of Business and Management, 8(12), 111-116.

Academy of Strategic Management Journal Volume 21, Issue 3, 2022
23 1939-6104-21-3-199
Citation Information: Bachtiar, W.F., Masruroh, N.A., & Asih, A.M.S. (2022). Acceptance and preference of consumer’s on
halal food sustainable traceability. Academy of Strategic Management Journal, 21(3), 1-23.
Soesilowati, E.S., & Yuliana, C.I. (2013). Comparison of consumer behavior of halal products in Muslim
majority and minority areas. Journal of Economics and Development, 21(2), 167-178.
Sresnewsky, K.B.G.B., Veloso, A.R., Ikeda, A.A., & Rocha, R.R. (2020). The use of Photo-elicitation in
marketing research. Revista Brasileira de Marketing, 17(6), 839-848.
Tan, A., Gligor, D., & Ngah, A. (2020). Applying blockchain for halal food traceability. International Journal
of Logistics Research and Applications, 1-18.
Tenenhaus, M., Amato, S., & Esposito Vinzi, V. (2004). A global goodness-of-fit index for PLS structural
equation modelling. In Proceedings of the XLII SIS scientific meeting (Vol. 1, No. 2, pp. 739-742).
Tieman, M., Van der Vorst, J.G., & Ghazali, M.C. (2012). Principles in halal supply chain management. Journal
of Islamic Marketing, 3(3), 217-243.
Ueasangkomsate, P., & Santiteerakul, S. (2016). A study of consumers’ attitudes and intention to buy organic
foods for sustainability. Procedia Environmental Sciences, 34, 423-430.
Wong, S.L., & Wong, S.L. (2019). Relationship between interest and mathematics performance in a technology-
enhanced learning context in Malaysia. Research and Practice in Technology Enhanced
Learning, 14(1), 1-13.
Workman, R.E., Tang, A.D., Tang, P.S., Jain, M., Tyson, J.R., Razaghi, R., Zuzarte, P.C., Gilpatrick, T., Payne,
A., Quick, J., & Timp, W. (2019). Nanopore native RNA sequencing of a human poly (A)
transcriptome. Nature Methods, 16(12), 1297-1305.
Zailani, S., Kanapathy, K., Iranmanesh, M., & Tieman, M. (2015). Drivers of halal orientation strategy among
halal food firms. British Food Journal, 117(8), 2143-2160.
Received: 21-Jan-2022, Manuscript No. ASMJ-22-11341; Editor assigned: 24-Jan-2022, PreQC No. ASMJ-22-11341(PQ); Reviewed:
01-Feb-2022, QC No. ASMJ-22-11341; Revised: 07-Feb-2022, Manuscript No. ASMJ-22-11341(R); Published: 14-Feb-2022