
31295015067332.pdf - TTU DSpace Home
167
-(^ AN EVALUATION OF THE FEASIBILITY OF UTILIZING STATISTICAL TECHNIQUES TO IMPLEMENT THE MARKET GRID METHOD OF MARKET SEGMENTATION by WENDELL C. HEWETT, B.B.A., M.B.A. A DISSERTATION IN BUSINESS ADMINISTRATION Submitted to the Graduate Faculty of Texas Technological College in Partial Fulfillment of the Requirements for the Degree of DOCTOR OF BUSINESS ADMINISTRATION Approved August, 1969
-
Upload
khangminh22 -
Category
Documents
-
view
2 -
download
0
Transcript of 31295015067332.pdf - TTU DSpace Home

-(^
AN EVALUATION OF THE FEASIBILITY OF UTILIZING STATISTICAL
TECHNIQUES TO IMPLEMENT THE MARKET GRID
METHOD OF MARKET SEGMENTATION
by
WENDELL C. HEWETT, B.B.A., M.B.A.
A DISSERTATION
IN
BUSINESS ADMINISTRATION
Submitted to the Graduate Faculty of Texas Technological College in Partial Fulfillment of the Requirements for
the Degree of
DOCTOR OF BUSINESS ADMINISTRATION
Approved
August, 1969

ACKNOWLEDGlffiNTS
I am deeply indebted to Professor John A. Ryan for his
direction of this dissertation and to the other members of my
committee. Professor Robert D. Amason and Professor Howard L.
Balsley, for their helpful criticism.
11
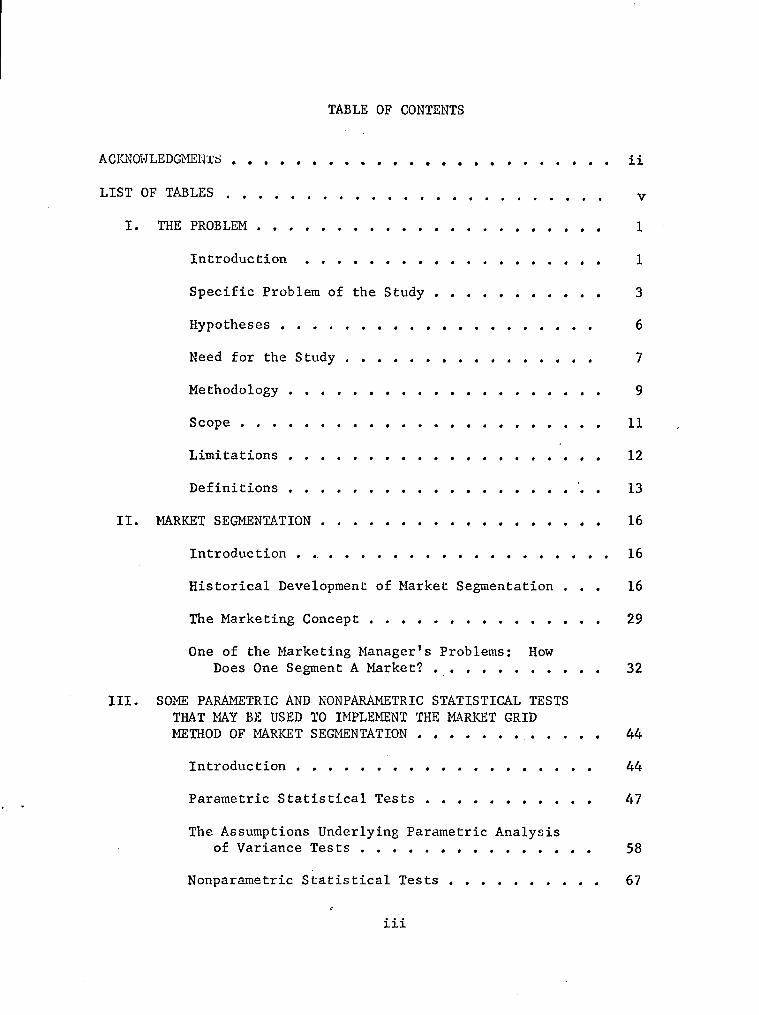
TABLE OF CONTENTS
ACICNOWLEDGMENl'S ii
LIST OF TABLES v
I. THE PROBLEM 1
Introduction 1
Specific Problem of the Study 3
Hypotheses 6
Need for the Study 7
Methodology 9
Scope 11
Limitations 12
Definitions '. . 13
II. MARKET SEGMENTATION 16
Introduction . 16
Historical Development of Market Segmentation . . . 16
The Marketing Concept 29
One of the Marketing Manager's Problems: How
Does One Segment A Market? 32
III. SOME PARAMETRIC AND NONPARAMETRIC STATISTICAL TESTS THAT MAY BE USED TO IMPLEMENT THE MARKET GRID METHOD OF MARKET SEGMENTATION 44
Introduction 44
Parametric Statistical Tests 47
The Assumptions Underlying Parametric Analysis
of Variance Tests 58
Nonparametric Statistical Tests 67
iii

IV
IV. EVALUATING THE FEASIBILITY OF UTILIZING STATISTICAL TESTS TO IMPLEMENT THE MARICET GRID METHOD OF MARKET SEGl-IENTATION 81
Introduction 81
Basic Assumptions Underlying Parametric and Nonparametric Statistical Tests 90
Statistical Tests Used in Conjunction With
Data in Market Grid Matrices 98
The Fisher Exact Probability Test 117
V. SUMMARY, CONCLUSIONS, AND RECOMMENDATIONS 121
Summary '. 121
Conclusions 125
Recommendations 126
BIBLIOGRAPHY 128
APPENDIX A. Definitions and Description of Sampling Procedures
for the 1960 Census of Housing and Population 136
B. Market Grid Matrices 139
C. Mann-Whitney U Tests 160

LIST OF TABLES
Table
1. Types of Washing Machines in State of Texas Households, Cross-Classified by Number of Persons in Household, 1960 (00's of Units) 46
2. Types of Washing Machines in State of Texas Households, 1960, Cross-Classified by Education of Head (00's of Units) 51
3. Total Variation or Total Sum of Squares Calculation for Values in Table 2 53
4. Summary Table for Parametric Analysis of
Variance Test 55
5. Degrees of Freedom for One-Way Analysis of Variance . . 56
6. Types of Washing Machines in State of Texas Households, 1960, Cross-Classified by Education
of Head (00's of Units) 75
7. Ranking of k Groups from Table 6 76
8. An Example of a Market Grid Matrix: Types of
Washing Machines in State of Texas, 1960, Cross-Classified by Number of Persons in Household (00's of Units) 89
9. Kruskal-Wallis Test, Types of Washing Machines in State of Texas Households, 1960, Cross-Classified by Number of Persons in Household (00's of Units) 99
10. Rankings of Data for the Kruskal-Wallis Test,
Data from Table 9 . . 101
11. Squared Values of Table 9 104
12. Summary Table for Parametric Analysis of Variance Test for Data in Table 9 106

vi
Table
13. Test Matrix of the Row Means of Table 9 107
14. Ranks of Data in Table 13 for the Kruskal-Wallis
One-Way Analysis of Variance Test 108
15. Mann-Whitney U Test on kj , k of Table 13 Ill
16. Probabilities of the Mann-Whitney U Tests on Columns of Table 13 112
17. Summary Table for Parametric Analysis of Variance Test for Data in Table 13 115
18. A Comparison Bet\-7een Results of the Nonparametric
Kruskal-Wallis Tests and the Parametric F-Tests 118
19. General Model for the Fisher Exact Probability Test . . . . 119
20. Arrangements and Probabilities of Outcomes When Marginal Totals Are Fixed 119
21. Types of Washing Machines in State of Texas Households, 1960, Cross-Classified by Total Income of Household (00's of Units) 141
22. Types of Washing Machines in State of Texas Households, 1960, Cross-Classified by Age of Head of Household (00's of Units) 145
23. Types of Washing Machines in State of Texas Households, 1960, Cross-Classified by Race of Head (00's of Units) 149
24. Types of Washing Machines in State of Texas Households, 1960, Cross-Classified by Occupation of Head (00's of Units) 153

CHAPTER I
THE PROBLEM
Introduction
The field of marketing has been recognized as a separate area
of study by marketing scholars for some time. Bartels notes that
marketing V7as recognized as a separate field of study as early as
1900. Since that time, there have been periods of dynamic change
and innovation in the area. One of the important eras for change -was
1950 to i960. During this period, the marketing concept V7as formalized
and adopted as a philosophy of doing business by many business firms
-and the managerial approach to marketing became prominent. Many firms
changed their organizational structures to implement the concept. In
many cases, this created top level executive positions for marketing
managers or marketing vice-presidents. The marketing executives are
responsible for long and short term planning in the marketing area.
If a firm adopts the marketing concept, the marketing manager,
or marketing vice-president, is responsible for several managerial
tasks in the business organization. The following quotation outlines
some of the responsibilities of the marketing manager.
Robert Bartels, The Development of Marketing Thought (Homewood Illinois: Richard D, Irwin, Inc., 1962), p. 41.

He is aligned with the top men in production and finance, and sometimes personnel to work with the president as the company's top planning and policy making group.^
To some extent, the quotation illustrates the prominence of the plan
ning task to the marketing manager. Although he is responsible for
the other key management taisks, such as execution and control of the
marketing program, planning is the most important charge of the mar-
3 keting manager.
Planning, based on research and designed to serve clearly defined customer requirements and to achieve corporate objectives, is basic to the marketing concept. The managerial approach to marketing rests on the hard core of effective and scientific marketing planning; an integrated marketing strategy rests on a management philosophy that is based on planning.^
The previous quotation reveals an important relationship be
tween planning and the development of marketing strategy. Marketing
strategy is an important problem area for the practicing marketing man
ager. This investigation focuses upon one approach to one of the es
sential steps of marketing strategy.
^William J. Stanton, Fundamentals of Marketing (2d ed.; New York, St. Louis, San Francisco, Toronto, London, Sydney: McGraw-Hill Book Co., 1967), p. 14.
E. Jerome McCarthy, Basic Marketing, A Managerial Approach (3d ed.; Homewood, Illinois: Richard D. Irwin, Inc., 1968), p. 18.
^Eugene J. Kelley, Marketing: Strategy and Functions (Engle-wood Cliffs, New Jersey: Prentice-Hall, Inc., 1965), p. 20.

Specific Problem of the Study
There are two basic steps involved in developing marketing strat
egy. These steps are defined in the following quotation by McCarthy.
1. Selection of the target market--the selection of particular groups of customers to -whom the company wishes to appeal.
2. Development of a "marketing mix"--the choice of the elements which the company intends to combine in order to satisfy this target group.-*
The emphasis of this investigation is on the first step; the selection
of target markets. It is essential that a marketing manager be able
to identify target markets before developing a marketing mix or changing
an existing marketing mix. Different target markets may require dif
ferent marketing mixes.
When attempting to identify target markets, it is important
to realize that a large market actually may be an aggregate of smaller
homogeneous markets. These small homogeneous markets may be defined
as market segments.
A market segment consists of that group of people who have a preference for a certain item or brand or for certain characteristics in a product that is different from the preference of others. Thought of in this way, the people in a given geographical area comprise not a single market but hundreds or even thousands of segmented markets, one for each of the differentiated products.
McCarthy, op. cit. , p. 21.
McCarthy, op. cit., p. 22.
Edmund D, McGarry, "The Merchandising Function," Theory in Marketing, ed. Reavis Cox, Wroe Alderson, and Stanley J. Shapiro (2d Series; Homewood, Illinois: Richard D, In-7in, Inc, , 1964), p. 236.
4
There are numerous problems associated with market segmentation.
One of the primary problems pertains to target market identification;
how does one locate or identify consumer characteristics which effec-
o
tively predict purchasing behavior? Several mathematical techniques
have been developed to isolate consumer characteristics. A recent pub
lication illustrates multiple discriminant analysis and cluster anal-9
ysis. Many of these techniques require primary data or expensive
secondary data which can be purchased from research organizations. Hov7-
ever, it may be practicable to utilize a relatively inexpensive tech
nique to identify or isolate significant customer characteristics that
could be used to segment markets; the technique is labeled market grid
analysis. The primary objective of this investigation is to determine
if statistical tests can be employed to isolate pertinent classifica
tion variables (customer characteristics) in market grid matrices.
The market grid provides an analytical procedure which enables
the investigator to subdivide a large heterogeneous market into
smaller homogeneous market segments. The basic concept of the market
grid is outlined in the following quotation by McCarthy.
The market grid concept sees any market as a box that is cross hatched, like a checker board or grid, on the basis of relevant market characteristics.
The dimensions used to split up the market grid should be the characteristics and needs of potential customers for
Johan Arndt (ed.), Insights Into Consumer Behavior (Boston, Massachusetts: Allyn and Bacon, Inc., 1968), p. 68.
^Ibid., pp. 71-146.

the type of product or service being considered--not the characteristics of present or possible products.1^
The basic concept of the market grid, as described by McCarthy,
is used in this investigation. However, there is one important dif
ference between McCarthy's grid and the grids used in this investiga
tion. The dimensions of the market grids, in this investigation, are
split into ownership of different types of goods (washing machines)
and demographic classifications of the ov7ners. The aforementioned di
mensions represent an example of consumer durable goods data in market
grid matrices. Washing machines were selected for the example because:
(1) they are consumer durable goods, and (2) availability of secondary
data.
When one employs this concept of market grid analysis, it is
possible to segment the market after purchases are made. Segmentation
is achieved if significant consumer classification variables can be
isolated or identified. This concept of market segmentation is illus
trated in the following quotation.
. . . if the consumers of certain products or customers of certain businesses were to be analyzed and categorized after the fact, segmentation is expected to be more realistic. The users or consumers of certain products do have common characteristics; to the extent that these characteristics can be detected and measured segmentation is achieved.11
^^McCarthy, op. cit., pp. 23-26.
A. Coskun Samli, "Segmentation and Carving A Niche in the Market Place," Journal of Retailing, XLIV, No. 2 (Summer, 1968), p. 37.

6
At the present time, it is possible to construct market grid
matrices from several sources of data. Government publications, busi
ness periodicals, internal company records, and external primary re
search projects are excellent sources of data for market grid matrices.
In many cases, data from the aforementioned sources are collected when
using random probability sampling techniques. When this is the case,
statistical tests may possibly be used to locate or identify signifi
cant classification variables in the columns of market grid matrices.
The specific question of this investigation is: is it feasible
to utilize statistical techniques to implement the market grid method
of market segmentation? Implementation of the market grid method of
market segmentation will be achieved if statistical techniques can be
used to identify significant classification variables in market grid
matrices. In this investigation, the classification variables (demo
graphic characteristics) are located in the columns of the market grid
matrices. For example, if one of the demographic characteristics differs
significantly from the grand mean of the matrix then it is statisti
cally significant; the deviation could be above or below the grand mean.
In other words, the marketing manager could identify the demographic
characteristic(s) that is/are related to high or low purchase rates of
specific types of consumer durable goods.
Hypotheses
Two hypotheses will be tested in this investigation. One hypo
thesis pertains to locating statistically significant classification
variables in market grid matrices when employing statistical tests. The
7
other hypothesis pertains to the ability of the nonparametric Kruskal-
Wallis test and the parametric F-test to obtain the same results when
making tests of significance on the data in market grid matrices of
this investigation.
The first hypothesis of the study is: it is feasible to uti
lize statistical techniques to implement the market grid method of
market segmentation. This hypothesis will be accepted if statistical
techniques can be used to identify significant classification variables
in market grid matrices.
The second hypothesis is: the Kruskal-Wallis one-way analysis
of variance test and the parametric F-test give the same results when
used to make tests of significance on data in the market grid matrices.
The hypothesis will be accepted if there is not a significant differ
ence in the proportions of null hypotheses accepted when using the
Kruskal-Wallis test (on the data in the market grid matrices) and the
parametric F-test. This second hypothesis will be tested by utilizing
the Fisher exact probability test; the Fisher test will be a two-tailed
test set at the .05 level of significance.
Need for the Study
A practicing marketing manager is faced with the problem of
developing marketing strategy that will coincide with overall plans and
objectives of the business firm. Since the development of marketing
strategy is so important^ the marketing manager has a need for scien
tific techniques that will help him develop better marketing strategy.
It is possible that the statistical tests outlined in this investigation

8
.represent .improvements over any JLntuitive.non-systematic processes that
are used to identify target markets.
The marketing manager has two primary uses for segmentation
analysis: (1) to improve the marketing program for an existing pro
duct, or (2) to develop a new product.•'• The statistical tests in this
study should help the marketing manager improve the marketing program
for existing products. The techniques will not be too helpful for de
veloping new products.
In the field of marketing, there is some debate about which
classification variables should be used to segment markets. Some
authors recommend traditional demographic variables while others rec
ommend social variables, or psychological variables. The problem is
to determine which variables in a specific category are significant.
If it is feasible to utilize statistical tests in this investigation,
a marketing manager could use the tests to isolate significant classi
fication variables. The statistical tests could be used to comb through
data in market grid matrices until significant classification variables
were isolated. Once significant variables V7ere identified, the mar
keting manager could use the variables to segment markets and adjust
marketing mixes for existing products.
12 Norman L. Barnett, "Beyond Market Segmentation," Harvard Busi«»
ness Review (January-February, 1969), p. 153.
Methodology
The basic design for this study is of a descriptive nature.
The most important source of data for this investigation is the Census
of Housing and Population. The investigator selected these data be
cause they had been cross-tabulated by demographic classification and
type of consumer durable good. Six different demographic classification
variables were utilized: (1) number of persons in household, (2) total
income of household, (3) age of head of household, (4) education of
head of household, (5) race of head of household, and (6) occupation of
head of household. These classifications have been selected for the
investigation because they represent the traditional demographic classi
fication used by the Census Bureau. The data are in the form of market
grid matrices and represent the type of matrices a practicing market
ing manager could construct. The matrices have been constructed from
random probability sampling data.
Six market grid matrices have been constructed from cross-
tabulations of the Census data. The data in the market grid matrices
will be used in twelve different tests of significance. The tests will
be made to evaluate the feasibility of using statistical tests to iso
late significant classification variables in market grid matrices. Six
tests will be made employing the nonparametric Kruskal-Wallis one-way
analysis of variance test. Six additional tests will be made with the
same market grid matrices employing the parametric F-test.
The basic methodology of this study can be sub-divided into
three interrelated steps. First, assumptions are evaluated for the
nonparametric Kruskal-Wallis test. The possibility of utilizing the

10
test to implement the market grid method of market segmentation depends
upon the compatability of the data in the market grid matrices with the
assumptions underlying the test. If it is feasible to employ the test,
it can be used to determine if a significant classification variable
exists in a market grid matrix. Once it is determined that a signifi
cant classification variable is in a matrix, the nonparametric Mann-
Whitney U test may possibly be employed to isolate specific significant
classification variables in the matrix. The Kruskal-Wallis test is
analyzed before the parametric F-test because assumptions underlying
the nonparametric test are not as rigorous as assumptions underlying
the parametric F-test. Secondly, the parametric F-test is used to make
tests of significance with Census data in the market grid matrices.
The assumptions underlying the parametric test are not evaluated; the
primary concern is with the robustness of the test. In other words,
the test may possibly be used although all of the underlying assump
tions are not compatible with data in the market grid matrices. The
Moroney technique is employed to isolate specific significant classifi
cation variables if the parametric F-test indicates a significant re
sult in the matrix. Thirdly, the results obtained when employing the
Kruskal-Wallis test and the parametric F-test are compared by using
the Fisher exact probability test. The Fisher test enables one to as
certain the robustness of the parametric F-test when used with data in
the market grid matrices.
The organization for the remaining portion of the study is as
follows: (1) Chapter Two presents some background information about
the nature of market segmentation and the importance of segmentation

11
to the marketing manager; (2) Chapter Three presents assumptions under
lying parametric and nonparametric statistical tests that could pos
sibly be used to implement the market grid method of market segmenta
tion; (3) Chapter Four illustrates nonparametric and parametric tests
used in conjunction with 1960 Census data in market grid matrices; (4)
Chapter Five focuses on the summary and conclusions of this investiga
tion.
Scope
Market segmentation for consumer durable goods represents the
primary area of segmentation analysis in this investigation. Segmenta
tion analysis for industrial products is outside the scope of this
study. Market segmentation is analyzed from information that per
tains exclusively to the United States. The segmentation techniques
that are evaluated in this investigation are applicable only for ex
isting or established products.
Employing specific demographic classification variables in mar
ket grid matrices of this study does not imply that the variables are
the best classification variables to use in all cases. They are used
to facilitate the evaluation of utilizing statistical techniques to
implement the market grid method of market segmentation. Statistical
tests in the study could possibly be used with various other types of
classification variables for data in market grid matrices.
The statistical tests used in this investigation are of a non
parametric and parametric nature. Three tests are nonparametric; the
tests are the Kruskal-Wallis test, the Mann-Whitney U test and the

12
Fisher exact probability test. The parametric tests are the F-test
and the Moroney test. The tests are used in conjunction with data in
market grid matrices; data in the matrices were originally gathered in
the 1960 Census of Housing and Population.
Limitations
There are several limitations associated with an investigation
of this type. Some of the more obvious limitations are enumerated in
the following paragraphs.
One limitation is associated with products; the market grid
method of market segmentation employed in this study is applicable only
for existing products. The market grid matrices in this investigation
are not uSed to ascertain the feasibility of introducing new products.
Quantitative data in the market grid matrices of this investi
gation came from the 1960 Census. This is somewhat of a limitation as
far as the time period is concerned; although the quantitative vari
ables are restricted to the time period, the statistical tests are not
restricted to quantitative data from any specific time period.
The sample size (for data in the matrices) is fixed; in other
words, the size of the sample can not be expanded to gather additional
information for the market grid matrices. This is a limitation for the
nonparametric tests. Since the sample sizes can not be increased, the
nonparametric tests are not as powerful as the parametric tests.
The data in the market grid matrices were gathered in the State
of Texas. Initially, this may appear to be a geographic limitation.
However, data from this geographic area are used to evaluate the

13
-feasibility of using statistical techniques to implement the market
grid method of market segmentation. Data from any geographic area
could have been used in this investigation.
Definitions
Some terms are used quite frequently in this study. The follow
ing definitions and explanations should facilitate reading this study.
Some of the definitions will be discussed in more detail later in this
investigation.
Classification
Systematic arrangement in groups or categories according to established criteria. -
Consumer Goods
Goods destined for use by ultimate consumers or households and in such form that they can be used without commercial
14 processing.-^^
Demographic Characteristics
One reason markets are susceptible to segmentation resides in diverse demographic characteristics. Differences in age, sex,' geography, and money available to spend are examples of demographic segmentation. Occupational differences, education, and ethnic group also help to explain market segments. 1^
13 Webster's Seventh New Collegiate Dictionary (Springfield,
Massachusetts: G. & C. Merriam Co., 1965), p. 153.
Kelley, op. cit., p. 112.
Robert J. Holloway and Robert S. Hancock, Marketing In A Changing Environment (New York, London, Sydney: John Wiley & Sons, Inc., 1968), p. 24.

14
Market
A market usually is identified with a generic class of products. One hears of the beer market, the cake mix market, or the cigarette market. These are product markets, referring to individuals who in the past have purchased a given class of products. °
Market Segmentation
Market segmentation as a strategy may be defined as the tailoring of the marketing mix components to the needs and wants of the selected subgroups within the overall market. Stated differently, the market segmentation approach assumes that consumers are different and that these differences may be utilized.
. . . if the consumers of certain products or customers of certain businesses were to be analyzed and categorized after the fact, segmentation is expected to be more realistic. The users or consumers of certain products do have common characteristics; to the extent that these characteristics can be detected and measured segmentation is achieved,1"
Marketing Concept
In its fullest sense, the marketing concept is a philosophy of business which states that the customer's want satisfaction is the economic and social justification of a company's existence. Consequently, all company activities in production, engineering, and finance, as V7ell as in marketing
^^Jack Z. Sissors, "What Is A Market?," Journal of Marketing, XXX (July, 1966), p. 17.
Both of these contributions are significant to this investigation; the first quotation defines market segmentation while the second quotation illustrates a technique that can be employed to segment markets.
18 Johan Arndt, "New Directions in Market Segmentation," Insights
Into Consumer Behavior, ed. Johan Arndt (Boston, Massachusetts: Allyn & Bacon, Inc., 1968), p. 67.
19 Samli, op. cit., p. 37.
15
must be devoted to, first, determining what the customers wants are and, then satisfying these wants while still making a reasonable profit.^
Nonparametric Statistical Tests
A nonparametric statistical test is a test whose model does not specify conditions about the parameters of the population from which the sample was dra\«i, l
Parametric Statistical Tests
A parametric statistical test is a test whose model specifies certain conditions about the parameters of the population from which the research sample was drawn.
Robust Statistical Test
This term was introduced by Box (1953) to characterize statistical tests which are only inconsequentially affected by a violation of the underlying assumptions.
Market segmentation is a marketing management strategy that has
developed very rapidly since the 1950's. The following chapter pre
sents some of the historical developments of market segmentation as
well as some problems associated with actually segmenting markets.
20 Stanton, op. cit., p. 11.
21 Sidney Siegel, Nonparametric Statistics for the Behavioral
Sciences (New York, Toronto, London: McGraw-Hill Book Co., Inc., 1956), p. 31.
^^Ibid., p. 30.
• C. Alan Boneau, "The Effects of Violations of Assumptions Underlying the t Test," Psychological Bulletin, LVII, No. 1 (January, 1960), pp. 61-62.

CHAPTER II
MARKET SEGMENTATION
Introduction
Market segmentation has a dynamic background that should be
analyzed before one can acquire an adequate feel for the subject. A
very important part of this background involves the marketing concept.
The marketing concept is significant to this investigation because it
is interrelated with an increasing emphasis on market segmentation in
business organizations. The historical development of market segmen
tation and the marketing concept are briefly examined in this chapter.
The remaining portion of the chapter illustrates the problems of actu
ally segmenting markets and the benefits of segmentation analysis to
the marketing manager.
Historical Development of Market Segmentation
The primary emphasis on market segmentation, as a marketing
strategy for business firms, has developed since 1950. This emphasis
was the result of several dynamic occurrences in the American political,
social, and economic spheres. Some of the significant events preceding
the decade of the 1950's are discussed in the following paragraphs.
Early in the century there was an emphasis on production in
business firms. The following quotation by Robert J. Keith illustrates
an early production emphasis at the Pillsbury Company. Pillsbury's
16

17
situation is significant because it epitomizes the production emphasis
that was prevalent in many business organizations in the United States
in the early part of the century.
First came the era of manufacturing. It began with the formation of the company in 1869 and continued into the 1930's. It is significant that the idea for the formation of our company came from availability of high quality wheat and the proximity of water power--and not from the availability and proximity of growing major marketing areas or the demand for better, less expensive, more convenient flour products.
The early part of the century has been described by one author
as the open market era. The explanation of the era illustrates why
production was emphasized more than marketing in general and market
segmentation in particular.
Until the 1930's mass producers were operating within economic and geographical constraints that dictated the use of "natural" segments as a means of allocating effort. It made sense to sell to those people who had enough money to pay cash for the product and who were close enough to the plant to be reached and serviced economically.-^
During this time period, 1900 to 1930, many manufacturers did not mar
ket to national markets. They were catering primarily to local mar
kets. Many manufacturers thought of markets as being homogeneous in
nature.
An example of a prominent manufacturer that thought of his mar
ket as a homogeneous market was Henry Ford. One of his competitors.
Robert J. Keith, "The Marketing Revolution," Journal of Marketing. XXIV, No. 3 (January, 1960), p. 36.
2 Steven C. Brandt, "Dissecting the Segmentation Syndrome,"
Journal of Marketing, XXX (October, 1966), p. 22.
^Ibid,

18
General Motors, thought of the market in somewhat different terms.
Ford's philosophy is described in the following quotation.
In the 1920's, Henry Ford, following a very successful strategy introduced many years earlier, was still offering a "mass market" automobile in "any color you want as long as it's black." Ford had developed this strategy when he first decided to build his car for the masses.
Mr. Sloan and General Motors sensed that a new strategy was in order. They made a basic decision to add new colors and styling, even if this required raising prices. They also decided to see the market as several segments (based on price and model types), and then to offer a full line of cars with entries at the top of each of these price ranges. They planned to satisfy quality conscious consumers, always offering good values.
As is well knov7n. General Motors persisted with this plan through the 1920's and slowly caught up with the unyielding Ford. Finally, in May, 1927, Ford closed down his assembly line and had to switch his strategy to meet the new competition. He stopped making the long successful Model T and introduced the Model A. But General Motors was already on its way to the commanding market position it now holds.
Even though the emphasis was on production in the early 1900's,
some marketing scholars saw markets as conglomerates of small homo
geneous markets instead of large homogeneous markets. One of the
pioneers was Arch W. Shaw; as early as 1912, he wrote about the impor
tance of market contours or market segments.
If a sound system of distribution is to be established, the business man must treat each distinct geographic section as a separate problem. The whole market breaks up into differing regions.
Equally important is a realization of what may be termed the market contour. The market, for the purposes
E. Jerome McCarthy, Basic Marketing, A Managerial Approach (3d ed.; Homewood, Illinois: Richard D. Irwin, Inc., 1965), p. 20.

19
of distribution, is not a level plain. It is composed of differing economic and social strata. Too seldom does the business man appreciate the market contour in reference to his product.
Shaw's observations indicate that some scholars were beginning
to doubt the existence of homogeneous markets espoused by pure compe
tition economic theory. The conceptualizations of market structures
that were in vogue in the early part of this century were pure compe
tition and monopoly. Economists had classified industries or clusters
of firms into different categories depending on the nature of com
petitive conditions.
' Many scholars and businessmen felt that the economic models of
pure competition and pure monopoly did not adequately describe the ex
isting business structure. This situation was alleviated somewhat when
two economists (working independently) developed the theory of mono
polistic competition. The characteristics of monopolistic competi
tion are illustrated in the quoation by William J. B.aumol.
Monopolistic competition with product differentiation: This is a market arrangement very similar to pure competition except for feature 1 (b)--product standardization. Under product differentiation each firm produces goods which are different from competitive products. The "product differences" may in fact not involve characteristics of the products themselves. More attractive wrapping, more convenient location, or special sales features such
^Arch W. Shaw, "The Role of Marketing in Society," The Environment of Marketing Behavior, ed. Robert J. Holloway and Robert S. Hancock (New York, London, Sydney: John Wiley & Sons, Inc., 1964), p. 9.
T7illiam J. Baumol, Economic Theory and Operations Analysis (2d ed.; Englewood Cliffs, New Jersey: Prentice-Hall, Inc., 1965), p. 311.

20
as better service or free gift coupons may be the basis for customer preferences and loyalties.''
The work of Robinson and Chamberlin emphasized that markets
were not homogeneous on the supply or demand side. The following quo
tation by Smith denotes the impact of monopolistic competition.
During the decade of the 1930's the work of Robinson and Chamberlin resulted in a revitalization of economic theory. While classical and neoclassical theory provided a useful framework for economic analysis, the theories of perfect competition and pure monopoly had become inadequate as explanations of the contemporary business scene. The theory of perfect competition assumes homogeneity among the components of both the demand and supply sides of the market, but diversity or heterogeneity had come to be the rule rather than the exception."
Later, in 1957, Wroe Alderson built his functionalist theory
of marketing on the cornerstone of heterogeneous markets. The concept
of large homogeneous markets was passing into history.
The application of ecology to marketing organizations provides a new starting point for the study of competition. It begins with the assumption of heterogeneity in the market as the nonaal or preliminary condition, rather than on an assumption of homogeneity as the ideal condition.
The substance of the functionalist approach is very similar to what Chamberlin implied by "monopolistic competition" and what J. M. Clark has recently designated as "the economics of differential advantage."
The functionalist or ecological approach to competition begins with the assumption that every firm must seek and find a function in order to maintain itself in the
^Ibid.
Wendell R. Smith, "Product Differentiation and Market Segmentation as Alternative Marketing Strategies," Journal of Marketing, XXI, No. 1 (July, 1956), p. 3.

21
marketplace. Every business firm occupies a position which is in some respect unique. Its location, the product it sells, its operating methods, or the customers it serves tend to set it off in some degree from every other irm.
The significant point in Alderson's quotation is that markets are not
homogeneous on either the supply side or the demand side. In the
1950's, and perhaps earlier, marketing scholars were seeing large mar
kets as heterogeneous in nature.
The contributions by Joan Robinson and Edward Chamberlin repre
sent a significant point in the evolution of market segmentation as a
marketing strategy. Their work did emphasize the reality of hetero
geneity in mass markets. However, manufacturers did not need to take
advantage of their findings for some time. Manufacturers were able
to produce many products for mass markets until after World War II.
Brandt describes the mass market in the following paragraphs.
During the 1930's and 1940's improvements in freight transportation, communication networks, and packaging gradually lessened the constraints on consumer and producer alike.
Manufacturers could reach more and more members of the total population; and that population had more and more dollars to spend. The mass market became a reality. Quite expectedly, the number of products in competition for the consumer's dollar multiplied.
Products could be sold to many diverse elements of the population; and increased volume meant reduced costs. Thus, the search was on for new products. Once found, however, there was a corollary need somehow to differentiate
^roe Alderson, Marketing Behavior and Executive Action (Home-wood, Illinois: Richard D. Irwin, Inc., 1957), p. 101.
Brandt, op. cit., p. 23.

22
..-them.from similar or identical products in the marketplace.
More refined market-segmentation procedures were needed. Decisions based on information about geographical data were inadequate; and so other demographic-type information such as age, family size, and ethnic background was put to use.11
During this phase of economic development in the United States, many
business organizations started to emphasize sales along with pro
duction. Robert J. Keith describes the time period, from 1930 to 1950,
12 as the sales era in the Pillsbury Company.
Pillsbury's thinking in this second era could be summed up like this: "We are a flour-milling company, manufacturing a number of products for the consumer market. We must have a first rate sales organization which can dispose of all the products we can make at a favorable price. We must back up this sales force with consumer advertising and market intelligence. We want our salesmen and our dealers to have all the tools they need for moving the output of our plants to the consumer."
Still not a marketing philosophy, but we were getting closer.1^
It is difficult to determine the exact date that a marketing
philosophy was adopted by many major manufacturers in the American eco
nomy. Some marketing experts feel that a real marketing orientation
started in the decade of the 1950's.^^ Several changes had taken place
in the economy since the end of World War II; the mass market was fast
becoming the fragmented market.
Brandt, op. cit., p. 23.
12 Keith, op. cit,, p. 36.
13 Keith, op. cit., p. 36.
Hector Lazo and Arnold Corbin, Management in Marketing (New York, Toronto, London: McGraw-Hill Book Co., Inc., 1961), p. 8.

23
After World War II, marketing practitioners developed an almost universal belief in a homogeneous mass market to which the key was a standard product made and sold in large volume with consequent low costs. This strategy worked well while consumers were busy building up their war-depleted inventories and enjoying the experience of having money and being able to buy goods. However, this market changed quite suddenly when consumers began to reach a point of satiety. They then became quite demanding about the kinds and varieties of goods they would buy.^
When consumers' needs and wants become more sophisticated, and the popu
lation has greater education, mobility, growth, and more money, then
the mass market for goods and services becomes more fragmented. All
of the aforementioned conditions have existed in the United States
economy since the end of World War II.
As the mass market began to crack into the fragmented market
in the 1950's and early 1960's, business organizations made internal
adjustments. Robert Keith notes the adjustments made at Pillsbury
during this time period.
It was at the start of the present decade that Pillsbury entered the marketing era. The amazing growth of our consumer business as the result of introducing baking mixes provided the immediate impetus. But the groundwork had been laid by key men who developed our sales concepts in the middle forties.
With the new cake mixes, products of our research program, ringing up sales on the cash register, and with the realization that research and production could produce literally hundreds of new and different products, we faced for the first time the necessity for selecting the best new products. We needed a set of criteria for selecting the kind of products we would manufacture. We needed an organization to establish and maintain these criteria, and
^%enneth Schwartz, "Fragmentation of the Mass Market," Modern Marketing Thought, ed. J. Howard Westing and Gerald Albaum (Nev7 York: The MacMillan Co., 1964), p. 14.
Brandt, op. cit., p. 24.
24
for attaining maximum sale of the products we did select. We needed, in fact, to build into our company a new
management function which would direct and control all the other corporate functions from procurement to production to advertising to sales. This function was marketing. Our solution was to establish the present marketing department.!'
The time period for these changes is critical; it appears that the mar
keting concept, an increased emphasis on market segmentation, and
changes in business organizations' structures occurred almost simul
taneously. Apparently the changes were interrelated and based to some
extent on an awareness of the significance of consumer needs and
18 wants.
Market segmentation was widely implemented as a marketing
1 Q
strategy in the 1950's. Implementation of the concept indicated
American business firms were aware of the consumers' needs and wants
and had developed the technology to overcome some of the constraints
of economy of scale. Alderson reveals the basic conflict between eco
nomies of scale and market segmentation in the following paragraphs.
The mass-production industries today have arisen out of economies of scale. It is possible to perform many operations at a much lower cost per unit if the operation is to be performed a thousand or a million times rather than ten or twenty. Economies of scale have been in the forefront of both economic theory and business thinking in recent decades.^
^^Keith, op. cit., p. 37.
18 Smith, op. cit., p. 8.
19 Smith, op. cit., p. 6.
20 Alderson, op. cit., p. 451.

25
As the customer becomes more sophisticated, economics of scale
may become less profitable. As production economies increase, mar
keting economies may decrease. This phenomenon is described by
Alderson.
For most of the products of mass production, substitut-ability is very imperfect indeed. To enlarge its market share, a firm must persuade more and more consumers who lie on the fringe of its market position to buy. They must be convinced that they obtain a better value in buying the standardized product, even though it does not fit their needs or preferences quite so well as some competitive products. It takes large sums of money to carry out a program of mass persuasion. The more that has to be spent for the purpose, the less remains of the margin of price advantage, which may be one of the claims made for the product. Marketing judgments must balance these two considerations and try to find the most favorable combination of an actually greater value and mass persuasion to convince consumers that a greater value is being offered.
Another basic issue in the relations between marketing and production has to do with market segmentation and the degree to which the product will be differentiated to match differences in need and preferences from one segment to another. Assuming that there is a continuous range of variation as to the needs of the consumers, the market for a given type of product might be divided into two, five, ten or even more numerous segments. If only two product variations are offered, then it is obvious that differences in demand cannot be matched as precisely as if ten product variations were offered. Frequently, however, there is an inherent conflict in the requirements of marketing and production. The greater the range of product differentiation to meet consumer requirements, the less the opportunity to achieve economies of scale in production. Even assuming that all ten products can be made on the same machinery, there is a loss in efficiency in reducing the lot size and being obliged to make frequent changeovers in the plant from one product to another.
Although a conflict is present between marketing and production
market segmentation, as a management strategy, appears to be increasing
21 Alderson, op. cit., p. 453.
26
-in acceptance by American industry. The following quotations by
Wendell R. Smith and Alan A. Roberts illustrate why this is the case.
There appear to be many reasons why formal recognition of market segmentation as a strategy is beginning to emerge. One of the most important of these is decrease in the size of the minimum efficient producing or manufacturing unit required in some product areas. American industry has also established the technical base for product diversity by gaining release from some of the rigidities imposed by earlier approaches to mass production. Hence, there is less need today for generalization of markets in response to the necessity for long production runs of identical items.
Present emphasis upon the minimizing of marketing costs through self-service and similar developments tends to impose a requirement for better adjustment of products to consumer demand. The retailing structure, in its efforts to achieve improved efficiency, is providing less and less sales push at point of sale. This increases the premium placed by retailers upon products that are presold by their producers and are readily recognized by consumers as meeting their requirements as measured by satisfactory rates of stock turnover.
It has been suggested that the present level of discretionary buying power is productive of sharper shopping comparisons, particularly for items that rate above the need level. General prosperity also creates increased willingness "to pay a little more" to get "just what I wanted."
Attention to market segmentation has also been enhanced by the recent ascendancy of product competition to a position of great economic importance. An expanded array of goods and services is competing for the consumer's dollar. More specifically, advancing technology is creating competition between new and traditional materials with reference to metals, construction materials, textile products, and in many other areas. While such competition is confusing and difficult to analyze in its early stages, it tends to achieve a kind of balance as various competing materials find their markets of maximum potential as a result of recognition of differences in the requirements of market segments.
Many companies are reaching the stage in their development where attention to market segmentation may be regarded as a condition or cost of growth. Their core markets have already been developed on a generalized basis to the point where additional advertising and selling expenditures are yielding diminishing returns. Attention to smaller or fringe market segments, which may have small

27
potentials individually but are of crucial importance in the aggregate, may be indicated.^^
A perhaps less obvious factor in increasing the acceptance of market segmentation as a corporate strategy has been the advance of technique in market research, which seems to be finding better ways to identify consumers and their buying motivations.^
It should be noted that a segmentation strategy by business
firms could not be successful if it were not in accord with the wishes
and the ability of the public to purchase what is offered. The free
dom of choice in our economic and social system allows consumers to
choose for themselves from the goods and services offered in the
25
marketplace. The American population is extremely diversified. Over
two-hundred million people differ in many ways; income, location, edu
cation, backgrounds, interests, jobs, desires, social aspirations, and
in many other respects. The management strategy of market segmen
tation is based upon catering to the different needs and wants of con
sumers.
22 Smith, op. cit., p. 6.
23 Alan A. Roberts, "Applying the Strategy of Market Segmentation,"
Marketing Management and Administrative Action, ed. Steuart Henderson Britt and Harper W. Boyd, Jr. (New York, St. Louis, San Francisco, Toronto, London, Sydney: McGraw-Hill Book Co., 1968), p. 180.
John B. Matthews, Jr. et. al.. Marketing: An Introductory Analysis (New York, San Francisco, Toronto, London; McGraw-Hill Book Co., 1964), p. 77.
^^Ibid., p. 77.
^^Ibid., p. 78.

28
The emergence of market segmentation as a strr.tegy once again provides evidence of the consumer's prominence in the contemporary American economy and the richness of the rewards that can result from the application of science to marketing problems.^'
The changes that swept through America in the 1950's were di
verse and complex. Many factors contributed to the changes in the
business sphere of our society. The following quotation by J. B.
McKitterick provides a brief explanation of why firms became more cus
tomer oriented in the 1950's.
Where the pre-1940 period was preoccupied with trying to make the same product cheaper, the postwar period saw a dimension added to competition, in which the focus was to try and make the old product better, or even more bold, to try and launch a new product. And as the research-equipped manufacturer looked around for applications for his newfound creative pov7er, he frequently discovered them in markets that he heretofore had not entered. The petroleum refinery began to turn out chemicals; the rubber plant, plastics; new alloys challenged older metals, electronics cast its shadows over hydraulics, and soon, everyone's research and competitive endeavor was attacking someone else's status quo. Established concepts of industry alignment began to obliterate, schemes narrowly conceived to defend market position in terms of price advantage proved inadequate and management began to contend with problems of uncertainty that had multiple dimensions. A labor plentiful economy overnight became a labor short economy, and even though the number of employees and production workers has grown 50 percent since 1940, and their productivity probably another 50 percent, still the demand for their services has grown even faster, and wages have gone up some 70 percent in constant dollars. So here we had a reversal of the condition of the preceding twenty years; worker income rose more rapidly than productivity, competition was focused on using research to obsolete old ways of doing things, a flood of new products poured forth to meet the rising discretionary spending power, and we became so impressed with the results of focusing on what would be better for the customer rather than merely cheaper that we
27 Smith, op. cit., p. 8.

29
invented a now familiar phrase--"the marketing concept"-to describe this triumph of innovation over productive, capacity.
So the principal task of the marketing function in a management concept is not so much to be skillful in making the customer do what suits the interests of the business as to be skillful in conceiving and then making the business do what suits the interest of the customer.
The central meaning of the marketing concept to the decision structure of a business is that the major purpose of the venture is taken from the need to solve some problem in the outer environment--some betterment for the customer--and all subsidiary decisions dealing with the acquisition and allocation of resources within the business are bent to that objective.
The Marketing Concept
The marketing concept is of some consequence to this investi
gation. If business organizations implement the marketing concept, a
top level executive position is created for the marketing manager or
the marketing vice-president. This executive is responsible for imple
menting market segmentation strategy. Since the concept represents
the foundation upon which market segmentation strategy rests, some ad
ditional information about the concept is necessary. The concept is
described by Wroe Alderson in the following quotation.
28 J. B. McKitterick, "What Is the Marketing Management Con
cept?," Marketing Management and Administrative Action, ed, Steuart Henderson Britt and Harper W. Boyd, Jr. (New York, St. Louis, San Francisco, Toronto, London, Sydney: McGraw-Hill Book Co., 1968), pp. 9-13.
30
The marketing concept has been presented in recent years not only as a nev; departure in marketing but something approaching a new philosophy of general management. Only incidentally has the marketing concept meant an increased emphasis on marketing as one of the business functions. Correctly interpreted, the marketing concept has equal significance for finance, production, and research and development. The marketing concept underscores the importance of the market rather than exalting marketing. It says that the business as a whole, and hence each of the business functions must take its marching orders from the market. There is no payoff for the scientist in his laboratory, for the production manager in the most modern plant, or for the wizard of finance except as the company's products find acceptance in the market.
Concern for the marketing concept reflected the change from a sellers' market to a buyers' market after World War II. In a longer perspective it meant the coming of an era of abundance, the end of an age in which all goods were scarce and consumers asked few questions. Once it was sufficient for the well-managed firm to focus attention on the end of the production line as the measure of its achievement. Capital and plant capacity rather than customers were the key problems. Now it becomes increas- >«, ingly apparent that the producer must take responsibility ^ for the smooth and continuous flow of products through the marketing system. ^
0:
In the mid-1950's, as many business firms accepted the market- ..,
ing concept, numerous structural changes were made in business organi- 'j
zations. As a result of the organizational changes, the top market
ing man, i.e., the marketing manager or marketing director, was
finally accepted as a member of the top executive team.
An early consequence of the new awakening was the emergence of the marketing director. For the first time all of the tools for dealing with marketing processes were made responsible to one man. His responsibility generally encompassed advertising, personal selling, sales promotion, and marketing research. In multi-product companies a group
^^roe Alderson and Paul E. Green, Planning and Problem Solving In Marketing (Homewood, Illinois: Richard D. In^in, Inc., 1964), p, 5.
31
of product managers was added under some such title as merchandising. Where a vice-president for sales had been the key figure on the marketing side, he now began to give way to a man of broader perspective who embraced the entire marketing function.^'^
One of the first large companies to create the position of pro
duct manager, or brand manager, was Pillsbury. The following quota
tion from Keith illustrates the importance of the brand manager to
Pillsbury.
The first move was to transfer our small advertising department into a marketing department. The move involved far more than changing the name on organizational charts. It required the introduction of a new, and vitally important, organizational concept--the brand manager concept.
The brand manager idea is the very backbone of market- t-ing at Pillsbury. The man who bears the title, brand man- ^ ager, has total accountability for results. He directs fj the marketing of his product as if it were his own business. Production does its job and finance keeps the r profit figures. Otherwise, the brand manager has total '; responsibility for marketing his product. This responsibility encompasses pricing, commercial research, competitive activity, home service and publicity coordination, legal details, budgets, advertising plans, sales promotion, :| and execution of plans. The brand manager must think j first, last, and always of his sales target, the consumer.
Marketing permeates the entire organization. Marketing plans and executes the sale all the V7ay from the inception of the product idea, through its development and distribution, to the customer purchase. Marketing begins and ends with the customer. New product ideas are conceived after careful study of her wants and needs, her likes and dislikes. Then marketing takes the idea and marshals all the forces of the corporation to translate the idea into product and the product into sales,•'I
Ibid., p. 6.
31 Keith, op. cit., p. 37,
32
The quotation by Keith emphasizes the new responsibility for
the top man in marketing at the Pillsbury Company. The new marketing
position required top executive ranking for the marketing manager.
The marketing manager has many responsibilities in the organi
zation structure necessitated by the implementation of the marketing
concept. He has the responsibilities of any executive in a top level
position; the responsibilities of planning, executing and control-
32 ling. The most important task of the marketing manager is plan-
33 ning. The marketing executive should develop a plan which includes
marketing strategy; without a good plan, there are no guidelines for
execution, control, or evaluation and without proper execution, the
best of plans is worthless,^^
One of the Marketing Manager's Problems; How Does One Segment A Market?
The marketing manager is the executive in the business organi
zation that is primarily responsible for developing marketing strategy.
There are two important steps involved in the development of marketing
strategy: (1) identifying target markets, and (2) designing a marketing
mix that will hit the target markets. - The part of marketing strategy
that is most significant to this investigation is step one, identifying
target markets.
32
McCarthy, op. cit., p. 17.
•^%cCarthy, op. cit., p. 18.
^^cCarthy, op. cit. , p. 17. 35 McCarthy, op. cit., p, 21.
33
There is some difficulty associated with target market identi
fication. How does one go about identifying target markets for goods
and services? In this study, emphasis is placed upon target market
identification for established products. Target market identification
is facilitated by a rigid interpretation of the market. The word mar
ket has many interpretations in the field of marketing. The interpre
tation of market for this investigation follows:
A market usually is identified with a generic class of products. One hears of the beer market, the cake mix market, or the cigarette market. These are product markets, referring to individuals who in the past have purchased a given class of products.-'"
The question of how to define market segments is one of the
37 most important problems in current marketing management.
It is important for the marketing manager to identify vital market segments, for it is to particular segments that he will direct his marketing efforts. Identification of customer types enables the manager to recognize a market segment.-'°
There are two steps that one can take in an attempt to segment
markets. First, one needs to develop a classification system for his
customers; secondly, he needs to make some empirical observations to
• Jack Z. Sissors, "What Is A Market?," Journal of Marketing, XXX (July, 1966), p. 17.
^^Frank M. Bass, Douglas J. Tigert, and Ronald T. Lonsdale, "Market Segmentation: Group Versus Individual Behavior," Journal of Marketing Research, V (August, 1968), p. 264.
^^artin L. Bell, Marketing Concepts and Strategy (Boston, New York, Atlanta, Geneva, Illinois, Dallas, Palo Alto: Houghton Mifflin Co., 1966), p. 130.
34
test the validity of his classification system.^^ The significance of
classification in the scheme of things is described below:
People are heterogeneous, but across time and cultures they share at least one thing in common. There seems to be a universal and perennial desire to order the picture man has of his ever-changing world. Man describes his environment by classifying--by assigning meaning to the objects, ideas and people he encounters. Classifications enable him to observe and thus, to work toward explanation and prediction. All knowledge rests on some form of classification; to classify is to begin to understand.
Numerous classification methods may be tested before a success
ful customer classification scheme is found for a particular product.
According to one author, one of the key factors in market segmentation
analysis is that the marketing manager should never assume that any
41 one method of classification is best. In other words, he should
test several classification schemes. Then, he can select the method
that segments the market best.
The following quotation from Myers and Nicosia illustrates the
importance of classification schemes to marketing.
Marketing management policies, strategies, and tactics depend progressively on identification of useful market segments, particularly in a society becoming more affluent. The identification of market segments, in turn, depends on
^^John G. Myers and Francesco M. Nicosia, "On The Study of Consumer Typologies," Journal of Marketing Research, V (May, 1968), p. 182.
^Olbid.
^^Daniel Yankelovich, "New Criteria for Market Segmentation," Marketing Management and Administrative Action, ed. Steuart Henderson Britt and Harper W. Boyd, Jr. (rev. ed. New York, St. Louis, San Francisco, Toronto, London, Sydney: McGraw-Hill Book Co., 1968) p. 190.

35
interaction between theoretical and empirical classifi-catory approaches. Just as marketing has increasingly taken an active role in theory development, it should also make some concerted effort in leading the development of classificatory methods.^^
The marketing manager may have access to some very sophisti
cated classification data at the present time. In many cases, the mar
keting manager has to decide between measurable classification criteria
and difficult to measure classification criteria. Examples of measur
able classification criteria are incomes, marital status, size of
family, religion, age, size of community, whether or not the product
is already owned, and the age and condition of the product owned.
Difficult to measure classification criteria are such factors as social
and psychological characteristics.^^
Some desirable characteristics of classification data are dis
cussed by Kotler.
How can the seller determine which buyers' characteristics produce the best partitioning of a particular market? The seller does not want to treat all the customers alike, nor does he want to treat them all differently. The usefulness of particular characteristics for segmentation purposes increases as certain conditions are approached.
The first condition is measurability, the degree to which information exists or is obtainable on various buyers' characteristics. Unfortunately, many suggestive characteristics are not susceptible to easy measurement. Thus, it is hard to measure the respective number of automobile buyers who are motivated primarily by considerations of economy versus status versus quality.
^^Myers and Nicosia, op. cit., p. 193,
^^Alfred R. Oxenfeldt, Executive Action In Marketing (Belmont, California: Wadsworth Publishing Co., Inc., 1966), p. 49.
" Ibid.

36
The second condition is accessibility, the degree to which the firm can effectively focus its marketing efforts on chosen segments. This is not possible with all segmentation variables. It would be nice if advertising could be directed mainly to opinion leaders, but their media habits are not always distinct from those of opinion followers.
The third condition is substantiality, the degree to which the segments are large enough to be worth considering for separate marketing cultivation. A segment should be the smallest unit for which it is practical to tailor a separate marketing program.^^
In this investigation, the classification emphasis is on measur
able criteria, i.e., demographic characteristics of owners of washing
machines. This does not mean that this criterion is necessarily
superior to any other criteria. But the demographic classification
variables do satisfy two of the three conditions specified by Kotler; ,"
the conditions of measurability and accessibility. if (I*
Another problem that is associated with classification methods .Z^;
If- -.
and market segmentation pertains to group classification versus indivi
dual classification. The following quotations support group classifi
cation criteria for segmenting markets.
The two most important ideas to consider in market segmentation are the following fundamental propositions: (1) market segmentation is a management strategy and (2) implementation of the strategy of market segmentation involves postulates about the characteristics and the behavior of groups, not persons. Smith, in his pioneering article, expressly included these propositions in his definition of market segmentation. Smith's definition was "market segmentation consists of viewing a heterogeneous market as a number of small homogeneous markets in response to differing product preferences among important market segments. It is attributable to the desires of consumers or users for more precise satisfaction of their varying wants. Segmentation often involves the use of
Philip Kotler, Marketing Management (Englewood Cliffs, New Jersey: Prentice-Hall, Inc., 1967), p. 45.

37
advertising and promotion. It is a merchandising strategy." Much of the confusion about market segmentation stems from failure to recognize the two fundamental propositions. The absence of a satisfactory theory of individual behavior does not necessarily imply the absence of valid propositions about the groups'' behavior. For marketing strategy, it is the behavior of groups, not persons, that is primarily important.^"
Much of marketing is concerned with group behavior. Selling efforts usually are not directed at particular individuals but at segments of the market. Retail merchandising, advertising, and most other forms of consumer marketing are designed to benefit from the law of large numbers. In other words, we expect that on the average a sizable proportion of a market will react favorably to the marketing effort. The same selling appeal is directed at all individuals making up a market segment. It is not expected, or even hoped, that all individuals will respond favorably to the marketing program. In this sense, it is the mass or aggregate approach that characterizes most marketing effort; and it would appear to be most logical to explain consumer behavior in terms of average or typical behavior within groups of consumers.^'
The classification methods utilized in Chapter Four of this in
vestigation are based on groups. Although there is some controversy
about the significance of group behavior versus individual behavior in
market segmentation analysis, group behavior is satisfactory as a classi
fication base.
The second major step to take when attempting to segment markets
is to empirically test the classification methods. There are several
problems involved in the second step. First, one must gather data so
that empirical tests can be conducted; secondly, one must determine what
types of tests to use with the classification method.
46
47
Bass, Tigert, Lonsdale, op. cit., p. 264.
Bell, op. cit., p. 174.

38
A marketing manager would have access to empirical data. He
could take internal random probability samples of charge customers
that have purchased specific types of products in the past; assuming
that the firm had extensive classification information about its cus
tomers. He could acquire Census data that had been, gathered by the
U. S. Government; at the present time, there are sophisticated cross-
tabulations available from private firms. In addition, a business firm
could conduct primary research to gather and test classification cri
teria for consumers of specific products.
After acquiring classification data about consumers of specific
products, tests should be conducted for the different classification
methods. Recently, several articles about mathematical testing of mar-
48
ket segments have appeared in the literature. Some of the mathe
matical methods are very sophisticated; for example, numerical taxo-
nomic techniques, cluster analysis, factor analysis, etc., were used
in attempts to isolate market segments. ' While some of the methods
are quite sophisticated, other tests were made employing some of the
more traditional statistical tests. In this study, the investigator
intends to employ some nonparametric and parametric statistical tech
niques to test classification variables in market grid matrices.
^^Johan Arndt, "New Directions in Market Segmentation," Insights Into Consumer Behavior, ed. Johan Arndt (Boston, Massachusetts: Allyn and Bacon, Inc., 1968), pp. 85-146.
^9ibid.
50 Bass, Tigert, Lonsdale, op. cit., pp. 264-270.

39
The market grid matrix appears to be especially suited for
testing classification variables. Past purchases of specific products
can be cross-tabulated with classification variables to form the mar
ket grid matrix. Then analysis of variance type statistical tests can
be employed to isolate significant classification variables in the mar
ket grid matrix. This technique would enable a marketing manager to
evaluate several classification methods. By changing the classifica
tion criteria for specific products, the marketing manager could pos
sibly discover an effective classification method for specific pro
ducts. This would be equivalent to isolating target markets, or seg
menting markets for a particular product.
Data in market grid matrices could be employed to implement
backward segmentation. Backward segmentation is feasible for estab
lished products; the following quotation by Samli illustrates the con
cept.
, , , if the consumers of certain products or customers of certain businesses were to be analyzed and categorized after the fact, segmentation is expected to be more realistic. The users or consumers of certain products do have common characteristics; to the extent that these characteristics can be detected and measured segmentation is achieved.
Apparently backward segmentation is feasible and would be beneficial to
the marketing manager.
. , , those persons who will buy a product in the future will be very much like those who have purchased in the past.^^
A. Coskun Samli, "Segmentation and Carving A Niche in the Market Place," Journal of Retailing, XLIV, No. 2 (Summer, 1968), p. 37.
52 Sissors, op. cit., p. 17.

40
By employing backward market segmentation, the marketing manager
could construct market grids based upon cross-tabulations of sales of
established products and classification variables of consumers or users.
Possibly, nonparametric or parametric analysis of variance tests could
be employed to isolate pertinent classification variables in the mar
ket grid matrices. Analysis of variance tests (F-tests) would be needed
for the market grids because most of the grids would contain more than
two rows or two columns. When more than two columns are present, the
t-test will not suffice for tests of significance.
The statistical tests that are utilized in this study to em
pirically test classification variables are of a nonparametric and
parametric nature. The nonparametric Kruskal-Wallis one-way analysis
of variance test and the parametric F-test are employed when making
tests of significance between classification variables in the columns
of market grid matrices. The Mann-Whitney U test, the Fisher exact
probability test, and the Moroney test are also used in this investiga
tion. All of the above tests (except the Moroney test) are available
53 on computer programs.-'-
Although analysis of variance type statistical tests appear to
be ideal to use for data in market grid matrices, there are several as
sumptions underlying the tests. The characteristics of the tests and
the assumptions underlying the tests are analyzed in the following
chapter.
• John Morris, "Nonparametric Statistics on the Computer," Journal of Marketing Research, VI (February, 1969), p. 86.

41
At the present time in marketing, there is a trend toward
catering to smaller and smaller target markets or market segments.
The availability of sophisticated secondary data helps marketing man
agers appeal to smaller market segments. The following quotation by
McCarthy describes a technical cross-tabulation of the 1960 Census
data (the Tesauro cross-tabulation).^^ A portion of this cross-
tabulation is used in Chapter Four of this investigation.
Fortunately, as the idea of catering to smaller and smaller target markets becomes more widely accepted, we see specific data with cross-classifications becoming available. More attention is being directed to the female market, the teen-age market, and the senior citizen market, among others.
Even the 1960 Census data is now available from a private source that supplements the official Census data with additional cross-classification. For example, if a firm were interested in knowing how many households had incomes between $7,000 and $9,999 and also had five or more persons in the household, and also owned no car, one car, two cars, or three or more cars such data is available.^^
A marketing manager should harvest important benefits if he can
isolate significant classification variables in market grid matrices.
Target market identification should facilitate the construction of a
marketing mix to hit the market segments. Some of the benefits that
accrue from market segment identification are illustrated in the follow
ing quotations.
People and Homes in the American Market (Detroit; S, J, Tesauro & Co., 1961).
^%cCarthy, op. cit., p. 126.

42
The seller who is alert to the needs of different market segments may gain in three ways. First, he is in a better position to spot and compare marketing opportunities. He can examine the needs of each segment against the current competitive offerings and determine the extent of current satisfaction.
' Second, the seller can use his knowledge of the marketing I response differences of the various market segments to
guide the allocation of his total marketing budget. The ultimate bases for meaningful segmentation are differences in customer response to different marketing tools. These response differences become the basis for deciding on the allocation of company marketing funds to different cus-
I tomers. Third, the seller can make finer adjustments of his product and marketing appeals. Instead of one market-
( ing program aimed to draw in all potential buyers, (the "shotgun" approach), the seller can create separate market-
, ing programs aimed to meet the needs of different buyers (the "rifle" approach).^6
i
f Finally, the following quotation by Daniel Yankelovich illustrates the
specific significance of market segmentation to the marketing manager.
Once the marketing director does discover the most pragmatically useful way of segmenting his market, it becomes a new standard for almost all his evaluations. He will use it to appraise competitive strengths and vulnerabilities, to plan his product line, to determine his advertising and selling strategy, and to set precise marketing objectives against which performance can later be measured. Specifically, segmentation analysis helps him to: * direct the appropriate amounts of promotional attention
and money to the most potentially profitable segments of his market;
I * design a product line that truly parallels the demands of the market instead of one that bulks in some areas and ignores or scants other potentially quite profit-
I able segments; * catch the first sign of a major trend in a swiftly
changing market and thus give him time to prepare to take advantage of it;
^^Kotler, op. cit., p. 45.

43
determine the appeals that will be most effective in his company's advertising; and, where several different appeals are significantly effective, quantify the segments of the market responsive to each; choose advertising media more wisely and determine the proportion of budget that should be allocated to each medium in the light of anticipated impact; correct the timing of advertising and promotional efforts so that they are massed in the weeks, months, and seasons when selling resistance is least and responsiveness is likely to be at its maximum; understand otherwise seemingly meaningless demographic market information and apply it in scores of new and effective ways.^^
57 Yankelovich, op. cit., p. 188,

-CHAPTER III
SOtlE PARAMETRIC AND NONPARAMETRIC STATISTICAL TESTS THAT MAY BE USED TO IMPLEMENT THE MARKET
GRID METHOD OF MARKET SEGMENTATION
Introduction
In the previous chapter, it was emphasized that analysis of
variance statistical tests could possibly be used to test classifica
tion criteria in market grid matrices. The principal problem of this
study is to ascertain the feasibility of employing statistical tests to
isolate target markets or implement the market grid method of market
segmentation. Implementation of the market grid method of market seg
mentation depends upon developing a method for scientific isolation of
significant customer classification variables in market grid matrices.
Two types of statistical tests, parametric and nonparametric,
are analyzed in the chapter. Several assumptions underlie the use of
these tests. The assumptions underlying the parametric F-test are ex
amined in detail.
At this juncture of the investigation, one should make some as
sumptions; first, assume that the marketing manager has decided upon
the classification variables that will be used in the market grid ma
trices; second, assume that the information or data for each cell of
the market grid matrices have been obtained by using random prob
ability sampling techniques; third, assume that the data have been cross-
tabulated according to demographic characteristics in households and
44

45
different types of a specific product (v7ashing machines) . The results
of these assumptions are found in Table 1.
An examination of the market grid matrix affords an opportunity
to re-establish the primary problem facing the marketing manager. The
principal question is; is there a "significant" difference between
classification variables in the columns of the matrix? One can see
that the column means of Table 1 have different quantitative values.
Is the difference due to a real difference between column means, or
random sampling fluctuations? These are the elementary questions that
can be answered if it is feasible to employ statistical tests when
analyzing data in market grid matrices.
In the market grid matrix (Table 1) the demographic classifi
cation pertains to number of persons in a household. This classifi
cation variable was cross-tabulated with ownership of different types
of washing machines in the household. The researcher would be inter
ested in knowing if one (or more) of the classification variables
(columns in the matrix) is more or less significant than the others.
If one could obtain this information, it would help him to isolate tar
get market segments for a product and also help him develop a market
ing mix to hit the target markets. The isolation of target markets and
the development of the marketing mix to hit the target market repre
sents the two major components of marketing strategy.
^E. Jerome McCarthy, Basic Marketing, A Managerial Approach (3d ed.; Homewood, Illinois: Richard D. Irwin, Inc., 1965), p. 21.

46
TABLE 1
TYPES OF WASHING MACHINES IN STATE OF TEXAS HOUSEHOLDS, CROSS-CLASSIFIED BY NUMBER OF PERSONS IN HOUSEHOLD, 1960 (00's OF UNITS)
Type of Washing Machine
Wringer, Spinner
Automatic or Semi-Automatic
Washer-Dryer Combination
Totals Mean
Number of 1
434
435
15
884 295
2
1609
2574
112
4295 1432
Persons 3
958
2565
100
3623 1208
in Househ 4
825
2937
95
3857 1286
3ld 5 more
1875
3205
104
5184 1728
17,843 1190*
Grand Mean of the matrix (17,843/15)
Source: People and Homes in the American Market, Texas, XLII (Detroit: S, J. Tesauro & Co., 1961), p, 3.
m
47
After reviewing the literature, the investigator is convinced
that two different types of statistical tests may possibly be used to
isolate significant classification variables in the market grid ma
trices; these tests are of a parametric and nonparametric nature. A
large portion of the literature pertaining to nonparametric statistical
tests originated in the social science field. Hence, a large part of
the information in this chapter is based upon the findings of psycho
logical and sociological statisticians.
Parametric Statistical Tests
Parametric statistical tests are discussed before nonparametric
tests because they are older and more widely used than nonparametric
tests.
A parametric statistical test is a test whose model specifies certain conditions about the parameters of the population from which the research sample was drawn. Since these conditions are not ordinarily tested, they are assumed to hold. The meaningfulness of the results of a parametric test depends on the validity of the assumptions.
Two parametric tests which appear to be particularly relevant
to the marketing manager's problem of identifying significant classi
fication variables are the t and F-tests; both of these tests are used
with the analysis of variance statistical technique. Since analysis
of variance type tests are employed in an attempt to isolate signifi
cant classification criteria in market grid matrices, some of the
^Sidney Siegel, Nonparametric Statistics for the Behavioral Sciences (New York, Toronto, London: McGraw-Hill Book Co., Inc., 1956), p. 31.

48
purposes of analysis of variance are: (1) to estimate certain treat
ment differences that are of interest, (2) to obtain some idea of the
accuracy of the estimates, e. g., by attaching to them estimated
standard areas, confidence limits, etc, and (3) to perform tests of
significance,-* In this investigation, the emphasis is on the third
purpose, performance of tests of significance.
The analysis of variance technique appears to be ideal for the
marketing manager because he can use the methodology to determine if
there is a significant difference among the means of the classification
variables in the columns of a market grid matrix. In most instances,
the market grid matrix will contain more than two classification vari
ables in the columns; when this is the case, analysis of variance
could be used to determine if significant differences existed among
classification column means.
Initially, it may appear that a series of t-tests between two
column means (in each test) would enable the marketing manager to iso
late significant classification variables in the market grid matrix.
However, this is not the case. The following quotation reveals the haz
ards of using t-tests in such a situation.
Circumstances sometimes require that we design an experiment so that more than two samples or conditions can be studied simultaneously. When three or more samples or conditions are to be compared in an experiment, it is necessary to use a statistical test which will indicate whether there is an over-all difference among the k samples or conditions before one picks out any pair of samples in order to test
•H . G. Cochran, "Some Consequences When the Assumptions for the Analysis of Variance Are Not Satisfied," Biometrics, III, No, 1 (March, 1947), p, 22,

m
49
the significance of the difference between them. If we wished to use a two-sample statistical test to
test for differences among, say 5 groups, we would need to compute, in order to compare each pair of samples, 10 statistical tests. (Five things taken 2 at a time =/5]=
10.) Such a procedure is not only tedious, but it may lead to fallacious conclusions as well because it capitalizes on chanpe. That is, suppose we wish to use a significance level of, say, a=.05. Our hypothesis is that there is a difference among k=5 samples. If we test that hypothesis by comparing each of the 5 samples with every other sample, using a two-saiiq)le test (which would require 10 comparisons in all), we are giving ourselves 10 chances rather than 1 chance to reject Ho. Now when we set .05 as our level of significance, we are taking the risk of rejecting Ho erroneously (making the Type I error) 5 per cent of the time. But if we make 10 statistical tests of the same hypothesis, we increase the probability of the Type I error. It can be shown that, for 5 samples, the probability that a two-sample statistical test will find one or more "significant" differences, when a=,05, is p=.40. That is, the actual significance level in such a procedure becomes a=,40.^
Because of the complexities outlined by Siegel, one should make
use of an analysis of variance test instead of a series of t-tests to
locate significant, or possibly nonsignificant, classification vari
ables in the columns of market grid matrices. A detailed description
of the parametric analysis of variance statistical technique follows.
An example of an analysis of variance type problem will illus
trate the mathematical procedures involved in parametric analysis of
variance tests. A market grid matrix. Table 2, is used in the example.
There are various procedures or techniques one can use to deter
mine if there is a significant difference between the column means of
a market grid matrix. In this study, each matrix has the same number
^Siegel, op. cit., pp. 159-160.

50
of observations in each column; therefore, the short method of calcu
lation for one-way analysis of variance will be used. Seymour Banks
advocates the following steps for computing the F ratio in analysis of
variance problems: (1) compute the correction factor; (2) compute the
total sum of squares for columns; (3) compute the sura of squares for
error.^ After completing the aforementioned steps, a summary table
is prepared; within this table the F ratios for tests of significance
are computed. The following paragraphs illustrate the steps outlined
in the aforementioned sequence.
First, the correction factor is computed. The correction
factor is determined by squaring the sum of the X variables in the
matrix and then dividing the squared value by the number of cells in
the market grid matrix. Looking at Table 2, one notes that the sum of
the X values is 8430; also, one notes that the matrix contains 12 cells.
2
Therefore, C, the correction factor is equal to (8,430) /12. This re
sults in a correction factor equal to 5,992,075. The correction
factor, C, is employed to compute total variation and the variation of
columns when solving the problem.
Next, the investigator computes the total sum of squares. The
total sum of squares represents the total variation in the matrix. The
investigator should realize that the total variation from all sources
in the matrix must equal total variation. The total sum of squares is
computed by squaring each observation in the market grid matrix. Table 2;
^Seymour Banks, Experimentation in Marketing (New York, St. Louis, San Francisco, Toronto, London, Sydney: McGraw-Hill Book Co., 1965), pp. 55-56.
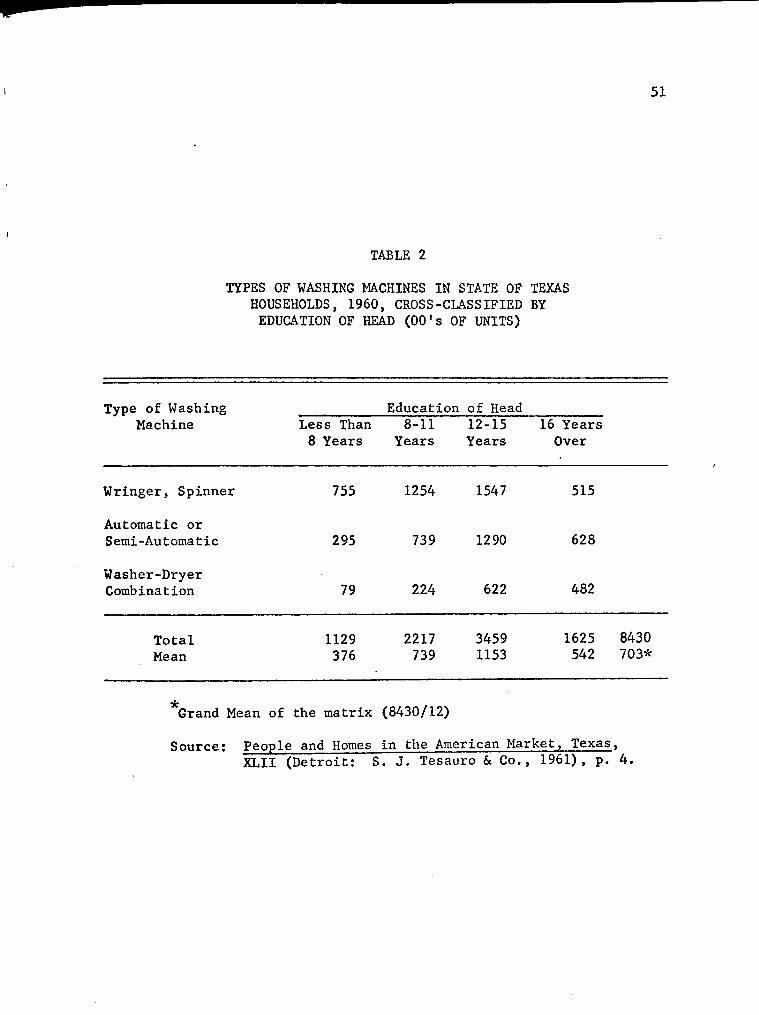
TABLE 2
TYPES OF WASHING MACHINES IN STATE OF TEXAS HOUSEHOLDS, 1960, CROSS-CLASSIFIED BY EDUCATION OF HEAD (00's OF UNITS)
51
Type of Washing Machine
Education of Head Less Than 8 Years
8-11 Years
12-15 Years
16 Years Over
Wringer, Spinner 755 1254 1547 515
Automatic or Semi-Automatic 295 739 1290 628
Washer-Dryer Combination 79 224 622 482
Total Mean
1129 376
2217 739
3459 1153
1625 542
8430 703*
Grand Mean of the matrix (8430/12)
Source: People and Homes in the American Market, Texas, XLII (Detroit; S. J. Tesauro & Co., 1961), p. 4.

«
52
next, the squared values are summed. The summed values of the squared
observations are equal to 8,168,230. The formula for computing the
total sum of squares is the sum of X -C. The mathematical calculation
for the total sum of squares is illustrated in Table 3.
The next logical step is the computation of the sum of squares
for the columns in Table 2. This value indicates what portion of the
total sum of squares is due to variation in the columns. The column
sum of squares is computed by squaring the total of each column,
summing the squared values, and dividing by the number of observations
in each column (this is the case when there is an equal number of ob
servations in each column). After the summation process, the correc
tion factor, C, is subtracted from the value acquired in the previous
steps. The sum of squares for columns is computed as follows;
SSc = (1129)^ -f (2217)^ + (3459)2 + (1625)^ . 5,922,075
SSc = 20,795,036 . 5,922,075
SSc = 1,009,603.
The value for the sum of squares for columns (1,009,603) indicates that
portion of the total variation (2,246,155) which is due to the vari
ation of the columns in Table 2.
After making these computations, the analyst is ready to com
pute the remaining source of variation in the market grid matrix; the
residual or experimental error. This value is determined by summing
the variations of the columns and deducting this value from the total
sura of squares.

53
TABLE 3
TOTAL VARIATION OR TOTAL SUM OF SQUARES CALCULATION FOR VALUES IN TABLE 2
Education of Head Less Than 8-11 12-15 16 Years 8 Years Years Years Over
570,025 1,572,516 2,393,209 265,225
87,025 546,121 1,664,100 394,384
6,241 50,176 386,884 232,324
Total 663,291 2,168,813 4,444,193 891,933 8,168,230
Total Sum of Squares = 8,168,230 - C
= 8,168,230 - 5,922,075
= 2,246,155

54
For example:
Total Sum of Squares 2,246,155
Column Sum of Squares 1,009,603
Residual or Experimental Error = 1,236,552
Now the investigator can construct a summary table and compute
variance and ultimately the F ratios that he will use to determine if
there is a significant difference between the column means of Table 2.
However, at this point, or before this point is reached, the investi
gator should establish the null hypothesis. The null hypothesis (Ho)
is that there is no difference between the column means in Table 2.
The hypothesis will be tested at the .05 level of significance.
It is important to note that the means do not actually have to
be computed when using the short cut method described by Banks. How
ever, if means had been computed and used to compute variation, the
total variations that would have gone into the summary table would be
identical with those values in the summary table.
Now it is time to construct the sxommary table and compute the
F ratios which will be the basis for accepting or rejecting the null
hypothesis.

TABLE 4
SUMMARY TABLE FOR PARAMETRIC ANALYSIS OF VARIANCE TEST
55
Source of Variation
Columns
Residual
Total
Degrees of Freedom
3
8
11
Sum of Squares
1,009,603
1,236,552
2,246,155
Variance
336,534
154,569
Computed F
2.18
F.95
4.07

56
Several steps are involved in computing the F ratios in Table
4. One important step pertains to degrees of freedom. The degrees of
freedom for a one-way analysis of variance test are computed in the
following manner. Table 5.
TABLE 5
DEGREES OF FREEDOM FOR ONE-WAY ANALYSIS OF VARIANCE^
Source of Variation Degrees of Freedom
Columns (Between Groups)
Residual (Within Groups)
k-l'
T-k **
Total
k = number of columns
T-1
T = number of observations
After the degrees of freedom are determined, they are divided into the
sum of squares for columns and residual. The result of this division
is variance.
The computed F ratios are determined by dividing the residual
variance into the variance for columns. For example, 336,534/154,569
is equal to the computed F value of 2.18.
^Samuel B. Richmond, Statistical Analysis (2d ed.; New York: The Ronald Press Co., 1964), pp. 312-314.

57
Next, the analyst must determine if the F ratio of 2.18 is
significant at the ,05 level of significance. The F distribution
varies for different combinations of degrees of freedom in the numer
ator and denominator of the ratio. For example, the degrees of free
dom for the F ratio of columns in Table 4 is 3/8. One should note that
the residual degrees of freedom is always the denominator of the ratio.
Next, the investigator uses an F distribution table to deter
mine if the F ratio for columns is significant. At a=,05 level of
significance, F is equal to 4.07 when there are 3 degrees of freedom
in the numerator and 8 degrees of freedom in the denominator. When a
computed F value is equal to or greater than 4.07, the null hypothesis
for columns is rejected. Therefore, Ho is accepted; there is not a
significant difference in the column means of Table 2.
It is important to note that the F-test is only a simultaneous
test of all column means in the matrix. Table 2.
The F-test of the over-all null hypothesis is regarded as essentially a way of applying a test of significance simultaneously to the observed differences for all possible pairs of treatments. If the F of this over-all test proves to be non-significant, we know at once that all observed differences among individual treatments are simultaneously attributable to chance alone. Knowing this, there would be little point in applying the t-test successively to the difference for individual pairs of treatments.
However, if the F-test is significant, it does not necessarily follow that the population mean for each treatment differs from that for every other. In an experiment involving four treatments, for example, it is possible that three of the treatments have identical average effects
^Jerome L. Myers, Fundamentals of Experimental Design (Boston: Allyn 6e Bacon, 1966) , p. 384.

r 58
-on the population, that only one differs from the others, and that it is the effect of this one treatment which accounts for the significant F.
The preliminary over-all F-test is then regarded simply as a way of determining whether or not it is necessary and legitimate to apply the t-test to individual pairs of means. If the over-all F proves significant, we nearly always go on to the more specific tests.°
Later, in Chapter Four of the investigation, tests that have
the capability of locating specific variables in market grid matrices
are employed. It is important that the marketing manager be able to
locate specific significant classification variables.
The previous example illustrates that the mathematical calcu
lations for parametric analysis of variance tests are not complex.
However, the investigator should be very careful of the assumptions
underlying parametric analysis of variance tests. Banks notes that:
. . . one can always carry out the arithmetic, the issue is whether the answers mean anything.°
Whether or not the answers mean anything depends upon how well the data
being used satisfy the assumptions underlying parametric analysis of
variance tests.
The Assumptions Underlying Parametric Analysis of Variance Tests
The assumptions underlying parametric analysis of variance are
difficult to define. Different assxmiptions are required by different
statisticians. In this sector of the study, the investigator is
°E. F. Lindquist, Design and Analysis of Experiments in Psychology and Education (Boston: Houghton Mifflin Co., 1953), pp. 90-91.
Q Banks, op. cit., p. 73.

«
59
concerned about isolating some of the most common assumptions under
lying parametric analysis of variance tests. The following paragraphs
illustrate assumptions that are advocated by prominent statisticians.
1. Assumptions required for analysis of variance.
(1) The treatment effects and the environmental effects must be additive. (2) The experimental errors must be independent. (3) The experimental errors must have a common variance. (4) The experimental errors should be normally distributed. ^
2. The assumptions for analysis of variance are basically the same as required for the difference-of-means test, but the test itself is very different. We shall have to assume normality, independent random samples, and equal standard deviations, and the null hypothesis will be that population means are equal. The test itself, however, involves working directly with variances rather than means and standard errors.
3, Like all other statistical procedures, the analysis of variance technique is applicable only to data which meet the assumption upon which it is based. One can always carry out the arithmetic, the issue is whether the answers mean anything. The assumptions of the analysis of variance are: (1) Random variables (2) Homogeneity of variance with groups (3) Additivity of effects (4) Experimental errors normally and independently distributed. It will be found that these requirements are met by much of the data derived from marketing experiments.1
4, The parametric tests, for example, the t or F tests, have a variety of strong assumptions underlying their use. When those assumptions are valid, these tests are the most likely of all tests to reject Ho when Ho is false.
10 Cochran, op. cit., p. 23.
l^Hubert M. Blalock, Social Statistics (New York, Toronto, London: McGraw-Hill Book Co., Inc., 1960), p. 242.
12 Banks, op. cit., p. 72.

m
60
That is, when research data may appropriately be analyzed by a parametric test, that test will be more powerful than any other in rejecting Ho when it is false. Notice, however, the requirement that the research data must be appropriate for the test. What constitutes such appropriateness? What are the conditions that are associated with the statistical model and the measurement requirement underlying, say, the t test? The conditions which must be satisfied to make the t test the most powerful one, and in fact before any confidence can be placed in any probability statement obtained by the use of the t test, are at least these:
(1) The observations must be independent. That is, the selection of any one case from the population for inclusion in the sample must not bias the chances of any other case for inclusion, and the score which is assigned to any case must not bias the score which is assigned to any other case. (2) The observations must be drawn from normally distributed populations. (3) These populations must have the same variance (or, in special cases, they must have a known ratio of variances) , (4) The variables involved must have been measured in at least an interval scale, so that it is possible to use the operations of arithmetic (adding, dividing, finding means, etc.) on the scores. (5) The means of these normal and homoscedastic populations must be linear combinations of effects due to columns and/or rows. That is, the effects must be additive. All of the above conditions (except 4, which states the measurement requirement) are elements of the parametric statistical model. With the possible exception of the assumption of homoscedasticity (equal variances), these conditions are ordinarily not tested in the course of the performance of a statistical analysis. Rather they are presumptions which are accepted, and their truth or falsity determines the meaningfulness of the probability statement arrived at by the parametric test.l
5. The following assumptions are from Fredrick C. Mills.
(1) Distributions of experimental errors should be normal. It is a necessary condition of the method of variance analysis that the samples from which we derive the error
13 Siegel, op. cit., pp. 19-20.

'V'tmmmsmHfm^misnfs^m
61
variance come from the normally distributed nar-ent population. (2) Experimental errors should be homogeneous in their variance. (3) The influence represented by the Principles of Classification should be additive. (4) Experimental errors should be independent. The observations falling into any of the classes or subclasses from which the error variance is estimated should be independently distributed, as well as normally distributed, about the class, or sub-class, mean. In the absence of such independence, estimates of variances can be biased, and tests of significance impaired. Where deliberate design is possible in setting up an experiment involving variance analysis, the effect of independence may be achieved through randomization, but such design is not always possible in dealing with social and economic data.^
6. The assumptions listed by Myers are very concise and to the
point. E^j is defined as;
The quantity E .: is the error associated with the ith score in the jth group and is a unique contribution of the individual, a deviation of the total score from u which cannot be accounted for by the treatment effect. The variability in E^^ may be due to differences among subjects in such factors as ability, set, maturation, the tone in which instructions are read, or the temperature of the room.
(1) the E^s are independently distributed, (2) the E^^ are normally distributed, (3) the variance for E^. is the same for all treatment populations.
ij
15 (4) the null hypothesis is true.
The most common assumption underlying parametric analysis of
variance tests are not easy to determine. However, considerable
' Fredrick C. Mills, Statistical Methods (3d ed.; New York, Chicago, San Francisco, Toronto: Holt, Rinehart and Winston, 1955), pp. 571-573.
layers, op. cit., pp. 54-61.

62
-research has been conducted on assumptions for analysis of variance in
the field of psychology. The following quotations from Gaito illus
trate some of the more common assumptions underlying parametric analysis
of variance techniques. One notes that these are the same assumptions
that have been quoted in the previous paragraphs.
Before one can use a parametric technique he must make certain assumptions. For this discussion we will concentrate on the analysis of variance technique which is a general model for tests of homogeneity of means (the common problem which seems to confront psychologists). The t test is a special case of the analysis of variance model when the between groups degrees of freedom equal one. It must be emphasized that the following statements are relevant only to an analysis of variance type situation.
The assumptions required for the use of this technique are as follows, (a) The errors must be independent.
(b) The variables included within the experiment must be additive, i.e., the means of these variables or effects must be linear combinations, (c) The variance of the different portions of the appropriate error term must be normal in the treatment population, (d) The distribution of the observations which are used as the appropriate error term must be normal in the treatment population, (e) The variables involved must be measurable by an interval scale for valid use of the technique.
Research by John Gaito indicates that all statisticians are
not in complete agreement about the assumptions pertaining to analy
sis of variance. However, he notes that there are three assumptions
which appear to be somewhat common.
^^John Gaito, "Non-Parametric Methods in Psychological Research," Psychological Reports, V (March-December, 1959), p. 115.
UMii£&i&iiii^
63
Some individuals include all of the above requirements; others list fewer assumptions. However, all individuals include assumptions a, c, and d.
Gaito's common assumptions (a, c, d) are: (a) the errors must be in
dependent, (c) the variance of the different portions of the appropri
ate error term must be normal in the treatment population, and (d) the
distribution of the observations which are used as the appropriate
18
error term must be normal in the treatment population. Gaito's re
search indicates that assumptions c and d have been studied more than
the other assumptions.
It appears that assumptions c and d have been studied more than any of the others. Furthermore, it seems that these assumptions are the main ones that have prompted the development of non-parametric methods. However, the mathematical and empirical data indicates that tests of homogeneity of means by analysis of variance (and two-tailed t tests) are relatively insensitive to both deviations from normality and from homogeneity of variance. -
Gaito notes that only two more basic assumptions are required for para
metric analysis of variance tests than nonparametric tests.
We can immediately cast aside assumption a, that of independence. This assumption must apply also to nonparametric techniques inasmuch as they are based on probability distributions which assume chance distribution of
20 errors.^"
Analysis of variance is used frequently when the assimiptions
underlying the test are not met. The effect of violating the assump
tions is discussed in the following paragraphs.
l^ibid.
. Ibid.
^^Ibid.
Ibid.

64
Considerable research has been done in the field of psycho
logical statistics about violating the assumptions for analysis of vari
ance. One outstanding experiment concerning the violation of some of
the assumptions for analysis of variance was conducted by Norton. A
brief description of Norton's work in summary research articles by
Gaito and Boneau follows:
The mathematical and empirical data indicate that tests of hranogeneity of means by analysis of variance (and two-tailed t tests) are relatively insensitive to both deviations from normality and from homogeneity of variance.
For example, the most important empirical investigation in this area was that by Norton (cited by Lindquist). In one phase of this study Norton chose numerous samples from each of four different populations: a J-shaped distribution, a markedly skewed one, a moderately skewed one, and a normal distribution. Accompanying this extreme deviation from normality was extreme heterogeneity of variance, one variance being almost 45 times that of another. This situation probably represents more of a discrepancy than is found in most experimental situations. However, even with this violent departure from the theoretical assumptions, the F distribution still represented a fairly good fit. The effect was to approximately double the probability level. However, Lindquist asserts that if the investigator allows for this effect, he may still use the normal theory test to great advantages, e.g., set .025 rather than .05 or .005 rather than .01 for probability levels.
Box and Anderson, after reviewing studies by Box, Gayen, Geary, and others concerning the analysis of variance and two-tailed t tests, maintain that, "from the foregoing tables it can be seen that a large variety of tests for comparing means are highly robust to both non-normality and inequality of variances. Therefore, the practical experimenter may use these tests of significance with relatively little worry concerning the failure of these assumptions to hold exactly in experimental situations. The rather striking exception to this rule is the sensitivity of the analysis of variance heterogeneity when the groups are of

-?«*?^?fV'
65
91 unequal size", •"•
Boneau reached the following conclusions after doing research
pertaining to the violation of assumptions for the t distribution.
Having violated a number of assumptions underlying the t test, and finding that, by and large, such violations produce a minimal effect on the distribution of t's, we must conclude that the t test is a remarkably robust test in the technical sense of the word. This term was introduced by Box (1953) to characterize statistical tests which are only inconsequentially affected by a violation of the underlying assumptions.
We may conclude that for a large number of different situations confronting the researcher, the use of the ordinary t test and its associated table will result in probability statements which are accurate to a high degree, even though the assumptions of homogeneity of variance and normality of the underlying distribution are untenable. ^
It would seem then that both empirically and mathematically there can be demonstrated only a minor effect of the validity of probability statements caused by heterogeneity of variance, provided the sizes of the samples are the same. This applies to the F as well as the t
23 test. -*
Other research about the violation of assumptions for analy
sis of variance indicate that the F and t-tests may be more robust
than previously assumed. W. G. Cochran noted in an article, pertain
ing to investigations of consequences when the assumptions for the
analysis of variance are not satisfied, that the F and t-test are
21 Ibid., pp, 116-117.
^^C. Alan Boneau, "The Effects of Violations of Assumptions Underlying the £ Test," Psychological Bulletin, LVII, No. 1 (January, 1960), pp. 61-62.
23 Ibid., p. 57.
66
flexible and may be employed when some of the assumptions underlying
the tests are not satisfied.
The concensus from these investigations is that no serious error is introduced by non-normality in the significance levels of the F-test or of the two-tailed t-test. While it is difficult to generalize about the range of populations that were investigated, this appears to cover most cases in practice. If a guess may be made about the limits of error, the true probability corresponding to the tabular 5 per cent significance level may lie between 4 and 7 per cent. For the 1 per cent level, the limits might be taken as % per cent and 2 per cent. As a rule the tabular probability is an underestimate: that is, by using the ordinary F and t tables we tend to err in the direction of announcing too many significant results.^^
Gaito noted little distortion when the assumptions for analy
sis of variance were not satisfied.
, , , a review of studies concerned with investigating the effects on tests of significance of failure to satisfy the assumptions of the analysis of variance and the two-tailed t test, indicated little distortion even when marked deviations from assumptions occur. In some cases the distortion is so small as to be disregarded; in other cases where the deviations are more marked, the investigator may set a lower probability level for significance, e.g., ,025 instead of ,05, ,005 instead of .01, or use a suitable transformation for correcting the deviations.
Many statisticians feel that the parametric F and t-tests can
be used for making tests of significance even when some of the assump
tions underlying the test can not be met. The previous paragraphs
indicate that the t and F-tests are extremely robust tests. This
situation is pertinent to this study. If a marketing manager desires
to make a test at a=.05 and can make sure of this significance level
by actually testing at a=.025, then by all means he may do so. This
Cochran, op. cit., p. 24.
^^Gaito, op. cit., p. 124.

p
67
situation is simamarized by Banks in the following quotation.
The analysis of variance was originally developed to operate within a given set of assumptions. It has been found that it can be used satisfactorily in many situations where these assumptions do not quite fit. In addition, in cases where the original data are inappropriate for the analysis of variance, either because of being nonnormal or having zero entries, transformations can be used to make the data ore suitable to the requirements of analysis of variance.^°
In some cases, the researcher may desire to use another type
of statistical test if he feels that the assumptions for analysis of
variance can not be met or if he feels that enough accuracy can not be
obtained by using parametric F and t-tests. One can see that a "sig
nificant" difference between column means could be the result of false
assumptions.
If a significant difference results is it due to difference between means, or is it due to the violations of as-sumptions?2'
When the assumptions required for analysis of variance are not satis
fied or in doubt, nonparametric tests may be used for one-way analysis
of variance.^°
Nonparametric Statistical Tests
If the researcher feels that the assumptions for analysis of
variance can not be met, he has another alternative. This alternative
is to use a nonparametric statistical test to determine if there is a
2fi Banks, op. cit., p. 77.
27 Boneau, op. cit., p. 49.
blalock, op. cit., p. 264.
68
-significant difference between column means in the market grid matrix.
The use of nonparametric statistical methods is increasing; the fol
lowing quotation provides some background about the method.
Statistical procedures whose validity does not depend on the underlying random variables having a special form, such as Gaussian, are known as distribution-free or nonparametric. The amount of published material on nonparametric statistics is increasing rapidly. A bibliography published five years ago listed 999 entries and perhaps another 500 have appeared since. The use of nonparametric techniques has become widespread, and they appear now to be entering introductory statistics textbooks. Specialized courses in nonparametric inference are given in several universities, and meetings of statistics professional associations usually include sessions and almost invariably include papers on the subject.
Nonparametric methods are needed in many fields, and can be applied in all.^'
One can obtain a good perspective about the definition of non
parametric statistical measures by looking at parametric measures.
The word "parameter" refers to any measurable statistical character-
30 Istic of a population.
For example, the mean and the standard deviation of a population are two of its parameters. Many of the traditional tests of significance, such as the t-test, the F-test and the usual correlation coefficients, require certain assumptions about these parameters if the tests are to be valid.
2^1. Richard Savage, "Nonparametric Statistics," Journal of the American Statistical Association, LII, No. 279 (September, 1957), p. 331.
^^John Morris, "Nonparametric Statistics on the Computer," Journal of Marketing Research, VI (February, 1969), p. 87.

69
Nonparametric tests require fewer or less restrictive assumptions about the population parameters, and are thus applicable to a wider range of problems than are some of the traditional tests.^1
One of the most widely used nonparametric references is Sidney
Siegel's Nonparametric Statistics for the Behavioral Sciences. Siegel
defines nonparametric statistical tests as follows: ,
A nonparametric statistical test is a test whose model does not specify conditions about the parameters of the population from which the sample was drawn. Certain assumptions are associated with most nonparametric statistical tests, i.e., that the observations are independent and that the variable under study has underlying continuity, but these assumptions are fewer and much weaker than those associated with parametric tests.
The definition of Blalock is similar to Siegel's; his definition and
discussion of nonparametric tests follov7s:
The tests discussed in this chapter are often referred to as nonparametric or distribution-free tests in that they do not require the assumption of a normal population. Actually, both the terms nonparametric and distribution-free are somewhat misleading. We do not imply that such tests involve distributions which do not have parameters. Nor can a population be "distribution free". Both terms are actually used to refer to a large category of tests which do not require the normality assumption or any assumption which specifies the exact form of the population. Some assumptions about the nature of the population are required in all nonparametric tests, but these assumptions are generally weaker and less restrictive than those required in parametric tests.
When compared to parametric tests, there are several advant
ages and disadvantages associated with nonparametric tests. Some of
the advantages and disadvantages are discussed in the following
^^Ibid.
^^Siegel, op. cit., p. 31.
•^^Blalock, op. cit., p. 187,

m
70
quotations from Siegel and Gaito. The advantages of nonparametric
tests are:
1. Probability statements obtained from most nonparametric statistical tests are exact probabilities (except in the case of large samples, where excellent approximations are available), regardless of the shape of the population distribution from which the random sample was drawn. The accuracy of the probability statement does not depend on the shape of the population, although some nonparametric tests may assume identity of shape of two or more population distributions, and some others assume symmetrical population distributions. In certain cases, the nonparametric tests do assume that the underlying distribution is continuous, an assumption which they share with parametric tests.
2. If sample sizes as small as N=6 are used, there is no alternative to using a nonparametric statistical test unless the nature of the population distribution is known exactly.
3. There are suitable nonparametric statistical tests for treating samples made up of observations from several different populations. None of the parametric tests can handle such data without requiring us to make seemingly unrealistic assumptions.
4. Nonparametric statistical tests are available to treat data which are inherently in ranks as well as data whose seemingly numerical scores have the strength of ranks. That is, the researcher may only be able to say of his subjects that one has more or less of the characteristic than another, without being able to say how much more or less. For example, in studying such a variable as anxiety, we may be able to state that subject A is more anxious than subject B without knowing at all exactly how much more anxious A is. If data are inherently in ranks, or even if they can only be categorized as plus or minus (more or less, better or worse), they can be treated by nonparametric methods, whereas they cannot be treated by parametric methods unless precarious and perhaps unrealistic assiomptions are made about the underlying distributions.
5. Nonparametric methods are available to treat data which are simply classificatory, i.e., are measured in a nominal scale. No parametric technique applies to such data.

71
6. Nonparametric statistical tests are typically much 34 easier to learn and to apply than are parametric tests.-
Nonparametric statistical tests are not immune to disadvantages,
Some of the primary disadvantages of the tests are spelled out in the
following quotations.
1. If all the assumptions of the parametric statistical model are in fact met in the data, and if the measurement is of the required strength, then nonparametric statistical tests are V7asteful of data. The degree of wastefulness is expressed by the power-efficiency of the nonparametric statistical test. (It will be remembered that if a nonparametric statistical test has power-efficiency of, say, 90 per cent, this means that where all the conditions of the parametric test are satisfied the appropriate parametric test would be just as effective with a sample which is 10 per cent smaller than that used in the nonparametric analysis.)
2. There are as yet no nonparametric methods for testing interactions in the analysis of variance model, unless special assumptions are made about additivity. (Perhaps we should disregard this distinction because parametric statistical tests are also forced to make the assumption of additivity. However, the problem of higher-ordered interactions has yet to be dealt with in the literature of nonparametric methods.-^^
The nonparametric technique may involve much computation in reporting differences between various groups after the overall null hypothesis has been rejected if numerous groups are included in the experiment. The analysis has to be repeated with pairs of two unless only two groups are involved; therefore, there are n(n-l)/2 analyses to be conducted. °
Although many different types of nonparametric tests are avail
able, one specific test appears to be pertinent for the market grid
problem. This test is the Kruskal-Wallis one-way analysis of variance
•^^Siegel, op. cit., pp. 32-33,
^^Siegel, op. cit., p. 33.
36 Gaito, op. cit., p. 121.

72
by ranks. It assumes at least ordinal measurement and a continuous
37 distribution. The following quotation provides a brief description
of the test.
The Kruskal-Wallis test seems to be the most efficient of the nonparametric tests for k independent samples. It has a power-efficiency of 95.5 per cent, when compared with the F-test, tl>e most powerful parametric test.
This concept of power-efficiency is significant because the
sample size is fixed in this investigation. This means that the para
metric F-test has slightly more precision than the nonparametric test
if the assumptions underlying both types of tests are met. A power-
efficiency of 95.5 per cent for the Kruskal-Wallis test means that
in order to equate the power of the nonparametric Kruskal-Wallis test
to the parametric F-test (when all conditions for both tests are met)
one needs to draw 100 cases for the Kruskal-Wallis test and 95,5 cases
39
for the parametric F-test,
Since the data in the columns of the market grid matrices of
this study represent k independent samples, the Kruskal-Wallis test is
appropriate. The problem that a marketing manager faces is determining
if a significant difference exists among the colimin means of a market
grid matrix. Therefore, one can employ a one-way analysis of variance
test.
The following quotation summarizes the procedure for the
Kruskal-Wallis test.
37 Siegel, op. cit., p. 185.
^^Siegel, op. cit., p. 194.
39 Siegel, op. cit., p. 51.
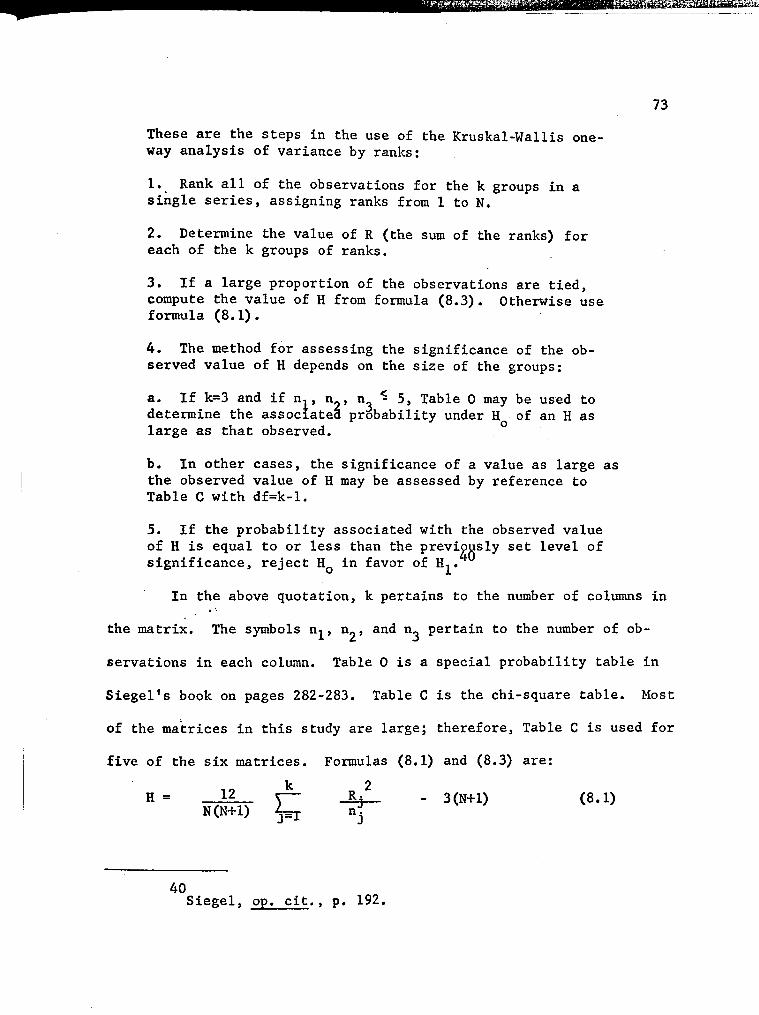
^mm^^m
73
These are the steps in the use of the Kruskal-Wallis oneway analysis of variance by ranks:
1. Rank all of the observations for the k groups in a single series, assigning ranks from 1 to N.
2. Determine the value of R (the sum of the ranks) for each of the k groups of ranks.
3. If a large proportion of the observations are tied, compute the value of H from formula (8,3). Otherwise use formula (8.1).
4. The method for assessing the significance of the observed value of H depends on the size of the groups:
a. If k=3 and if n,, n , n - 5, Table 0 may be used to determine the associated probability under H of an H as large as that observed,
b. In other cases, the significance of a value as large as the observed value of H may be assessed by reference to Table C with df=k-l.
5. If the probability associated with the observed value of H is equal to or less than the previously set level of significance, reject H in favor of H,.
In the above quotation, k pertains to the number of columns in
the matrix. The symbols n,, n^, and n_ pertain to the number of ob
servations in each column. Table 0 is a special probability table in
Siegel's book on pages 282-283. Table C is the chi-square table. Most
of the matrices in this study are large; therefore. Table C is used for
five of the six matrices. Formulas (8.1) and (8.3) are:
H = 12 N(N-H) S ^ 3(N-H) (8.1)
40 Siegel, op. cit., p. 192.

74
12 N(N-H)
H = j=l n
- 3(N-l-l)
(8.3)
N^ - N
P=.3 Where T=t -t (when t is the number of tied observations in a
tied group of scores),
N = number of observations in all k samples together, that is, N = Uny
Ri = sum of each column,
n. = number of observations in each column. 41
The Kruskal-Wallis test is illustrated below; the market grid
matrix (Table 2) that was employed for the parametric F-test is also
utilized for this test. One should disregard the row stubs of the
matrix since this is a one-way analysis of variance test with emphasis
on the demographic classification variables (columns).
41 Siegel, op. cit., pp. 187-188.

,gj?Vf-i w'^,>-^t.»tiiiSj£i^£^
75
TABLE 6
TYPES OF WASHING MACHINES IN STATE OF TEXAS HOUSEHOLDS, 1960, CROSS-CLASSIFIED BY EDUCATION OF HEAD (00's OF UNITS)
Type of Washing Machine
Wringer, Spinner
Automatic or Semi-Automatic
Washer-Dryer Combination
Total Mean
Source:
Less Than 8 Years
755
295
79
1129 376
People and Homes
Education 8-11
Years
1254
739
224
2217 739
of Head 12-15 Years
1547
1290
622
3459 1153
in the American Market,
16 Years Over
Texas,
515
628
482
1625 542
> XLII (Detroit: S. J. Tesauro & Co., 1961), p. 4.

76
The first step for this test is to rank all of the observations
for k groups. This step is completed in Table 7.
TABLE 7
RANKING OF k GROUPS FROM TABLE 6
Less Than 8 Years
Education of Head 8-11
Years 12-15 Years
16 Years Over
9
3
1
10
8
2
12
11
6
5
7
4
Rj 2 13 169
20 400
29 841
16 256
The second step, determining the value of R is also illustrated
in Table 7. Since there are no tied values, formula (8.1) is employed
to compute H. Before computing H, one should establish the null hypo
thesis and significance level of the test.
Ho: there is no difference among the column averages of
Table 6.
Hi: the averages of the columns in Table 6 are not the same.
The test is conducted at a=.05. Since k>3, the chi-square
table with df=k-l is used to test Ho.

77
j=i ""j
N = total number of observations (12).
n. = number of observations in each column (3).
H= -To^ r~ ra3)^(20)^-K29)^-K16^^ 12(13) C ' 3(13)
H = 12 |l69+400+841+256'l 156 L 3 J 3(13)
H = — i i j ioooi . 39 156 H]
„ _ 19,992 ^ ~ 4 6 r • ^^
H = 42.7 - 39
H = 3.7
The chi-square value for 3 degrees of freedom at a=.05 is 7.82.
The probability of an H value of 3.7, with 3 df is between .20 and .30
(chi-square table). Since this probability is greater than .05, Ho is
accepted.
It may be feasible to utilize either parametric or nonparametric
statistical tests to implement the market grid method of market segmen
tation. In the previous discussion the reader may have noted that the
t and F tests are extremely robust tests that may be used when all the
assumptions for parametric analysis of variance tests are not satis
fied.
Gaito's research- indicates that all statisticians are not in
agreement about the pertinent assumptions for parametric analysis of
variance tests. However, he did note that three assumptions were
78
common for most statisticians: (1) the errors must be independent,
(2) the variance of the different portions of the appropriate error
term must be normal in the treatment population, (3) the distribution
of the observations which are used as the appropriate error term must
be normal in the treatment population.
If the researcher feels that the aforementioned assumptions do
not underlie the data, then he has the alternative of using nonparametric
statistical tests. The Kruskal-Wallis test could be used to determine
if significant classification variables were in market grid matrices.
The researcher should compare the two types of tests to deter
mine which is best for the particular situation. Siegel recommends
that alternative statistical tests be compared on the following basis.
We have discussed the various criteria which should be considered in the choice of a statistical test for use in making a decision about a research hypothesis. These criteria are (a) the power of the test, (b) the applicability of the statistical model on which the test is based to the data of the research, (c) power-efficiency, and (d) the level of measurement achieved in the research. It has been stated that a parametric statistical test is most powerful when all the assumptions of its statistical model are met and when the variables under analysis are measured in at least an interval scale. However, even when all the parametric test's assumptions about the population and requirements about strength of measurement are satisfied, we know from the concept of power-efficiency that by increasing the sample size by an appropriate amount we can use a nonparametric test rather than the parametric one and yet retain the same power to reject Ho.
Because the power of any nonparametric test may be increased by simply increasing the size of N, and because behavioral scientists rarely achieve the sort of measurement which permits the meaningful use of parametric tests, nonparametric statistical tests deserve an increasingly
Gaito, op. cit., p. 116.

79
prominent role in research in the behavioral sciences. 43
The power of a test is defined as 1-type II error) or as 1-b.^^
(probability of a
The concept of power-efficiency is concerned with the amount of increase in sample size which is necessary to make test B as powerful as Test A. If test A is the most powerful known test of its type (when used with data which meet its conditions), and if test B is another test for the same research design which is just as powerful with Nb cases as is test A with Na cases, then power-efficiency of test B= (100) Na/Nb per cent.
For example, if test B requires a sample of N=25 cases to have the same power as test A has with N=20 cases, then test B has power-efficiency of (100)20/25 per cent, i.e., its power-efficiency is 80 per cent. A power-efficiency of 80 per cent means that in order to equate the power of test A and test B (when all the conditions of both tests are met, and when test A is the more powerful) we need to draw 10 cases for test B for every 8 cases drawn for test A.
Thus we can avoid having to meet some of the assumptions of the most powerful tests, the parametric tests, without losing power by simply choosing a different test and drawing a larger N.^^
The previous paragraphs illustrate some general comparisons be
tween general parametric and nonparametric tests. However, one should
be concerned about the comparison between the nonparametric Kruskal-
Wallis one-way analysis of variance test and the traditional para
metric F-test. The parametric F-test may be robust enough to use when
conducting tests of significance on the data in the market grid ma
trices of this study. The procedures that will be employed to deter
mine if the parametric F-test can be employed are: (1) determine the
feasibility of utilizing nonparametric tests, (2) conduct tests of
43 Siegel, op. cit., p. 31.
^Slalock, op. cit. , p. 50.
45 Siegel, op. cit., p. 51.
80
-significance with nonparametric tests (if it is feasible to employ
them), (3) conduct tests of significance employing parametric F-tests,
and (4) compare the results of the two types of tests to determine if
the parametric test can be utilized. Extensive comparisons between
the two types of tests are made in Chapter IV.

II
CHAPTER IV
EVALUATING THE FEASIBILITY OF UTILIZING STATISTICAL TESTS TO IMPLEMENT THE MARKET GRID
METHOD OF MARKET SEGMENTATION
Introduction
The essence of market segmentation as a marketing strategy is
identifying and reaching subgroups in a heterogeneous market with a
specific marketing mix.
Market segmentation as a strategy may be defined as the tailoring of the market mix components to the needs and wants of the selected subgroups within the overall market. Stated differently, the market segmentation approach assumes that consumers are different and that these differences may be utilized.
The focal point of this investigation is on evaluating statistical
techniques that can be used to identify subgroups in a heterogeneous
market. Market grids are used in this chapter in an attempt to illus
trate the capability of employing parametric and nonparametric statis
tical tests to locate significant or nonsignificant subgroups within
a particular market; reaching these subgroups with a specific market
ing mix is outside the scope of this study.
The market grid matrices in this chapter are constructed from
data pertaining to established products. In other words, the techniques
employed in this chapter are not applicable for new products.
^Johan Arndt, "New Directions in Market Segmentation," Insights Into Consumer Behavior, ed. Johan Arndt (Boston, Massachusetts: Allyn & Bacon, Inc., 1968), p. 67.
81

82
Obviously, purchase or consumption data would not be available for new
products about to enter the marketplace for the first time. It is sig
nificant to note that segmentation may be achieved from information
about the characteristics of purchasers or users of a product. The
following quotation exemplifies the importance of evaluating consumers
after the purchase is made.
. . . if the consumers of certain products or customers of certain businesses were to be analyzed and categorized after the fact, segmentation is expected to be more realistic. The users or consumers of certain products do have common characteristics; to the extent that these characteristics can be detected and measured segmentation is achieved.
Hence, identification of important characteristics of consumers within
a market could help a marketing manager develop better marketing
strategy. The development of marketing strategy has two essential ele
ments, defining the target market and developing a marketing mix to hit
the target market. This study evaluates the feasibility of defining
significant target markets when employing statistical tests. Before
these statistical techniques can be employed, market grid matrices have
to be fabricated.
In the field of marketing, one has little difficulty finding
classification variables to use in market grid matrices. In some cases,
difficulty arises because of the profusion of classification variables;
^A. Coskun Samli, "Segmentation and Carving A Niche in the Market Place," Journal of Retailing, XLIIII, No. 2 (Summer, 1968), p. 35.
^E. Jerome McCarthy, Basic Marketing, A Managerial Approach (3d ed.; Homewood, Illinois: Richard D. Irwin, Inc., 1965), p. 21.

83
the following quotation illustrates some of the classification vari
ables that are being used at the present time.
During the last decades, there has been an increased search for new market segmentation criteria which effectively predict product or brand choice or usage rates. Traditional criteria like age, education, occupation, sex, and marital status have not been sidelined, but have been joined by psychological and sociological variables such as attitudes, personality, mobility, life style, social class, etc,,^
Although numerous classification methods are available, the emphasis in
this chapter is upon some of the traditional demographic classification
criteria. At the present time, there is an abundance of secondary mar
keting data available to practicing marketing managers; a very large
portion of this data is based upon traditional demographic classifi
cations. Large quantities of data have been collected by governmental
agencies. Many business firms have access to data in their own cus
tomer account files. By taking a random probability sample of the data
in the customer account files one could possibly locate significant
characteristics of customers that could help in developing marketing
strategy. There are several interpretations of what is meant by sig
nificant market characteristics or significant segments of a market.
The following quotation defines a significant segment very well.
The most significant segments of the market are those segments in which most sales have concentrated.
^Arndt, op. cit., p. 68.
5jack Z. Sissors, "What Is A Market?," Journal of Marketing, XXX (July, 1966), p. 19.

84
The quantitative data in this chapter illustrates the number
of households in which certain types of washing machines are located.
It would be logical to assume that most of the machines located in the
households have been purchased. Therefore, these data would indicate
which segments have purchased the most units. It should also be noted
that the statistical tests illustrated in the chapter could be used for
dollar sales data as well as for other variables.
There are three essential objectives of the chapter: (1) to
review the basic assumptions underlying the specific nonparametric and
parametric statistical tests, (2) to make tests of significance on the
data in the market grid matrices (nonparametric and parametric tests of
significance), and (3) to evaluate the results obtained when using the
nonparametric and parametric tests and to determine if the tests give
similar results. Before making the aforementioned tests of signifi
cance, one should review the Census data that will be used in the mar
ket grid matrices in this chapter.
The quantitative data in the market grid matrices have been
taken from a special cross-tabulation of the 1960 Population and Housing
Census Data; the cross-tabulation was published by the S. J. Tesauro
Company. A quotation in the preface of the Texas cross-tabulation ref
erence provides some background information about the special cross-
tabulations.
These special cross-tabulations of the 1960 Population and Housing data, published by S. J. Tesauro and Company, represent an important milestone in the history of the U. S. Census Data. They constitute also an unprecedented opportunity for consumers of census statistics, including busi-
- ness, educational and research institutions, civic organizations, health and welfare groups, and various units of
^MMMrM^^m
85
local government. These data will for some years to come be an indispensable tool, especially to the businesses agencies and professions interested in marketing goods'and services to U. S. consumers.°
Some of the definitions in the special cross-tabulation are
pertinent to this investigation. A detailed description of the defi
nitions and a discussion of the sample design in the Tesauro project
is located in Appendix A.
The sample design is important to this investigation. A random
sampling procedure was used to acquire the data for the special cross-
tabulations compiled by the Tesauro Company. If data have been ac
quired by utilizing random probability sampling methods, there are at
least three reasons for differences between column means when making
tests of significance in market grid matrices; (1) random sampling
fluctuations, (2) invalid assumptions underlying tests of significance,
and (3) an identifiable cause for actual difference among the column
means of the matrices.
The quantitative data in the market grid matrices in this
chapter are "observational" type data. It is important to distinguish
between "observational" data and "experimental" data. A large portion
of the statistical literature illustrates the analysis of variance
statistical technique being used in conjunction with experimental data.
This is logical for analysis of variance has been used extensively in
the areas of agriculture, psychology, sociology and engineering.
-S. J. Tesauro, People and Homes in the American Market, Texas, XLII (Detroit: S. J. Tesauro & Company, 1961), Preface.
86
-Experimental research is conducted extensively in the aforementioned
fields. This is not to say that experimental tests can not be designed
in the field of business or marketing. Certainly experimental situa
tions can be fabricated; when they are, the researcher is working with
experimental type data. However, this is not the case when one is
working with Census data; when working with Census data, one is dealing
with "observational data". The following quotation illustrates the dif
ference between "experimental data" and "observational data".
In subsequent discussions it will be useful to distinguish between "experiments" and "investigations"--between "experimental data" and "observational data". An experiment usually involves the administration of treatments to groups that have been specially constituted by the experi-mentors for the purposes of the experiment, and the analysis of "effects" that have been produced or induced in the subjects during the course of the experiment. In contrast to this, we will, for the present purposes, define an "investigation" as a study in which observations are made of effects that are already present in a real population; an investigation is thus usually to be described as a sampling study or as a normative study. "Observational data" are defined as data collected in an investigation or a sampling study.
Many of the designs to be considered in this text may be applied to "observational" data as well as to "experimental" data, consideration will be given to applications of both types. The methods of analysis of variance appropriate with the simple-randomized design may be employed whenever one wishes to determine if the sub populations of a given population differ in the mean value of some criterion variable.
^E. F. Lindquist, Design and Analysis of Experiments in Psychology and Education (Boston, Massachusetts: Houghton Mifflin Co., 1953), p. 101.

87
Description of a Market Grid Matrix
At this point, one should look at an example of a market grid
matrix constructed from "observational data" from the 1960 Census of
Housing and Population. Table 8 is the result of cross-tabulations
by the S. J. Tesauro Company.
The quantitative data in the matrix are independent and repre
sent a one factor design. One can take a large random probability
sample from a population and break the sample down into sub samples
for different sub populations. The columns of the market grid matrix
represent sub populations of a larger population. Therefore, the data
in each column are independent of data in other columns of the matrix.
Each column actually represents a random sample from a different popu
lation. The following quotation from Lindquist illustrates a similar
situation.
The methods of analysis of variance appropriate with the simple-randomized design may be employed whenever one wishes to determine if the sub populations of a given population differ in the mean value of some criterion variable. Suppose, for example that one wishes to determine if persons of different religious affiliations differ in their mean response to a test of "cynicism". One might then select a random sample from each "religious affiliation" sub population, administer the test to the samples, and apply the method of analysis of variance to test the differences
• among the group means just as with a simple-randomized design. In this case, it matters little, so far as the tests of significance or the interpretations of results are concerned, what sizes of samples are drawn from the sub populations. One might select the same size sample from each sub population or draw the entire sample at random from the parent population and then divide the subjects into subgroups after the initial sample has been made, or follow still other procedures."
^Ibid.

Ii
88
One may notice that the matrix is cross-tabulated according to
demographic variables (in the columns) and types of washing machines
(in the rows). In this investigation, the primary concern is with iso
lating the significant (or non-significant) demographic variables in
the columns of the market grid matrix. However, a researcher would not
ignore the possibility of isolating significant or non-significant
product types in the rows of the matrix. In some cases, to illustrate
statistical techniques, the relationships between row means and the
grand mean will be analyzed in this study.
Table 8 illustrates the breakdown of a demographic classifi
cation variable. The demographic classification (number of persons in
household) is for the State of Texas in 1960; other market grid ma
trices in the chapter and Appendix C breaks the demographic classifi
cations (for the State of Texas, 1960) into the following categories:
(1) age of head of household, (2) household income, (3) education of
head of household, (4) occupation of head of household, and (5) race.
Market grid matrices (similar to Table 8) can be constructed from
special Census tabulations, random probability samples of company
records, or primary data. One of the keys to the construction of a
market grid matrix (similar to Table 8) is the application of sophisti
cated classification and cross-tabulation techniques. With the wide
application of computers, many business decision makers do have the
capability to construct market grid matrices and to use them when making
marketing decisions.
The example of the cross-tabulation of the Census data (Table
8) is representative of the types of market grid matrices utilized in

TABLE 8
AN EXAMPLE OF A MARKET GRID MATRIX
TYPES OF WASHING MACHINES IN STATE OF TEXAS, 1960, CROSS-CLASSIFIED BY NUMBER OF PERSONS
IN HOUSEHOLD (00's OF UNITS)
89
Type of Washing Machine
Wringer, Spinner
Automatic or Semi-Automatic
Washer-Dryer Combination
Source:
1
434
435
15
People
Number 2
1609
2574
112
and Homes
of
in
Persons 3
958
2565
100
the Amer
in Household 4
825
2937
95
Lean Market L^
5 more
1875
3205
104
Texas, XLII (Detroit: S. J. Tesauro & Co., 1961), p. 3.

90
this investigation. The matrices are similar to completely randomized
9
one factor designs. The data in the matrices are related to popula
tion parameters; this relationship is exemplified by the equation
10
Y^j - u -h a^ - e^y In essence, the equation indicates that any
sample result in the matrix is the effect of three additive factors:
(1) u, is the mean of the population, (2) a. is the effect or treatment
j. (3) &i^ is a random variable which is normally distributed. This
type of model assimies that all variates are fixed except for the error
term.
Basic Assumptions Underlying Parametric and Nonparametric Statistical Tests
The outcome of this investigation will be influenced by the
assumptions underlying the statistical tests conducted in this chapter.
In Chapter Three, it was emphasized that the assumptions underlying
general nonparametric tests were somewhat weaker than the assumptions
underlying parametric tests.
A nonparametric statistical test is a test whose model does not specify conditions about the parameters of the population from which the sample was drawn. Certain assumptions are associated with most nonparametric statistical tests; i.e., that the observations are independent and that
Jerome L. Myers, Fundamentals of Experimental Design (Boston: Allyn & Bacon, 1966), p. 54.
lOlbid.
11 Ibid.
•"• Seymour Banks, Experimentation in Marketing (New York, St. Louis, San Francisco, Toronto, London, Sydney: McGraw-Hill Book Co., 1965), p. 81.

91
the variable under study has underlying continuity, but these assumptions are fewer and much weaker than those associated with parametric tests.13
The investigator does not plan to test all the assumptions
underlying parametric and nonparametric statistical tests. Instead,
the basic assumptions underlying the Kruskal-Wallis nonparametric sta
tistical test will be evaluated when used in conjunction with quantita
tive data acquired from the 1960 Census of Housing and Population. If
the assumptions appear to be tenable, when used with the Census data in
the market grid matrices, nonparametric tests of significance will be
made; after making the nonparametric tests, parametric analysis of
variance tests will also be conducted on data in the same market grid
matrices. After making both types of tests, the results will be com
pared by employing the Fisher exact probability test. The results of
the Fisher test will enable the investigator to determine if analysis
of variance tests (parametric and nonparametric) give similar results
when used on the same market grid matrices to implement the market
grid method of market segmentation.
One should note that the primary objective in this investigation
is to ascertain the feasibility of utilizing statistical techniques to
implement the market grid method of market segmentation. If only the
nonparametric statistical test will function satisfactorily, when using
Census data in the market grid matrices, then these tests should be
used. On the other hand, if the parametric tests can also be used
^^sidney Siegel, Nonparametric Statistics for the Behavioral Sciences (New York, Toronto, London: McGraw-Hill Book Co., 1956), p. 31.
92
satisfactorily, then the investigator has a choice of which statistical
test to use. If neither test is satisfactory, then the statistical
tests can not be used to identify pertinent classification variables
in the market grid matrices. Thus, the market grid method of market
segmentation could not be implemented when using the aforementioned
statistical tests.
The research in Chapter Three indicates that the parametric
analysis of variance test is a very robust test. The investigator in
tends to test this robustness by comparing the results of parametric
tests with the results of nonparametric tests.
There are two basic assumptions underlying general nonpara
metric statistical tests. The two basic assumptions pertain to inde
pendence and continuity of the data involved in the test. The con
cept of independence is explained by Siegel in the following quotation.
The observations must be independent. That is, the selection of any one case from the population for inclusion in the sample must not bias the chances of any other case for inclusion, and the score which is assigned to the other case. -'
Another quotation from Blalock presents additional information about
the concept of independence when dealing with social research.
Reference is made to independent random samples. This means that samples must be selected independently from each other. The fact that a sample is random assures independence within the sample in the sense that knowledge of the score of the first individual selected does not help us predict the score of the second. This is not what is meant by the phrase "independent random samples". Not only must there be
l^Ibid.
^^Ibid.

II
93
independence within each sample (assured by randomness), but there must be independence between samples. For example, the samples cannot be matched, as might be the case in comparison between control and experimental groups. If the two sexes were being compared, one could not use the difference-of-means tests on samples composed of husband and wife pairs. This requirement that samples be independent of each other is extremely important but often overlooked in applied research. If one is comparing two subsamples drawn from a single larger random sample, this assumption of independence between subsamples will be met since all cases .in the total sample will have been selected independently of each other.1"
The quotation of Blalock's describes the concept of independence
in sample design. The data in the market grid matrices of this investi
gation are independent. The data represent sub samples taken from a
larger random sample of the 1960 Census of Housing and Population.
The following quotation emphasizes this concept of independence.
Usually in social research we draw a single larger sample although for purposes of analysis we may conceptualize the data as having come from several distinct and independent samples. In most instances the problem of independence between samples will not arise unless we have deliberately matched the samples or unless we have made use of a sampling design which does not yield random samples.
The following quotation reveals relevant information about the
sample design of the Census study from which the Tesauro Company com
piled the data that are found in the market grid matrices in this
chapter and the Appendix.
These tabulations are based on subsamples of the Census household sample. The Census sample was intended as a systematic sample of every fourth household within areas called enumeration districts. Within each of the enumeration
l%ubert M. Blalock, Social Statistics (New York, Toronto, London: McGraw-Hill Book Co., Inc., 1960), p. 170.
^^Ibid.
II
94
districts in the United States, the Census sampla was designated by a random start and rules prescribing a path of travel. There were two subsamples selected simultaneously from the 25 percent Census sample to give a 5 percent Census sample and a 20 percent Census sample. Different characteristics tabulated in this report were enumerated in each of these Census samples.^°
The other general assumption that should be met, before conduct
ing nonparametric tests, is that of continuity. How continuous a vari
able must be before it can be used in a nonparametric test is debatable.
The following quotation from Neter and Wasserman explains the difference
between a continuous and discrete variable.
Quantitative data are based either on counting or on other types of measuring. Where a set of separate and distinct physical objects exists, we can make a count and arrive at a measure in discrete units. For example, the count of files in a cabinet will yield measures such as 1,432 files, or 1,433 files, or 1,434 files, but will give no values other than integers. If there are no measurement errors in the count we can arrive at the correct total, though unfortunately measurement errors are frequently present in counting.
In other measurement procedures the resulting measure is a continuous variable (one that can take any value on the scale within some interval). With these procedures, limitations inherent in the measuring instruments always preclude us from obtaining the exact value of the characteristic being measured. For example, suppose that we weigh a bale of waste paper and find that it weighs 318 pounds, using a scale accurate to the nearest pound, implying that the correct weight of the bale is somewhere between 317.5 and 318.5 pounds.^^
The quantitative data in the market grid matrices in this chapter are
discrete data. The values have been rounded to hundreds of units.
•f Q
•^"Tesauro, op. cit.
^^John Neter and William Wasserman, Fundamental Statistics for Business and Economics (Boston: Allyn & Bacon, Inc., 1961), p. 58.
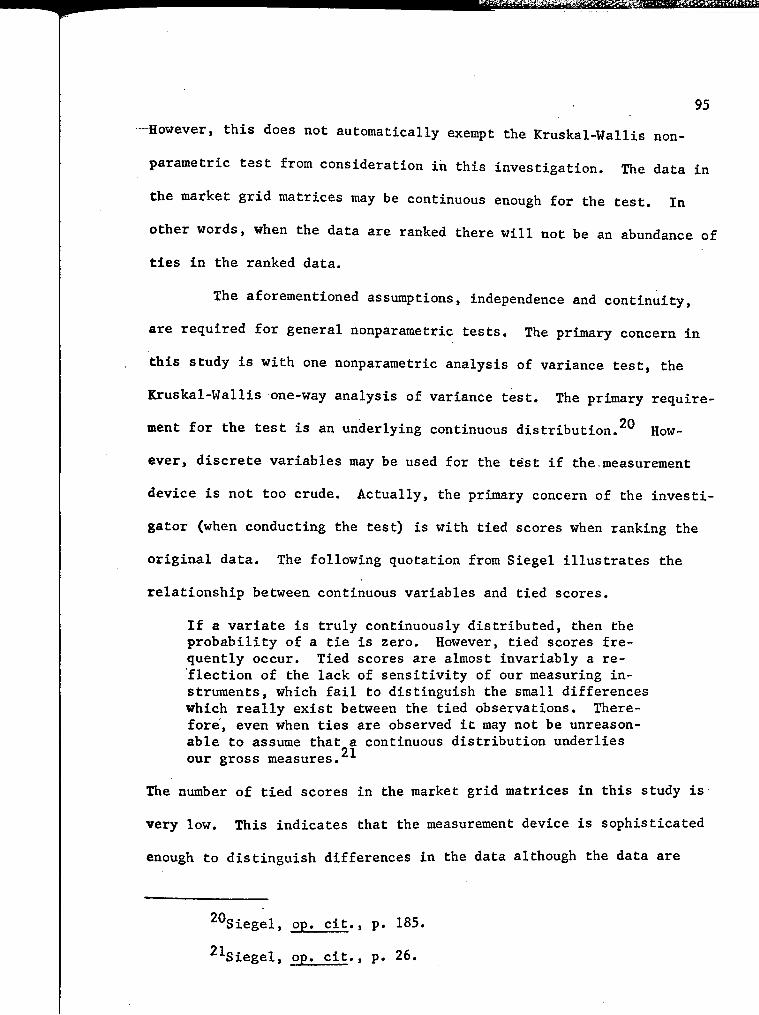
95
-However, this does not automatically exempt the Kruskal-Wallis non
parametric test from consideration in this investigation. The data in
the market grid matrices may be continuous enough for the test. In
other words, when the data are ranked there will not be an abundance of
ties in the ranked data.
The aforementioned assumptions, independence and continuity,
are required for general nonparametric tests. The primary concern in
this study is with one nonparametric analysis of variance test, the
Kruskal-Wallis one-way analysis of variance test. The primary require
ment for the test is an underlying continuous distribution.^ How
ever, discrete variables may be used for the test if the,measurement
device is not too crude. Actually, the primary concern of the investi
gator (when conducting the test) is with tied scores when ranking the
original data. The following quotation from Siegel illustrates the
relationship between continuous variables and tied scores.
If a variate is truly continuously distributed, then the probability of a tie is zero. However, tied scores frequently occur. Tied scores are almost invariably a reflection of the lack of sensitivity of our measuring instruments, which fail to distinguish the small differences which really exist between the tied observations. Therefore, even when ties are observed it may not be unreasonable to assume that a continuous distribution underlies
21 our gross measures.
The number of tied scores in the market grid matrices in this study is
very low. This indicates that the measurement device is sophisticated
enough to distinguish differences in the data although the data are
^^Siegel, op. cit., p. 185.
^^Siegel, op. cit., p. 26.
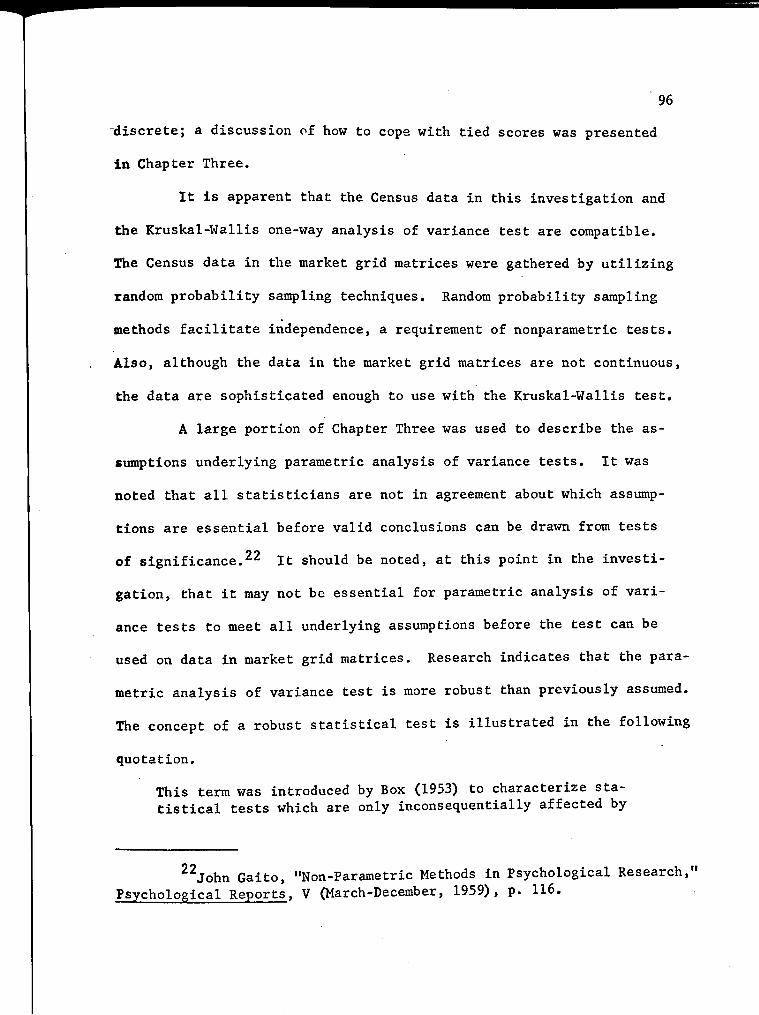
96
^discrete; a discussion of how to cope with tied scores was presented
in Chapter Three.
It is apparent that the Census data in this investigation and
the Kruskal-Wallis one-way analysis of variance test are compatible.
The Census data in the market grid matrices were gathered by utilizing
random probability sampling techniques. Random probability sampling
methods facilitate independence, a requirement of nonparametric tests.
Also, although the data in the market grid matrices are not continuous,
the data are sophisticated enough to use with the Kruskal-Wallis test.
A large portion of Chapter Three was used to describe the as
sumptions underlying parametric analysis of variance tests. It was
noted that all statisticians are not in agreement about which assump
tions are essential before valid conclusions can be drawn from tests
of significance.^2 It should be noted, at this point in the investi
gation, that it may not be essential for parametric analysis of vari
ance tests to meet all underlying assumptions before the test can be
used on data in market grid matrices. Research indicates that the para
metric analysis of variance test is more robust than previously assumed.
The concept of a robust statistical test is illustrated in the following
quotation.
This term was introduced by Box (1953) to characterize statistical tests which are only inconsequentially affected by
^^John Gaito, "Non-Parametric Methods in Psychological Research," Psychological Reports, V (March-December, 1959), p. 116.

"•
97
a violation of the underlying assumptions.^^
Apparently, the parametric analysis of variance test is a very
robust test. In other words, the test may be used when all of the as
sumptions underlying the test are not met.
The analysis of variance was originally developed to operate within a given set of assumptions. It has been found that it can be used satisfactorily in many situations where these assumptions do not quite fit.
The primary concern at this point of the investigation is to
determine if the parametric analysis of variance test can be used to
locate significant or nonsignificant columns in market grid matrices.
The robustness of the parametric statistical test will be tested by
comparing it to the nonparametric Kruskal-Wallis one-way analysis of
variance test.
The Kruskal-Wallis test is based upon weaker assumptions than
the parametric F-test. It is apparent that the assumptions underlying
the nonparametric test have been met in the Census data. It is not
apparent that the assumptions underlying the parametric F-test have
been met; the basic assumptions are random variables, homogeneity of
variance, additivity of effects, normally and independently distributed
experimental errors.^^ Therefore, the investigator will compare the
results of the Kruskal-Wallis tests, when conducted on the quantitative
^^C. Alan Boneau, "The Effects of Violations of Assumptions Underlying the t Test," Psychological Bulletin, LVII, No. 1 (January, 1960), pp. 61-62.
^"^Banks, op. cit., p. 77.
-'Banks, op. cit., p. 72.

«p
i
98
-data in the market grid matrices, with the results of the parametric
F-tests. The Fisher exact probability test will be used to ascertain
if there is a significant difference between the two types of tests
when used to make tests of significance on data in market grid matrices.
The primary concern of the investigator is to determine if the para
metric F-test can be used to implement the market grid method of market
segmentation. Whether all of the assumptions underlying the tests are
met is secondary to ascertaining the robustness of the test when used
with the type of market grid matrices found in this chapter and the
Appendix.
Statistical Tests Used in Conjunction With Data in Market Grid Matrices
There are five types of statistical tests employed in this
chapter. These tests are; (1) the nonparametric Kruskal-Wallis one
way analysis of variance test, (2) the parametric F-test, (3) Mann-
Whitney U test, (4) the Moroney test, (5) the Fisher exact probability
test. The chief concern is with the Kruskal-Wallis test and the
parametric F-test. These tests will be conducted on each of the mar
ket grid matrices to determine if there are any significant differ
ences in the coluimi means of the matrices. If significant differences
are found when using the Kruskal-Wallis test, the nonparametric Mann-
Whitney U test can be employed to determine which columns differ sig
nificantly in the matrix. If significant differences are found, when
using the parametric F-test, the Moroney technique can be used to lo
cate significant columns in market grid matrices. The results of the

'ii£iii^iSi^i*^i:^^Mmm¥'F-'r-''''^
TABLE 9
KRUSKAL-WALLIS TEST, TYPES OF WASHING MACHINES IN STATE OF TEXAS HOUSEHOLDS, 1960,
CROSS-CLASSIFIED BY NUMBER OF PERSONS IN HOUSEHOLD
(00's OF UNITS)
99
Type of Washing Machine
Number of Persons in Household
5 more
Wringer, Spinner 434 1609 958 825 1875
Automatic or Semi-Automatic 435 2574 2565 2937 3205
Washer-Dryer Combination 15 112 100 95 104
Total
Mean
884 4295 3623 3857
295 1432 1208 1286
5184 17,843
1728 1189.5
Grand Mean 17,843/15
Source: People and Homes in the American Market, Texas, XLII (Detroit: S. J. Tesauro & Co., 1961), p. 3,

100
-Mann-Whitney U test and the Moroney test will be compared when the
tests are employed to isolate significant columns in a market grid
matrix.
The first test is the Kruskal-Wallis one-way analysis of vari
ance test. Following the aforementioned test, is a parametric F-test
on the same market grid matrix. Table 9.
There are five basic steps involved in the Kruskal-Wallis one
way analysis of variance test.
1. Rank all of the observations for the k groups in a single series, assigning ranks from 1 to N.
2. Determine the value of R (the sum of the ranks) for each of the k groups of ranks.
3. If a large proportion of the observations are tied, compute the value of H from formula (8.3). Otherwise use formula (8.1).
4. The method for assessing the significance of the observed value of H depends on the size of the groups:
a. If k=3 and if n,, n-, n„ - 5, Table 0 may be used to determine the associated probability under H of an H as large as that observed.
b. In other cases, the significance of a value as large as the observed value of H may be assessed by reference to Table C with df=k-l.
5. If the probability associated with the observed value of H is equal to or less than the previously set level of significance, reject H^ in favor of Hj .
Table 10 illustrates the values in Table 9 after the values
have been ranked in each row from 1 to k and after the ranks have been
svmmed (R.).
^Siegel, op. cit., p. 192.

101
TABLE 10
RANKINGS OF DATA FOR THE KRUSKAL-WALLIS TEST, DATA FROM TABLE 9
(Rj)
(Rj)^
1
6
7
1
14
196
Number 2
10
13
5
28
784
of Persons in 3
9
12
3
24
576
Household 4
8
14
2
24-
576
5 more
11
15
4
30
900
The next step is to compute the value of H, The following
27 formula is used to make the computation.
H = 12 N(N-fl)
k
U j=l
Li n
3(N-H)
J
N = number of observations
Before computing H, one should state the null hypothesis and
establish the significance level for the test.
27 Siegel, op. cit., p. 187.
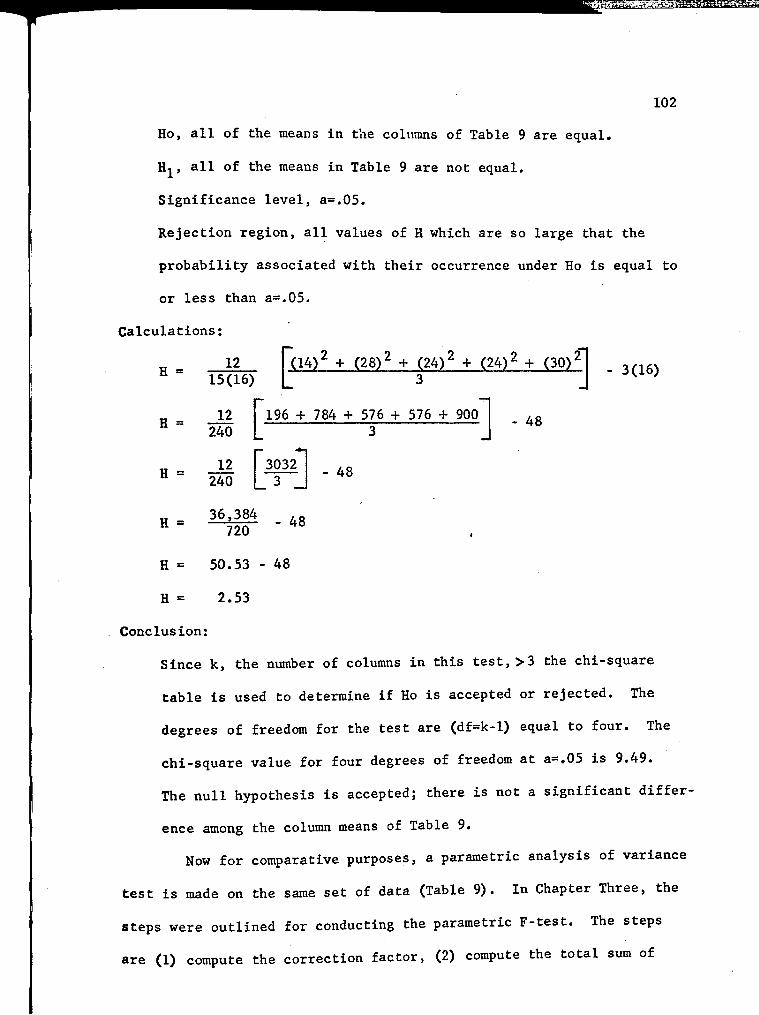
102
Ho, all of the means in the columns of Table 9 are equal.
Hi, all of the means in Table 9 are not equal.
Significance level, a=.05.
Rejection region, all values of H which are so large that the
probability associated with their occurrence under Ho is equal to
or less than a=.05.
Calculations:
12 H =
H =
H =
[(14)^ + (28)^ + (24)^ H- (24)^ + (30) *1 3 J 3(16)
n r 40 L
196 + 784 + 576 + 576 + 900 240
12 13032 I 240 L 3 J "
48
48
H = 36,384 g " 720
H = 50.53 - 48
H = 2.53
Conclusion:
Since k, the number of columns in this test, >3 the chi-square
table is used to determine if Ho is accepted or rejected. The
degrees of freedom for the test are (df=k-l) equal to four. The
chi-square value for four degrees of freedom at a=.05 is 9.49.
The null hypothesis is accepted; there is not a significant differ
ence among the column means of Table 9.
Now for comparative purposes, a parametric analysis of variance
test is made on the same set of data (Table 9). In Chapter Three, the
steps were outlined for conducting the parametric F-test. The steps
are (1) compute the correction factor, (2) compute the total sum of

103
squares for columns, and (3) compute the sum of squares for error.
The correction factor is determined by squaring the sum of the
X variables in Table 9 and then dividing the squared value by the number
of cells in the matrix.
C = (17,843)^/15
C = 318,372,649/15
C = 21,224,843
Next, the total sum of squares is computed for the matrix.
The total sum of squares for Table 9 is computed by squaring
each observation in the market grid matrix; next the squared values are
summed. The squared values are in Table 11. After the values have been
summed, the correction factor is deducted. The total sum of squares is
computed below:
TSS = 40,225,781 - 21,224,843
TSS = 19,000,938.
The sum of squares for columns is computed by squaring the total
of each column of Table 9, summing the squared values and dividing by
the number of observations in each column. The correction factor is
then deducted to obtain the final value.
SSC - (884)^ + (4295)^ -t- (3623)^ -t- (3857)' -f (5184)^ _ 21 224 843
3 ' '
SSC = 74,104,915 _ 21,224,843
SSC = 24,701,638 - 21,224,843
SSC = 3,476,795
After making these computations, the analyst is ready to com
pute residual or experimental error. This value is computed by deduct
ing column sum of squares from total sum of squares.
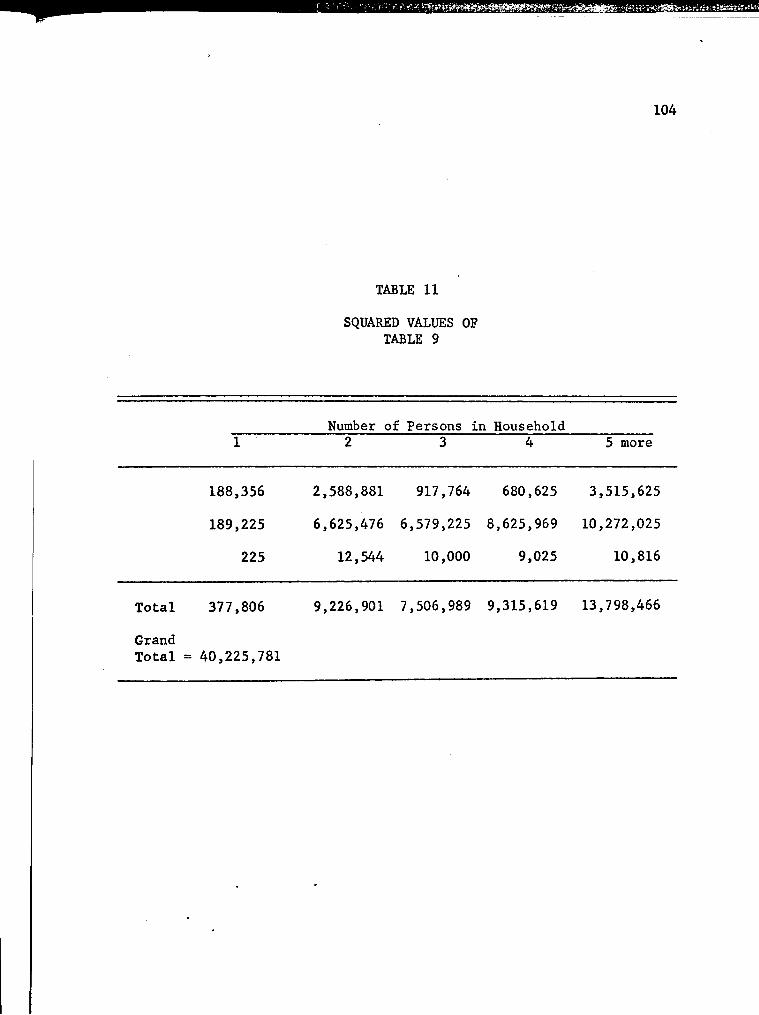
i. '^Mm¥!?i^:^m^^smf^m^i.
TABLE 11
SQUARED VALUES OF TABLE 9
Number of Persons in Household
104
5 more
188,356 2,588,881 917,764 680,625 3,515,625
189,225 6,625,476 6,579,225 8,625,969 10,272,025
225 12,544 10,000 9,025 10,816
Total 377,806 9,226,901 7,506,989 9,315,619 13,798,466
Grand Total = 40,225,781

^^^^^^•^^i^^^^^^H^^^^^^H^^^^^^^^^S^l^^^^S^^S?
105
Total Sum of Squares -^^ QQQ 930
Less ColuEMi Sum of Squares 3 475 795
Residual or Experimental Error I5 524 143
The next step is to construct a summary table. The table,
(Table 12) illustrates variance and the F ratio. The null hypothesis
(Ho) for the test is: the means of the columns of Table 9 are equal;
the alternative hypothesis (Hj ) is: the means of the columns are not
equal. The test is made at the .05 level of significance.
Table 12 reveals that one should accept the null hypothesis
(Ho) ; there is no difference among the mean values of the columns of
Table 9, In other words, none of the demographic variables differ sig
nificantly. It is significant to note that Ho was accepted when em
ploying both the nonparametric Kruskal-Wallis test and the parametric
F-test.
When Ho is accepted, there is no need to employ other tests to
isolate significant classification variables. However, to illustrate
the technique of isolating specific variables in a market grid matrix,
one can rotate Table 9 and conduct more tests to determine if a signifi
cant difference exists in the new matrix.

106
TABLE 12
SUMMARY TABLE FOR PARAMETRIC ANALYSIS OF VARIANCE TEST
FOR DATA IN TABLE 9
Source of Variation
Columns
Residual
Total
Sum of Squares
3,476,795
15,524,143
19,000,938
Degrees of Freedom
4
10
14
Mean Square
869,199
1,552,414
Computed F
.56
F.95
3.48
By rotating Table 9 and forming Table 13, one can use the non
parametric Kruskal-Wallis test to make a test of significance on the
column means. After the table has been rotated, Table 14 is con
structed for the Kruskal-Wallis test.
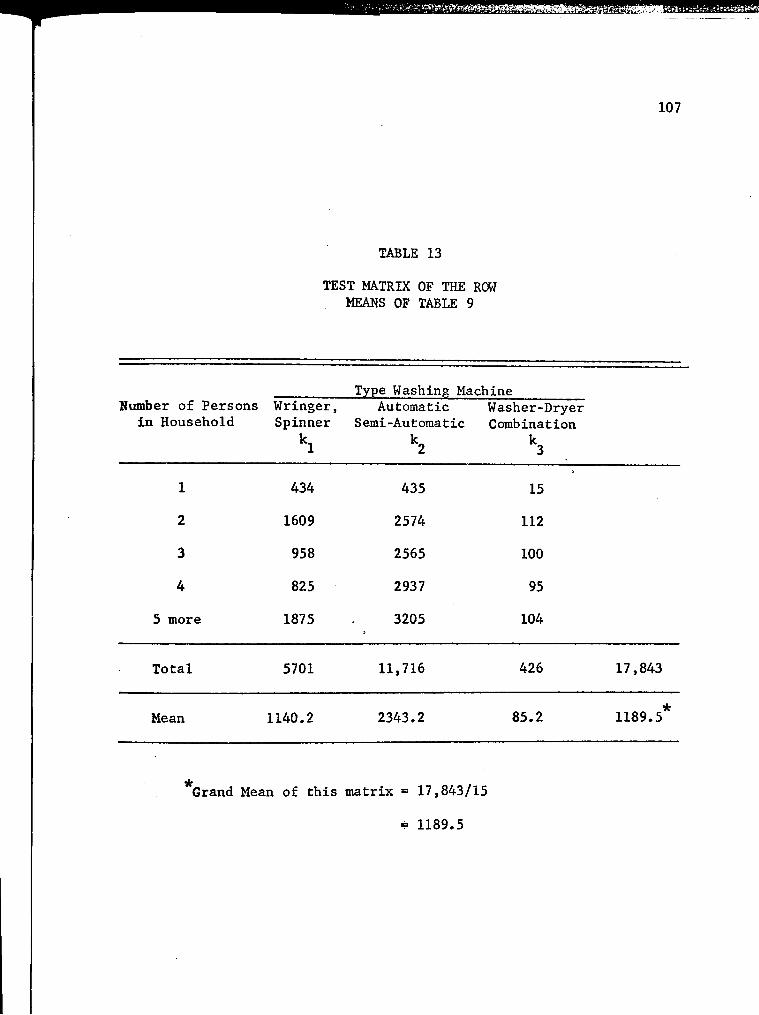
Mi ii. .. iimME.i ...Mmmmm
TABLE 13
TEST MATRIX OF THE ROW MEANS OF TABLE 9
107
Type Washing Machine Number of Persons Wringer, Automatic Washer-Dryer
in Household Spinner Semi-Automatic Combination
1 2 3
1
2
3
4
more
434
1609
958
825
1875
435
2574
2565
2937
3205
15
112
100
95
104
Total
Mean
5701
1140.2
11,716
2343.2
426
85.2
17,843
1189.5*
Grand Mean of this matrix = 17,843/15
= 1189.5

II •p.v^sm'f^^^miim^mmim^^
TABLE 14
RANKS OF DATA IN TABLE 13 FOR THE KRUSKAL-WALLIS ONE-WAY ANALYSIS
.. OF VARIANCE TEST
108
Number of Persons i n Household
Wringer, Spinner
Type Washing Machine Automatic Washer-Dryer
Semi-Automatic Combination
1
2
3
4
5 more
6
10
9
8
11
7
13
12
14
15
1
5
3
2
4
T o t a l (Rj)
(R l )^
44
1936
61
3721
15
225
Hypo thes i s : Ho, a l l the mean values in the columns of Table 13
a r e e q u a l ; Hj^, the mean values in the columns of Table 13 a r e no t
e q u a l ,
Significance level, a=.05
Computed H:
H = k 2
12 \— (R.) N(N+iy Z__ - T ^ ^ - - 3(N+1)
j = l "^j
H = T5W L rW)^(61)^M15)n . 3CX6) 3-1 ^

"i •
H = -21 r 1936 + 3721 + 225I 240 L 5 J
- 2 ^ M - ^ B
109
48
H - 5882 40 ^ - 100 " B
H = 58.82 - 48
H = 10.82
The reject chi-square value (which is appropriate for this test)
at 2 d. f. and a significance level of .05 is 5.99. The prob
ability of an H value as great as 10.82 is between .01 and .001.^^
Therefore, Ho is rejected and H, is accepted. There is a signifi
cant difference in the column means of Table 13.
Whenever a significant difference is found in the columns of a
market grid matrix, the next problem is to identify which columns are
deviating enough to cause the significant difference. The nonpara
metric Mann-Whitney U test can be employed to isolate the column (or
columns) that is (are) causing the significant difference. The follow
ing quotation provides some information about the Mann-Whitney U test.
This is one of the most powerful of the nonparametric tests, and it is a most useful alternative to the parametric t test when the researcher wishes to avoid the t test's assumptions.
The market grid matrix (Table 13) that has a significant dif
ference among the column means contains three columns. This necessi
tates three different tests (n(n-l)/2) to isolate the column(s) that is
^^iegel, op, cit,, p, 249.
^%iegel, op. cit., p. 116.

•^mm^^^m^s^^^rs^^'ms^s^^mi
110
(are) causing the significant result. 30
The steps to follow when making the Mann-Whitney U test are:
1. Determine the value of n-j and xij- n, = the number of cases in the smaller group; n2 = the number of cases in the larger group,
2. Rank together the scores for both groups, assigning the rank of 1 to the score which is algebraically lowest. Ranks range from 1 to N = nj -1- n2. Assign tied observations the average of the tied ranks.
3. Determine the value of U either by the counting method or by applying formula (6.7a) or (6.7b).
4. The method for determining the significance of the observed value of U depends on the size of n2:
a. If n2 is 8 or less, the exact probability associated with a value as small as the observed value of U is shown in Table J. For a two-tailed test, double the value of p shown in that table. If your observed U is not shown in Table J, it is U' and should be transformed to U by formula (6.6).
5. If the observed value of U has an associated probability equal to or less than a, reject Ho in favor of H,.31
The formulas mentioned in the quotation are illustrated below.
32 (6.6) U = n^ n2 - U'
(6.7a) U = ni n^ + "l("i+l) 2
(6.7b) U = n^ n^ -f °2^V^^
- R, 33
34
3^Gaito, op. cit., p. 121.
Siegel, op. cit., p. 126.
^^Siegel, op. cit., p. 120.
^^siegel, op. cit., p. 120.
' 'Siegel, op. cit., p. 120.

«v.^ajra5^.^iit-iafiiate»iiab.
Ill
Now it is time to locate the significant column (or columns)
in Table 13. First, the Mann-Whitney U test is conducted on columns k-^
and k2.
TABLE 15
MANN-WHITNEY U TEST ON kj , k OF TABLE 13
Column kj Values Rank Column k2 Values Rank
434
1609
958
825
1875
1
5
4
3
6
435
2574
2565
2937
3205
2
8
7
9
10
19 36
Null Hypothesis: Ho, the means of column kj and k2 are equal;
Hi , the mean of column k, is less than k .
Significance level, let a=.05; n^ = 5, n^ = 5.
Calculations:
1 2 _ R^
U = (5) (5) -f 5X61 _ 5 2
= 25 -f- 15 - 19
= 4 0 - 1 9
= 21 (This value is not in Table J of Siegel's book, therefore, it is U').

^ B
112
U = nj_ n2 - U'
= (5) (5) - 21
= 2 5 - 2 1
= 4
Conclusion:
When n^=5 and n =5, the probability of a U value of 4 is .048.^^
Since this is less than .05, Ho is rejected and H, is accepted.
The other two U tests are located in Appendix C. The results
of all three tests are shown in Table 16.
TABLE 16
PROBABILITIES OF THE MANN-WHITNEY U TESTS ON COLUMNS OF TABLE 13
k k k 1 2 3
k .048 .004 1 k2 .004
The columns that have significant deviations are columns k2
(automatic, semi-automatic) and k- (washer-dryer combination). This
outcome i s i l l u s t r a t e d in the following diagram.
35 Siegel , op, c i t , , p, 271,

"•
Pb = .048
Pb = .004
113
k (automatic, semi-automatic)
k (wringer, spinner) "\,^ 36 ^ ^Pb=,004
k (washer-dryer combination)'
The critical probability level for the three tests is ,05,
Therefore, when a test is conducted between two columns and the prob
ability is less than .05, Ho is rejected. There is a significant dif
ference between columns k, and k . In addition, there is a significant
difference between columns k and k . Table 16 illustrates that the
probabilities for the three tests are less than .05. The probability
for the test between k and k is .004; actually, the probability
should be smaller. The Mann-Whitney U test table does not contain
smaller probabilities.
The previous paragraphs illustrate a nonparametric statistical
technique that can be employed to isolate specific significant columns
in a market grid matrix. Although the data represented different types
of washing machines, the technique is applicable to demographic classi
fication variables in market grid matrices. Now that nonparametric
methods have been employed to determine that a significant difference
exists in a matrix and isolated the significant columns, the parametric
techniques will be evaluated.
The parametric F-test is also employed on the data in Table 13.
Since the steps for this test have been described, only the calculations
are illustrated. The test is made at the .05 level of significance.
•' The probability table does not contain smaller values.

114
The null-hypothesis (Ho) is that the means of the columns of Table 13
are equal; the alternative hypothesis (H,) is that the means of the
columns of Table 13 are not equal.
Correction factor:
C = ( r x ) ^ / N
= (17,843)^/15
= 21,224,843".
Total sum of squares:
The total sum of squares can be calculated from the data in
Table 11.
2
TSS = r x - c
= 40,225,781 - 21,224,843
= 19,000,938.
Column sum of squares:
SSC = (5701)^ + (11.716)^ + (426)^ _ 5
= 32.501.401 + 137.264,656 + 181,476 21 224 843 5
= 169,947,533 _ 21,224,843
= 33,989,507 - 21,224,843
= 12,764,664.
Residual sum of squares:
Total sum of squares 19,000,938
Less: Column sum of squares • • 12,764,664
Experimental error or residual 6,236,274

•^ism^iimmmmm^mi!3fSi^m^iisff'r=f^mm*^^^it'..Tii.i-&f
115
Summary Table:
TABLE 17
SUMMARY TABLE FOR PARAMETRIC ANALYSIS OF VARIANCE TEST FOR DATA IN TABLE 13
Source of Variation
Columns
Residual
Total
Sum of Squares
12,764,664
6,236,274
19,000,938
Degrees of Freedom
4
10
14
Mean Square
3,191,166
623,627
Computed F.95 F
5.1 3.48
Conclusion:
There i s a s ignif icant difference among the colirain means of
Table 13.
A process that can be used to isolate significant classification
variables in a market grid matrix where the parametric F-test is analyzed
is the Moroney test. For example. Table 17 illustrates a significant
difference between the column means of Table 13. By employing the
Moroney test, one can isolate the column (or columns) that is (are)
causing the significant difference.
There are six basic steps in the Moroney test: (1) compute the
grand mean for.the market grid matrix, (2) compute the mean for each
column in the market grid matrix, (3) compute the estimated standard
deviation of the universe, (4) compute the estimated standard error for

*»a«a«a^*i!aBiiasa9:'«»5*iftr!jjjitiiHi
116
the columns, (5) construct action limits, and (6) compare the column
means with the action limits.-" The data for making the Moroney test
are found in Tables 13 and 17. From Table 13, one can determine that
the grand mean of the matrix is 1189.5. Table 13 illustrates the
column means are 1140.2 (wringers and spinners), 2343.2 (automatic and
semi-automatic), 85.2 (washer and dryer combinations). The estimated
standard deviation is the square root of the residual mean square in
Table 17 (623,627); the square root of this value is 789.7. The esti
mated standard error for the rows of the matrix is computed by dividing
the square root of the number of cells in each column of Table 13
into the estimated standard deviation; 789.7 5 equals 353.17. Now
one has the information that is needed to construct the action limits.
Since the Moroney test is a two-tailed test, the action limits are
on both sides of the grand mean.
The action limits are set 1.65 standard errors from the grand
mean. This is equivalent to making a two-tailed test of significance
at a=.10 where .05 of the area of the total curve is cut off each end
of the curve. The action limits would be at 607.05 and 1771.95 (1189.5
^ 1.65 X 353). With these action limits, the means of the columns for
automatic and semi-automatic machines (2343.2) and washer-dryer combi
nations (85.2) differ significantly from the grand mean of 1189.5.
This informs the investigator that washer-dryer combinations were sig
nificantly low in the Texas market in 1960 and that automatic and
^''M. J. Moroney, Facts From Figures (3d ed.; Baltimore:
Penguin Books, 1965), pp. 389-395.

II
117
semi-automatic machines were significantly high. Both types of in-
fonnation are important to the marketing manager when he develops mar
keting strategy about the washing machine market. It is significant to
note that the automatic and semi-automatic column and the washer-dryer
combination coltmm were pinpointed as the significant columns by both
the Mann-Whitney U test and the Moroney test.
If the columns of Table 13 contained customer classification
variables instead of different types of washing machines, a marketing
manager could use the significant test results to isolate pertinent
customer characteristics. Once customer characteristics have been iso
lated for a specific product, a marketing manager should be able to de
sign a more effective marketing mix to hit the target market for the
product.
The Fisher Exact Probability Test
Twelve tests of significance were made on data in six market
grid matrices in this investigation (see Appendix B) . Six of the tests
are nonparametric Kruskal-Wallis tests and six tests are parametric
F-tests. The results of the tests are in Table 18. The assumptions
underlying the nonparametric Kruskal-Wallis tests are satisfied when
using the data in the market grid matrices. The assumptions underlying
the parametric F-test have not been tested; but the results of the F-
tests are compared with the nonparametric tests. The robustness of the
F-test is determined by comparing the results of the two types of
tests. The results of the two types of tests are presented in Table
18.
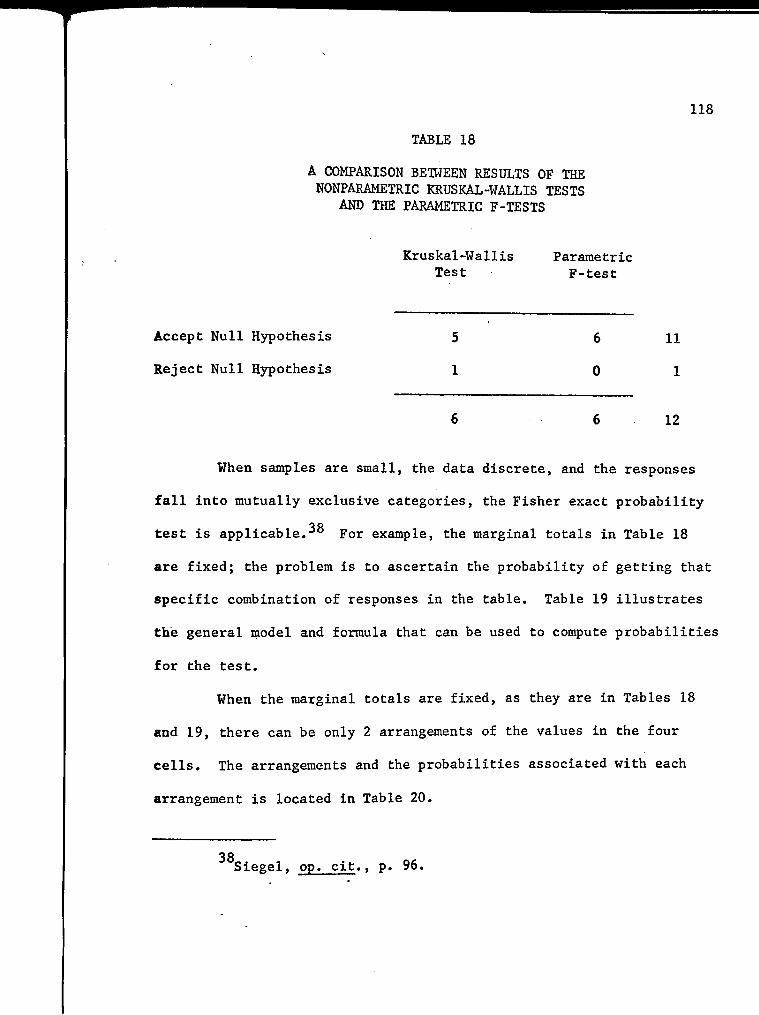
118
TABLE 18
A COMPARISON BETWEEN RESULTS OF THE NONPARAMETRIC KRUSKAL-WALLIS TESTS
AND THE PARAMETRIC F-TESTS
Kruskal-Wallis Parametric Test F-test
Accept Null Hypothesis 5 6 11
Reject Null Hypothesis 1 0 1
6 6 12
When samples are small, the data discrete, and the responses
fall into mutually exclusive categories, the Fisher exact probability
test is applicable.38 por example, the marginal totals in Table 18
are fixed; the problem is to ascertain the probability of getting that
specific combination of responses in the table. Table 19 illustrates
the general model and formula that can be used to compute probabilities
for the test.
When the marginal totals are fixed, as they are in Tables 18
and 19, there can be only 2 arrangements of the values in the four
cells. The arrangements and the probabilities associated with each
arrangement is located in Table 20.
38 Siegel, op. cit., p. 96.

TABLE 19
GENERAL MODEL FOR THE FISHER EXACT PROBABILITY TEST^^
119
Kruskal-Wallis Test
Parametric F-test
Reject Null Hypothesis
Accept Null Hypothesis
a
c
b
d
11
1
12
(a+h) I (cH-d) ! (a-)-c) I (b+d) ! N : a I b • c I d I
formula.
The probability of any one arrangement is given by this
TABLE 20
ARRANGEMENTS AND PROBABILITIES OF OUTCOMES WHEN MARGINAL TOTALS ARE FIXED
A. 516
iTo 11! 1! 6! 6! 121 51 61 II 01
.5
B. 615 Oil
111 1! 6! 6! 121 61 51 OJ II
Total
.5
TTo
^^J. Lev and H. M. Walker, Statistical Inference (New York:
Henry Holt & Co., Inc., 1953), p. 105.

B^^g?WgJa^s,>••^-^^,Vv:nag-rf^^aEao^^^J-'^.^•
120
"The probabilities for each arrangement were computed from the formula
in Table 19. The Fisher test is a two-tailed test set at the .05 level
of significance. The null-hypothesis (Ho) is: the proportion of null-
hypotheses accepted by the Kruskal-Wallis test and the parametric F-
test are the same; H, is: the proportion of null-hypotheses accepted
by the Kruskal-Wallis test and the parametric F-test are not the same.
In Table 20, arrangement A is identical to the actual outcome
of the tests in Table 18. The probability of such an outcome is ,5,
Since this probability is greater than ,025, the cutoff reject value
in each tail-end of the distribution, the null hypothesis is accepted.
The proportion of null hypotheses accepted by the Kruskal-Wallis test
and the parametric F-test are the same.

II
CHAPTER V
SUMMARY, CONCLUSIONS, AND RECOMMENDATIONS
The strategy of market segmentation is important to marketing
managers. Since 1955, marketing scholars have written several articles
about the subject. However, there is a noticeable void in the litera
ture about how one actually goes about segmenting a market. This study
has focused on evaluating statistical techniques that possibly could
be employed to segment markets. The statement of the problem, pro
cedures employed, findings, conclusions, and recommendations for the
investigation are outlined in the following paragraphs. A descriptive
methodology was employed in the investigation; secondary data were
used throughout the study.
Summary
The primary problem of this study pertains to evaluating sta
tistical tests that could possibly be employed to implement the market
grid method of market segmentation. Implementation of the market grid
method of market segmentation is achieved if statistical techniques
can be employed to identify statistically significant classification
variables in market grid matrices. Identification of significant clas
sification variables necessitates two operations: (1) determining if
there is a significant difference in a market grid matrix, (2) isolating
the specific c61umn(s) that is (are) causing the statistically signifi
cant result.
121

II
122
Chapter II focuses on the historical development of market
segmentation in the United States. The concept of backward market seg
mentation is achieved by: (1) categorizing consumers after they pur
chase a product, and (2) identifying common characteristics of the con
sumers. A practicing marketing manager could employ numerous classi
fication criteria in an attempt to identify common characteristics of
consumers. Once the marketing manager identifies common characteristics
of consumers, he should be able to initiate a more successful marketing
strategy. Demographic classification variables are employed in mar
ket grid matrices of this study in an attempt to identify common
characteristics of washing machine owners.
Chapter III reveals some statistical tests that possibly could
be used, when classification data are in market grid matrices, to iso
late common characteristics of consumers. The primary tests discussed
in the chapter are the nonparametric Kruskal-Wallis test and the para
metric F-test. The assumptions underlying the tests are also discussed
in detail. The two assumptions underlying employment of the Kruskal-
Wallis test are: (1) independence, and (2) continuity. The most
commonly required assumptions underlying the parametric F-test are:
(1) errors must be independent, (2) variance of the different portions
of the appropriate error term must be normal in the treatment popula
tion, and (3) the distribution of the observations which are used as the
appropriate error term must be normal in the treatment population.
In Chapter IV and Appendix B, the most important source of data
for the study (the 1960 Census of Housing and Population) is used for
tests of significance on market grid matrices. Six market grid matrices
123
with different demographic classifications, were constructed from the
data. The data were cross-tabulated by demographic characteristics of
owners and type of durable good owned (different types of washing ma
chines) . The demographic classifications of owners are: (1) number of
persons in household, (2) total income of household, (3) age of head
of household, (4) education of head of household, (5) race of head of
household, and (6) occupation of head of household. After constructing
the market grid matrices, the investigator evaluated the feasibility
of employing the nonparametric Kruskal-Wallis test to determine if sta
tistically significant demographic variables were in market grid ma
trices. The assumptions underlying the nonparametric Kruskal-Wallis
test were evaluated when determining if the test could be used in
conjunction with Census data in the matrices.
The Kruskal-Wallis test was employed to make tests of signifi
cance on data in market grid matrices. This is feasible because the
assumptions underlying the test (independence and continuity) are
compatible with data in the market grid matrices. The Kruskal-Wallis
test has the capability of indicating if a significant classification
variable exists in the columns of a market grid matrix. After the in
vestigator determines that a significant variable is present in a
market grid matrix, he can employ the nonparametric Mann-Whitney U
test to isolate the specific column(s) that is (are) causing the sig
nificant result. This enables the investigator to locate common char
acteristics of consumers of products and segment markets.
The parametric F-test was also utilized to make tests of sig
nificance on the data in market grid matrices. The test was employed
124
in Chapter IV to determine if statistically significant columns ex
isted in market grid matrices. After it was determined that signifi
cant differences were present in the columns of a market grid matrix,
the Moroney technique was employed to isolate specific significant
columns.
The compatability of data in the market grid matrices with the
assumptions underlying the parametric F-test was not evaluated in this
investigation; however, the robustness of the F-test was determined.
The robustness of the test was ascertained by comparing the results ob
tained when employing the F-tests to make tests of significance on
data in market grid matrices.
The Fisher exact probability test was employed to determine if
the results obtained when employing the nonparametric Kruskal-Wallis
test were in agreement with the results obtained when using the para
metric F-test. Agreement between the two types of tests depends upon
an equal proportion of null hypotheses being accepted (when tests were
made on data in market grid matrices) by each type of test. The
Fisher exact probability test was conducted as a two-tailed test at
the .05 level of significance.
There are two primary findings in this investigation; the first
finding pertains to employing the nonparametric Kruskal-Wallis and
Mann-Whitney U tests to isolate significant classification variables
in market grid matrices. The second finding pertains to the similarity
of results obtained when"utilizing the nonparametric Kruskal-Wallis
test and 'the parametric F-test to conduct tests of significance on
data in market grid matrices. These findings are outlined in the

125
following paragraphs.
Conclusions
This portion of the chapter contains conclusions that relate
to the hypotheses stated in Chapter I. Each hypothesis is evaluated
in terms of evidence cited in this investigation.
The first hypothesis is: It is feasible to utilize statistical
techniques to implement the market grid method of market segmentation.
The market grid method of market segmentation is achieved if statis
tical techniques can be used to identify significant classification
variables in market grid matrices. This hypothesis is accepted; in
Chapter IV the nonparametric Kruskal-Wallis test and the Mann-Whitney
U test are utilized to identify significant classification variables
in a market grid matrix. Also, the parametric F-test and the Moroney
technique are employed to identify significant classification vari
ables in a market grid matrix in Chapter IV.
The second hypothesis is: The Kruskal-Wallis one-way analysis
of variance test and the parametric F-test give the same results when
used to make tests of significance on data in market grid matrices.
This hypothesis is accepted; in Chapter IV the Fisher exact prob
ability test revealed that an equal proportion of null hypotheses were
accepted (when conducting tests on the market grid matrices) when em
ploying the nonparametric Kruskal-Wallis test and the parametric F-
test. Therefore, the parametric F-test is robust enough to use on mar
ket grid matrices similar to those in this investigation.

u
126
Recommendations
It is recommended that one use the concept of backward market
segmentation (the market grid method) and parametric statistical tech
niques to isolate significant customer classification variables in mar
ket grid matrices; assuming the data in the matrices have been gathered
by employing random probability sampling methods. Whether one employs
the parametric F-test or the nonparametric Kruskal-Wallis test to make
tests of significance on classification variables in market grid ma
trices, depends on several factors.
One can use the following criteria to determine which statis
tical test to use when testing research hypotheses: (a) the power of
the test, (b) the applicability of the statistical model on which the
test is based to the data of the research, (c) power-efficiency of
the test, and (d) the level of measurement achieved in the research.
The parametric F-test places first in two categories: (a) power of
the test, and (c) power-efficiency. The nonparametric Kruskal-Wallis
test would be as powerful as the parametric F-test if the sample size
in the market grid matrices could be increased slightly. However, the
data in the matrices of this investigation represent fixed sample
sizes. Therefore, the parametric test is more powerful and has greater
power-efficiency. The nonparametric test places first in category
(b) , the applicability of the statistical model on which the test is
based to the data of the research. This is the case because the non
parametric test has fewer and weaker assumptions. However, the Fisher
exact probability test indicated the parametric F-test was robust
•ai
127
enough to employ when making tests of significance of the data in mar
ket grid matrices. The level of measurement in the market grid ma
trices is adequate for both the parametric F-test and the nonparametric
Kruskal-Wallis test. So neither test has an advantage in this category.
On the basis of the aforementioned criteria, one should use
the parametric F-test to implement the market grid method of market
segmentation. The Moroney technique should be used in conjunction
with the F-test to isolate specific classification variables in market
grid matrices. When this is feasible, the market grid method of market
segmentation can be employed to segment markets.
This method of segmenting markets should benefit practicing
marketing managers. Generally, it should facilitate marketing
planning; specifically, it should help the marketing manager develop
a more effective marketing strategy. The two basic steps involved in
developing marketing strategy are; (1) selection of the target mar
ket, and (2) developing a marketing mix to satisfy the target market.
The aforementioned statistical techniques enable the marketing manager
to utilize classification variables to identify target markets. Once
target markets have been identified, the marketing, manager should be
able to develop a more effective marketing mix for target markets.

y¥IJiAg?IJ!riLtJt'^W.iP.WWWM»".'^'»'lH'.JJ!!!l'gWiHB^
BIBLIOGRAPHY
Books
Alderson, Wroe. Marketing Behavior and Executive Action. Homewood, Illinois: Richard D. Irwin, Inc., 1957.
Alderson, Wroe and Green, Paul E. Planning and Problem Solving in Marketing. Homewood, Illinois: Richard D. Irwin, Inc., 1964.
Alexander, Ralph S. and Berg, Thomas L. Dynamic Management in Marketing. Homewood, Illinois: Richard D. Irwin, Inc., 1967.
Anderson, R. L. and Bancroft, T. A. Statistical Theory in Research. New York: McGraw-Hill Book Co., 1952.
Banks, Seymour. Experimentation in Marketing. New York, St. Louis, San Francisco, Toronto, Sydney: McGraw-Hill Book Co., 1965.
Bartels, Robert. The Development of Marketing Thought. Homewood, Illinois: Richard D. Irwin, Inc., 1962.
Baumol, William J. Economic Theory and Operations Analysis. 2d ed. Englewood Cliffsj New Jersey: Prentice-Hall, Inc., 1965.
Bell, Martin L. Marketing Concepts and Strategy. Boston, New York, Atlanta, Geneva, Illinois, Dallas, Palo Alto: Houghton Mifflin Co., 1966.
Blalock, Hubert M. Social Statistics. New York, Toronto, London: McGraw-Hill Book Co., Inc., 1960.
Britt, St°euart Henderson and Boyd, Harper W. Marketing Management and Administrative Action. New York: McGraw-Hill Book Co., 1964.
Cochran, William G. and Cox, Gertrude M. Experimental Design. New York: John Wiley & Sons, Inc., 1957.
Cundiff, Edward W. and Still, Richard R. Basic Marketing. Englewood Cliffs, New Jersey: Prentice-Hall, Inc., 1964.
Converse, Paul D., Huegy, Harvey W., and Mitchell, Robert V. Elements of Marketing. 7th ed. Englewood Cliffs, New Jersey: Prentice-Hall, Inc., 1965.
128

129
-Day, Ralph L. (ed.) Marketing Models, Quantitative and Behavioral. Scranton, Pennsylvania: International Textbook Co., 1964.
Engel, James F., Wales, Hugh C., and Warshaw, Martin R, Promotional Strategy. Homewood, Illinois; Richard D. Irwin, Inc., 1967.
Federer, Walter T. Experimental Design. New York: The Macmillan Co.. 1955.
Frank, Ronald E. and Green, Paul E. Quantitative Methods in Marketing. Englewood Cliffs, New Jersey: Prentice-Hall, Inc., 1967.
Frank, Ronald E., Kuehn, Alfred A., and Massy, William F. Quantitative Techniques in Marketing Analysis. Homewood, Illinois: Richard D. Irwin, Inc., 1962.
Good, Carter V. and Scates, Douglas E. Methods of Research: Educational, Psychological, Sociological. New York: Appleton-Century-Crofts, Inc., 1954.
Holloway, Robert J. and Hancock, Robert S. Marketing In A Changing Environment. New York, London, Sydney; John Wiley & Sons, Inc., 1968.
Kelley, Eugene J. Marketing: Strategy and Functions. Englewood Cliffs, New Jersey: Prentice-Hall, Inc., 1965.
Kendall, M. G. The Advanced Theory of Statistics. 3d ed. London: Griffin, 1947.
Kotler, Philip. Marketing Management. Englewood Cliffs, New Jersey: Prentice-Hall, Inc., 1967.
Lazo, Hector and Corbin, Arnold. Management in Marketing. New York, Toronto, London: McGraw-Hill Book Co., Inc., 1961.
Lev, J. and Walker, H. M. Statistical Inference. New York: Henry Holt & Co., Inc., 1953.
Linden, Fabian (ed.) Expenditure Patterns of the American Family. New York: National Industrial Conference Board, 1965.
Lindquist, E. F. Design and Analysis of Experiments in Psychology and Education. Boston: Houghton Mifflin Co., 1953.
Matthews, John B., Jr. et al. Marketing, An Introductory Analysis. New York, San Francisco, Toronto, London: McGraw-Hill Book Co., 1964.
Mauser, Ferdinand F. Modern Marketing Management. New York: McGraw-Hill Book Co., 1961.

I • f i T ' ; - " ^ " ' ^ - ^ "
130
-McCarthy, E. Jerome. Basic Marketing, A Managerial Approach. 3d ed. Homewood, Illinois: Richard D. Irwin, Inc., 1965.
Mills, Fredrick C. Statistical Methods. 3d ed. New York, Chicago, San Francisco, Toronto: Holt, Rinehart, and Winston, 1955.
Moroney, M. J. Facts From Figures. 3d ed. Baltimore, Maryland: Penguin Books, 1965.
Myers, James H. and Reynolds, William H. Consumer Behavior and Marketing Management. Boston: Houghton Mifflin Co., 1967.
Myers, Jerome L. Fundamentals of Experimental Design. Boston: Allyn €e Bacon, 1966.
Neter, John and Wasserman, William. Fundamental Statistics for Business and Economics. Boston: Allyn & Bacon, Inc., 1961.
Oxenfeldt, Alfred R. Executive Action In Marketing. Belmont, California: Wadsworth Publishing Co., Inc., 1966.
Richmond, Samuel B. Statistical Analysis. 2d ed. New York: The Ronald Press Co., 1964.
Scheffe', Henry. The Analysis of Variance. Nev? York, London, Sydney: John Wiley & Sons, Inc., 1959.
Siegel, Sidney. Nonparametric Statistics for the Behavioral Sciences. New York, Toronto, London: McGraw-Hill Book Co., Inc., 1956.
Snedecor, G. W. Statistical Methods. 5th ed. Ames, Iowa: Iowa State College Press, 1956.
Stanton, William J. Fundamentals of Marketing. 2d ed. New York, St. Louis, San Francisco, Toronto, London, Sydney: McGraw-Hill Book Co., 1967.
Vaile, Roland S., Grether, E. T., and Cox, Reavis. Marketing in the American Economy. New York: The Ronald Press Co., 1952.
Webster's Seventh New Collegiate Dictionary. Springfield, Massachusetts; G. 6c C. Merriam Co., 1965.
Zober, Martin. Marketing Management. New York: John Wiley & Sons, Inc., 1964.

i^M'Hw^Bl^jgiqwpillBIIIBP^^
131
Articles and Periodicals
Anderson, N. H. "Scales and Statistics: Parametric and Nonparametric," Psychological Bulletin. LVIII (1961), pp. 305-316.
Andreasen, Alan R. "Geographic Mobility and Market Segmentation," Journal of Marketing Research. Ill (November, 1966), pp. 341-348.
Arndt, Johan. "New Directions in Market Segmentation," Insights Into Consumer Behavior, ed. Johan Arndt (Boston, Massachusetts: Allyn & Bacon, Inc., 1968), pp. 67-70.
Barnett, Norman L. "Beyond Market Segmentation," Harvard Business Review (January-February, 1969), pp. 152-166.
Bartlett, M. S, "The Use of Transformations," Biometrics, III (1947), pp. 39-52.
Bass, Frank M., Tigert, Douglas J., and Lonsdale, Ronald T. "Market Segmentation: Group Versus Individual Behavior," Journal of Marketing Research. V (August, 1968), pp, 264-270.
Boneau, C. Alan. "The Effects of Violations of Assumptions Underlying the t Test," Psychological Bulletin. LVII, No. 1 (January, 1960), pp. 49-64.
Bowman, Burton F., and McCormick, Frederick E. "Market Segmentation and Marketing Mixes," Journal of Marketing, XXV, No. 3 (January, 1961), pp. 25-29.
Brandt, Steven C. "Dissecting the Segmentation Syndrome," Journal of Marketing, XXX, No. 4 (October, 1966), pp. 22-27.
Cochran, W. G. "Analysis of Variance for Percentages Based on Unequal Numbers," Journal of the American Statistical Association, XXXVIII (1943), pp. 287-301.
Cochran, W. G. "Some Consequences When the Assumptions for the Analysis of Variance Are Not Satisfied," Biometrics, III, No. 1 (March, 1947), pp. 22-38.
Crissy, William J., and Kaplan, Robert M. "Matrix Models for Marketing Planning," Business Horizons (Summer, 1963), pp, 48-66,
Eisenhart, Churchill. "The Assumptions Underlying the Analysis of Variance," Biometrics, III (March, 1947), pp. 3-20.
o*n>;^^*^"?**pqn ^^W..}*Ji.jll'^9^»J^^I^J£S
132
Feldt, L. S., and Mahmov.d, M. W. "Power Function Charts for the Specification of Sample Size in Analysis of Variance," Psychometrika. XXIII (1958), pp. 201-210,
Frank, Ronald E. "Correlates of Buying Behavior for Grocery Products," Journal of Marketing, XXXI, No. 4 (October, 1967), pp. 48-53.
Friedman, Milton, "The Use of Ranks to Avoid the Assumption of Normality Implicit in the Analysis of Variance," Journal of the American Statistical Association, XXXII (March-December, 1937), pp. 675-701,
Friedman, Milton, "A Comparison of Alternative Tests of Significance for the Problem of M Rankings," Annals of Mathematical Statistics, XI (1940), pp. 86-92.
Gaito, John. "Non-Parametric Methods in Psychological Research," Psychological Reports, V (March-December, 1959), pp. 115-125.
Goldstein, Sidney. "The Aged Segment of the Market, 1950 and 1960," Journal of Marketing, XXXII, No. 2 (April, 1968), pp. 62-68.
Hartley, H. 0. "The Maximum F-Ratio As a Short-Cut Test for Heterogeneity of Variance," Biometrika, XXXVII (December, 1950), pp. 308-312.
Keith, Robert J. "The Marketing Revolution," Journal of Marketing, XXIV, No. 3 (January, 1960), pp. 34-42.
Kruskal, William H. "A Nonparametric Test for the Several Sample Problem," Annals of Mathematical Statistics, XXIII (1952), pp. 525-540.
Kruskal, William H., and Wallis, W. Allen. "Use of Ranks in One-Criterion Variance Analysis," Journal of the American Statistical Association, XLVII, No. 260 (December, 1952) , pp. 583-621.
Mainer, Robert, and Slater, Charles C. "Markets in Motion," Harvard Business Review, XLII, No. 3 (March-April, 1964), pp. 75-82.
Massy, William F., and Frank, Ronald E. "Short Term Price and Dealing Effects in Selected Market Segments," Journal of Marketing Research, II (May, 1965), pp. 171-185.
McGarry, Edmund D. "The Merchandising Function," Theory in Marketing, ed. Reavis Cox, Wroe Alderson, and Stanley J. Shapiro (2nd Series, Homewood, Illinois: Richard D. Irwin, Inc., 1964), pp. 233-246.

133
McKitterick, J. B. "What is the Marketing Management Concept?," Marketing Management and Administrative Action, ed. Steuart Henderson Britt and Harper W. Boyd, Jr. (revised ed.. New York, St. Louis, San Francisco, Toronto, London, Sydney: McGraw-Hill Book Co., 1968), pp. 9-13.
Morris, John. "Nonparametric Statistics on the Computer," Journal of Marketing Research, VI (February, 1969), pp. 86-92.
Myers, John G., and Nicosia, Francesco M. "On the Study of Consumer Typologies," Journal of Marketing Research. V (May, 1968), pp. 182-193.
Page, Ellis B. "Ordered Hypothesis for Multiple Treatments: A Significance Test for Linear Ranks," Journal of the American Statistical Association, LVIII (March, 1963), pp. 216-230.
Pearson, E. S. "The Analysis of Variance in Cases of Non-normal Variation," Biometrika, XXIII (1931), pp. 114-133.
pitman, E. J. G. "Significance Tests Which May Be Applied to Samples From Any Populations; III. The Analysis of Variance Test," Biometrika, XXVIIII (1939), pp. 322-335.
Reynolds, William H. "More Sense About Market Segmentation," Harvard Business Review, XLIII, No. 5 (September-October, 1965), pp. 107-114.
Roberts, Alan A. "Applying the Strategy of Market Segmentation," Marketing Management and Administrative Action, ed. Steuart Henderson Britt and Harper W. Boyd, Jr. (revised ed., New York, St. Louis, San Francisco, Toronto, London, Sydney; McGraw-Hill Book Co., 1968), pp. 178-187.
Samli, A. Coskun. "Segmentation and Carving A Niche in the Market Place," Journal of Retailing, XLIII, No. 2 (Summer, 1968), pp. 35-49.
Satterthwaite, F. E. "An Approximate Distribution of Estimates of Variance Components." Biometrics, II (1946), pp. 110-114.
Savage, I. Richard. "Bibliography of Nonparametric Statistics and Related Topics," Journal of the American Statistical Association, XLVIII (1953), pp. 844-906.
Savage, I. Richard. "Nonparametric Statistics," Journal of the American Statistical Association, LII, No. 279 (September, 1957), pp.
. 331-344.
Sawrey, W. L. "A Distinction Between Exact and Approximate Nonparametric Methods." Psychometrika, XXIII (1958), pp. 171-178.

'°™°'"'°'™^^"^* .'s»m-^i^emmmmmiMiite
134
Scheffe', Henry. "Statistical Inference in the Non-Parametric Case," Annals of Mathematical Statistics, XIV (1943), pp. 305-332.
Scheffe', Henry. "A Method for Judging All Contrasts in the Analysis of Variance," Biometrika, XL (1953), pp. 87-104.
Schwartz, Kenneth. "Fragmentation of the Mass Market," Modern Marketing Thought, ed. J. Howard Westing and Gerald Albaum (New York: The Macmillan Co., 1964), pp. 14-18.
Shaw, Arch W. "The Role of Marketing in Society," The Environment of Marketing Behavior, ed. Robert J. Holloway and Robert S. Hancock (New York, London, Sydney: John Wiley & Sons, Inc., 1964), pp. 5-9.
Sissors, Jack Z. "What Is A Market?," Journal of Marketing. XXX (July, 1966), pp. 17-21.
Smith, Wendell R. "Marketing Strategy: What Preparation Should Precede the Marketing Concept?," Printer's Ink (September 26, 1958), pp. 37-38.
Smith, Wendell R. "Product Differentiation and Market Segmentation As Alternative Marketing Strategies," Journal of Marketing, XXI, No. 1 (July, 1956), pp. 3-8.
Srivastava, A. B. L. "Effect of Non-normality on the Power of the Analysis of Variance Test," Biometrika, XLVI (1959), pp. 114-122.
Twedt, Dik W. "How Important to Marketing Strategy is the Heavy User," Journal of Marketing, XXVIII (January, 1964), pp. 71-72.
Wells, William D. "Backward Segmentation," Insights Into Consumer Behavior , ed. Johan Arndt (New York: Allyn & Bacon, 1968), pp. 85-100.
Wilson, K. V. "A Distribution-Free Test of Analysis of Variance Hypotheses," Psychological Bulletin, LIII (1956), pp. 96-101.
Yankelovich, Daniel. "New Criteria for Market Segmentation," Marketing Management and Administrative Action, ed. Steuart Henderson Britt and Harper W. Boyd, Jr. (revised ed.. New York, St. Louis, San Francisco, Toronto, London, Sydney: McGraw-Hill Book Co., 1968), pp. 188-199.
Reports
People and Homes in the American Market, Texas, XLII (Detroit: S. J. Tesauro & Company, 1961).

SHMBHBBIXdUyiSfi^ii
APPENDIX
A. Definitions and description of sampling procedures for the 1960
Census of Housing and Population.
B. Market grid matrices
C. Mann-Whitney U tests
135
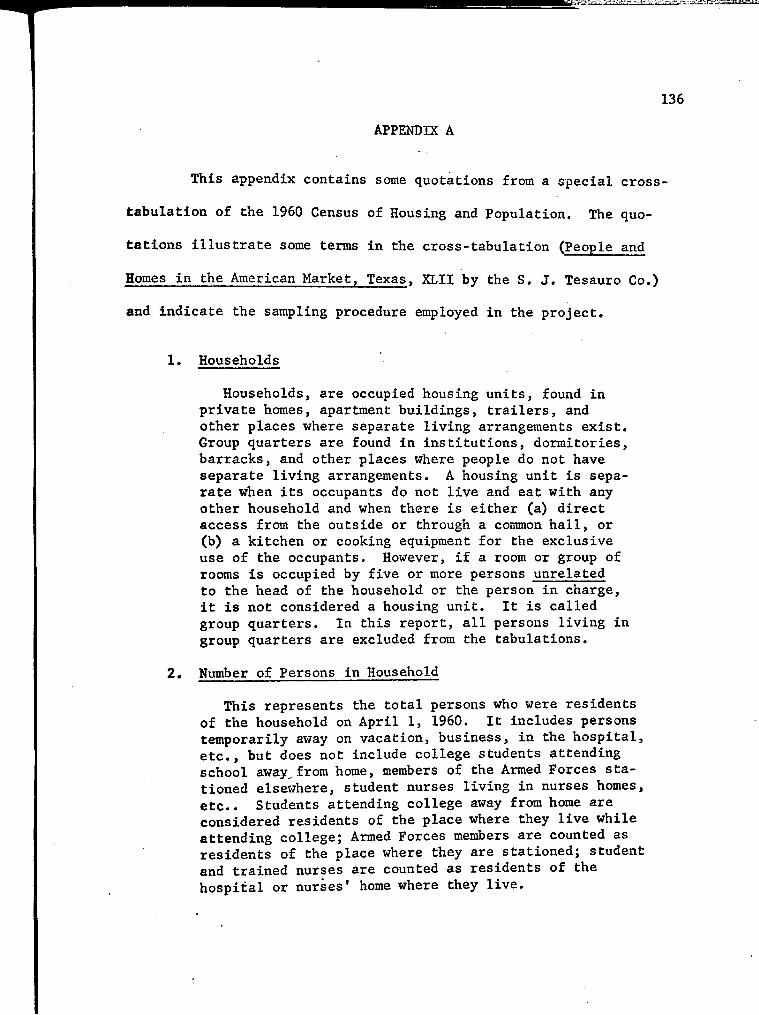
136
APPENDIX A
This appendix contains some quotations from a special cross-
tabulation of the 1960 Census of Housing and Population. The quo
tations illustrate some terms in the cross-tabulation (People and
Homes in the American Market, Texas. XLII by the S. J. Tesauro Co.)
and indicate the sampling procedure employed in the project.
1. Households
Households, are occupied housing units, found in private homes, apartment buildings, trailers, and other places where separate living arrangements exist. Group quarters are found in institutions, dormitories, barracks, and other places where people do not have separate living arrangements. A housing unit is separate when its occupants do not live and eat with any other household and when there is either (a) direct access from the outside or through a common hall, or (b) a kitchen or cooking equipment for the exclusive use of the occupants. However, if a room or group of rooms is occupied by five or more persons unrelated to the head of the household or the person in charge, it is not considered a housing unit. It is called group quarters. In this report, all persons living in group quarters are excluded from the tabulations.
2. Number of Persons in Household
This represents the total persons who were residents of the household on April 1, 1960. It includes persons temporarily away on vacation, business, in the hospital, etc., but does not include college students attending school away^from home, members of the Armed Forces stationed elsewhere, student nurses living in nurses homes, etc.. Students attending college away from home are considered residents of the place where they live while attending college; Armed Forces members are counted as residents of the place where they are stationed; student and trained nurses are counted as residents of the hospital or nurses' home where they live.

V •?r4?»^?s4t«B:i'rf*g!ai!S»S!3#«se ^MmJ^-^mn«m^mm
137
3. Age of Head
The age of the head is the age as of his last birthday on or before April 1, I960, The ages have been grouped so as to present the age detail in what we considered as the most significant categories for economic purposes,
4. Household Income
Household income represents the total monies received by all persons in the household 14 years of age or over. It consists of income from wages or salary; net income from one's own business, profession, or farm; fees for services; alimony payments, pensions, gifts, inheritances, welfare payments, unemployment insurance, etc..
5. Education of Head
The education of the head represents groupings of educational accomplishments, i,e,, the highest level of school which was completed. The four categories presented group, a) those household heads who never graduated from elementary school, b) those who graduated from elementary school but did not graduate from high school, c) those who graduated from high school but did not graduate from college, and d) those who graduated from college.
6. Occupation of Head
Although there are literally hundreds of different occupations, we have presented here only the 11 major groupings as used by the Bureau of the Census. The twelfth category, "Not in Labor Force and Not Reported," includes all household heads for whom no occupation was reported to the Census, the inexperienced unemployed, and those not in the labor force. The labor force consists, in general, of all persons v7ho, during a particular week, are either employed or unemployed. Persons are employed if they did any work for pay or profit or who worked without pay for fifteen hours or more in a family enterprise. Also included in the employed are those "with a job but not at work" who were temporarily absent from their job because of such reasons as bad weather, strikes, vacations, illness, or similar reasons. Unemployed persons are those who were not working but were looking for work. Information on the occupations of persons in the

T 138
labor force is restricted to those who have a job and those of the unemployed who have had previous job experience. These two groups are called "The Experienced Civilian Labor Force." Although the inexperienced unemployed fall into the "unemployed" category, they were included with the "Not in Labor Force and Not Reported" group because they would have no occupation to report.
Technical Explanations
7. Source of Data
The basic data used in this publication were collected in the 18th Decennial Census. The Bureau of the Census made these data available to the S. J. Tesauro Company in the form of special tabulations in a manner consistent with Section 9 of Title 13, United States Code. The Bureau of the Census, however, assumes no responsibility for the validity of the figures published, or for the interpretation or qualifications of the data.
8. Sample Design
These tabulations are based on subsamples of the Census household sample. The Census sample was intended as a systematic sample of every fourth household within areas called enumeration districts. Within each of the eninneration districts in the United States, the Census sample was designated by a random start and rules prescribing a path of travel. There were two subsamples selected simultaneously from the 25-percent Census sample to give a 5-percent Census sample and a 20-percent Census sample. Different characteristics tabulated in this report were enumerated in each of these Census samples.
All data in this publication are based on two 5-percent samples. One sample consists of the same households that were in the Census 5-percent sample; the other represents a subsample of 1 in 4 of the households in the 20-percent Census sample. One or the other of these two 5-percent samples was used to tabulate the data in this report.

T mmmmmwii^i/^i^^m'^-'-'^4^>.}^j&mMmmmmmMm
139
APPENDIX B
This appendix contains four market grid matrices. Two types
of statistical tests are conducted on data in the matrices; the tests
are the nonparametric Kruskal-Wallis test and the parametric F-test.
All tests are made at the .05 level of significance. Therefore, if the
probability of Ho is >.05, the null-hypothesis will be accepted; if
the probability of Ho is ,05, Ho will be rejected.
The null-hypothesis (Ho) for all tests is: the column means
for a given table are equal. The alternative hypothesis (H,) is:
there is a significant difference among the column means of a specific
table.
The chi-square table is used to determine if Ho is accepted
.or rejected for all tables except Table 23. The degrees of freedom
for the tests are df=k-l; where k pertains to the number of columns in
a specific table.
Another table is used to test the data in Table 23 because the
table contains 3 columns and n.., n , and n ^ 5. When this is the case,
a special table in Siegel's book must be used for the test.
Two additional market grid matrices are found in the body of
the study on pages 51, 75, and 99. The results of the tests on the
data in all market grid matrices are in the matrix below.
The following matrix summarizes the test results obtained when
employing the nonparametric Kruskal-Wallis test and the parametric F-
test to <;onduct tests of significance on the six market grid matrices
of this study.

140
Kruskal-Wallis Parametric Test F-test
Accept Ho 5 6 11
Reject Ho 1 0 1
6 6 12
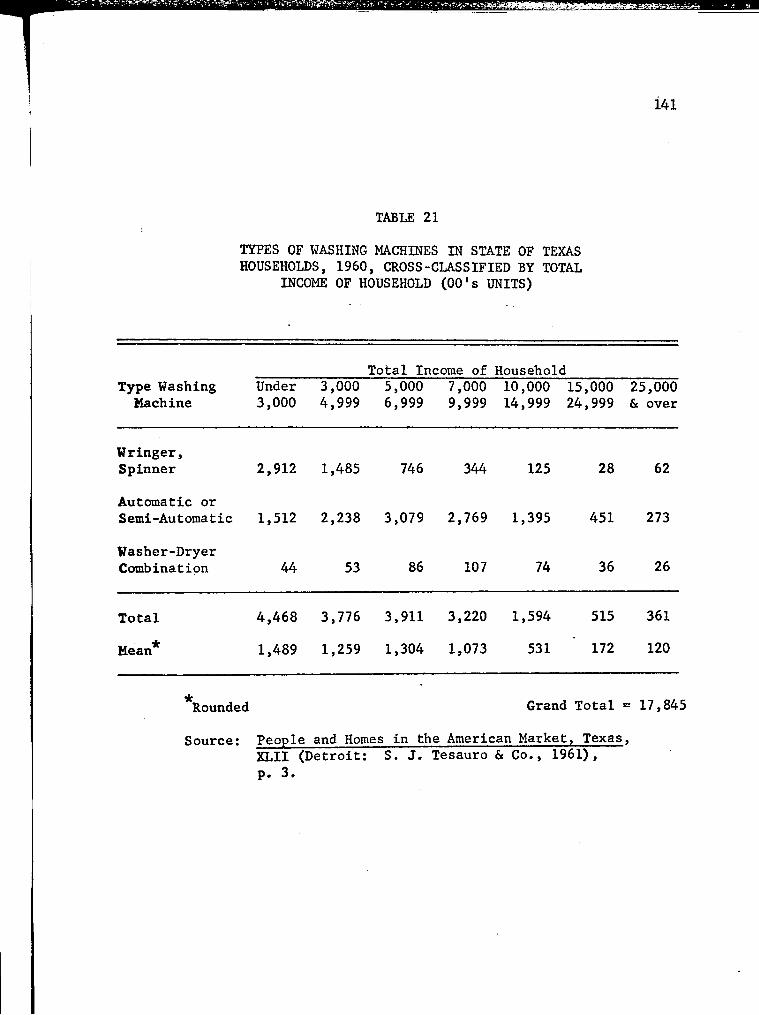
^ ^ ^
TABLE 21
TYPES OF WASHING MACHINES IN STATE OF TEXAS HOUSEHOLDS, 1960, CROSS-CLASSIFIED BY TOTAL
INCOME OF HOUSEHOLD (00's UNITS)
141
Total Income of Household Type Washing Under 3,000 5,000 7,000 10,000 15,000 25,000 Machine 3,000 4,999 6,999 9,999 14,999 24,999 & over
Wringer, Spinner
Automatic or Semi-Automatic
Washer-Dryer Combination
2,912 1,485 746 344 125
1,512 2,238 3,079 2,769 1,395
44 53 86 107 74
28 62
451 273
36 26
Total
Mean
4,468 3,776 3,911 3,220 1,594 515 361
1,489 1,259 1,304 1,073 531 172 120
Rounded Grand Total = 17,845
Source: People and Homes in the American Market, Texas, XLII (Detroit: S. J. Tesauro & Co., 1961), p. 3.

mmmmmii». -"^^^--•^^^/m^^mmtmif. ^mMm.-mj3M
142
A. Kruskal-Wallis Test
Ranks of Data in Table 21 for Kruskal-Wallis Test
Under 3,000 5,000 7,000 10,000 15,000 25,000 3,000 4,999 6,999 9,999 14,999 24,999 & over
20
17
4
16
18
5
14
21
8
12
19
9
10
15
7
2
13
3
6
11
1
41 39 43 40 32 18 18
1,681 1,521 1,849 1,600 1,024 324 324
1. H =
12 N(N+1)
k 2
z _ °j j=i
12 \l
1(22) L
12 r8.323"|
462 L 3 J
3(N-H)
1681 + 1521 -f 1849 - 1600 -f 1024 + 324 + 324 '] 3(22)
- 66
99.876 ,, = -1)386 - "
= 72.06 - 66
= 6.06
2. Conclusion: Accept Ho, there is not a significant difference among the column means of Table 21. The probability that H = 6.06 with 6 d.f. is between .50 and .30.

fmiiiftim^mfiTffimnwn*^g^'^—-^^ ; ;• ^IJ-t^-p-^^^^'.ff^^i-.
143
-B. Parametric F-test
Squared Values of Table 21
Under 3,000
3,000 4,999
5,000 6,999
7,000 9,999
10,000 14,999
15,000 24,999
25,000 6e over
8,479,744 2,205,225 556,516 118,336 15,625 784 3,844
2,286,144 5,008,644 9,480,241 7,667,361 1,946,025 203,401 74,529
1,936 2,809 7,396 11,449 5,476 1,296 676
10,767,824 7,216,678 10,044,153 7,797,146 1,967,126 205,481 79,049
Grand Total = 38,077,457
Correction Factor:
C = (17,845)^/21 •
= 318,444,025/21
= 15,164,001
Total Sum of Squares:
TSS = 38,077,457 - 15,164,001
= 22,913,456
Sum of Squares for Coluimis: _ (4468)2-K3776)^-K3911)^-K3220)2-Kl594)^-t-(515)2-K361)2
SSC - C
= 62,821,903/3 - 15,164,001
= 20,940,634 - 15,164,001
= 5,776,633

«iM.tint»-|trfmir,.r^a:,-.»r:4A-iiaij?'sy>yjii.ta.jA^> ^J^r.f;jc«3|MaiHi?jggs-u.fg,.-^-:.-:;i-^-r---,-;?a-^a^
144
Residual Sum of Squares:
TSS 22,913,456
Less SSC 5.776,633
Total 17,136,823
Summary Table:
Source of Variation
Columns
Residual
Totals
Sum of Squares
5,776,633
17,136,823
22,913,456
Degrees of Freedom
6
14
20
Mean Square
962,772
1,224,059
F F.95
.79 2.85
6. Conclusion: Accept Ho, there is not a significant difference among the column means of Table 21.

''^''^'"'"•''^'''•'"^Wtiflitl^^
TABLE 22
TYPES OF WASHING MACHINES IN STATE OF TEXAS HOUSEHOLDS, 1960, CROSS-CLASSIFIED BY AGE
OF HEAD OF HOUSEHOLD (00's UNITS)
145
Type Washing Machine
Age of Head of Household Under 25 25-34 35-44 45-54 55-64 65 over
Wringer, Spinner
Automatic or Semi-Automatic
Washer-Dryer Combination
188
521
14
3,064 3,414 2,436 1,411
100 120 99 58
824 1,105 1,298 1,131 1,154
871
36
Total
Mean
723 3,988 4,639 3,833 2,600 2,061
241 1,329 1,546 1,278 867 687
Rounded Grand Total = 17,844
Source: People and Homes in the American Market, Texas, XLII (Detroit: S. J. Tesauro & Co., 1961), p. 4.

'^^^BM5f»*S«*5:g«i'?
0
A. Kruskal-Wallis Test
Ranks of Data in Table 22 for Kruskal-Wallis Test
146
Under 25 25-34 35-44 45-54 55-64 65 over
7
8
1
16
256
9
17
5
31
961
11
18
6
35
1,225
14
16
4
34
1,156
12
15
3
30
900
13
10
2
25
625 R.
1. H=
12 N(N+1)
j = i 3(N-i-l)
12 r256 + 961 + 1225 + 1156 + 900 + 625"| 18(19) L 3 J - 3(19)
12 r5123"|
42 L3 J 342
61,476 1,026
57
- 57
= 59.9 - 57
= 2.9
Conclusion: Accept Ho, there is not a significant difference among the column means of Table 22. The probability that H equals 2.9 with 5 d.f. is approximately .70.

mmms.f.,^n,n,i-,„- I'nmrmfiwmn^-if-miffnmmVWammnmmM^r^^^^^^^^^ ' "•.':>:JSSf..-igar.fa-s;a-55S?aiSl--
147
B. Parametric F-test
Squared Values of Table 22
Under 25 25-34 35-44 45-54 55-64 65 over
35,344 678,976 1,221,025 1,684,804 1,279,161 1,331,716
271,441 9,388,096 11,655,396 5,934,096 1,990,921 758,641
196 10,000 14,400 9,801 3,364 1,296
Total 306,981 10,077,072 12,890,821 7,628,701 3,273,446 2,091,653
Grand Total = 36,268,674
1. Correction Factor:
C = (17,844)2/18
= 318,408,336/18
= 17,689,352
2. Total Sum of Squares:
TSS = 36,268,674 - 17,689,352
= 18,579,322
3. Sum of Squares for Columns:
_ (723) 2-K3988) 2-K4639) 2-K3833) 2-K2600) 2-K2061) _
= 63,646,804 _ 17,639,352
= 21,215,601 - 17,689,352
= 3,526,249

....,^>^,^-^.».>,^,,..>..:.....^-^.^c^»»»,».|g,^|^,p.aaa«c^ ,t;fAJt;-,--_<.:L-:i--.^^::j .J .jjSiIg^L-.-..:c zr^ i"'i7hiSifc"wni
148
4. Residual Sum of Squares:
TSS 18,579,322
Less SSC 3.526.249
Total 15,053,073
5. Summary Table
Source of Variation
Columns
Residual
Total
Sum of Squares
3,526,249
15,053,073
18,579,322
Degrees of Freedom
5
12
17
Mean Square
705,250
1,254,423
F
.56
F.95
3.11
6. Conclusion: Accept Ho, there is not a significant difference among the column means of Table 22.

149
TABLE 23
TYPES OF WASHING MACHINES IN STATE OF TEXAS HOUSEHOLDS, 1960, CROSS-CLASSIFIED BY RACE
OF HEAD (00's UNITS)
Type Washing Race of Head Machine White Negro Other
Wringer, Spinner 4,753 943 4
Automatic or Semi-Automatic 11,320 386 11
Washer-Dryer Combination 411 15 .4
Total 16,484 1,344 15.4
Mean* 5,495 448 5
*Rounded Grand Total = 17,843.4
Source: People and Homes in the American Market, Texas, XLII (Detroit: S. J. Tesauro & Co., 1961), p. 5.

sswW5«as»<s'^»wwewi«W5aj!3SE;
150
A. Kruskal-Wallis Test
Ranks of Data in Table 23 for Kruskal-Wallis Test
White Race of Head
Negro Other
8
9
6
7
5
4
2
3
1
R. J
23
529
16
256
6
36
1. H =
12 N(N+1)
12 9(10)
j=i
r529_+_
'± - 3(N-M)
j=l J
256 + 36 3- 3(10)
12 fsil] " 9 0 L 3 J 30
2.
9852 270
= 36.49 •
= 6.49
Conclusion:
- 30
30
Reject Ho, there is a significant difference among the column means of Table 23. The probability that H = 6.49 when k (columns) = 3 and when n^, n^^, ^^ -3 is .011. Since this probability is less than .05, Ho is rejected. (When k=3 and the number of cases in each of the three columns is - 5, the chi-square distribution does not provide accurate probabilities. Therefore, Table 0 on Page 282 of Siegel's book was employed for this test.)

r.i^^.ii.i...,..,:r^:^^::^.-^^,,.,.iXSS3ii,,M£^^-.^^^ '»1ia^t.figg^3^'5^g^;i;^a^^g^&a^-^-.,;is^^^
B. Parametric F-test
Squared Values of Table 23
151
White Negro Other
22,591,009
128,142,400
168,921
889,249
148,996
225
16
121
.16
Total 150,902,330 1,038,470 137.16
Grand Total = 151,940,937.16
1. Correction Factor:
C = (17,843.4)2/9
= 318,386,923.56/9
= 35,376,325
2. Total Sum of Squares:
TSS = 151,940,937 - 35,376,325
= il6,564,612
3. Columns Sum of Squares:
SSC = (16.484)2 + (1344)2 + (15.4)^
= 273,528,829.16/3 - 35,376,325
= 91,176,276 - 35,376,325
= 55,799,951
- C

mimM^^mem'^^mz^^m ^l^lfffftmi'mmmmm^^ • ..^~.^^.-/-,J••l.^•^. i-->V-^.-w^ •lilllMIJtf*-'"^"
152
4. Residual Sum of Squares:
TSS . . , 116,564,612
Less SSC 55,799,951
Total 60,764,661
5. Summary Table:
Source of Variation
Columns
Residual
Total
Sum of Squares
55,799,951
60,764,661
116,564.612
Degrees of Freedom
2
6
8
Mean Square
27,899,975
10,127,443
F F.95
2.76 5.14
6. Conclusion: Accept Ho, there is not a significant difference among the column means of Table 23.
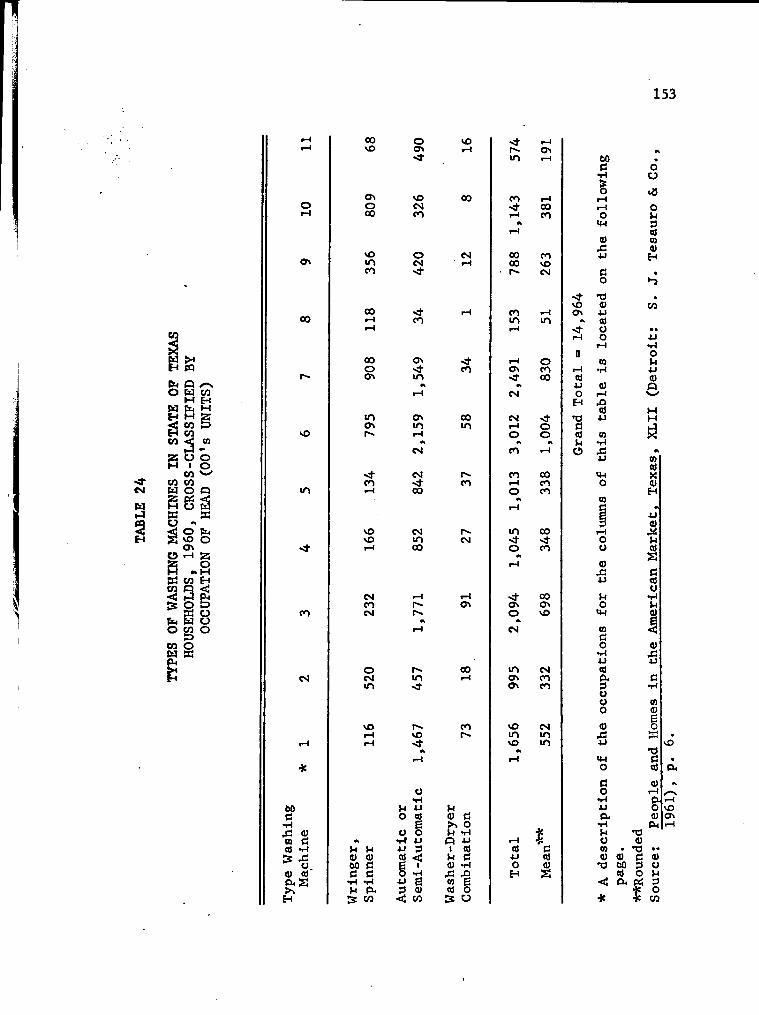
^
153
s^ CM
H i-:i
TAB
W •« H m r» a ^^ O W CO
M H
TATE
S
SIF
U
NI
to < CO
K O O M 1 O
CO '«-' CO CO
w o o 2: oi <c M O W W K tJ -^ O Pi4 g VO O
Cft C5 >-) K
5 .s W CO H
^9g S: O 5 W O fe W O O CO o
O CO O C4 S P4
Ov
00
vO
m
CO
CM
bO G
"H ,C n rt & 0)
0) c T «
J= U rt
O-S > H
00 VO
0^ O 00
vO m CO
00
00
o
m c
CO
vO vD
o ov S t
v O CM CO
o CM S t
S t CO
ON S t
c
CM
CM
CO
CM
m 00
VO
00
CM
CM CO CM
I - I
r r>.
o CM
VO
I-l U
00 c
^ CO
VO S t
u w o rt
4J P rt <: 6 •
S t CO
00
CO
CM
ov
00
CO
u >. o u
0) < ; CO
Q I
CO
rt
.u rt C
I o
S t
CO S t
ov
00 CO
00 CO 00 vO r^ CM
CO IT) m
I-l o ov CO S t 00
CM
CM
CO
CO
S t
o
St o o
00 CO CO
00 S t CO
S t vO ov
rt 4J o H
c u
S t 00 ON ov O vD
CM
i n ov ON
vO m VO
CM CO CO
CM m m
4J
o H
vi (U
s
00
c
o I H
0)
4J B O
rt o o
4J
O
o
O 1^
rt CO V H
CO
4J
o
(U
H H

F§^MS^^S^v^4^i^fe&£^^^a-^.^ae^^^
154
1. Prof. Technical and Kindred
2. Farmers and Farm Managers
3. Managers, Officials, Proprietors
" 4. Clerical and Kindred
5. Sales Workers
6. Craftsmen and Kindred
7. Operatives
8. Private Household Workers
9. Other Service Workers
10. Laborers
11. Armed Forces

r'"'-'- -' " '' ^ .2Ufi^]B£C jyffiiBB iaiif^Wi^r"i^jlV^V>^l^^•i:/ii^^i|Tt^^"^i'•^'^'-"'"^''-^
155
u o
S t CM W
OQ 0) 0) I-l H ,c rt w
* j I - l
to M-l 3
°s n
rt Pi
O
H
<d
1-1 «s
Ov
00
VO CM
O CM
m
CM
CO CM
ON CM
CO CM
m
m
vO
m
m CM
vO
CO 00
CO CO
CM
00 CM
CM CO
ON
vO
CO
CM S t CM
CM CM
o CO
m
CM
00 "T CO S t
S t
ON p^ o S t CM
St St
in CO CM
in 1 ^ vO
CM
vO CO ov
in CM
• CM in in m CM
v O in in
in
00 S t v O CM
v O
CM S t
m o
CM
I - ) o v O
CM
CO ON v O v O
ON
CO
o vO
vO
m
CM
vO CO
CO
CM
CO
I
Pi I B .4 U5
u tn «
u o
M-t • CM
W ^ B a rt 4J u 0)
5 CO Ci
o •A 4J
0) t
I •n
.Sd
4J 0) tn
o <w O T>
0) g) 1-1 CO 4J
rt M-i o o 0)
4)
•o .n to 2 3 C u n
4J HJ ^ / C M
I - l
3 4J I
C I CO o . ^
M-ICO CM IB
.n n B
vD

•:fI<SM*!»Wi^»«..r , -?«^-?-5*5.=^*-Tt^«^ -•'<-'''-^i'-* ' .^^::-\. '.• ..; n».pii.].ii .jujjtii^ . .11 w j U M P P ^ i ^ ^ n i f i p
•' "g.-imnf
H =
156
12 33(34)
12 1122
[lo^po-j _3(3^^
35,937 - 33
pO, 332.50]
35,904
108.14 - 102 1 - .000167
108.14 - 102 .999833
6.14 .999833
6.141
- 102
2. Conclusion: Accept Ho, there is not a significant difference among the column means of Table 24. The probability of H = 6.14 for 10 d.f. is approximately .80.

157
ON
00
St CM
, 0 rt H
o
« 3
r-l rt >
3
CO
vD
4J CO 0)
ID
I rt
rt
CO
St CM VO
St
I—1
00 St
54,
vO
736
126,
924
CO 1-1
464
824,
in CM 0
632,
956
1-1
556
CM
3,824
in
0 0 1-1
0 St CM
vO r-« CM
06,
1-1
400
176,
156
i-H
,401
,399,
CM
r-l 00 CM
661,
St
964
708,
904
m CM
6,441
CO
vO in CM
St vO
144
I-l
,156
I-l
St
,36
CO
,369
r-l
729
8,281
0 00 ON
St St CM r-l
CM 00 0 vO
r-*"
,280
303,
,081
m r-l
,021
,225
CO
0
vO
,296
in
,289
728
,189
St in r«-
98.546
1 r
St CM CO
t ^
rt
o H
CO
CM
400
M
0 r~« CM
vO
m St •« CO
r-l
849
•« 00 0 CM
c^ 00 0
M
CM in
324
CM CO
m
CM
CO
CO
m
ov r--St
r-00
O
CM

158
1. Correction Factor:
C = (14,964)2/33
= 223,921,296/33
= 6,785,494
2. Total Sum of Squares:
TSS = 17,177,324 - 6,785,494
= 10,391,830
3 . Sum of Squares for Columns;
-__ _ (1656)^+(995)2-^(2094)2-^(1045)2-^-(1013)2-^(3012)2-^(2491)2+
(153)2-K788)2-f(ll43)2-h(574)2 _ ^
= 2 I J | M 9 4 . 6,785.494
= 9,264,298 - 6,785,494
= 2,478,804
4. Residual Sum of Squares:
TSS 10,391,830
Less SSC 2,478,804
Total 7,913,026
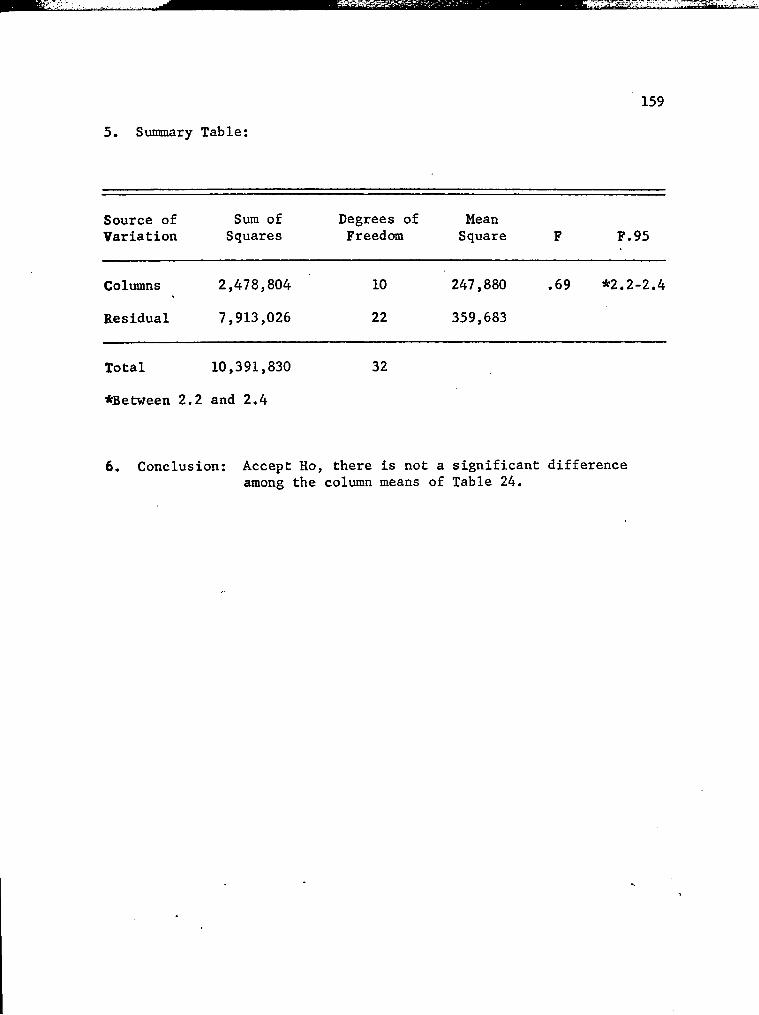
ruTfcrrMiiT 11'T i'lif
5. Summary Table:
159
Source of Variation
Sum of Squares
Degrees of Freedom
Mean Square F.95
Columns
Residual
2,478,804
7,913,026
10
22
247,880
359,683
,69 * 2 . 2 - 2 . 4
T o t a l 10,391,830
*Between 2 .2 and 2 .4
32
6. Conclusion: Accept Ho, there is not a significant difference among the colimm means of Table 24.
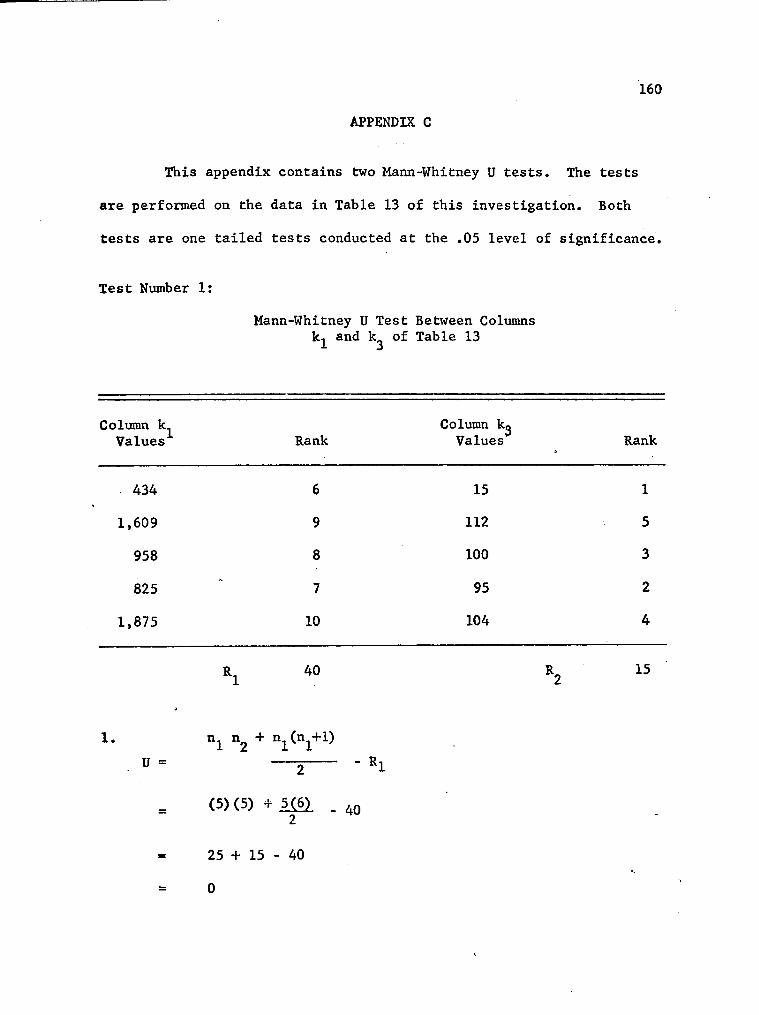
160
APPENDIX C
This appendix contains two Mann-Whitney U tests. The tests
are performed on the data in Table 13 of this investigation. Both
tests are one tailed tests conducted at the .05 level of significance.
Test Number 1:
Mann-Whitney U Test Between Columns kj and k of Table 13
Column k Values Rank
Column kg Values Rank
434
1,609
958
825
1,875
6
9
8
7
10
15
112
100
95
104
1
5
3
2
4
R, 40 R. 15
1.
U =
^l ^2 " ' i ' i+ )
- Ri
(5) (5) - 5([6i _ .Q 2
25 4- 15 - 40
0

161
2. Conclusion: The probability that U=0 when n, and n^ equal 5 is .004. Since this probability is less than .05, Ho is rejected. There is a significant difference between the means of k, and k in Table 13; the k mean is less than the k-, mean.
Test Number 2;
Mann-Whitney U Test Between Columns k and k of Table 13 2 3
Column k_ Values Rank
Coltamn k Values Rank
435
2,574
2,565
2,937
3,205
6
8
7
9
10
15
112
100
95
104
1
5
3
2
4
40 15
1. ttj^ n2 + n (n -H) U = = - R.
(5) (5) + 5(6). - 40
= 25-1-15-40
= 0
2. Conclusion: Th The probability that U=0 when n ar .004. Since this probability is U
and n. equal 5 is ess than .05, Ho is
rejected. There is a significant difference between the means of k2 and k, in Table 13; the k^ mean is less than the k2 mean.