Molecular dynamics simulations of the structural and dynamic properties of graphite-supported...
10
Molecular dynamics simulations of structural formation of a single polymer chain: Bond-orientational order and conformational defects Susumu Fujiwara and Tetsuya Sato Theory and Computer Simulation Center, National Institute for Fusion Science, Oroshi, Toki 509-52, Japan ~Received 21 January 1997; accepted 31 March 1997! The structural formation of a single polymer chain with 500 CH 2 groups is studied by the molecular dynamics simulations. Our simulations show that the bond-orientationally ordered structure at low temperatures is formed from a random-coil structure at high temperatures by a gradual stepwise cooling. From the radii of gyration and the bond-orientational order parameters, it is found that the anisotropy of a polymer chain also grows during the growth of the bond-orientational order. In the bond-orientationally ordered structure at low temperatures, 16 stems form a structure with deformed hexagonal symmetry and the stems in the outer layer have a tilted configuration. Furthermore, the gauche states are localized in the fold surface and the conformational states in the fold surface change more readily than those in the orientationally-ordered region. © 1997 American Institute of Physics. @S0021-9606~97!50126-7# I. INTRODUCTION Computer simulation of the structural formation of poly- mer chain systems has recently become the focus of attention in physics, chemistry and material science. Intensive studies of various model polymer systems, such as n-alkanes 1–8 and polyethylene chains, 9–15 have been made in order to under- stand the dynamics of the ordered or partially ordered poly- mer chain systems. Polymer chains show diverse static and dynamical struc- tures since they have many internal degrees of freedom, for example the rotational freedom about each C-C bond in the polyethylene molecule. Owing to their structural diversity, polymeric materials have various mechanical and thermody- namical properties. It is well known that solution-grown single crystals of polyethylene are usually very thin lamellae whose width and thickness are respectively several tens of m m and 10220 nm, and consist of folded chains. Polyeth- ylene chains are perpendicular to the fold surface. 18–20 Mac- roscopic properties of polyethylene single crystals have been studied by various experimental techniques: the molecular weight and the radius of gyration of the polymer chain can be obtained by the neutron scattering experiment and the lamellar thickness can be estimated by small angle x-ray scattering, electron spectroscopy and Raman scattering. 20 On the other hand, it seems very difficult to observe the struc- tural formation process of polymer chains, such as the crystal growth process, at the molecular level by the present experi- mental techniques. Computer simulation is one of the stron- gest tools for investigating the mechanisms of the structural formation at the molecular level. Over the last decade, several studies have been done in relation to the structural formation of polymer chain systems. Esselink et al. carried out molecular dynamics ~MD! simula- tions of nucleation and melting of n-alkanes in order to de- termine the crystallization and melting temperatures and compute the crystallization rate of a nucleus. 5 Yamamoto et al. performed Monte Carlo ~MC! simulations of the struc- ture and the molecular mobility at free surfaces and the crystal/melt interfaces of an n-alkane crystal on the basis of the rigid-chain assumption. 6,7 They also studied the dynam- ics of the conformational defects by MD simulations of a polyethylene chain confined in cylindrical potentials. 13 Noid et al. performed MD simulations on the motion of the con- formational defects in a polyethylene-like crystal. 9–12 Kavas- salis et al. carried out MD simulations of the folding process of a polyethylene chain below the equilibrium melting temperature. 14,15 Hikosaka et al. pointed out several impor- tant aspects of polymer crystallization: the existence of and the role played by a metastable phase and the high chain mobility associated with this phase. 16,17 The purpose of this paper is to clarify the mechanisms of the structural formation of polymer chains at the molecular level. In particular, our concern is to investigate the bond- orientational order and the conformational defects of poly- mer chains. With a view to investigating the process of the structural formation of polymer chains, we carry out the MD simulations of a single polymer chain and analyze the for- mation process of the orientationally ordered structure during cooling. Only few studies have so far been made at the tran- sition process from the random-coil structure to the bond- orientationally ordered structure. Although Kavassalis et al. performed MD simulations of the structural formation of a polyethylene chain with the initial rotational isomeric state distribution, the bond-orientational order and the conforma- tional defects were not analyzed. 14 In this study the effect of the interchain interaction is neglected. In order to take the effect of the interchain inter- action into account, the MD simulations of many polymer chains will be carried out in the near future. This paper is organized as follows. In Sec. II we describe in detail our simulation model and method. Our results ob- tained by MD simulations are presented in Sec. III. In Sec. IV a summary and a discussion are given. 613 J. Chem. Phys. 107 (2), 8 July 1997 0021-9606/97/107(2)/613/10/$10.00 © 1997 American Institute of Physics Downloaded¬04¬Apr¬2001¬to¬133.75.88.29.¬Redistribution¬subject¬to¬AIP¬copyright,¬see¬http://ojps.aip.org/jcpo/jcpcr.jsp
-
Upload
independent -
Category
Documents
-
view
0 -
download
0
Transcript of Molecular dynamics simulations of the structural and dynamic properties of graphite-supported...

Molecular dynamics simulations of structural formation of a single polymerchain: Bond-orientational order and conformational defects
Susumu Fujiwara and Tetsuya SatoTheory and Computer Simulation Center, National Institute for Fusion Science, Oroshi, Toki 509-52, Japan
~Received 21 January 1997; accepted 31 March 1997!
The structural formation of a single polymer chain with 500 CH2 groups is studied by the moleculardynamics simulations. Our simulations show that the bond-orientationally ordered structure at lowtemperatures is formed from a random-coil structure at high temperatures by a gradual stepwisecooling. From the radii of gyration and the bond-orientational order parameters, it is found that theanisotropy of a polymer chain also grows during the growth of the bond-orientational order. In thebond-orientationally ordered structure at low temperatures, 16 stems form a structure with deformedhexagonal symmetry and the stems in the outer layer have a tilted configuration. Furthermore, thegauchestates are localized in the fold surface and the conformational states in the fold surfacechange more readily than those in the orientationally-ordered region. ©1997 American Instituteof Physics.@S0021-9606~97!50126-7#
y-tidi
r-ly
u, fthtydnlash-
eeulathra
ucst-our
es
-n
thef-a
n-
sg-nd
oflard-ly-theDor-ingan-nd-
atea-
iser-er
ibeb-ec.
I. INTRODUCTION
Computer simulation of the structural formation of polmer chain systems has recently become the focus of attenin physics, chemistry and material science. Intensive stuof various model polymer systems, such asn-alkanes1–8 andpolyethylene chains,9–15 have been made in order to undestand the dynamics of the ordered or partially ordered pomer chain systems.
Polymer chains show diverse static and dynamical strtures since they have many internal degrees of freedomexample the rotational freedom about each C-C bond inpolyethylene molecule. Owing to their structural diversipolymeric materials have various mechanical and thermonamical properties. It is well known that solution-growsingle crystals of polyethylene are usually very thin lamelwhose width and thickness are respectively several tenmm and 10220 nm, and consist of folded chains. Polyetylene chains are perpendicular to the fold surface.18–20Mac-roscopic properties of polyethylene single crystals have bstudied by various experimental techniques: the molecweight and the radius of gyration of the polymer chain cbe obtained by the neutron scattering experiment andlamellar thickness can be estimated by small angle x-scattering, electron spectroscopy and Raman scattering.20 Onthe other hand, it seems very difficult to observe the strtural formation process of polymer chains, such as the crygrowth process,at the molecular levelby the present experimental techniques. Computer simulation is one of the strgest tools for investigating the mechanisms of the structformation at the molecular level.
Over the last decade, several studies have been donrelation to the structural formation of polymer chain systemEsselinket al.carried out molecular dynamics~MD! simula-tions of nucleation and melting ofn-alkanes in order to determine the crystallization and melting temperatures acompute the crystallization rate of a nucleus.5 Yamamotoet al.performed Monte Carlo~MC! simulations of the struc-
J. Chem. Phys. 107 (2), 8 July 1997 0021-9606/97/107(2)/613
Downloaded¬04¬Apr¬2001¬to¬133.75.88.29.¬Redistribution¬subjec
ones
-
c-ore,y-
eof
narney
-al
n-al
in.
d
ture and the molecular mobility at free surfaces andcrystal/melt interfaces of ann-alkane crystal on the basis othe rigid-chain assumption.6,7 They also studied the dynamics of the conformational defects by MD simulations ofpolyethylene chain confined in cylindrical potentials.13 Noidet al. performed MD simulations on the motion of the coformational defects in a polyethylene-like crystal.9–12Kavas-saliset al.carried out MD simulations of the folding procesof a polyethylene chain below the equilibrium meltintemperature.14,15 Hikosakaet al. pointed out several important aspects of polymer crystallization: the existence of athe role played by ametastable phaseand the high chainmobility associated with this phase.16,17
The purpose of this paper is to clarify the mechanismsthe structural formation of polymer chains at the moleculevel. In particular, our concern is to investigate the bonorientational order and the conformational defects of pomer chains. With a view to investigating the process ofstructural formation of polymer chains, we carry out the Msimulations of a single polymer chain and analyze the fmation process of the orientationally ordered structure durcooling. Only few studies have so far been made at the trsition process from the random-coil structure to the boorientationally ordered structure. Although Kavassaliset al.performed MD simulations of the structural formation ofpolyethylene chain with the initial rotational isomeric stadistribution, the bond-orientational order and the conformtional defects were not analyzed.14
In this study the effect of the interchain interactionneglected. In order to take the effect of the interchain intaction into account, the MD simulations of many polymchains will be carried out in the near future.
This paper is organized as follows. In Sec. II we descrin detail our simulation model and method. Our results otained by MD simulations are presented in Sec. III. In SIV a summary and a discussion are given.
613/10/$10.00 © 1997 American Institute of Physics
t¬to¬AIP¬copyright,¬see¬http://ojps.aip.org/jcpo/jcpcr.jsp

n
a
r
e
r
a-
abletialen-tion
g
-ainra-
of
alus
on-of
de-to
e is
614 S. Fujiwara and T. Sato: Simulations of a single polymer
II. MODEL AND METHOD
Following Refs. 14 and 15, the model polyethylene cosists of a linear chain ofn CH2 groups, which are treated asunited atoms~Fig. 1!. The massm of each CH2 group is14 g/mol. The united atoms interact via the bonded potenti~bond-stretching, bond-bending and torsional potentials! andthe non-bonded potential. The atomic force field used herethe DREIDING potential.21 The total potential energyEtot
consists of four parts:~i! the bond-stretching energies foC-C bonds,
Estretch5(i52
n1
2kd~di2d0!
2, ~1!
whered0 is the equilibrium bond length anddi is the bondlength between atomsi21 and i , ~ii ! the bond-bending en-ergies,
Ebend5(i53
n1
2ku~u i2u0!
2, ~2!
whereu0 is the equilibrium bond angle andu i is the bondangle between three adjacent atomsi22, i21 andi , ~iii ! thetorsional energies,
Etorsion5(i54
n1
2vf$12cos~3f i !%, ~3!
wheref i is the dihedral angle formed by four consecutivatoms i23, i22, i21 and i , and ~iv! the 12-6 Lennard-Jones potential between non-bonded atoms separatedmore than two bonds,
ELJ5(i51
n
(j51
n
~ j2 i>3!
4e F S s
r i jD 122S s
r i jD 6G , ~4!
wherer i j is the distance between atomsi and j . The valuesof all the potential parameters are listed in Table I.
The equations of motion for all atoms are solved numecally using the velocity version of the Verlet algorithm.22We
FIG. 1. A model polyethylene chain. Each CH2 group is treated as a spheri-cal united atom. The bond lengthdi is calculated asdi5udi u, wheredi[r i2r i21 is the bond vector between atomsi21 andi , andr i denotes theposition vector of atomi . The bond angleu i is the angle between threeadjacent atomsi22, i21 and i , and the dihedral anglef i is the anglebetween the plane formed bydi22 anddi21 and that formed bydi21 anddi . The trans conformation corresponds tof50.
J. Chem. Phys., Vol. 10
Downloaded¬04¬Apr¬2001¬to¬133.75.88.29.¬Redistribution¬subjec
-
ls
is
by
i-
apply the Nose´-Hoover method in order to keep the temperture of the system constant.23–25The integration time step is0.001 ps and a relaxation constant for the heat bath variis 0.1 ps. The cutoff distance for the Lennard-Jones potenis 10.5 Å. The total momentum and the total angular momtum are taken to be zero in order to cancel overall translaand rotation of the chain.
The MD simulations are performed by the followinprocedure. First, a polymer chain withn5500 united atomsis placed in theall-trans conformation with no total momentum and no total angular momentum. Secondly, we obtrandom configuration of the polymer chain at high tempeture (T5800 K! by the MD run of 1000 ps. Thirdly, it iscooled stepwise toT5100 K with the rate of 50 K/1000 ps~Fig. 2!. Note that the equilibrium melting temperaturepolyethylene isTm°5414 K, for reference.
In the following section, we study the bond-orientationorder and the distribution of the dihedral angles at variotemperatures in detail.
III. RESULTS
A. Chain conformations
In order to see the formation process of the orientatially ordered structure, we show, in Fig. 3, the snapshotsthe chain conformation at timet51000 ps for various tem-peratures (T5800, 500, 400 and 100 K! obtained by our MDsimulations. In this figure, the ellipsoids, whose axes aretermined as three principal axes of inertia, are depictedroughly show the shape of a polymer chain. From Fig. 3~a!,it is found that, at high temperature (T5800 K!, gauche
TABLE I. Potential energy parameters used in our simulation.a
parameter value unit
d0 0.153 nmu0 1.2310 radkd 70000 kcal/nm2•molku 100 kcal/rad2•molkf 2.0 kcal/mole 0.1984 kcal/mols 0.36239 nm
aReference 21.
FIG. 2. Schematic explanation of the cooling process. The cooling rat50 K/ns.
7, No. 2, 8 July 1997
t¬to¬AIP¬copyright,¬see¬http://ojps.aip.org/jcpo/jcpcr.jsp

lyethylene
615S. Fujiwara and T. Sato: Simulations of a single polymer
FIG. 3. The chain conformation of a polyethylene chain at 1000 ps~a! for T5800 K, ~b! for T5500 K, ~c! for T5400 K and~d! for T5100 K ~Left: sideview, Right: top view!. Color denotes the absolute value of the dihedral angle around each bond and the ellipsoid roughly shows the shape of a pochain. The end bonds are colored with blue.
a
islsp
ta
-
on
r-wo
te
atetion
ii of
sss of
states~deep green to light blue! are excited everywhere andpolymer chain forms arandom-coil structure. Figures 3~b!–3~d! indicate that the orientationally ordered structureformed at low temperatures by a stepwise cooling. It is afound that the chain configuration becomes more anisotroas the temperature decreases. From Figs. 3~c! and 3~d!, wefind the following features concerning the obtained orientionally ordered structure:~i! the gaucheexcitations are lo-cated only in the fold surfaces,~ii ! most bonds in the adjacently re-entered fold are in thegauchestate and~iii ! in thenon-adjacently re-entered fold, there are severaltransbondsas well asgauchebonds.
In the following subsections, we analyze the radiusgyration, the bond-orientational order and the conformatiodefects in the process of the structural formation.
B. Radius of gyration
In Sec. III A, it was shown that the orientationally odered structure at low temperatures is anisotropic. Hereintroduce the coordinate system with three principal axesinertia in order to analyze the anisotropic structure~Fig. 4!.In this coordinate system, the origin is located at the cenof-mass position, thex-axis is the principal axis with the
J. Chem. Phys., Vol. 10
Downloaded¬04¬Apr¬2001¬to¬133.75.88.29.¬Redistribution¬subjec
oic
-
fal
ef
r-
largest moment of inertia and thez-axis is that with thesmallest moment of inertia. In this subsection, we investiga change in the chain dimensions in the structural formaprocess.
The chain dimensions can be characterized by its radgyration parallel to individual axes defined as
Rgx2 5
1
n(i51
n
^~xi2xc!2&, ~5a!
Rgy2 5
1
n(i51
n
^~yi2yc!2&, ~5b!
Rgz2 5
1
n(i51
n
^~zi2zc!2&, ~5c!
wherer i5(xi ,yi ,zi) is the position vector of thei -th atom,r c5(xc ,yc ,zc) is the position vector of the center of maand^•••& denotes the ensemble average. The usual radiugyrationRg is defined by
Rg25
1
n(i51
n
^~r i2r c!2&, ~6!
7, No. 2, 8 July 1997
t¬to¬AIP¬copyright,¬see¬http://ojps.aip.org/jcpo/jcpcr.jsp

thanpe
rech
era-
merre-
pa-c-
ec-
-
It is
sctedmefof
s oaxt oia.
616 S. Fujiwara and T. Sato: Simulations of a single polymer
and the relationRg25Rgx
2 1Rgy2 1Rgz
2 holds.In Fig. 5, we show the temperature dependence of
radii of gyration. The time average is taken between 0.21.0 ns for each temperature. From the temperature dedence ofRg , we find the following features:~i! At hightemperatures (T.550 K!, Rg decreases as the temperatudecreases. This temperature dependence is one of theacteristic features of a random coil.~ii ! On the other hand, in
FIG. 4. Explanation of the coordinate system with three principal axeinertia. The origin of the coordinates is the center of mass. The main(z-axis! is determined as the principal axis with the smallest momeninertia and thex-axis is the principal axis with the largest moment of inert
FIG. 5. The radii of gyrationRgx , Rgy , Rgz , Rg versus temperatureT. Timeaverage is taken between 0.2 and 1.0 ns.
J. Chem. Phys., Vol. 10
Downloaded¬04¬Apr¬2001¬to¬133.75.88.29.¬Redistribution¬subjec
edn-
ar-
the temperature region belowT5550 K,Rg increases as thetemperature decreases. As is clearly seen from the tempture dependence ofRgx , Rgy and Rgz , the reason for thistemperature dependence is that the shape of the polychain becomes more anisotropic as the temperature isduced. From Fig. 5, the ratioRgz /Rgx is found to beRgz /Rgx'1.5 atT5800 K whileRgz /Rgx'2.9 atT5100 K.It is ascertained by investigating the orientational orderrameter in Sec. III C. that the orientationally ordered struture is formed in this very temperature region.~iii ! When thetemperature is lower thanT5400 K, Rg is almost constantand the global change of the chain conformation is not rognized.
The radii of gyrationRg are plotted in Fig. 6 as a function of time for various temperatures. AtT5800 K @Fig.6~a!# and T5100 K @Fig. 6~d!#, Rg only fluctuates aroundeach mean value and no remarkable change is found.seen from Fig. 6~b! that, in the case ofT5500 K, after thegradual increase ofRg within the first 0.3 ns,Rg slowly de-creases and returns to a value corresponding toRg at t50 ns.At T5400 K @Fig. 6~c!#, Rg gradually increases up to 0.6 nand sharply increases between 0.6 and 0.7 ns. It is expethat the abrupt structural change might occur in this tiinterval. After the sharp increase,Rg has a constant value oabout 1.29 nm, which almost corresponds to the valueRg at lower temperatures.
fisf
FIG. 6. The radius of gyrationRg versus timet ~a! at T5800 K, ~b! atT5500 K, ~c! at T5400 K and~d! at T5100 K.
7, No. 2, 8 July 1997
t¬to¬AIP¬copyright,¬see¬http://ojps.aip.org/jcpo/jcpcr.jsp
de
ra
aa
hra
a
-
aedtu-ellohis
nd
.
hi
dII
red
al
ion
indi-
617S. Fujiwara and T. Sato: Simulations of a single polymer
C. Bond-orientational order
In this subsection, we study the bond-orientational orof a polymer chain. To begin with, we calculate theglobalbond-orientational order parameterA, which is defined by
A51
n22 (i53
n K 3cos2c i21
2 L , ~7!
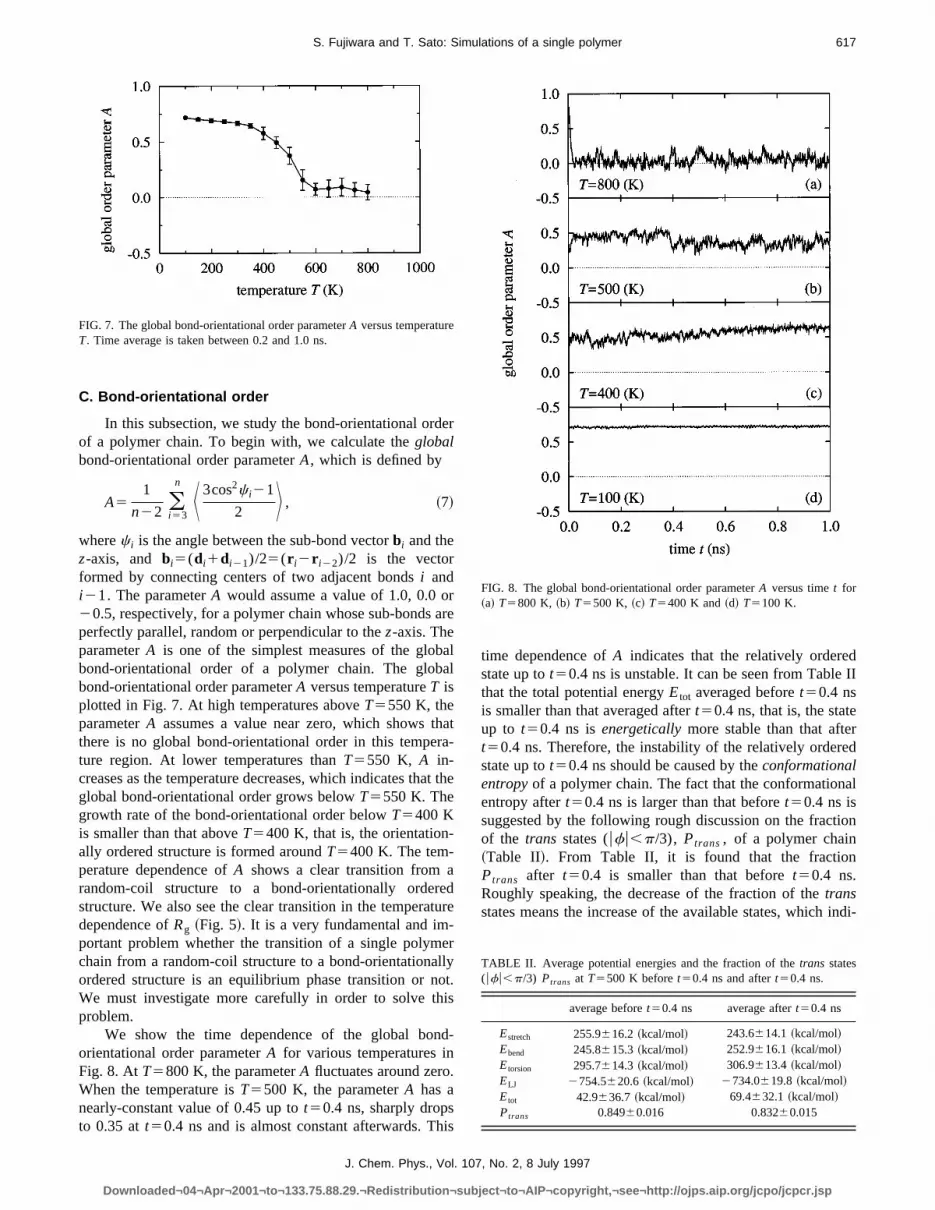
wherec i is the angle between the sub-bond vectorbi and thez-axis, and bi5(di1di21)/25(r i2r i22)/2 is the vectorformed by connecting centers of two adjacent bondsi andi21. The parameterA would assume a value of 1.0, 0.0 o20.5, respectively, for a polymer chain whose sub-bondsperfectly parallel, random or perpendicular to thez-axis. TheparameterA is one of the simplest measures of the globbond-orientational order of a polymer chain. The globbond-orientational order parameterA versus temperatureT isplotted in Fig. 7. At high temperatures aboveT5550 K, theparameterA assumes a value near zero, which shows tthere is no global bond-orientational order in this tempeture region. At lower temperatures thanT5550 K, A in-creases as the temperature decreases, which indicates thglobal bond-orientational order grows belowT5550 K. Thegrowth rate of the bond-orientational order belowT5400 Kis smaller than that aboveT5400 K, that is, the orientationally ordered structure is formed aroundT5400 K. The tem-perature dependence ofA shows a clear transition fromrandom-coil structure to a bond-orientationally orderstructure. We also see the clear transition in the temperadependence ofRg ~Fig. 5!. It is a very fundamental and important problem whether the transition of a single polymchain from a random-coil structure to a bond-orientationaordered structure is an equilibrium phase transition or nWe must investigate more carefully in order to solve tproblem.
We show the time dependence of the global boorientational order parameterA for various temperatures inFig. 8. AtT5800 K, the parameterA fluctuates around zeroWhen the temperature isT5500 K, the parameterA has anearly-constant value of 0.45 up tot50.4 ns, sharply dropsto 0.35 att50.4 ns and is almost constant afterwards. T
FIG. 7. The global bond-orientational order parameterA versus temperatureT. Time average is taken between 0.2 and 1.0 ns.
J. Chem. Phys., Vol. 10
Downloaded¬04¬Apr¬2001¬to¬133.75.88.29.¬Redistribution¬subjec
r
re
ll
at-
t the
re
ryt.
-
s
time dependence ofA indicates that the relatively orderestate up tot50.4 ns is unstable. It can be seen from Tablethat the total potential energyEtot averaged beforet50.4 nsis smaller than that averaged aftert50.4 ns, that is, the stateup to t50.4 ns isenergeticallymore stable than that aftet50.4 ns. Therefore, the instability of the relatively orderstate up tot50.4 ns should be caused by theconformationalentropyof a polymer chain. The fact that the conformationentropy aftert50.4 ns is larger than that beforet50.4 ns issuggested by the following rough discussion on the fractof the trans states (ufu,p/3), Ptrans , of a polymer chain~Table II!. From Table II, it is found that the fractionPtrans after t50.4 is smaller than that beforet50.4 ns.Roughly speaking, the decrease of the fraction of thetransstates means the increase of the available states, which
FIG. 8. The global bond-orientational order parameterA versus timet for~a! T5800 K, ~b! T5500 K, ~c! T5400 K and~d! T5100 K.
TABLE II. Average potential energies and the fraction of thetrans states(ufu,p/3) Ptrans at T5500 K beforet50.4 ns and aftert50.4 ns.
average beforet50.4 ns average aftert50.4 ns
Estretch 255.9616.2 ~kcal/mol! 243.6614.1 ~kcal/mol!Ebend 245.8615.3 ~kcal/mol! 252.9616.1 ~kcal/mol!Etorsion 295.7614.3 ~kcal/mol! 306.9613.4 ~kcal/mol!ELJ 2754.5620.6 ~kcal/mol! 2734.0619.8 ~kcal/mol!Etot 42.9636.7 ~kcal/mol! 69.4632.1 ~kcal/mol!Ptrans 0.84960.016 0.83260.015
7, No. 2, 8 July 1997
t¬to¬AIP¬copyright,¬see¬http://ojps.aip.org/jcpo/jcpcr.jsp

618 S. Fujiwara and T. Sato: Simulations of a single polymer
FIG. 9. The bond-stretching energyEstretch, the bond-bending energyEbend, the torsional energyEtorsion and the Lennard-Jones energyELJ versus timet ~a!at T5500 K and~b! at T5400 K.
Ae
n
,et
r
s in
s
dwnthis
cates the increase of the conformational entropy.T5400 K, A gradually increases with time. Although thradius of gyrationRg abruptly rises betweent50.6 andt50.7 ns~Fig. 6!, the abrupt change inA is not found. It isworth noting that the way of change inEstretchis opposite tothat inELJ , that is,Estretchincreases whenELJ decreases, andvice versa@Fig. 9~b!#. From Fig. 9~b!, it is found thatEbendisconstant andEtorsion gradually decreases in the formatioprocess of the orientationally ordered structure. AtT5100K, there is no change in the parameterA.
In order to investigate thelocal bond-orientational orderwe next calculate the bond-orientational order paramSB(z) which is defined by
SB~z!5K K 3cos2~c~z!!21
2 Lbond
L , ~8!
wherec(z) is the angle between the sub-bond vectorb in a
J. Chem. Phys., Vol. 10
Downloaded¬04¬Apr¬2001¬to¬133.75.88.29.¬Redistribution¬subjec
t
er
slab @z, z1dz# and thez-axis, and^•••&bond denotes theaverage over the sub-bonds in a slab betweenz andz1dz.The parameterSB(z) would assume a value of 1.0, 0.0 o20.5, respectively, for sub-bonds in a slab@z,z1dz# per-fectly parallel, random or perpendicular to thez-axis. We setdz50.5s in our calculations ofSB(z).
We show the bond-orientational order parameterSB(z)at t50.2, 0.4, 0.6, 0.8 and 1.0 ns for various temperatureFig. 10. This figure shows the following features:~i! At hightemperatureT5800 K, @Fig. 10~a!#, SB(z) is almost zeroindependent ofz, which indicates that a polymer chain forma random-coil structure.~ii ! In the case ofT5500 K @Fig.10~b!#, a relatively orientationally ordered structure is founto appear att50.2 ns. The structure, however, breaks doafter t50.4 ns. We have already discussed the cause ofbreakdown in the earlier part of this subsection.~iii ! AtT5400 K @Fig. 10~c!#, it is clear that the more
7, No. 2, 8 July 1997
t¬to¬AIP¬copyright,¬see¬http://ojps.aip.org/jcpo/jcpcr.jsp

619S. Fujiwara and T. Sato: Simulations of a single polymer
FIG. 10. The bond-orientational order parameterSB(z) versusz at t50.2, 0.4, 0.6, 0.8 and 1.0 ns for~a! T5800 K, ~b! T5500 K, ~c! T5400 K and~d!T5100 K.
o
eea-esth
rilrd
ofllyherre-tial
the
orientationally ordered structure is formed with the elapsetime. ~iv! At T5100 K @Fig. 10~d!#, the orientationally or-dered structure is formed and there is a flat part betwz520.9 andz51.2 nm. The bond-orientational order prameterSB(z) in this flat region reaches 0.9, which indicatthat the sub-bonds in this region are almost parallel toz-axis.
Finally, we analyze the orientationally ordered structuof a polymer chain obtained by our MD simulations in detaIt is very useful to introduce the concept of ‘‘stem’’ in ordeto characterize the orientationally ordered structure. Wefine a stemas a series of atoms whosez-coordinates are
J. Chem. Phys., Vol. 10
Downloaded¬04¬Apr¬2001¬to¬133.75.88.29.¬Redistribution¬subjec
f
n
e
e.
e-
located in the region (zmins ,z,zmax
s ) whereSB(z) is largerthan 0.9 ~Fig. 11!. A snapshot of stems att51.0 ns forT5100 K is displayed in Fig. 12. In this case,zmin
s andzmaxs are set to bezmin
s 520.7 nm andzmaxs 51.1 nm, respec-
tively. As clearly seen from this figure, 16 stems, eachwhich contains 14 or 15 atoms, form a bond-orientationaordered structure with deformed hexagonal symmetry. Tmean distance between stems is 0.416 nm, which cosponds to the minimum of the Lennard-Jones potenR050.40677 nm. The length of stems (zmax
s 2zmins ) is about
1.8 nm and the thickness of the fold surface along
7, No. 2, 8 July 1997
t¬to¬AIP¬copyright,¬see¬http://ojps.aip.org/jcpo/jcpcr.jsp

sraon
stm
dm-nja-dja-ldsitial
ro-histheow
.e
e
ure
nalm-
oner
r-
ofly-eerdn
asal
der
lly
t
ed
ie
find
620 S. Fujiwara and T. Sato: Simulations of a single polymer
z-axis is around 1.0 nm; accordingly, the lamellar thicknein our simulations is about 3.8 nm. This value is sevetimes as small as that of the lamellar thickness of solutigrown single crystals of polyethylene (10220 nm!. We ex-pect that the lamellar thickness becomes large when theterchain interaction is taken into account. This was suggein Ref. 14 in the case of four-chain system. It is found fro
FIG. 11. Schematic explanation of stems. Each stem is defined as a seratoms whosez-components are located betweenzmin
s andzmaxs .
FIG. 12. The configuration of stems att51.0 ns forT5100 K; ~a! side viewand ~b! top view. Numbers beside stems in~b! denote the connection ostems along the chain. Filled circles represent the central positions ofvidual stems.
J. Chem. Phys., Vol. 10
Downloaded¬04¬Apr¬2001¬to¬133.75.88.29.¬Redistribution¬subjec
sl-
in-ed
Fig. 12~b! that the stems in the outer layer of the foldestructure have a tilted configuration. As indicated by nubers beside stems in Fig. 12~b!, which denote the connectioof stems along the chain, the number of folds with nonadcent re-entry is about three times as many as that with acent re-entry. The ratio of the nonadjacently re-entered foto the adjacently re-entered folds may depend on the inconfiguration and the cooling history.
D. Conformational defects
In the previous subsection, we studied the formation pcess of the bond-orientationally ordered structure. In tsubsection, we investigate the conformational defects inbond-orientationally ordered structure. In Fig. 13, we shthe histogram of the dihedral anglesP(f) at z50, 1.0 and1.5 nm at several times forT5800, 500, 400 and 100 KNote that the position atz51.5 nm corresponds to the insidof the fold surface atT5100 K ~Fig. 10!. From Fig. 13~a!, itis found that, atT5800 K, there is no marked change in thshape of the histogram for anyz and the distribution off isbroad. At temperaturesT5500, 400 and 100 K@Fig. 13~b!–13~d!#, the shape of the histogram depends onz. At z50 nm,almost all the conformations aretrans aroundf50, espe-cially for T5400 and 100 K. On the other hand, thegauchestates (ufu.p/3) are excited atz51.0 and 1.5 nm forT5500 and 400 K and atz51.5 nm for T5100 K. It isclearly seen from this figure that, even at low temperat(T5100 K!, the distributionP(f) changes its shape withtime atz51.5 nm. This fact suggests that the conformatiomotion is easy to occur at the fold surface even at low teperatures.
We show the three-dimensional plot of the distributiP(f) at t51.0 ns for several temperatures in Fig. 14 in ordto illustrate the dependence ofP(f) on z clearly. AtT5800 K, the distributionP(f) does not depend onz verywell. At low temperatures, on the other hand,P(f) dependson z and thegauchestates are located only in the fold suface.
IV. SUMMARY AND DISCUSSION
In this article, we have studied the formation processthe bond-orientationally ordered structure of a single pomer chain with 500 CH2 groups during the gradual stepwiscooling by MD simulations. The bond-orientational ordstarts to grow atT5550 K and the orientationally orderestructure is formed atT5400 K. The new results obtained iour simulations are as follows:
~i! The bond-orientationally ordered structure wformed from a random-coil structure by a gradustepwise cooling.
~ii ! The anisotropy as well as the bond-orientational orof a polymer chain grew belowT5550 K.
~iii ! In the formation process of the bond-orientationaordered structure atT5400 K, the way of change inthe bond-stretching energyEstretchwas opposite to thain the Lennard-Jones energyELJ .
~iv! In the bond-orientationally ordered structure obtain
s of
i-
7, No. 2, 8 July 1997
t¬to¬AIP¬copyright,¬see¬http://ojps.aip.org/jcpo/jcpcr.jsp

621S. Fujiwara and T. Sato: Simulations of a single polymer
FIG. 13. Distribution of the dihedral angleP(f) at timest50.2, 0.4, 0.6, 0.8 and 1.0 ns atz50, 1.0 and 1.5 nm for~a! T5800 K, ~b! T5500 K, ~c!T5400 K and~d! T5100 K. In the low temperatures (T5400 and 100 K!, z51.0 nm corresponds tozmax
s and the position atz51.5 nm is inside the foldsurface.
,men
w-o-
lt.u
anh
eothtth
ndpsio
larling
ly-we
eda
e ofateis
the. Incessedo-ofwillinc-an-tal
by our simulations atT5100 K, there were 16 stemseach of which involved 14 or 15 atoms. These steformed a structure with deformed hexagonal symmtry and the stems in the outer layer had a tilted cofiguration.
~v! In the bond-orientationally ordered structure at lotemperatures, thegauchestates were located exclusively in the fold surface and the conformational mtion was easy to occur at the fold surface.
The third result,~iii !, is not necessarily an evident resuWithin the context of the presented data we cannot dedthe physical explanation of the opposite tendency ofEstretch
and ELJ . In order to elucidate this opposite tendency,elaborate molecular motion analysis must be done, whicleft for the future work.
The fourth observation,~iv!, can be interpreted by thfollowing simple argument. The energy loss due to the tiltstems in the outer layer is considered to be small sinceouter layer is a free surface. Therefore, the entanglementhe fold surface can be alleviated by the tilt of stems inouter layer with the minimal energy loss.
In our simulations, the obtained lamella is very thin athe fold structure is very disordered made up of long looWe cannot say for certain from our analysis whethershould be interpreted as intrinsic structure of the lamella
J. Chem. Phys., Vol. 10
Downloaded¬04¬Apr¬2001¬to¬133.75.88.29.¬Redistribution¬subjec
s--
ce
is
feine
.tr
an artifact due to rapid cooling, but we think that the lamelthickness and the fold structure can depend on the coorate.
Here we comment on the effect of the length of a pomer chain on the structural formation. In our simulations,treated a relatively short polymer chain with 500 CH2
groups. Whether the global bond-orientationally orderstructure is formed from a random-coil structure withinsimulation time~at most a few tens of nanoseconds! or notmay depend on the length of a polymer chain. In the casa very long polymer chain, it is expected that the aggregof locally-ordered regions, such as a fringed micelle,formed.
In this study, we concentrated on the analyses ofbond-orientational order and the conformational defectsorder to understand the mechanisms of the formation proof the bond-orientationally ordered structure clearly, we neanalyze the molecular mobility and the conformational mtion in this formation process. We will report the resultsthese analyses in the subsequent paper. Moreover, wecarry out the MD simulations of a many-chain systemorder to take the effect of the interchain interaction into acount in future. Furthermore, we plan to investigate the mner in which polymer chains are incorporated into the cryssurface from the point of view ofself-organization.
7, No. 2, 8 July 1997
t¬to¬AIP¬copyright,¬see¬http://ojps.aip.org/jcpo/jcpcr.jsp

622 S. Fujiwara and T. Sato: Simulations of a single polymer
FIG. 14. Three-dimensional plot of the distributionP(f) as a function off and z at t51.0 ns for~a! T5800 K, ~b! T5500 K, ~c! T5400 K and~d!T5100 K.
.su--idhea-oity
m.
ro-
s.
ci.
G.
ACKNOWLEDGMENTS
We would like to thank Dr. H. Takamaru, Dr. AKageyama and Dr. T.-H. Watanabe and other memberour complexity simulation group in National Institute for Fsion Science~NIFS! for their fruitful discussions and comments. This work was partially supported by a Grant-in-Afor Scientific Research on Priority Areas, Cooperative Pnomena in Complex Liquids, from the Ministry of Eduction, Science, Sports and Culture. This work was carriedby using the Advanced Computing System for ComplexSimulation~NEC SX-3/24R! at the NIFS.
1T. Yamamoto, J. Chem. Phys.82, 3790~1985!; 89, 2356~1988!.2J. P. Ryckaert and M. L. Klein, J. Chem. Phys.85, 1613~1986!.3J. P. Ryckaert, M. L. Klein, and I. R. McDonald, Phys. Rev. Lett.58, 698~1987!.
4J. P. Ryckaert, I. R. McDonald, and M. L. Klein, Mol. Phys.67, 957~1989!.
5K. Esselink, P. A. J. Hilbers, and B. W. H. van Beest, J. Chem. Phys.101,9033 ~1990!.
6T. Yamamoto, M. Hikosaka, and N. Takahashi, Macromolecules27, 1466~1994!.
7T. Yamamoto, J. Chem. Soc. Faraday Trans.91, 2559~1995!.8S. N. Kreitmeier, G. L. Liang, D. W. Noid, and B. Wunderlich, J. CheSoc. Faraday Trans.91, 2601~1995!.
J. Chem. Phys., Vol. 10
Downloaded¬04¬Apr¬2001¬to¬133.75.88.29.¬Redistribution¬subjec
of
-
ut
9D. W. Noid, B. G. Sumpter, and B. Wunderlich, Macromolecules23, 664~1990!; 24, 4148~1991!.
10B. G. Sumpter, D. W. Noid, B. Wunderlich, and S. Z. D. Cheng, Macmolecules23, 4671~1990!.
11B. G. Sumpter, D. W. Noid, and B. Wunderlich, J. Chem. Phys.93, 6875~1990!.
12B. G. Sumpter, D. W. Noid, and B. Wunderlich, Macromolecules25, 7247~1992!.
13T. Yamamoto and Y. Kimikawa, J. Chem. Phys.97, 5163 ~1992!; 99,6126 ~1993!.
14T. A. Kavassalis and P. R. Sundararajan, Macromolecules26, 4144~1993!.
15P. R. Sundararajan and T. A. Kavassalis, J. Chem. Soc. Faraday Tran91,2541 ~1995!.
16M. Hikosaka, S. Rastogi, A. Keller, and H. Kawabata, J. Macromol. SPhys. B31, 87 ~1992!.
17A. Keller, M. Hikosaka, S. Rastogi, A. Toda, P. J. Barham, andGoldbeck-Wood, J. Mater. Sci.29, 2579~1994!.
18A. Keller, Rep. Prog. Phys.31, 623 ~1968!.19B. Wunderlich,Macromolecular Physics~Academic, New York, 1976!,Vol. 1.
20P. J. Phillips, Rep. Prog. Phys.53, 549 ~1990!.21S. L. Mayo, B. D. Olafson, and W. A. Goddard III, J. Phys. Chem.94,8897 ~1990!.
22L. Verlet, Phys. Rev.159, 98 ~1967!.23S. Nose´, Mol. Phys.52, 255 ~1984!.24S. Nose´, J. Chem. Phys.81, 511 ~1984!.25W. G. Hoover, Phys. Rev. A31, 1695~1985!.
7, No. 2, 8 July 1997
t¬to¬AIP¬copyright,¬see¬http://ojps.aip.org/jcpo/jcpcr.jsp