
Molecular Classification and Tumor Microenvironment ... - MDPI
17
cancers Article Molecular Classification and Tumor Microenvironment Characterization of Gallbladder Cancer by Comprehensive Genomic and Transcriptomic Analysis Nobutaka Ebata 1,2 , Masashi Fujita 1 , Shota Sasagawa 1 , Kazuhiro Maejima 1 , Yuki Okawa 1,2 , Yutaka Hatanaka 3 , Tomoko Mitsuhashi 4 , Ayako Oosawa-Tatsuguchi 1 , Hiroko Tanaka 5 , Satoru Miyano 5 , Toru Nakamura 2 , Satoshi Hirano 2, * and Hidewaki Nakagawa 1, * Citation: Ebata, N.; Fujita, M.; Sasagawa, S.; Maejima, K.; Okawa, Y.; Hatanaka, Y.; Mitsuhashi, T.; Oosawa- Tatsuguchi, A.; Tanaka, H.; Miyano, S.; et al. Molecular Classification and Tumor Microenvironment Characterization of Gallbladder Cancer by Comprehensive Genomic and Transcriptomic Analysis. Cancers 2021, 13, 733. https://doi.org/ 10.3390/cancers13040733 Academic Editor: David Wong Received: 12 January 2021 Accepted: 2 February 2021 Published: 10 February 2021 Publisher’s Note: MDPI stays neutral with regard to jurisdictional claims in published maps and institutional affil- iations. Copyright: © 2021 by the authors. Licensee MDPI, Basel, Switzerland. This article is an open access article distributed under the terms and conditions of the Creative Commons Attribution (CC BY) license (https:// creativecommons.org/licenses/by/ 4.0/). 1 Laboratory for Cancer Genomics, RIKEN Center for Integrative Medical Sciences, Yokohama 230-0045, Japan; [email protected] (N.E.); [email protected] (M.F.); [email protected] (S.S.); [email protected] (K.M.); [email protected] (Y.O.); [email protected] (A.O.-T.) 2 Department of Gastroenterological Surgery II, Faculty of Medicine, Hokkaido University, Sapporo 060-8638, Japan; [email protected] 3 Research Division of Companion Diagnostics, Hokkaido University Hospital, Sapporo 060-8638, Japan; [email protected] 4 Department of Surgical Pathology, Hokkaido University Hospital, Hokkaido 060-8648, Japan; [email protected] 5 Laboratory of DNA Information Analysis, Human Genome Center, The Institute of Medical Science, The University of Tokyo, Tokyo 108-8639, Japan; [email protected] (H.T.); [email protected] (S.M.) * Correspondence: [email protected] (S.H.); [email protected] (H.N.) Simple Summary: Gallbladder cancer (GBC) is a rare but lethal cancer. Molecular characterization of GBC is insufficient so far, and a comprehensive molecular portrait is warranted to uncover new targets and classify GBC. Clustering analysis of RNA expression revealed two subclasses of 36 GBCs, which reflects the status of the tumor microenvironment (TME) and poor prognosis of GBC, including epithelial–mesenchymal transition (EMT), immune suppression, and the TGF-β signaling pathway. The knockout of miR125B1 in GBC cell lines decreased its invasion ability and altered the EMT pathway. Mutations of the genes related to the TGF-β signaling pathway were enriched in the poor-prognosis/TME-rich cluster of GBCs. This comprehensive molecular analysis provides a new classification of GBCs based on the TME activity, which is involved with EMT and immune suppression for poor prognosis of GBC. This information may be useful for GBC prognosis and therapeutic decision-making. Abstract: Gallbladder cancer (GBC), a rare but lethal disease, is often diagnosed at advanced stages. So far, molecular characterization of GBC is insufficient, and a comprehensive molecular portrait is warranted to uncover new targets and classify GBC. We performed a transcriptome analysis of both coding and non-coding RNAs from 36 GBC fresh-frozen samples. The results were integrated with those of comprehensive mutation profiling based on whole-genome or exome sequencing. The clustering analysis of RNA-seq data facilitated the classification of GBCs into two subclasses, characterized by high or low expression levels of TME (tumor microenvironment) genes. A correla- tion was observed between gene expression and pathological immunostaining. TME-rich tumors showed significantly poor prognosis and higher recurrence rate than TME-poor tumors. TME-rich tumors showed overexpression of genes involved in epithelial-to-mesenchymal transition (EMT) and inflammation or immune suppression, which was validated by immunostaining. One non-coding RNA, miR125B1, exhibited elevated expression in stroma-rich tumors, and miR125B1 knockout in GBC cell lines decreased its invasion ability and altered the EMT pathway. Mutation profiles revealed TP53 (47%) as the most commonly mutated gene, followed by ELF3 (13%) and ARID1A (11%). Muta- tions of ARID1A, ERBB3, and the genes related to the TGF-β signaling pathway were enriched in TME-rich tumors. This comprehensive analysis demonstrated that TME, EMT, and TGF-β pathway alterations are the main drivers of GBC and provides a new classification of GBCs that may be useful for therapeutic decision-making. Cancers 2021, 13, 733. https://doi.org/10.3390/cancers13040733 https://www.mdpi.com/journal/cancers
-
Upload
khangminh22 -
Category
Documents
-
view
1 -
download
0
Transcript of Molecular Classification and Tumor Microenvironment ... - MDPI

cancers
Article
Molecular Classification and Tumor MicroenvironmentCharacterization of Gallbladder Cancer by ComprehensiveGenomic and Transcriptomic Analysis
Nobutaka Ebata 1,2, Masashi Fujita 1, Shota Sasagawa 1, Kazuhiro Maejima 1, Yuki Okawa 1,2 ,Yutaka Hatanaka 3 , Tomoko Mitsuhashi 4 , Ayako Oosawa-Tatsuguchi 1, Hiroko Tanaka 5, Satoru Miyano 5,Toru Nakamura 2, Satoshi Hirano 2,* and Hidewaki Nakagawa 1,*
�����������������
Citation: Ebata, N.; Fujita, M.;
Sasagawa, S.; Maejima, K.; Okawa, Y.;
Hatanaka, Y.; Mitsuhashi, T.; Oosawa-
Tatsuguchi, A.; Tanaka, H.; Miyano,
S.; et al. Molecular Classification and
Tumor Microenvironment
Characterization of Gallbladder
Cancer by Comprehensive Genomic
and Transcriptomic Analysis. Cancers
2021, 13, 733. https://doi.org/
10.3390/cancers13040733
Academic Editor: David Wong
Received: 12 January 2021
Accepted: 2 February 2021
Published: 10 February 2021
Publisher’s Note: MDPI stays neutral
with regard to jurisdictional claims in
published maps and institutional affil-
iations.
Copyright: © 2021 by the authors.
Licensee MDPI, Basel, Switzerland.
This article is an open access article
distributed under the terms and
conditions of the Creative Commons
Attribution (CC BY) license (https://
creativecommons.org/licenses/by/
4.0/).
1 Laboratory for Cancer Genomics, RIKEN Center for Integrative Medical Sciences, Yokohama 230-0045, Japan;[email protected] (N.E.); [email protected] (M.F.); [email protected] (S.S.);[email protected] (K.M.); [email protected] (Y.O.); [email protected] (A.O.-T.)
2 Department of Gastroenterological Surgery II, Faculty of Medicine, Hokkaido University,Sapporo 060-8638, Japan; [email protected]
3 Research Division of Companion Diagnostics, Hokkaido University Hospital, Sapporo 060-8638, Japan;[email protected]
4 Department of Surgical Pathology, Hokkaido University Hospital, Hokkaido 060-8648, Japan;[email protected]
5 Laboratory of DNA Information Analysis, Human Genome Center, The Institute of Medical Science, TheUniversity of Tokyo, Tokyo 108-8639, Japan; [email protected] (H.T.); [email protected] (S.M.)
* Correspondence: [email protected] (S.H.); [email protected] (H.N.)
Simple Summary: Gallbladder cancer (GBC) is a rare but lethal cancer. Molecular characterizationof GBC is insufficient so far, and a comprehensive molecular portrait is warranted to uncovernew targets and classify GBC. Clustering analysis of RNA expression revealed two subclasses of36 GBCs, which reflects the status of the tumor microenvironment (TME) and poor prognosis of GBC,including epithelial–mesenchymal transition (EMT), immune suppression, and the TGF-β signalingpathway. The knockout of miR125B1 in GBC cell lines decreased its invasion ability and altered theEMT pathway. Mutations of the genes related to the TGF-β signaling pathway were enriched inthe poor-prognosis/TME-rich cluster of GBCs. This comprehensive molecular analysis provides anew classification of GBCs based on the TME activity, which is involved with EMT and immunesuppression for poor prognosis of GBC. This information may be useful for GBC prognosis andtherapeutic decision-making.
Abstract: Gallbladder cancer (GBC), a rare but lethal disease, is often diagnosed at advanced stages.So far, molecular characterization of GBC is insufficient, and a comprehensive molecular portraitis warranted to uncover new targets and classify GBC. We performed a transcriptome analysis ofboth coding and non-coding RNAs from 36 GBC fresh-frozen samples. The results were integratedwith those of comprehensive mutation profiling based on whole-genome or exome sequencing.The clustering analysis of RNA-seq data facilitated the classification of GBCs into two subclasses,characterized by high or low expression levels of TME (tumor microenvironment) genes. A correla-tion was observed between gene expression and pathological immunostaining. TME-rich tumorsshowed significantly poor prognosis and higher recurrence rate than TME-poor tumors. TME-richtumors showed overexpression of genes involved in epithelial-to-mesenchymal transition (EMT) andinflammation or immune suppression, which was validated by immunostaining. One non-codingRNA, miR125B1, exhibited elevated expression in stroma-rich tumors, and miR125B1 knockout inGBC cell lines decreased its invasion ability and altered the EMT pathway. Mutation profiles revealedTP53 (47%) as the most commonly mutated gene, followed by ELF3 (13%) and ARID1A (11%). Muta-tions of ARID1A, ERBB3, and the genes related to the TGF-β signaling pathway were enriched inTME-rich tumors. This comprehensive analysis demonstrated that TME, EMT, and TGF-β pathwayalterations are the main drivers of GBC and provides a new classification of GBCs that may be usefulfor therapeutic decision-making.
Cancers 2021, 13, 733. https://doi.org/10.3390/cancers13040733 https://www.mdpi.com/journal/cancers

Cancers 2021, 13, 733 2 of 17
Keywords: gallbladder cancer; tumor microenvironment; EMT; TGF-β signaling pathway
1. Introduction
Gallbladder cancer (GBC) is a rare tumor that exhibits some regional differencesworldwide. The highest incidence of GBC is reported in South America and Asia includingJapan, wherein the GBC incidence rate is 7/100,000 [1]. In the USA, the incidence rateof GBC is only 1.6/100,000, and racial differences in GBC etiology is large, althoughgallbladder stone or chronic inflammation is one of the main risk factors of GBC [1]. GBC isa lethal cancer with an overall mean survival rate of 6 months and a 5-year survival rate of5% [2], primarily owing to non-specificity of symptoms during initial stages of the diseaseand late diagnosis at advanced or non-curative stages. GBC has the worst survival amongdiverse biliary tract cancers (BTCs), even after chemotherapy [3]. Surgical resection is thebest regimen that increases the chances of long-time survival in patients with localizedGBCs, but it is difficult to curatively resect advanced GBC owing to its anatomical locationand highly locally invasive or metastatic potential. Gemcitabine, the first-line approvedtreatment for locally advanced or metastatic GBC, exhibits very limited effects [4], and nomolecular-based therapies are yet approved for GBC.
Molecular profiling is critical to establish treatment strategies for lethal cancers, andmolecular characterization of GBCs has been previously attempted. A study [5] revealedthat genomic alterations frequently occurred in TP53 (47.1%), ERBB3 (11.8%), and KRAS(7.8%) in Chinese GBCs, while another study observed TP53 (57.9%), CDKN2A/B (25%),and SMAD4 (17%) mutations in GBCs in the US [6]. A recent study observed recurrentalterations in ELF3 and the WNT pathway in Indian and Korean GBCs [7]. Among thesedriver mutations, TP53 mutations play a central role in GB carcinogenesis, while KRASmutations are the most dominant in other types of BTCs [8]. RNA expression analysisof the coding genes in BTCs revealed the upregulation in the expression of the immune-related transcriptome in GBCs and showed no significant difference in disease-free survivalaccording to tumor locations [8]. Peng et al. reported the members of the miRNA-200 familythat were downregulated in BTC samples [9] and known to participate in the epithelial–mesenchymal transition (EMT) process by directly targeting E-cadherin repressors [10].The long non-coding RNA (lncRNA) MEG8 contributed to the progression of EMT inlung and pancreatic cancers [11], while MEG3 expression was downregulated in GBCsand correlated with poor prognostic outcomes [12]. Considering the heterogeneity ofGBCs and BTCs, the current molecular characterization and known molecular markers areinsufficient, necessitating further evaluation of the genome and RNA expression data ofGBCs to improve outcomes of affected patients.
To further characterize the molecular features of GBCs and compare them with othertypes of BTC, here we performed a comprehensive analysis of the genome and expression ofRNAs, including ncRNAs, in 36 GBCs and 8 BTCs of the hilar bile duct (HBDC). Althoughthe transcriptomic difference based on tumor location in the bile duct tree was unclear, wecould classify GBCs into two subclasses based on the tumor microenvironment (TME) andpatient prognosis. We also identified the alterations in the expression of some ncRNAsand genes related to TME, such as those related to EMT, tumor immunology, and thetransforming growth factor (TGF)-β signaling pathway. This comprehensive analysis mayelucidate GB carcinogenesis and provide a new classification of GBCs that may be usefulfor therapeutic decision-making.
2. Results2.1. RNA-Sequencing (RNA-Seq) and Clustering Analysis Revealed Two Subclasses of GBCs
It is sometimes difficult to discriminate between the anatomical location of GBC anda tumor developed in the upper common bile duct or hepatic bile duct, even after patho-logical examination following resection [13]. First, to explore the molecular differences

Cancers 2021, 13, 733 3 of 17
between gallbladder body and neck cancer (GBBC) and cystic duct cancer (CDC), which areanatomically defined as GBCs, and hilar bile duct cancer (HBDC), we performed RNA-seqof frozen surgical specimens of 20 GBBCs, 16 CDCs, and 8 HBDCs located very closed tothe junction of cystic and common hepatic ducts, as evaluated by pathological examinationof resected samples. We extracted total RNAs from these 44 frozen surgical specimensand constructed RNA-seq libraries after rRNA depletion, which included ncRNAs andnon-polyA-tailed RNAs. We performed hierarchical clustering based on gene expressiondetected in these tissues by RNA-seq, and only genes with high expression (fragmentsper kilobase of exon per million fragments mapped (FPKM) > 2 in more than 12 samples)were used for clustering. The clustering analysis of RNA-seq data revealed no appar-ent difference between HBDCs, CDCs, and GBBCs (Figure S1), indicating their similarmolecular features.
We then focused on GBBCs and CDCs (these two cancers are anatomically GBCs)for clustering and examined genomic differences that may contribute to poor prognosis.Clinical features of patients with GBC are shown in Table S1. Patients with GBC in this studyshowed significant difference in prognosis based on their disease stage (T and N factors)but not anatomical locations (CDC or GBBC) (Figure S2). Hierarchical clustering basedon the expression of genes, including ncRNAs, allowed classification of GBCs into twoclusters, namely Cluster A and Cluster B (Figure 1a). Cluster B showed significantly poorerprognosis and higher recurrence rate (p = 0.01 and 0.005 by log-rank test, respectively)with HR: 6.6439, 95% CI (1.514–29.16) and HR: 3.623, 95% CI (1.226–10.71) than Cluster A(Figure 1b). However, the difference of gender, CDC/GBBC, pT (T1+T2 vs. T3+T4), andpN+ between Clusters A and B did not reach statistical significance (p > 0.05 by Fisher’sexact test, Table S2). The Cox proportional hazard regression analysis also showed thatthe overall survival (OS) depended on pT factor but that the disease-free survival (DFS)depended on pN factor and Cluster A/B (Table S2), suggesting that Cluster A/B could bean independent factor associated with GBC prognosis.
Figure 1. Cont.

Cancers 2021, 13, 733 4 of 17
Figure 1. Molecular subclass of GBCs and their prognosis. (a) Hierarchical clustering analysis of theprotein-coding gene expression data from 36 gallbladder cancer (GBC) samples; heatmap clusteringof differentially expressed protein-coding genes. These were classified into two groups, Clusters Aand B. Stromal score and immune score calculated by “Estimate” correlated with these clusters. (b)Kaplan–Meier plots of disease-free survival (left) and overall survival (right) of resected GBC cases.Significant differences in the prognosis between Clusters A and B are observed (p = 0.01 and 0.005 bylog-rank test, respectively, and HR: 6.6439, 95% CI (1.514–29.16) and HR: 3.623, 95% CI (1.226–10.71)).Each table in the bottom shows numbers at risk.
2.2. The High-Stromal Cluster Showed Upregulated Expression of Genes Involved in EMTand Inflammation
To characterize the expression of the genes of these clusters, we performed gene setenrichment analysis (GSEA) between Clusters A and B using the Molecular SignaturesDatabase (MSigDB) as the reference gene set. We found 19 gene sets that were differentiallyexpressed (false discovery rate (FDR) < 0.25) between Clusters A and B (Table S3). Figure 2ashows the list of the gene sets that were upregulated in Cluster A (right) or B (left) in GSEAbased on the normalized enrichment score (NES). In particular, the gene sets related to EMTand TGF-β signaling were significantly upregulated in Cluster B (q-values = 0.001582, and0.028345, respectively, Figure 2b). EMT is involved in cancer cell invasion and progressionand can be associated with poor prognosis in Cluster B (Figure S3). The TGF-β signal-ing pathway also upregulates the expression of EMT-related genes and plays a centralrole in EMT and TME [14]. A broad spectrum of immunological pathways, includinginflammatory response, interferon-γ and -α responses, and TNF-α signaling, was also up-regulated in Cluster B, while fatty acid and bile acid metabolisms were enriched in ClusterA (Figure 2a right). These observations suggest that the function of normal gallbladder orbiliary tract was retained in GBCs from Cluster A.
Thus, TME may play a critical role in GBCs in Cluster B. To further investigate theTME of GBCs, we analyzed these expression profiles by “Estimate”, which can estimatestromal cells and the level of immune cell infiltration in tumor tissues based on expressiondata, as well as tumor purity (Table S1). The Estimate analysis also showed that immuneand stroma scores were significantly higher at Cluster B than at Cluster B (p < 0.01 byMann–Whitney U test, Figure 2c).

Cancers 2021, 13, 733 5 of 17
Figure 2. The results of gene set enrichment analysis (GSEA) between Clusters A and B. (a) All upregulated gene sets inCluster A (left) and top 15 upregulated gene sets in Cluster B (right). (NES > 1.37 and > 1.18). (b) Gene sets of “EMT”,“TGF-β pathway”, and “inflammatory response” were significantly upregulated in Cluster B. (c) Comparison of the twogroups based on stromal score (left) and immune score (right) calculated by “Estimate” (Mann–Whitney Wilcoxon test,p < 0.05). The y-axis shows each “Estimate” score. When p < 0.05, the asterisk increases with each zero digit; for example,*** for p < 0.0001.

Cancers 2021, 13, 733 6 of 17
2.3. The High-Immune Core Cluster Showed Increased Expression of Immune Checkpoints
We next examined the differences in the expression of individual genes betweenClusters A and B. The comparison of expression profiles revealed 3997 protein-codinggenes and 1910 non-coding genes that were differentially expressed between the twoclusters (Figure S4). The expression levels of known regulators of EMT, such as DST,SNAI1, and SNAI2, are shown in Figure 3a. We also evaluated the expression of immunegenes and those encoding immune check-point molecules such as PD-1, PD-L1, CD8A,CTLA4, LAG3, TIGIT, TIM-3, PD-L2, IFNG, CD4, CD45, CD3E, CD163, TGFB1, IL10, andFOXP3, and found that these genes were significantly upregulated in Cluster B (p < 0.02 byMann–Whitney U test, Figure 4a and Figure S5). This result suggests that GBCs in ClusterB are immunologically ‘hot’ tumors. However, many immunosuppressive cell markerssuch as FOXP3 (Treg) and CD163 (M2 macrophage) and immunosuppressive cytokinessuch as IL-10 and TGFB1 were also upregulated in Cluster B, indicating the complicatedimmune microenvironment of GBC tissues [15,16].
Figure 3. Expression of stroma-related genes in GBCs. (a) Comparison of the expression of stroma-related genes (SNAI1,SNAI2, DST, miRNA125b1, and miRNA1245A) between the two clusters in fragments per kilobase of exon per millionfragments mapped (FPKM; Mann–Whitney Wilcoxon test, p < 0.05). The y-axis shows FPKM of each gene. When p < 0.05,the asterisk increases with each zero digit; for example, *** for p < 0.0001. (b) Vimentin immunostaining. Ratio of the areaof the positive cells/tumor cells was used to calculate stromal ratio in tumors (p = 0.0003308 by Mann–Whitney U test).(c) Vimentin immunostaining in the representative GBC tissues in Cluster A (left) and Cluster B (right). Positive cells arebrown in color. Each sample was observed with a 4× objective lens.

Cancers 2021, 13, 733 7 of 17
Figure 4. Expression of immune genes in GBCs. (a) Comparison of immune genes (PD-1, PD-L1, CD8A, CTLA4, LAG3,TIGIT, and TIM-3) between the two clusters in FPKM (* Mann–Whitney Wilcoxon test, p < 0.05). The y-axis shows the FPKMof each gene. When p < 0.05, the asterisk increases with each zero digit; for example, *** for p < 0.0001. (b) The number ofCD8-positive cells at “hot spot” areas within the same magnification (p = 0.03876 by Mann–Whitney U test). (c) The numberof TIM-3-positive cells at “hot spot” areas within the same magnification (p = 0.02766 by Mann–Whitney U test). (d) CD8immunostaining in the “hot spots” of the representative GBC tissues in Cluster A (left) and Cluster B (right). Positive cellsare brown in color. Each sample were observed with a 10× objective lens. (e) TIM-3 immunostaining in the “hot spots” ofrepresentative GBC tissues in Cluster A (left) and Cluster B (right). Each sample was observed with a 10× objective lens.

Cancers 2021, 13, 733 8 of 17
2.4. Immunostaining of Stromal Markers and Immune Cells in GBCs
To validate these stromal and immune reaction markers of GBCs, we performedimmunostaining for vimentin, CD8, and T-cell immunoglobulin mucin-3 (TIM-3) on 35formalin-fixed paraffin-embedded (FFPE) GBC slides obtained from the same patientsand compared the expression of markers between Clusters A and B. Vimentin is a markerof mesenchymal-derived cells and cancer-associated fibroblasts (CAFs), which involve acancer stromal component and TME [17]. Immunohistochemical staining for vimentinshowed positive staining for stromal cells, not tumor cells, and significantly higher vimentinexpression in GBCs of Cluster B than in GBCs of Cluster A (p = 0.0003308 by Mann–WhitneyU test, Figure 3b,c). This observation correlated well with the calculated stromal score byRNA-seq.
CD8 is a maker of cytotoxic T lymphocytes [18], while TIM-3 indirectly suppresseseffector T-cell activity by acting on myeloid-derived suppressor cells, Tregs, and dendriticcells [19,20]. We counted the number of positively stained cells at “hot spots” and foundmore positive cells near the tumor cells. We also confirmed that Cluster B samples hadmore CD8- and TIM-3-positive cells than Cluster A samples (p = 0.03876 and 0.02766by Mann–Whitney U test, respectively) (Figure 4b,c), consistent with the computationalestimates of RNA expression results and immune scores. Many of these positive im-mune cells were present in the stroma close to the tumor cells and were often solidified(Figure 4d for CD8 and Figure 4e for TIM-3).
2.5. Non-Coding RNAs Are Involved in the Invasion and EMT of GBCs
We sequenced both coding and ncRNAs of GBCs after rRNA depletion (See Methods)and found 437 ncRNAs that were significantly differentially expressed between ClustersA and B (FDR < 0.0001). Furthermore, 24 genes with an FDR of <0.000001 and a logfold change (FC) of >3.9 were noted. Among microRNAs, miR125B1 had the smallestFDR, followed by miR1245A (Table S4). The expression of miR125B1 and miR1245A wassignificantly upregulated in Cluster B (p < 0.0000001 by Mann–Whitney U test) (Figure 3a);the expression of miR125B1 and miR1245A largely differed between the two clusters (logFC = 4.9 and 3.9, respectively).
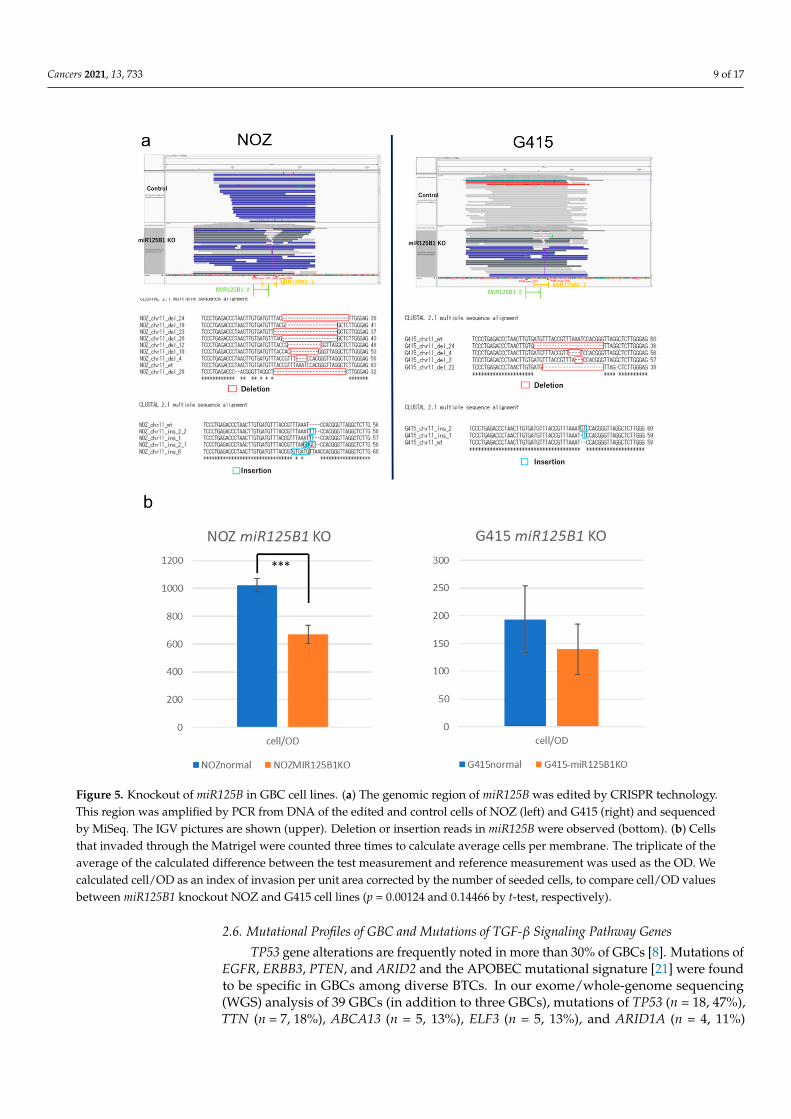
To examine the biological significance of these miRNAs in GBC, we performed inva-sion and growth assays following knockout of these miRNAs in two GBC cell lines, NOZand G415. These miRNAs in GBC cells were edited by CRISPR-Cas9 technology, and theedited cells were enriched by fluorescence-activated cell sorting (FACS) (Figure S6a,b).Editing of the target miRNAs was confirmed by polymerase chain reaction (PCR) andamplicon sequencing, which showed miR125B1 gene had deletions or insertions in editedNOZ cells and G415 cells (Figure 5a), but miR1245A had no change. We observed thatthe invasion ability of NOZ cells was significantly reduced following miR125B1 knockout(p = 0.00124 by t-test) (Figure 5b left and Figure S6c). G415 cells also showed a trend ofreduction in their invasion ability (p = 0.14466, by t-test) (Figure 5b right). These resultssuggest that the inhibition of the non-coding gene miR125B1 may result in the attenuationof the invasive potential of GBC cells and that miR125B1 could involve the EMT of GBCs.
We further performed RNA-seq of NOZ and G415 cells with miR125B1 knockoutand analyzed the changes in the expression of RNAs. The single-sample GSEA (ssGSEA)analysis demonstrated the reduced activity of the genes involved in EMT and inflammatoryresponse (Table S5), consistent with the reduced invasion ability of GBC cells followingmiR125B knockout.
Cancers 2021, 13, 733 9 of 17
Figure 5. Knockout of miR125B in GBC cell lines. (a) The genomic region of miR125B was edited by CRISPR technology.This region was amplified by PCR from DNA of the edited and control cells of NOZ (left) and G415 (right) and sequencedby MiSeq. The IGV pictures are shown (upper). Deletion or insertion reads in miR125B were observed (bottom). (b) Cellsthat invaded through the Matrigel were counted three times to calculate average cells per membrane. The triplicate of theaverage of the calculated difference between the test measurement and reference measurement was used as the OD. Wecalculated cell/OD as an index of invasion per unit area corrected by the number of seeded cells, to compare cell/OD valuesbetween miR125B1 knockout NOZ and G415 cell lines (p = 0.00124 and 0.14466 by t-test, respectively).
2.6. Mutational Profiles of GBC and Mutations of TGF-β Signaling Pathway Genes
TP53 gene alterations are frequently noted in more than 30% of GBCs [8]. Mutations ofEGFR, ERBB3, PTEN, and ARID2 and the APOBEC mutational signature [21] were foundto be specific in GBCs among diverse BTCs. In our exome/whole-genome sequencing(WGS) analysis of 39 GBCs (in addition to three GBCs), mutations of TP53 (n = 18, 47%),TTN (n = 7, 18%), ABCA13 (n = 5, 13%), ELF3 (n = 5, 13%), and ARID1A (n = 4, 11%)

Cancers 2021, 13, 733 10 of 17
were frequently noted (Figure 6a). Considering the differences between Clusters A andB, ARID1A was observed in four cases (11%) and DST and ERBB3 in three cases (8%)specifically in Cluster B; however, the difference was not statistically significant. Basedon the oncogenic signaling pathways revealed from The Cancer Genome Atlas (TCGA),we found that the mutations of the genes related to the TGF-β signaling pathway wereenriched in Cluster B (Figure 6b). In total, 71% TGF-β signaling genes in Cluster B (5 of7 related genes; ACVR1B, ACVR2A, SMAD2, SMAD3, SMAD4, TGFBR1, TGFBR2) and28% in Cluster A (2 of 7) were mutated. ELF3 is also reported to be associated with theTGF-β signaling pathway and EMT in some cancers [22]. On the other hand, the numberof affected genes of the RTK–RAS and WNT signaling pathways were 20% (17 of 85 relatedgenes) and 8.9% (6 of 68 related genes), respectively. These genomic and transcriptomicanalyses suggest that the TGF-β signaling pathway and EMT are likely to drive GBCdevelopment and aggressiveness in Cluster B.
Figure 6. Mutational profiles of GBCs. (a) Landscape of somatic mutations of 39 GBCs in ClustersA and B. Three samples had no RNA-seq data and were not classified. Single nucleotide variations(SNVs)/INDELs across 39 GBC patients with different mutation types are coded by different colors.The upper panel shows the somatic mutation number per Mb. (b) Fraction of pathways affected; thisfigure was prepared from the number of related genes in each cluster. Each pathway-related geneset was used, as revealed from The Cancer Genome Atlas (TCGA). In total, 5 of 7 (71.4%) and 2 of 7(28.6%) genes related to the TGF-β pathway from Cluster B and A had mutations, respectively.

Cancers 2021, 13, 733 11 of 17
We analyzed the mutation profiles of 13 WGS and 26 exome sequences of GBCs anddetected 28 types of COSMIC mutational signatures [23]. Of these, 23 GBCs showedCOSMIC Sig2 and Sig13 abundance recognized as APOBEC signatures [24,25], and foursamples had high amounts of APOBEC signatures (over 0.3) (Figure S7a). Only one GBC(HK94) had a particularly large number of somatic mutations (1751 single nucleotidevariations (SNVs)) and showed a high abundance of APOBEC signatures (COSMIC Sig2was 0.678 and Sig13 was 0.313) (Figure S7b). However, no somatic variation or tran-scriptomic change in APOBEC genes (APOBEC3A, APOBEC3B, APOBEC3C, APOBEC3D,APOBEC3F, APOBEC3G, and APOBEC3H) [25] was observed in this sample, indicatingthat the unknown factor involves the mutagenesis of APOBEC signatures in GBCs. Thesefindings indicate that APOBEC signatures and the underlying mutagenesis may play someimportant roles in GBC development.
2.7. Copy Number Variants (CNVs) and Fusion Events in GBCs
We analyzed CNVs from 11 WGS and 26 whole-exome sequences’ data using Sequenza.GISTIC2 analysis revealed the gain in the copy numbers of 1p36.33, 7q22.1, 17q12, and19q12 regions in GBCs (Figure S8a). These copy number gains were not significantly relatedto patient prognosis, although a trend (p = 0.1) of short overall survival was noted with19q12 gain that includes the CCNE1 gene [26,27] (Figure S8b).
Fusion genes in cancer are generated through somatic structure variants (SVs) andmay serve as important therapeutic targets [28]. FGFR 2/3 gene fusion has been reported inseveral tumor types, including intrahepatic cholangiocarcinoma, and these fusion eventsconfer sensitivity to fibroblast growth factor receptor (FGFR) inhibitors [29]. RNA-seqanalysis revealed many types of fusion events in GBCs. A GBC sample was found toexhibit TARDBP–FGFR3 gene fusion, which was supported by more than 3000 reads(Figure S9). The expression level of FGFR3 transcript in this tumor was much higherthan that detected in other 35 cases (about 200 times in FPKM), indicating that it mayconstitutively activate FGFR3 by changing its regulatory domain. C15orf57–CBX3 fusion(11 cases; 30.6%) induced by SV at Chr15–Chr7 and GAPDH–GPBP1 fusion (3 cases; 8.3%)induced by SV at Chr12–Chr5 were recurrently detected in GBCs. C15orf57–CBX3 fusionwas observed in 22.7% of HCCs, glioblastomas, melanomas, and lymphomas [30], althoughits functional significance is yet unknown.
3. Discussion
In the present study, we analyzed the comprehensive transcriptome and genome ofGBCs in addition to HBDCs, which are anatomically close to and sometimes difficult todiscriminate from CDCs or GBCs [13]. As a result, no large differences were observedbetween the transcriptomic profiles of GBCs and HBDCs (Figure S1). On the other hand,the transcriptome analysis classified GBCs into two subgroups based on the expression ofthe genes related to TME (stroma and inflammation). Cluster B, with higher abundance andactivity of TME, showed poorer prognosis than Cluster A. One of the typical features of BTCand GBC is the highly desmoplastic microenvironment rich in the fibrogenic connectivetissue [31]; thus, TME evolves together with the tumor mass, thereby restricting the deliveryof several drugs [32]. Stromal fibroblasts from TME have been known to play tumor-supportive and -suppressive roles by dysregulating the wound-healing response [33]. Inpancreatic cancer, some substances secreted by stromal cells stimulate cancer cell migrationand invasion, inhibit apoptosis, and increase resistance to chemotherapy and radiation [34].Advanced GBCs in Cluster B were similar to pancreatic cancer in terms of TME-rich tumor,and thus may be resistant to chemotherapies. Stromal components in TME were alsoconsidered to prevent the immune cell-mediated attack on tumor cells [35]. Some clinicaltrials have been conducted on emerging immuno-checkpoint inhibitors for BTC and GBCtreatment, and their efficacy or benefits are expected in patients with advance tumors withimmunologically “hot” and high tumor mutation burden [36]. However, our study showsthat many immunosuppressive mechanisms, such as Tregs, M2 macrophages, IL-10, and

Cancers 2021, 13, 733 12 of 17
TGFB1, were activated in GBCs of Cluster B, and whether only programmed cell death-1(PD-1) blockade was effective or combination immunotherapies with TME modificationare essential is yet questionable [36,37].
In this study, we analyzed the expression of ncRNAs that can affect the TME in GBCin addition to coding genes related to EMT or TGF-β. For instance, miR-100 and miR125Bexpression was associated with TGF-β in pancreatic ductal adenocarcinoma and foundto be upregulated in patients with poor prognosis [38]. Invasion assay results using GBCcells suggest that the inhibition of miR125B1 may reduce the invasion ability of cells. AsmiR125B1 upregulates EMT via TGF-β signaling [38], this result suggests that the inhibitionof miR125B1 may reduce EMT and cell invasion. The increase of stroma and vimentin-positive stromal cells of Cluster B GBCs indicates that fibroblasts in the stroma are inducedto CAFs by various crosstalk between cancer cells and stromal cells in TME, includinginflammation and the TGF-β and EMT pathways; then, this crosstalk in TME inducescancer aggressiveness and worse prognosis [39]. So, decreased invasion ability in cancercells with miR125B1 knockout means biologically decreased activity of the EMT pathway incancer cells. Hence, miR125B1 may be a new therapeutic target of BTC or a poor prognosticfactor, because its expression was remarkably upregulated in Cluster B. The expression ofmiR1245A was similarly upregulated in Cluster B but had no effect on the invasion abilityof cells, which was confirmed by the experiments with edited cells. This result is consistentwith the fact that miR1245A is associated with DNA repair and cell apoptosis [40] and hadno effect on cell invasion and EMT. However, it may serve as a biomarker of poor prognosisin GBC.
Genomic analysis revealed more mutations of the TGF-β signaling pathway in ClusterB than in Cluster A, in addition to the upregulation in the expression of the TGF-β signalingpathway genes in Cluster B, as evident from GSEA. Alteration of the TGF-β signalingpathway induces EMT and increases tumor aggressiveness and is central to immunesuppression within TME [14,41]. GBCs in Cluster B expressed many types of immunecheckpoints or suppressor molecules, such as PD-1, CTLA4, and TIM-3. Further, thefunction of CD8+ effector T cells was suppressed, although these cells were abundantlypresent in the stroma. The TGF-β signaling pathway plays a central role in the poorprognosis and high aggressiveness of GBCs, and it is possible that therapeutics targetingthe TGF-β signaling pathway would be effective for GBC treatment [42].
In summary, this gene clustering analysis of 36 GBCs reveals there is a subgroup witha poor prognosis even at early stages, and it is characterized as TME-rich GBCs, whichhave the increased expression of EMT-related genes and TGF-β pathway alterations. Thisdemonstrated that TME, EMT, and TGF-β pathway alterations are the main drivers ofGBC. The limitation of this study is that the sample size of GBCs was still not large enough,and considering the racial difference of GBC etiology [1,42], we should analyze more GBCsamples from diverse populations, including European and African populations, whereGBC is very rare.
4. Materials and Methods4.1. Patients and Samples
We obtained 37 fresh-frozen and two PAXgene®-embedded tumor specimens frompatients with GBCs and BTCs who underwent surgery at the Hokkaido University Hospitalbetween 2004 and 2018. Clinical features of 39 patients with GBC and 8 HBDCs are shownin Table S1. DNA of 38 GBCs samples was sequenced in our previous paper [21]; however,we called their mutations by different methods. RNA and DNA were extracted from allcells taken from the surface to the invasive area in tumor blocks. All patients providedwritten informed consent, and the study was approved by the institutional review boardsof Hokkaido University and RIKEN.

Cancers 2021, 13, 733 13 of 17
4.2. Library Preparation and DNA or RNA Sequencing
Exome capture technique was performed using Nextera Rapid Capture Exomes kits(Illumina, San Diego, CA, USA). For WGS, the DNA was extracted from cancer and normaltissues and 500–600-bp insert libraries were prepared according to the protocol provided byIllumina. The exome-captured or WGS libraries were sequenced on HiSeq2500 with pairedreads of 125 bp or NovoSeq6000 with paired reads of 150 bp. Total RNA was extracted from37 fresh-frozen tumor specimens; one sample was excluded from RNA sequencing, owingto its very low RNA integrity number (RIN) score. We used the KAPA RNA HyperPrep Kitwith RiboErase (Illumina, San Diego, CA, USA) for RNA-seq library preparation. Poly(A)selection, cDNA synthesis, and library construction were performed according to themanufacturer’s protocols. Sequencing was carried out on the HiSeq2500 platform, andSTAR aligner (ver. 2.5.3a, https://github.com/alexdobin/STAR, accessed on 1 December2020) was used to map RNA-seq reads onto the reference human genome GRCh37. ThefeatureCounts (https://rdrr.io/bioc/Rsubread/man/featureCounts.html, accessed on 1December 2020) software was employed to count reads per gene using GENCODE release19 as gene model. FPKM was computed using an in-house R script.
4.3. Statistical Analysis
Kaplan–Maier survival analysis, Cox proportional hazard regression analysis, andMann–Whitney U-test were performed via the R packages Survival and Coin.
4.4. GSEA
The h.all.v6.2.sytmbols.gmt in the Molecular Signatures Database (MSigDB) wasselected as the reference gene set, and an FDR-adjusted value of <0.25 was chosen as thecut-off criterion. ssGSEA for knockout (KO) cell lines was performed using GenePatternssGSEA projection (https://www.genepattern.org/, accessed on 1 December 2020) asthe reference gene set of MSigDB (https://data.broadinstitute.org/gsea-msigdb/msigdb/release/7.1, accessed on 1 December 2020).
4.5. SNV, INDELs, and Fusion Calling
For the analysis of SNV and INDELs, the Genomon2 (ver2.6.1, https://genomon.readthedocs.io/ja/v2.6.1/, accessed on 1 December 2020). Fisher mutation call was em-ployed. The minimum depth for the mutation call was 8, while the minimum map qualitywas 20; the minimum base quality was 15. Variants with less than 3 reads were filtered.The disease minimum allele frequency chosen for our study was 0.05, while the controlmaximum allele frequency was 0.1. The Fisher mutation call threshold was set to 0.05. Thedetected variants were annotated using ANNOVAR [43] and summarized and visualizedusing the R package Maftools (https://doi.org/doi:10.18129/B9.bioc.maftools, accessed on1 December 2020) [44].
Exome sequencing and WGS data were processed as follows: After alignment of readsusing BWA [45], PCR duplicates were removed using Picard (http://picard.sourceforge.net/, accessed on 1 December 2020), and SNVs and Indels were detected using Genomon2.RNA sequence fusion was detected using Genomon2.
4.6. DNA Copy Number Analysis
For analysis of CNVs from exome sequencing and WGS, we used the R package Sequenza(https://cran.r-project.org/web/packages/sequenza/vignettes/sequenza.html, accessed on1 December 2020). Copy number alterations were analyzed using GISTIC2 (ver7, https://www.genepattern.org/modules/docs/GISTIC_2.0, accessed on 1 December 2020).
4.7. Immunohistochemistry
Tissue sections were deparaffinized in xylene and rehydrated in graded ethanol series.Heat-induced antigen retrieval was performed in a high- or low-pH antigen retrieval buffer(DakoCytomation, Glostrup, Denmark). Endogenous peroxidase activity was blocked

Cancers 2021, 13, 733 14 of 17
by incubation of tissue sections in 3% hydrogen peroxide for 5 min. Primary antibodiesagainst CD8 (1:500, IR6231-2; Dako), vimentin (1:500, IR63061-2J; Dako), and TIM-3 (1/400,AF2365, R&D Systems) were applied for 30 min. The sections were visualized using thehorseradish peroxidase (HRP)-labeled polymer method (EnVision FLEX System, Dako).Immunostained sections were counterstained with hematoxylin, dehydrated in ethanol,and cleared in xylene.
4.8. Cell Culture
The NOZ (PRID: CVCL_3079) cell line was purchased from the Japanese Collectionof Research Bioresources (JCRB) Cell Bank (Tokyo, Japan) in 2019, and the G415 (PRID:CVCL_8198) cell line was obtained from the RIKEN BRC Cell Bank (Japan)/Tohoku Uni-versity in 2019. NOZ cells were maintained in William’s medium E supplemented with10% fetal bovine serum, penicillin (100 U/mL), and streptomycin (100µg/mL; ThermoFisher Scientific, Waltham, MA, USA). G-415 cells were cultured in Roswell Park Memo-rial Institute (RPMI)-1640 medium supplemented with 10% fetal bovine serum, penicillin(100 U/mL), and streptomycin (100µg/mL). Both cell lines were incubated in the pres-ence of 5% circulating CO2 at 37 ◦C. All experiments were performed with mycoplasma-free cells.
4.9. Generation of CRISPR-Cas9-Mediated KO Cell Lines
The single-guide RNAs (sgRNAs) for CRISPR-mediated KO cell line generation weredesigned using the CRISPR design tool (https://crispr.dbcls.jp/, accessed on 1 December2020). Oligonucleotides were synthesized by Integrated DNA Technologies (IDT) and theirsequences are provided in Table S6. We introduced the CRISPR protein (Alt-R® S.p. Cas9Nuclease V3, IDT, Redwood City, CA, USA) and sgRNAs by electroporation method usingthe protocol provided by IDT. The setting for electroporation was provided by LONZA(DN100). We also simultaneously introduced ATTO550 transactivating RNA (trRNA), anRNA molecule labeled with a fluorescent dye, into cells with CRISPR and enriched thefluorescently labeled cells using FACS. After enrichment, cells were incubated at 37 ◦Cin a 5% CO2 incubator for 48 h. DNAs and RNAs were extracted from transfected cellsand evaluated for genomic locus edit by CRISPR-Cas9 using PCR primers. The sequencewas indicated in Table S6. The mutations edited by CRISPR were confirmed by ampliconsequencing in MiSeq sequencer (Illumina, San Diego, CA, USA).
4.10. Invasion and Cell Viability Assays
The invasion assay was performed using Corning® BioCoat™ Matrigel® InvasionChamber (CORNING, Glendale, AZ, USA. 24-well plates, 8.0 microns). Cell lines withoutprestarvation treatment were cultured for 24 h at 37 ◦C in a 5% CO2 incubator, fixed, andstained using Diff-Quik (Sysmex, Kobe, Japan) following the manufacturer’s protocols. Cellviability was evaluated using the Cell Counting Kit-8 (DOJINDO, Kumamoto, Japan) as perthe manufacturer’s protocol. After incubation, absorbance was measured at 450 nm/620 nmusing a microplate reader. The triplicate of the average of the calculated difference betweenthe test measurement and reference measurement was used as the OD. We calculatedcell/OD as an index of invasion per unit area corrected by the number of seeded cells. Themembrane was imaged by dividing it into four pieces under a 4× objective lens, and thenumber of cells was counted.
4.11. RNA-Seq Analysis of the KO Cells
The RNA was extracted from 70–80% confluent cells by RNeasy Plus Mini Kit®
(QIAGEN, Venlo, The Netherlands), and the KAPA RNA HyperPrep Kit with RiboErase(Illumina, San Diego, CA, USA) was used for RNA-seq library preparation. Librarysequencing and analysis were performed in the same manner as RNA extraction fromtissues.
Cancers 2021, 13, 733 15 of 17
4.12. Data Deposition
WGS and exome sequencing data in this study were deposited in NBDC (National Bio-science Database Center) under the accession numbers JGAD00000000117, JGAD00000000118,hum0103, and hum0158. RNA-seq data in this study were deposited in DDBJ (DNA DataBank of Japan) Center under the accession numbers SAMD00254734–SAMD00254781.
5. Conclusions
This comprehensive analysis demonstrated that TME, EMT, and TGF-β pathwayalterations are the main drivers of GBC and provides a new classification of GBCs basedon the status of TME, which is involved with EMT and immune suppression for poorprognosis of GBC. This information may be useful for GBC prognosis and therapeuticdecision-making.
Supplementary Materials: The following are available online at https://www.mdpi.com/2072-6694/13/4/733/s1, Figure S1: Hierarchical clustering analysis of protein-coding genes from 20Gallbladder body and neck cancer (GBBCs), 16 Cystic duct cancer (CDSs), 8 Hilar bile duct cancer(HBDCs), and 4 normal gallbladders. Heatmap clustering of differentially expressed protein-codinggenes, Figure S2: figure legend, Disease-free survival (DFS) and overall survival (OS) of 36 GBCs,classified as pathological T, lymph node metastasis +/−, and GBBDs (Gallbladder body and neckcancer) /CDCs (Cystic duct cancer)in this study, Figure S3: Heatmap shows the expression ofEMT-related gene sets (198 genes) for GSEA and clustering, Figure S4: Comparison of the volcanoplots of protein-coding and non-coding genes between the two clusters, Figure S5: Comparisonof the expression of immune genes (PD-L2, IFNG, CD4, CD45, CD3E, CD163, TGFB1, IL10, andFOXP3) between the two clusters in FPKM (* Mann-Whitney Wilcoxon test, p< 0.05), Figure S6:Knockout of miR125B1 in GBC cell lines, Figure S7: Mutational signatures of GBCs,. Figure S8:Copy number changes of GBCs, Figure S9: TARDBP-FGFR3 gene fusion was detected in one sample(HK97), Table S1: Clinical features of 39 patients with GBC and 8 with HBDC in this study, Table S2:Comparison of the pathological stages (pTand pN) between Cluster A/B (upper) by Fisher’s exacttest, and their associations with DFS and OS of GBC patients by Cox proportional hazard regressionanalysis (lower), Table S3: Hallmark gene sets upregulated in Cluster B (FDR < 0.25), Table S4: Thelist of 24 non-coding genes significantly differentially expressed between Clusters A and B withFDR <0.000001 and a log fold change (FC) >3.9, including microRNAs, Table S5: The ssGSEA scoresof NOZ and G415 cells edited by CRISPR and score change ratio of the Hallmark signal activity, TableS6: Oligonucleotides sequences for sgRNA(upper)and PCR(bottom)primers used in this study.
Author Contributions: Study concept and design: H.N. Acquisition of clinical samples: T.N. and S.H.Acquisition of data: N.E., M.F., Y.O., A.O.-T., K.M., H.T., S.M., and H.N. Analysis and interpretationof data: N.E., M.F., and H.N. Pathological analysis: N.E., Y.H., and T.M. Cell analysis: N.E., A.O.-T.,and S.S. Drafting of the manuscript: N.E., M.F., and H.N. Critical revision of the manuscript forimportant intellectual content: all coauthors. Obtained funding: H.N. Study supervision: S.H. andH.N. All authors have read and agreed to the published version of the manuscript.
Funding: This work was partly supported by JSPS KAKENHI grant number JP18H04049 awardedto H.N.
Institutional Review Board Statement: The study was conducted according to the guidelines of theDeclaration of Helsinki, and approved by the ethics committee of Hokkaido University Hospital(M18-003) and of RIKEN (protocol code Y2017-011 and date of approval).
Informed Consent Statement: In the present study, we aimed at patients who themselves providedinformed consent after receiving sufficient explanation. Informed consent was obtained from allsubjects involved in the study.
Data Availability Statement: WGS and exome sequencing data in this study were deposited inNBDC (National Bioscience Database Center) under the accession numbers JGAD00000000117,JGAD00000000118, hum0103, and hum0158. RNA-seq data in this study were deposited in DDBJ(DNA Data Bank of Japan) Center under the accession numbers SAMD00254734–SAMD00254781.

Cancers 2021, 13, 733 16 of 17
Acknowledgments: The authors acknowledge the laboratory members of the Department of Gas-troenterological Surgery II, Hokkaido University. The supercomputing resource ‘SHIROKANE’ wasprovided by the Human Genome Center, The University of Tokyo (http://supcom.hgc.jp/).
Conflicts of Interest: The authors declare no conflict of interest associated with this manuscript.
References1. Hundal, R.; Shaffer, E.A. Gallbladder cancer: Epidemiology and outcome. Clin. Epidemiol. 2014, 6, 99–109. [PubMed]2. Levy, A.D.; Rohrmann, C.A.; Murakata, L.A. Gallbladder Carcinoma: Radiologic-Pathologic Correlation. Radiographics 2001, 21,
295–314. [CrossRef] [PubMed]3. Yamaguchi, T. Current Status and Future of Chemotherapy for Cholangiocarcinoma. Available online: https://doi.org/10.11210
/tando.29.703 (accessed on 1 December 2020).4. Xu, S.; Zhan, M.; Jiang, C.; He, M.; Yang, L.; Shen, H.; Huang, S.; Huang, X.; Lin, R.; Shi, Y.; et al. Genome-wide CRISPR screen
identifies ELP5 as a determinant of gemcitabine sensitivity in gallbladder cancer. Nat. Commun. 2019, 10, 5492. [CrossRef][PubMed]
5. Li, M.; Zhang, Z.; Li, X.; Ye, J.; Wu, X.; Tan, Z.; Liu, C.; Shen, B.; Wang, X.A.; Wu, W.; et al. Whole-exome and targeted genesequencing of gallbladder carcinoma identifies recurrent mutations in the ErbB pathway. Nat. Genet. 2014, 46, 872–876. [CrossRef][PubMed]
6. Yang, P.; Javle, M.; Pang, F.; Zhao, W.; Abdel-Wahab, R.; Chen, X.; Meric-Bernstam, F.; Chen, H.; Borad, M.J.; Liu, Y.; et al. Somaticgenetic aberrations in gallbladder cancer: Comparison between Chinese and US patients. Hepatobiliary Surg. Nutr. 2019, 8,604–614. [CrossRef]
7. Pandey, A.; Stawiski, E.W.; Durinck, S.; Gowda, H.; Goldstein, L.D.; Barbhuiya, M.A.; Schroder, M.S.; Sreenivasamurthy, S.K.;Kim, S.W.; Phalke, S.; et al. Integrated genomic analysis reveals mutated ELF3 as a potential gallbladder cancer vaccine candidate.Nat. Commun. 2020, 11, 4225. [CrossRef] [PubMed]
8. Nakamura, H.; Arai, Y.; Totoki, Y.; Shirota, T.; Elzawahry, A.; Kato, M.; Hama, N.; Hosoda, F.; Urushidate, T.; Ohashi, S.; et al.Genomic spectra of biliary tract cancer. Nat. Genet. 2015, 47, 1003–1010. [CrossRef] [PubMed]
9. Peng, F.; Jiang, J.; Yu, Y.; Tian, R.; Guo, X.; Li, X.; Shen, M.; Xu, M.; Zhu, F.; Shi, C.; et al. Direct targeting of SUZ12/ROCK2 bymiR-200b/c inhibits cholangiocarcinoma tumourigenesis and metastasis. Br. J. Cancer 2013, 109, 3092–3104. [CrossRef] [PubMed]
10. Park, S.M.; Gaur, A.B.; Lengyel, E.; Peter, M.E. The miR-200 family determines the epithelial phenotype of cancer cells by targetingthe E-cadherin repressors ZEB1 and ZEB2. Genes Dev. 2008, 22, 894–907. [CrossRef]
11. Terashima, M.; Ishimura, A.; Wanna-Udom, S.; Suzuki, T. MEG8 long noncoding RNA contributes to epigenetic progression ofthe epithelial-mesenchymal transition of lung and pancreatic cancer cells. J. Biol. Chem. 2018, 293, 18016–18030. [CrossRef]
12. Jin, L.; Cai, Q.; Wang, S.; Wang, S.; Mondal, T.; Wang, J.; Quan, Z. Long noncoding RNA MEG3 regulates LATS2 by promoting theubiquitination of EZH2 and inhibits proliferation and invasion in gallbladder cancer. Cell Death Dis. 2018, 9, 1017. [CrossRef]
13. Nakanishi, Y.; Tsuchikawa, T.; Okamura, K.; Nakamura, T.; Noji, T.; Asano, T.; Tanaka, K.; Shichinohe, T.; Mitsuhashi, T.; Hirano,S. Clinicopathological features and prognosis of advanced biliary carcinoma centered in the cystic duct. HPB 2018, 20, 28–33.[CrossRef] [PubMed]
14. Goldmann, T.; Zissel, G.; Watz, H.; Dromann, D.; Reck, M.; Kugler, C.; Rabe, K.F.; Marwitz, S. Human alveolar epithelial cellstype II are capable of TGFbeta-dependent epithelial-mesenchymal-transition and collagen-synthesis. Respir. Res. 2018, 19, 138.[CrossRef]
15. Sun, W.; Wei, F.Q.; Li, W.J.; Wei, J.W.; Zhong, H.; Wen, Y.H.; Lei, W.B.; Chen, L.; Li, H.; Lin, H.Q.; et al. A positive-feedbackloop between tumour infiltrating activated Treg cells and type 2-skewed macrophages is essential for progression of laryngealsquamous cell carcinoma. Br. J. Cancer 2017, 117, 1631–1643. [CrossRef]
16. Takahashi, H.; Sakakura, K.; Toyoda, M.; Kaira, K.; Oyama, T.; Kudo, T.; Chikamatsu, K. Cancer-associated fibroblasts promote animmunosuppressive microenvironment through the induction and accumulation of protumoral macrophages. Oncotarget 2017, 5,8633–8647. [CrossRef] [PubMed]
17. Neuzillet, C.; Tijeras-Raballand, A.; Ragulan, C.; Cros, J.; Patil, Y.; Martinet, M.; Erkan, M.; Kleeff, J.; Wilson, J.; Apte, M.; et al.Inter- and intra-tumoural heterogeneity in cancer-associated fibroblasts of human pancreatic ductal adenocarcinoma. J. Pathol.2019, 248, 51–65. [CrossRef] [PubMed]
18. Plessers, J.; Dekimpe, E.; Van Woensel, M.; Roobrouck, V.D.; Bullens, D.M.; Pinxteren, J.; Verfaillie, C.M.; Van Gool, S.W.Clinical-Grade Human Multipotent Adult Progenitor Cells Block CD8+ Cytotoxic T Lymphocytes. Stem Cells Transl. Med. 2016, 5,1607–1619. [CrossRef]
19. Kurtulus, S.; Sakuishi, K.; Ngiow, S.F.; Joller, N.; Tan, D.J.; Teng, M.W.; Smyth, M.J.; Kuchroo, V.K.; Anderson, A.C. TIGITpredominantly regulates the immune response via regulatory T cells. J. Clin. Investig. 2015, 125, 4053–4062. [CrossRef]
20. Toor, S.M.; Sasidharan Nair, V.; Pfister, G.; Elkord, E. Effect of pembrolizumab on CD4(+) CD25(+), CD4(+) LAP(+) and CD4(+)TIM-3(+) T cell subsets. Clin. Exp. Immunol. 2019, 196, 345–352. [CrossRef]
21. Wardell, C.P.; Fujita, M.; Yamada, T.; Simbolo, M.; Fassan, M.; Karlic, R.; Polak, P.; Kim, J.; Hatanaka, Y.; Maejima, K.; et al.Genomic characterization of biliary tract cancers identifies driver genes and predisposing mutations. J. Hepatol. 2018, 68, 959–969.[CrossRef]

Cancers 2021, 13, 733 17 of 17
22. Ng, A.Y.; Waring, P.; Ristevski, S.; Wang, C.; Wilson, T.; Pritchard, M.; Hertzog, P.; Kola, I. Inactivation of the transcription factorElf3 in mice results in dysmorphogenesis and altered differentiation of intestinal epithelium. Gastroenterology 2002, 122, 1455–1466.[CrossRef]
23. Alexandrov, L.B.; Nik-Zainal, S.; Wedge, D.C.; Aparicio, S.A.; Behjati, S.; Biankin, A.V.; Bignell, G.R.; Bolli, N.; Borg, A.;Borresen-Dale, A.L.; et al. Signatures of mutational processes in human cancer. Nature 2013, 500, 415–421. [CrossRef] [PubMed]
24. McGrath, E.; Shin, H.; Zhang, L.; Phue, J.N.; Wu, W.W.; Shen, R.F.; Jang, Y.Y.; Revollo, J.; Ye, Z. Targeting specificity of APOBEC-based cytosine base editor in human iPSCs determined by whole genome sequencing. Nat. Commun. 2019, 10, 5353. [CrossRef][PubMed]
25. Roberts, S.A.; Lawrence, M.S.; Klimczak, L.J.; Grimm, S.A.; Fargo, D.; Stojanov, P.; Kiezun, A.; Kryukov, G.V.; Carter, S.L.; Saksena,G.; et al. An APOBEC cytidine deaminase mutagenesis pattern is widespread in human cancers. Nat. Genet. 2013, 45, 970–976.[CrossRef]
26. Ayhan, A.; Kuhn, E.; Wu, R.C.; Ogawa, H.; Bahadirli-Talbott, A.; Mao, T.L.; Sugimura, H.; Shih, I.M.; Wang, T.L. CCNE1copy-number gain and overexpression identify ovarian clear cell carcinoma with a poor prognosis. Mod. Pathol. 2017, 30, 297–303.[CrossRef]
27. Zhao, H.; Wang, J.; Zhang, Y.; Yuan, M.; Yang, S.; Li, L.; Yang, H. Prognostic Values of CCNE1 Amplification and Overexpressionin Cancer Patients: A Systematic Review and Meta-analysis. J. Cancer 2018, 9, 2397–2407. [CrossRef] [PubMed]
28. Smith, J.L.; Ries, R.E.; Hylkema, T.; Alonzo, T.A.; Gerbing, R.B.; Santaguida, M.T.; Eidenschink Brodersen, L.; Pardo, L.; Cummings,C.L.; Loeb, K.R.; et al. Comprehensive Transcriptome Profiling of Cryptic CBFA2T3-GLIS2 Fusion-Positive AML Defines NovelTherapeutic Options: A COG and TARGET Pediatric AML Study. Clin. Cancer Res. 2020, 26, 726–737. [CrossRef]
29. Frattini, V.; Pagnotta, S.M.; Tala; Fan, J.J.; Russo, M.V.; Lee, S.B.; Garofano, L.; Zhang, J.; Shi, P.; Lewis, G.; et al. A metabolicfunction of FGFR3-TACC3 gene fusions in cancer. Nature 2018, 553, 222–227. [CrossRef]
30. Zhu, C.; Wu, L.; Lv, Y.; Guan, J.; Bai, X.; Lin, J.; Liu, T.; Haohai, Z.; Yang, X.; Robson, S.C.; et al. The landscape of gene fusions inhepatocellular carcinoma. Mol. Oncol. 2019, 13, 1214–1222. [CrossRef]
31. Gentilini, A.; Pastore, M.; Marra, F.; Raggi, C. The Role of Stroma in Cholangiocarcinoma: The Intriguing Interplay betweenFibroblastic Component, Immune Cell Subsets and Tumor Epithelium. Int. J. Mol. Sci. 2018, 19, 2885. [CrossRef]
32. Zhao, J.; Xiao, Z.; Li, T.; Chen, H.; Yuan, Y.; Wang, Y.A.; Hsiao, C.H.; Chow, D.S.; Overwijk, W.W.; Li, C. Stromal ModulationReverses Primary Resistance to Immune Checkpoint Blockade in Pancreatic Cancer. ACS Nano 2018, 12, 9881–9893. [CrossRef]
33. Sherman, M.H.; Yu, R.T.; Tseng, T.W.; Sousa, C.M.; Liu, S.; Truitt, M.L.; He, N.; Ding, N.; Liddle, C.; Atkins, A.R.; et al. Stromalcues regulate the pancreatic cancer epigenome and metabolome. Proc. Natl. Acad. Sci. USA 2017, 114, 1129–1134. [CrossRef]
34. Xu, Z.; Pothula, S.P.; Wilson, J.S.; Apte, M.V. Pancreatic cancer and its stroma: A conspiracy theory. World J. Gastroenterol. 2014, 20,11216–11229. [CrossRef]
35. Kalluri, R. The biology and function of fibroblasts in cancer. Nat. Rev. Cancer 2016, 16, 582–598. [CrossRef]36. Ghidini, M.; Cascione, L.; Carotenuto, P.; Lampis, A.; Trevisani, F.; Previdi, M.C.; Hahne, J.C.; Said-Huntingford, I.; Raj, M.; Zerbi,
A.; et al. Characterisation of the immune-related transcriptome in resected biliary tract cancers. Eur. J. Cancer 2017, 86, 158–165.[CrossRef]
37. Vennin, C.; Murphy, K.J.; Morton, J.P.; Cox, T.R.; Pajic, M.; Timpson, P. Reshaping the Tumor Stroma for Treatment of PancreaticCancer. Gastroenterology 2018, 154, 820–838. [CrossRef]
38. Ottaviani, S.; Stebbing, J.; Frampton, A.E.; Zagorac, S.; Krell, J.; de Giorgio, A.; Trabulo, S.M.; Nguyen, V.T.M.; Magnani, L.; Feng,H.; et al. TGF-beta induces miR-100 and miR-125b but blocks let-7a through LIN28B controlling PDAC progression. Nat. Commun.2018, 9, 1845. [CrossRef]
39. Fiori, M.E.; Di Franco, S.; Villanova, L.; Bianca, P.; Stassi, G.; De Maria, R. Cancer-associated fibroblasts as abettors of tumorprogression at the crossroads of EMT and therapy resistance. Mol. Cancer 2019, 18, 70. [CrossRef]
40. Yang, L.; Wang, J.; Fan, Y.; Yu, K.; Jiao, B.; Su, X. Hsa_circ_0046264 up-regulated BRCA2 to suppress lung cancer through targetinghsa-miR-1245. Respir. Res. 2018, 19, 115. [CrossRef]
41. De Craene, B.; Berx, G. Regulatory networks defining EMT during cancer initiation and progression. Nat. Rev. Cancer 2013, 13,97–110. [CrossRef]
42. Schmidt, M.A.; Marcano-Bonilla, L.; Roberts, L.R. Gallbladder cancer: Epidemiology and genetic risk associations. Chin. Clin.Oncol. 2019, 8, 31. [CrossRef] [PubMed]
43. Wang, K.; Li, M.; Hakonarson, H. ANNOVAR: Functional annotation of genetic variants from high-throughput sequencing data.Nucleic Acids Res. 2010, 38, e164. [CrossRef]
44. Mayakonda, A.; Koeffler, H.P. Maftools: Efficient analysis, visualization and summarization of MAF files from large-scale cohortbased cancer studies. BioRXiv 2016. [CrossRef]
45. Li, H.; Durbin, R. Fast and accurate short read alignment with Burrows-Wheeler transform. Bioinformatics 2009, 25, 1754–1760.[CrossRef] [PubMed]