GRK3 is essential for metastatic cells and promotes prostate tumor progression
Upload
mdandersonCategory
view
0download
0
of November 26, 2013.This information is current as
MicroenvironmentPromotes Immune Evasion in the Tumor
LymphomaTumor Cells in Human Follicular Cross Talk between Follicular Th Cells and
and Sattva S. NeelapuFrancisco Vega, Nathan Fowler, Chen Dong, R. Eric DavisVeerabhadran Baladandayuthapani, Amber Luong, Sharma, David Delgado, Tina Chou, Heather Y. Lin,Durga Nattamai, Shibichakravarthy Kannan, Rakesh Seema Rawal, Fuliang Chu, Min Zhang, Hyun Jun Park,
http://www.jimmunol.org/content/190/12/6681doi: 10.4049/jimmunol.1201363May 2013;
2013; 190:6681-6693; Prepublished online 17J Immunol
MaterialSupplementary
3.DC1.htmlhttp://www.jimmunol.org/content/suppl/2013/05/17/jimmunol.120136
Referenceshttp://www.jimmunol.org/content/190/12/6681.full#ref-list-1
, 29 of which you can access for free at: cites 60 articlesThis article
Subscriptionshttp://jimmunol.org/subscriptions
is online at: The Journal of ImmunologyInformation about subscribing to
Permissionshttp://www.aai.org/ji/copyright.htmlSubmit copyright permission requests at:
Email Alertshttp://jimmunol.org/cgi/alerts/etocReceive free email-alerts when new articles cite this article. Sign up at:
Print ISSN: 0022-1767 Online ISSN: 1550-6606. Immunologists, Inc. All rights reserved.Copyright © 2013 by The American Association of9650 Rockville Pike, Bethesda, MD 20814-3994.The American Association of Immunologists, Inc.,
is published twice each month byThe Journal of Immunology
at Novartis G
lobal on Novem
ber 26, 2013http://w
ww
.jimm
unol.org/D
ownloaded from
at N
ovartis Global on N
ovember 26, 2013
http://ww
w.jim
munol.org/
Dow
nloaded from
at Novartis G
lobal on Novem
ber 26, 2013http://w
ww
.jimm
unol.org/D
ownloaded from
at N
ovartis Global on N
ovember 26, 2013
http://ww
w.jim
munol.org/
Dow
nloaded from
at Novartis G
lobal on Novem
ber 26, 2013http://w
ww
.jimm
unol.org/D
ownloaded from
at N
ovartis Global on N
ovember 26, 2013
http://ww
w.jim
munol.org/
Dow
nloaded from
at Novartis G
lobal on Novem
ber 26, 2013http://w
ww
.jimm
unol.org/D
ownloaded from
at N
ovartis Global on N
ovember 26, 2013
http://ww
w.jim
munol.org/
Dow
nloaded from
The Journal of Immunology
Cross Talk between Follicular Th Cells and Tumor Cells inHuman Follicular Lymphoma Promotes Immune Evasion inthe Tumor Microenvironment
Seema Rawal,*,† Fuliang Chu,*,† Min Zhang,*,† Hyun Jun Park,*,†,‡ Durga Nattamai,*,†
Shibichakravarthy Kannan,*,† Rakesh Sharma,*,† David Delgado,*,† Tina Chou,*,†
Heather Y. Lin,x Veerabhadran Baladandayuthapani,x Amber Luong,{ Francisco Vega,‖
Nathan Fowler,* Chen Dong,†,‡,# R. Eric Davis,*,†,‡ and Sattva S. Neelapu*,†,‡
The microenvironment of human follicular lymphoma (FL), an incurable B cell non-Hodgkin’s lymphoma, is thought to play
a major role in its pathogenesis and course. Microenvironmental cells of likely importance include follicular Th cells (TFH) and
regulatory T cells (Tregs), and understanding their interactions with FL tumor cells is necessary to develop novel therapeutic
strategies. We found that IL-4 and CD40L are expressed by intratumoral TFH and induce production of CCL17 and CCL22 by FL
tumor cells. IL-4 alone induces only CCL17 but enhances stimulation by CD40L of both CCL17 and CCL22. Consistent with our
in vitro results, mRNA transcripts of IL-4 correlated with CCL17, but not CCL22, in gene expression profiling studies of FL
biopsies, whereas CD40L correlated with both CCL17 and CCL22. Tumor supernatants induced preferential migration of Tregs
and IL-4–producing T cells rather than IFN-g–producing T cells, and Abs to CCR4 significantly abrogated the migration of Tregs.
Our results suggest that through two distinct mechanisms, intratumoral TFH induce production of CCL17 and CCL22 by FL
tumor cells and facilitate active recruitment of Tregs and IL-4–producing T cells, which, in turn, may stimulate more chemokine
production in a feed-forward cycle. Thus, TFH appear to play a major role in generating an immunosuppressive tumor micro-
environment that promotes immune escape and tumor survival and growth. Our results provide novel insights into the cross talk
among TFH, tumor cells, and Tregs in FL, and offer potential targets for development of therapeutic strategies to overcome
immune evasion. The Journal of Immunology, 2013, 190: 6681–6693.
Follicular lymphoma (FL) is the most common indolentB cell lymphoma (BCL) and comprises 22% of all non-Hodgkin’s lymphomas worldwide (1). FL is derived from
germinal center B cells and is characterized by hyperexpression ofthe antiapoptotic Bcl-2 oncoprotein as a consequence of the t(14;18) BCL2/JH translocation (2). However, the t(14;18) trans-location does not appear to be sufficient for lymphomagenesis,because B cells with the t(14;18) translocation can be found ina substantial proportion of healthy individuals (3, 4). Moreover,lymphomas develop in only 10–15% of transgenic mice in whichBCL2 expression was driven by an IgH enhancer (Em) (5).Therefore, growth factors such as cytokines and other protumorfactors present in the tumor microenvironment may be necessaryfor the pathogenesis and progression of FL (6). Recently, using
proteomic profiling of tumor lysates, Calvo et al. (7) found that IL-4 levels were significantly higher in FL tissues than in tissues from
follicular hyperplasia. Furthermore, they demonstrated increased
basal phosphorylation of downstream targets of IL-4, STAT6, andthe MAPK Erk in FL tissues as compared with benign follicular
hyperplasia in tonsils. Additional reports showed that follicular Th
cells (TFH) express high levels of IL-4 and CD40L mRNA in FLand may be involved in promoting the survival of tumor B cells
via IL-4 and CD40L (8, 9), consistent with other in vitro studies
(10, 11). Together, these reports suggest that IL-4 and CD40Lexpressed by TFH may act as protumor factors and may play a role
in the pathogenesis of FL.Evidence in the literature suggests that the FL tumor micro-
environment also contains antitumor factors (6). The indolent
*Division of Cancer Medicine, Department of Lymphoma and Myeloma, The Uni-versity of Texas MD Anderson Cancer Center, Houston, TX 77030; †Center forCancer Immunology Research, The University of Texas MD Anderson Cancer Cen-ter, Houston, TX 77030; ‡The University of Texas Graduate School of BiomedicalSciences, Houston, TX 77030; xDepartment of Biostatistics, The University of TexasMD Anderson Cancer Center, Houston, TX 77030; {Department of Otorhinolaryn-gology–Head and Neck Surgery, The University of Texas Medical School at Houston,Houston, TX 77030; ‖Department of Hematopathology, The University of Texas MDAnderson Cancer Center, Houston, TX 77030; and #Department of Immunology, TheUniversity of Texas MD Anderson Cancer Center, Houston, TX 77030
Received for publication May 15, 2012. Accepted for publication April 15, 2013.
This work was supported by the Doris Duke Charitable Foundation (S.S.N.), NationalInstitutes of Health Grant R01 CA155143 (to S.S.N. and R.E.D.), Lymphoma Special-ized Programs of Research Excellence (SPORE) Developmental Research Program(S.S.N. and R.E.D.), The University of Texas MDAnderson Cancer Center InstitutionalResearch Grant (to S.S.N.), and Leukemia and Lymphoma Society Specialized Centerof Research Grant 7262-08 (to C.D.). The University of Texas MD Anderson CancerCenter Lymphoma Tissue Bank is supported by the National Institutes of Health Lym-phoma SPORE Grant P50CA136411 and the Fredrick B. Hagemeister Research Fund.
The Flow Cytometry Core Facility is supported by The University of Texas MDAnder-son Cancer Center Support Grant CA16672 from the National Institutes of Health.
S.R. and S.S.N. designed the study, analyzed the data, and wrote the manuscript; S.R.,F.C., H.J.P., D.N., S.K., R.S., D.D., T.C., and C.D. designed or performed the experi-ments, or both; N.F. and A.L. provided patient samples; F.V. provided cell lines; H.Y.L.and V.B. performed statistical analyses; M.Z. and R.E.D. analyzed the gene expressionprofiling data; and all authors reviewed and approved the manuscript.
Address correspondence reprint requests to Dr. Sattva S. Neelapu, 1515 HolcombeBoulevard, Unit 903, The University of Texas MDAnderson Cancer Center, Houston,TX 77030. E-mail address: [email protected]
The online version of this article contains supplemental material.
Abbreviations used in this article: BCL, B cell lymphoma; FL, follicular lymphoma;FLIPI, Follicular Lymphoma International Prognostic Index; PFS, progression-freesurvival; siRNA, small interfering RNA; TFH, follicular Th cells; Treg, regulatoryT cell.
Copyright� 2013 by TheAmerican Association of Immunologists, Inc. 0022-1767/13/$16.00
www.jimmunol.org/cgi/doi/10.4049/jimmunol.1201363
at Novartis G
lobal on Novem
ber 26, 2013http://w
ww
.jimm
unol.org/D
ownloaded from

nature of FL (12), induction of spontaneous remissions in patientswho are observed without therapy (12), isolation of antitumorT cells from the tumor microenvironment (13, 14), and correlationof survival with the gene expression signature of tumor-infiltratingimmune cells in FL patients (15) all support the assertion thatantitumor factors are present in the tumor microenvironment inFL and suggest that FL is naturally immunogenic. Furthermore,the induction of antitumor immune responses in most FL pa-tients after idiotypic vaccination (16, 17), the high clinical re-sponse rates observed with the anti-CD20 mAb rituximab (18,19), and prolonged progression-free survival (PFS) after non-myeloablative allogeneic stem-cell transplantation (20) suggestthat FL is highly immune responsive. However, immunosup-pressive cells such as Foxp3+ regulatory T cells (Tregs) andmacrophages present in the FL tumor microenvironment maylimit the efficacy of antitumor immune responses that are bothnaturally and therapeutically induced, and thus may exert aprotumor effect (21). Consequently, the natural history of FL inpatients who are observed without therapy as well as clinicaloutcome of patients undergoing therapeutic intervention arelikely to depend on the relative dominance of the protumor andantitumor factors within the tumor microenvironment. Charac-terization of such factors and studying the dynamic interactionsbetween the tumor and microenvironmental cells are necessary toprovide a better understanding of the pathogenesis and course ofFL.Tregs are among the most potent suppressors of effector T cells
and other immune cells (22). Tregs have been shown to inhibitT cell responses against both foreign Ags and self-Ags such astumor Ags. Several reports have suggested that Tregs are in-creased in number in the tumor microenvironment of a variety ofhuman cancers including FL (22–26), and intratumoral Tregs fromBCL patients have been shown to inhibit the function of antitumorCD4+ and CD8+ T cells (23, 27, 28). Tregs may be increased innumber in FL via induction from conventional CD4+ T cells bythe tumor cells (26, 29, 30). Alternatively, Tregs may also beactively recruited to the tumor site by chemokine expression in thetumor microenvironment. In FL, CCL17 (thymus and activation-regulated chemokine) and CCL22 (macrophage-derived chemo-kine) produced by the tumor cells have been proposed to playa role in recruiting Tregs into the tumor microenvironment (23,30). However, the mechanism leading to the increased productionof these chemokines by FL tumor cells is unknown. CCL17 isconstitutively expressed by thymocytes, monocyte-derived den-dritic cells, and keratinocytes (31, 32), and CCL22 is constitu-tively expressed by macrophages, dendritic cells, keratinocytes,and epithelial cells (33). However, B cells are not known to con-stitutively express either of these chemokines.In this article, we demonstrate that CCL17 and CCL22 are
produced by tumor cells in FL as a result of cross talk with TFH.Furthermore, we show that these chemokines induce preferentialmigration of Tregs and IL-4–producing CD4+ T cells that, in turn,might stimulate more chemokine production, thus creating a vi-cious cycle and an immunosuppressive tumor microenvironmentthat promotes immune evasion and tumor survival and growth.These results provide novel insights into the role of TFH in im-mune evasion in FL and offer potential targets for the developmentof therapeutic strategies.
Materials and MethodsPatient samples
All blood and tissue samples were obtained after informed consentfrom patients through an Institutional Review Board–approved protocol.Lymph node biopsies were obtained from patients with FL at the time of
their initial diagnosis before therapy. Tonsils were obtained from chil-dren who had undergone elective tonsillectomy. The use of tonsils withbenign follicular hyperplasia as controls for FL has generally been ac-cepted in the scientific literature (7, 15, 34). Surgical samples werestored as formalin-fixed tissue sections in paraffin and/or processed intoa single-cell suspension and cryopreserved. Because of limited numberof cells obtained from each tumor or tonsil, the same samples could notbe used in all experiments. Altogether, 21 tumors and 14 tonsil sampleswere used for the various in vitro studies. Serum samples were obtainedfrom healthy donors and patients with FL at the time of their initialdiagnosis (Supplemental Table I). All FL patients were treated uni-formly with prednisone, doxorubicin, cyclophosphamide, and etoposidechemotherapy followed by autologous tumor-derived idiotype vacci-nation (16, 35).
Cell lines
Mantle cell lymphoma cell lines (Mino and Granta519), transformed FLcell lines that carry t(14;18) (RL, DHL-16, DOHH-2), diffuse large BCLcell lines (EJ-1 and SKI), germinal center B cell–derived diffuse largeBCL cell lines (SU-DHL-4, PFEIFFER, and TOLEDO), and Burkitt’slymphoma cell lines (Raji and Daudi) were cultured in RPMI 1640 sup-plemented with 10% FBS, 10 mM Hepes, 13 GlutaMAX, 50 mM 2-ME,1 mM sodium pyruvate, 100 U/ml penicillin + 100 mg/ml streptomycin,and 10 mg/ml gentamicin (all from Invitrogen) at 37˚C and 5% CO2 inair.
Reagents
CD3 allophycocyanin, CD4 PerCP-Cy5.5, CD8 PerCP-Cy5.5, CD10 allo-phycocyanin, CD20 FITC, CD25 FITC, CD127 PerCP-Cy5.5, IL-4RaPE, IL-4 PE, IL-13 PE, IFN-g allophycocyanin, phospho-STAT6 allo-phycocyanin (Tyr641), and CCR4 PE were all obtained from BD Bio-sciences. k FITC and l FITC were obtained from Invitrogen. Foxp3 PE(clone PCH101) was obtained from eBioscience. ELISA kits for CCL17and CCL22 were obtained from R&D Systems. Neutralizing Abs againstCCL17 and CCL22 were obtained from R&D Systems. PMA and ion-omycin were obtained from Sigma-Aldrich. Recombinant human IL-4,recombinant human IL-13, recombinant human CCL17, recombinanthuman CCL22, and CCL17 and CCL22 Abs for immunohistochemicalstaining were obtained from PeproTech. IL-4, phospho-STAT6 (Tyr641),and Foxp3 Abs for immunohistochemical staining were obtained fromAbcam. Anti-mouse IgG Ab (BA-2000) and anti-rabbit Ab (BA-1000)were obtained from Vector Laboratories. STAT6, phospho-STAT6 (Tyr641),and b-actin Abs for Western blot analysis were obtained from Cell SignalingTechnology. For TFH staining, CD4 Amcyan, CD3 allophycocyanin-Cy7,CXCR5 Alexa488, BCL6 PE, ICOS allophycocyanin, and CD40L PerCP-Cy5.5 were obtained from BD Biosciences, and PD1 PE was from eBio-science.
MACS
Tumor cells were isolated from single-cell suspensions of lymph nodebiopsies or from surgical samples from patients with lymphoma by de-pleting T cells using CD3 magnetic beads (Miltenyi Biotec) as describedpreviously (17). The procedure yielded tumor B cells of .99% purity asdetermined by surface staining for CD10, CD20, and monoclonal light-chain restriction. Tregs were isolated by MACS using Regulatory T CellIsolation Kit (Miltenyi Biotec) according to the manufacturer’s instruc-tions. To isolate non-Tregs, we isolated CD4+ T cells using CD4+ T CellIsolation Kit and then depleted that cell fraction of Tregs using CD25 mag-netic beads (Miltenyi Biotec). These procedures yielded .90% purity ofTregs (CD4+CD25+CD127loFoxp3+) and non-Tregs (CD4+CD252Foxp32),as determined by flow cytometric analysis.
Flow cytometric analysis
Surface staining and Foxp3 (eBioscience) and phospho-STAT6 (BD Bio-sciences) staining for flow cytometric analysis were performed accordingto the manufacturer’s instructions. Samples were acquired using a BDFACSCalibur system (BD Biosciences) and analyzed using Cell QuestPro (BD Biosciences) or FlowJo (Tree Star) software. TFH identified asCD3+CD4+CD252PD1hiCXCR5hi were sorted using FACSAria (BectonDickinson, San Diego, CA). Purity of sorted TFH was .98%.
Real-time PCR
Total RNA was extracted from purified tumor and tonsil B cells usingTRIzol reagent (Invitrogen), followed by treatment with DNase (Ambion).Real-time PCR was performed on the ABI Prism 7900 using Power SYBR
6682 CROSS TALK AMONG TFH, TUMOR, AND TREGS IN HUMAN LYMPHOMA
at Novartis G
lobal on Novem
ber 26, 2013http://w
ww
.jimm
unol.org/D
ownloaded from

Green RNA-to-CT 1-Step Kit according to the manufacturer’s instructions(Applied Biosystems). Primers for CCL17 (Hs00171074) and CCL22(Hs00171080) were obtained from Applied Biosystems. GAPDH was used
as an endogenous control (Integrated DNATechnologies). The DDCt methodwas used to calculate the proportional difference in CCL17 and CCL22expression in tumor B cells and tonsil B cells.
FIGURE 1. IL-4–producing T cells are increased in the FL tumor microenvironment. (A) Multiparametric flow cytometry was performed on intratumoral
T cells. Intratumoral CD4+ T cells were gated into three subsets based on PD-1 and CXCR5 (PD-1hiCXCR5hi, PD-1intCXCR5int, and PD-1loCXCR5lo), and
expression of Bcl6, ICOS, and CD40L was determined. Mean fluorescence intensity of CD40L is indicated in the histogram for the three subsets. (B)
Intratumoral CD4+ T cells were sorted into PD-1hiCXCR5hi, PD-1intCXCR5int, and PD-1loCXCR5lo subsets, and expression of IL-4 and Bcl6 was de-
termined by real-time PCR. (C) Intratumoral CD4+ T cells were incubated for 12 h in the presence or absence of PMA and ionomycin. Brefeldin A was
added for the last 10 h, and expression of IFN-g and IL-4 versus PD-1 expression is shown in CD4+ T cells by flow cytometry. (D) The correlation between
mRNA transcripts of IL-4 and that of CD40L, MAF, PDCD1, and ICOS was determined in the microarray data set of 191 FL tumors published previously
by Dave et al. (15). Pearson correlation coefficient (r) and Spearman rank correlation coefficient (rho) are shown. (E and F) T cells isolated from FL biopsy
samples or reactive tonsils (n = 5 each) were stimulated as in (C). IL-4 and IFN-g production was assessed in CD3+ T cells by intracellular cytokine
staining, and the percentage of T cells producing cytokine was determined. Representative data (E) and data from five pairs of samples (F) are shown.
Statistical significance was determined by Wilcoxon rank sum test.
The Journal of Immunology 6683
at Novartis G
lobal on Novem
ber 26, 2013http://w
ww
.jimm
unol.org/D
ownloaded from

Immunohistochemical analysis
Formalin-fixed paraffin-embedded tissue sections were deparaffinized andrehydrated, and Ag retrieval was performed according to the manufacturer’sprotocol (Vector Laboratories). Tissue sections were treated for 5 min with0.3% hydrogen peroxide solution to block endogenous peroxidase and thenincubated with a blocking buffer (1% BSA in PBS; Sigma) for 5 min atroom temperature. Next, slides were incubated with primary Abs overnightat 4˚C at a dilution of 1:100 in blocking buffer; then the slides were washedand incubated for 30 min with appropriate secondary Abs in blockingbuffer. The sections were stained using DAB solution (Vector Laborato-ries). Digital photomicrographs were acquired using DP Controller soft-ware (Olympus) mounted on a BX41 Clinical Microscope (Olympus).
Analysis of cDNA microarray data
Expression of chemokine genes, IL-4, IL-13, IL-4R, and IL-13R in tumorcells isolated from FL biopsies and B cells isolated from reactive tonsilswere obtained from a publicly available microarray data set (http://icg.cpmc.columbia.edu/Web_Data/JCI/2003_JCI.htm) (34). Log2-transformeddata were analyzed for relative levels of gene expression. Data from theOncomine database (https://www.oncomine.org/resource/login.html) werealso similarly displayed for expression of CCL17 and CCL22 mRNA inmultiple lymphoproliferative disorders. Whole-genome gene expressiondata from the study of Dave et al. (15) were obtained from a publiclyavailable source (http://llmpp.nih.gov/FL/). After log2 normalization andreannotation of the microarray version used (06/09/2011; Release 32,http://www.affymetrix.com), data for selected genes were examined forpairwise correlation by Pearson correlation and Spearman rank correlationcoefficients, with significance for the Pearson correlation coefficient de-termined assuming no relationship in the population. The Pearson corre-lation coefficient for selected genes of relevance to immune cell types werecalculated and displayed as a correlation matrix heat map, as pioneered byTosolini et al. (36).
Cytokine and chemokine induction
Tumor cells or intratumoral T cells were cultured in the presence or ab-sence of the indicated stimuli, and cytokines or chemokine levels wereassessed in the supernatants after 48 h by ELISA or multiplex assaysaccording to the manufacturer’s instructions. For intracellular cytokine as-say, cells were cultured in the absence or presence of PMA (50 ng/ml) andionomycin (500 ng/ml) for 14 h. Brefeldin A (5 mg/ml; Sigma-Aldrich) wasadded for the last 12 h of the incubation, and the cells were harvested, fixed,permeabilized, and stained for surface markers and intracellular cytokinesby fluorochrome-labeled mAbs as previously described (37).
Chemotaxis assay
Tumor cells were cultured in the absence or presence of IL-4 (20 ng/ml),and supernatants were harvested after 48 h for chemotaxis assay. Tumorsupernatants or recombinant CCL17 and CCL22 (200 ng/ml each) wereplated in triplicate in the lower chambers of a transwell plate, and Tregsor non-Tregs (2 3 105 cells/well) were plated in triplicate in the upperchambers of a transwell plate separated by a 5-mm pore polycarbonatefilter (Corning) and cultured for 2 h. Cells that migrated across the filterwere recovered and counted using the trypan blue exclusion method. Thepercentage of cells that had migrated was calculated using the followingformula: (number of cells migrated into the lower chamber/number ofcells seeded in the corresponding upper chamber) 3 100. The inhibitionof chemotaxis was assessed using anti-CCR4–blocking Ab (20 mg/ml).Chemotaxis inhibition was calculated as a percentage using the followingformula: [(X2 Y)/X]3 100, where X is the fraction of cells that migratedin the absence of Abs and Y is the fraction of cells that migrated in thepresence of Abs.
Western blot analysis
Approximately 2–4 3 106 tumor cells were lysed in a buffer composed of50 mM Tris-Cl (pH, 7.4), 5 mM EDTA, 150 mM NaCl, 0.5% Triton-X100, 1 mg/ml leupeptin and aprotinin, and 1 mM PMSF. Protein content ofthe cell lysates was quantified using the Bradford assay (Bio-Rad), and 25mg total protein was dissolved in Laemmli SDS-PAGE sample buffer be-fore separation in 10% SDS-PAGE gels. After electrophoresis, proteinswere transferred to a nitrocellulose membrane (Bio-Rad) for Western blotanalysis with anti-STAT6 or anti–phospho-STAT6 Abs (1:1000 dilutioneach) for 1 h at room temperature or at 4˚C overnight. Bound Abs weredetected with HRP-conjugated secondary Abs diluted at 1:2000 and withSuperSignal West Pico Substrate (Thermo Scientific).
Knockdown of STAT6 with small interfering RNA
Granta519 cells were transfected with STAT6-specific small interferingRNA (siRNA) (59-GGGAGAAGAUGUGUGAAACUCUGAA-39 and 59-GAAUCCGGGAUCUUGCU CAGC UCAA-39) (38) or a Universal StealthsiRNA negative control (40 nmol each; Invitrogen) or transfection controlpmaxGFP (Amaxa) using Nucleofector Kit V (Amaxa) according to man-ufacturer’s instructions. After 24 h, transfection efficiency was determinedby flow cytometric analysis, and 55–60% of the transfected cells was foundto be positive for GFP. Knockdown of STAT6 and phospho-STAT6 wasdetermined by Western blot analysis. Transfected cells were incubated withIL-4 (20 ng/ml) for an additional 24 h, and chemokine production wasassessed in the supernatants by ELISA.
FIGURE 2. IL-4 induces phosphorylation of STAT6
in FL tumor B cells. (A and B) Tumor cells isolated
from FL biopsy samples were incubated in the absence
or presence of IL-4 (20 ng/ml) for 15 min, and ex-
pression of phospho-STAT6 (P-STAT6) was determined
by Western blot analysis (A) or phosflow (B). Data
shown are representative of three independent experi-
ments (A) and eight FL patient samples tested (B). (C)
Immunohistochemical staining for phospho-STAT6 (dark
brown) was performed on formalin-fixed, paraffin-em-
bedded FL (left panel) and tonsil (right panel) tissues.
Original magnification 3100.
6684 CROSS TALK AMONG TFH, TUMOR, AND TREGS IN HUMAN LYMPHOMA
at Novartis G
lobal on Novem
ber 26, 2013http://w
ww
.jimm
unol.org/D
ownloaded from

Statistical analysis
Differences between chemokine levels between unpaired experimentalgroups were determined using the Wilcoxon rank sum test using Prism
software (GraphPad Software). Differences between paired test and control
samples were assessed by two-sided paired Student t test using Microsoft
Excel 2007. The p values ,0.05 were considered statistically significant.PFS was defined as time from initiation of treatment to the time ofprogression or death, whichever occurred first, or to the time of lastcontact. PFS was estimated using the Kaplan–Meier method. Log ranktest was performed to test the difference in survival times betweengroups. Multivariate regression models were developed to examine the
FIGURE 3. CCL17 and CCL22 are increased in FL. (A) Expression of relative chemokine mRNA levels in FL tumors (n = 6) and germinal center B
cells (centrocytes [CC] and centroblasts [CB]) from reactive tonsils (n = 5 each) that were purified by depleting T cells, NK cells, and monocytes/
macrophages using immunomagnetic beads were determined using publicly available cDNA microarray data (available from http://icg.cpmc.columbia.
edu/Web_Data/JCI/2003_JCI.htm) and shown as a heat map. Log2-transformed data are median centered for each gene, and variation from the median
is indicated by the color bar. (B and C) Real-time PCR was performed to assess the expression of CCL17 (B) and CCL22 (C) mRNA in purified FL
tumors (n = 6; 95.7–97.9% pure) and reactive tonsil B cells (n = 6; 98.7–99.6% pure). Expression of the chemokine genes relative to GAPDH in each
sample is shown. (D and E) Immunohistochemical staining for CCL17 (D) and CCL22 (E) was performed on formalin-fixed, paraffin-embedded FL (left
panels) and tonsil (right panels) tissues. Original magnification 320; images are representative of data from three different FL tumors. (F) Tumor cells
isolated from three FL biopsy samples were incubated for 48 h, and spontaneous production of CCL17 and CCL22 was assessed in the culture
supernatants by ELISA.
The Journal of Immunology 6685
at Novartis G
lobal on Novem
ber 26, 2013http://w
ww
.jimm
unol.org/D
ownloaded from

effect of chemokine level adjusted for Follicular Lymphoma Interna-tional Prognostic Index (FLIPI) score (39). Regression analyses of PFSdata were conducted using the Cox proportional hazards model. Becauseof the skewed nature of distribution of the two chemokines CCL17 andCCL22, a logarithm (base 2) transformation was used in the analysiswhen included in the regression models as a continuous variable. SASversion 9.2 and S-Plus version 8.04 were used to carry out the statisticalanalyses.
ResultsIL-4–producing T cells are increased in the tumormicroenvironment in FL
Calvo et al. (7) described an increase in IL-4 in FL tumor lysatesbut did not identify the source of IL-4. Pangault et al. (8) showed
that TFH cells in FL have high levels of IL-4 mRNA but did not
FIGURE 4. CCL17 and CCL22 are increased in the
serum of FL patients and CCL22 is predictive of infe-
rior PFS. The levels of CCL17 (A) and CCL22 (B) were
determined by ELISA in the serum of FL patients at
diagnosis (n = 38) and in normal donors (ND; n = 11).
Horizontal bars represent the mean values for each group.
Statistical significance was determined by Wilcoxon
rank sum test. (C and D) Kaplan–Meier survival curves
for PFS in FL patients with high (greater than median,
n = 19) and low (less than or equal to median, n = 19)
serum levels of CCL17 and CCL22 at diagnosis and
treated uniformly with prednisone, doxorubicin, cyclo-
phosphamide, and etoposide chemotherapy followed by
autologous tumor-derived idiotype vaccination are shown.
The p value was calculated by log rank test.
FIGURE 5. IL-4 induced production of CCL17 by
lymphoma tumor cells. (A–E) Tumor cells (A, C) and
intratumoral T cells (B) isolated from lymphoma biopsy
samples (A–C) or lymphoma cell lines (D, E) were in-
cubated in triplicate in the presence or absence of IL-4
(20 ng/ml). After 48 h, CCL17 production was assessed
in the culture supernatants by ELISA. DLBCL, dif-
fuse large BCL; MCL, mantle cell lymphoma; SMZL,
splenic marginal zone lymphoma; EJ-1, SKI, SUDHL4,
PFEIFFER, and TOLEDO, DLBCL cell lines; RL,
DHL-16, and DOHH2, transformed FL cell lines; Raji
and Daudi, Burkitt’s lymphoma cell lines; and Mino
and Granta519, MCL cell lines.
6686 CROSS TALK AMONG TFH, TUMOR, AND TREGS IN HUMAN LYMPHOMA
at Novartis G
lobal on Novem
ber 26, 2013http://w
ww
.jimm
unol.org/D
ownloaded from

confirm IL-4 expression at protein level. Moreover, expression ofBcl6, the master transcription factor for TFH differentiation, wasnot assessed. In this study, we conclusively demonstrated that theCD4+PD-1hiCXCR5hi T cells are the major source of IL-4 in FLand expressed high levels of Bcl6, as well as ICOS and CD40L,suggesting that they represented TFH (Fig. 1A–C). Consistent withour in vitro results, we found a moderate degree of correlationbetween IL-4 mRNA and genes associated with TFH such asCD40L, MAF, PDCD1, and ICOS in gene expression arrays ofwhole-tumor tissues from FL patients reported previously by Daveet al. (15) (Fig. 1D). From the same data set, we calculated a self-correlation matrix of genes associated with a number of differentimmune cell subsets, which showed that IL-4 is most closely as-sociated with a cluster of TFH-associated genes that is distinctfrom a Th1/T cytotoxic cell 1 cluster, as well as genes associ-ated with Th2, Th17, NK cells, macrophages, myeloid DC, andplasmacytoid DC (Supplemental Fig. 1A). These results suggestthat the observed correlations between IL-4 and TFH genes areindeed specific. Consistent with this, IL-4 production was ob-served in T cell cultures but was negligible in non–T cell cultures(Supplemental Fig. 1B, 1C). More importantly, we found that IL-4–expressing T cells are increased in FL compared with tonsilcontrols (Fig. 1E, 1F). To determine whether FL tumor cells re-spond to IL-4 produced in the tumor microenvironment, we eval-uated the expression of IL-4Ra by flow cytometric analysis. Wefound that FL tumor cells and a subset of intratumoral T cells ex-pressed IL-4Ra (Supplemental Fig. 1D). Moreover, IL-4Ra mRNAwas hyperexpressed in FL tumor cells compared with germinalcenter B cells (both centrocytes and centroblasts) from reactivetonsils (Supplemental Fig. 1E, 1F). Taken together, these resultsindicate that IL-4 is produced predominantly by TFH, and IL-4–expressing T cells are increased in FL.
Phosphorylation of STAT6 is increased in FL tumors
Binding of IL-4 to its receptor in hematopoietic cells activates thetyrosine kinases Jak1 and Jak2; this process results in recruitmentand phosphorylation of STAT6, leading to STAT6’s dimeriza-tion and translocation to the nucleus where it activates STAT6-responsive genes (40, 41). Consistent with the fact that IL-4 wasproduced in the tumor microenvironment in FL, we observed thatphospho-STAT6 was present at low levels in tumor cells fromprimary FL samples but was substantially enhanced by IL-4 (Fig.2A, 2B). Furthermore, using immunohistochemical staining, wefound that phospho-STAT6 was increased in primary FL biopsysamples compared with tonsil controls (Fig. 2C). Collectively,these results suggested that the increase in IL-4 induced en-hanced phosphorylation of STAT6 in FL tumors compared withtonsils.
CCL17 and CCL22 are increased in BCLs
Because CCL17 and CCL22 are STAT6-responsive genes (41), weused publicly available cDNA microarray data (available from http://www.ncbi.nlm.nih.gov/geo/query/acc.cgi?acc=GSE2350 and https://www.oncomine.org/resource/login.html) (34) to determine whetherthese genes are hyperexpressed in BCLs relative to other che-mokines. We compared the expression patterns of 32 chemokinemRNAs in FL tumors and germinal center B cells (both centrocytesand centroblasts) from tonsil controls and observed that CCL17and CCL22 were hyperexpressed in five of six FL tumor B cellspecimens (Fig. 3A, Supplemental Fig. 2A). CCL17 and/or CCL22were also hyperexpressed in Hodgkin’s lymphoma, Burkitt’s lym-phoma, chronic lymphocytic leukemia, diffuse large BCL, andmantle cell lymphoma (Supplemental Fig. 2B, 2C). The hyper-expression of CCL17 and CCL22 in FL tumor cells was confirmed
at the mRNA level by real-time PCR (Fig. 3B, 3C) and at theprotein level by immunohistochemical analysis (Fig. 3D, 3E).However, in ex vivo cultures, CCL22, but not CCL17, was spon-taneously produced, which indicates that the secretion of CCL17by FL tumor cells may be dependent on paracrine signals from thetumor microenvironment (Fig. 3F).CCL17 and CCL22 were also significantly increased in the
serum of FL patients at diagnosis compared with normal donors(Fig. 4A, 4B, Supplemental Table I) and interestingly, high levelsof serum CCL22, but not CCL17, at diagnosis correlated withpoor PFS compared with patients with low levels of CCL22(median PFS of 47 mo versus not reached, log rank p = 0.044;Fig. 4C, 4D). With the adjustment of FLIPI risk score (low-intermediate versus high) in multivariate Cox proportional haz-
FIGURE 6. Induction of CCL17 by IL-4 in tumor B cells was STAT6
dependent. (A and D) Granta519 cells and other lymphoma cell lines (D)
were incubated in the absence or presence of IL-4 (20 ng/ml) for 15 min,
and expression of phospho-STAT6 (P-STAT6) was determined by Western
blot analysis (A) or phosflow (D). (B) Granta519 cells were transfected
with STAT6-specific siRNA or Universal Stealth siRNA negative control;
after 24 h, levels of STAT6 and phospho-STAT6 were determined by
Western blot analysis in untreated and transfected cells. (C) Granta519
cells were transfected as described earlier in triplicate and incubated with
IL-4 for an additional 24 h, and CCL17 production was assessed in the
supernatants by ELISA. Percent inhibition of CCL17 production as com-
pared with untransfected cells is shown. Statistical significance was de-
termined by two-sided paired Student t test.
The Journal of Immunology 6687
at Novartis G
lobal on Novem
ber 26, 2013http://w
ww
.jimm
unol.org/D
ownloaded from
ard model, CCL22 remained significant. Patients with higherCCL22 had larger hazard of progression than those with lowerCCL22 (hazard ratio = 1.38 [95% CI 1.013–1.887] per unit in-crease of CCL22 on a log base 2 scale; p = 0.041). Correlationwith overall survival could not be performed, as there were only 2deaths in the entire cohort of 38 patients. Neither the CCL17 norCCL22 levels were significantly different (p . 0.05) between theFLIPI risk groups (low-intermediate versus high), suggesting thatthe serum chemokine levels were not just markers of tumor bur-den.
IL-4 induces production of CCL17 by tumor cells from FLand other BCLs
Because IL-4 was previously shown to induce CCL17 in myeloidcells via STAT6 (42), we determined whether IL-4 induced pro-duction of CCL17 by FL tumor cells. We cultured purified tumor
B cells in the presence or absence of IL-4 and assessed the pro-duction of CCL17 in the culture supernatants. Because IL-4Rawas also expressed on a subset of intratumoral T cells (Supple-mental Fig. 1D), we also tested the effect of IL-4 on T cells. Weobserved that IL-4 induced significant production of CCL17 byboth tumor cells (Fig. 5A) and intratumoral T cells (Fig. 5B) inFL. Of interest, IL-4 also induced significant production of CCL17in primary tumor cells derived from diffuse large BCL, mantle celllymphoma, and splenic marginal zone lymphoma (Fig. 5C), aswell as a transformed FL cell line (DOHH-2), diffuse large BCLcell lines (EJ-1, PFEIFFER, and TOLEDO), and a mantle celllymphoma cell line (Granta519; Fig. 5D, 5E). However, IL-4 hadminimal effect on the production of CCL22 in FL (SupplementalFig. 3A, 3B) and in other BCLs and cell lines (Supplemental Fig.3C–E). Together, these results indicated that CCL17 was inducedby IL-4 in FL and other BCLs.
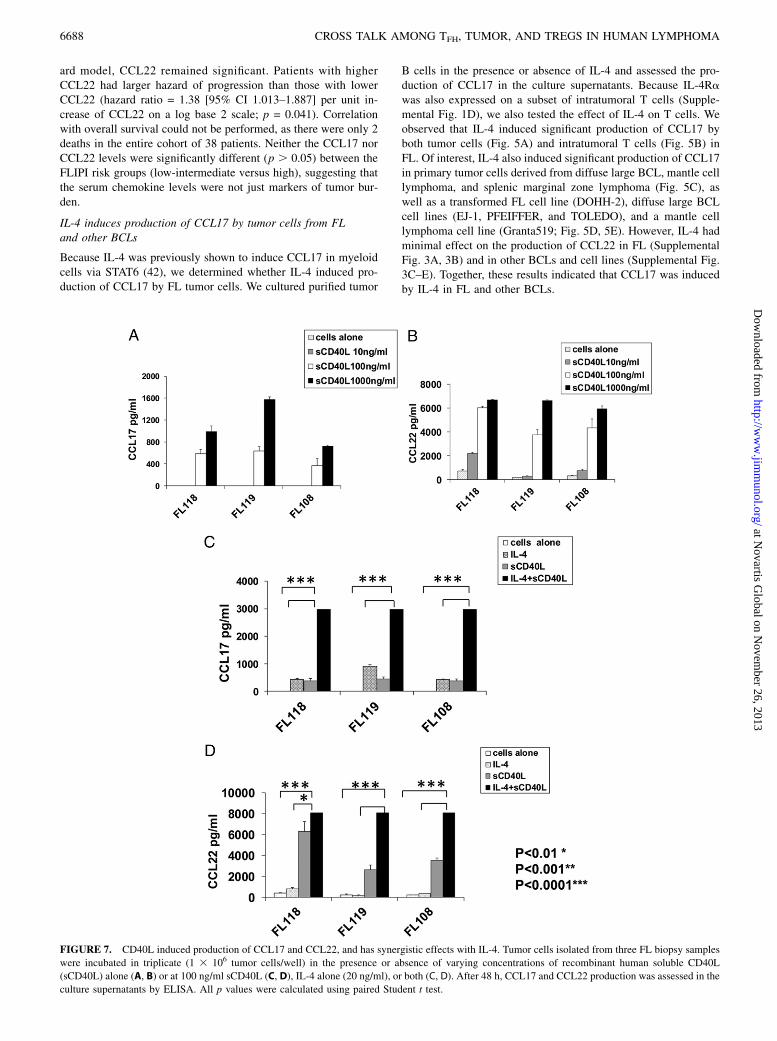
FIGURE 7. CD40L induced production of CCL17 and CCL22, and has synergistic effects with IL-4. Tumor cells isolated from three FL biopsy samples
were incubated in triplicate (1 3 106 tumor cells/well) in the presence or absence of varying concentrations of recombinant human soluble CD40L
(sCD40L) alone (A, B) or at 100 ng/ml sCD40L (C, D), IL-4 alone (20 ng/ml), or both (C, D). After 48 h, CCL17 and CCL22 production was assessed in the
culture supernatants by ELISA. All p values were calculated using paired Student t test.
6688 CROSS TALK AMONG TFH, TUMOR, AND TREGS IN HUMAN LYMPHOMA
at Novartis G
lobal on Novem
ber 26, 2013http://w
ww
.jimm
unol.org/D
ownloaded from

Induction of CCL17 by IL-4 in tumor B cells is STAT6dependent
To determine whether the induction of CCL17 by IL-4 is STAT6dependent in BCLs, we assessed the effect of STAT6 knockdown
on CCL17 production in Granta519 cells. We found that IL-4
enhanced the phosphorylation of STAT6 in the mantle cell lym-
phoma cell line Granta519 (Fig. 6A). Using STAT6-specific siRNA,
but not control siRNA, we were able to substantially knock down
STAT6 and phospho-STAT6 in Granta519 (Fig. 6B). After we
cultured these transfected cells in the presence of IL-4, we ob-
served that CCL17 production was markedly inhibited in cells
transfected with STAT6-specific siRNA compared with control
siRNA (Fig. 6C). Induction of CCL17 by IL-4 in diffuse large
B cell lines (DOHH2, TOLEDO, and PFEIFFER) was also asso-
ciated with phosphorylation of STAT6 (Fig. 6D). In contrast, the
SUDHL4 cell line did not produce CCL17 in response to IL-4
(Fig. 5E) and had minimal induction of phospho-STAT6 (Fig. 6D).
Together, these results indicated that IL-4 induced CCL17 in
BCLs by activating phospho-STAT6.
CD40L induces production of both CCL17 and CCL22 from FLtumor cells and has synergistic effects with IL-4
Because CD40L can stimulate production of CCL17 and CCL22from B cells (43, 44) and is hyperexpressed on the IL-4–producingTFH (Fig. 1C), we determined whether it might play a role in theinduction of these chemokines in FL. We found that CD40L in-duced significant production of CCL17 and CCL22 by tumor cells(Fig. 7A, 7B) in FL. Interestingly, there was marked synergismbetween CD40L and IL-4 in the production of both chemokines(Fig. 7C, 7D). Consistent with our in vitro results (Figs. 5A, 7, Sup-plemental Fig. 3A), we found a moderate degree of correlationbetween mRNA transcripts of IL-4 and CCL17, but not CCL22, ingene expression microarray studies of FL tumors (Fig. 8A, 8B). Incontrast, CD40L mRNA transcripts correlated with both CCL17and CCL22 (Fig. 8C, 8D). This suggests that the expression of IL-4and CD40L may be differentially regulated in TFH and/or expres-sion of CD40L by non-TFH, although at lower levels (Fig. 1A) maycontribute to the expression of these chemokines. We also found astrong correlation between CCL17 and CCL22, suggesting thatthese genes may be coregulated (Fig. 8E).
FIGURE 8. IL4 mRNA transcripts correlated with
CCL17 and CD40L correlated with both CCL17 and
CCL22. The correlation between mRNA transcripts of
IL-4 (A and B) and CD40L (C, D) versus CCL17 (A, C)
and CCL22 (B, D) was determined in the microarray
data set of 191 FL tumors published previously by Dave
et al. (15). (E) Correlation between CCL17 and CCL22
mRNA transcripts for the same data set. Pearson cor-
relation coefficient (r) and Spearman rank correlation
coefficient (rho) are shown.
The Journal of Immunology 6689
at Novartis G
lobal on Novem
ber 26, 2013http://w
ww
.jimm
unol.org/D
ownloaded from

In agreement with the earlier results, coculture of FL tumorcells with autologous intratumoral TFH showed production of bothCCL17 and CCL22 into the culture supernatants (Fig. 9A, 9B).We also observed similar production of CCL17 and CCL22 whenB cells from tonsils were cocultured with autologous TFH (Fig.9C, 9D). The lower amount of chemokine production seen in thetumor-TFH cocultures (Fig. 9A, 9B) compared with recombinantproteins (Fig. 7) is probably due to the lower number of tumorcells used per well (Fig. 9A, 9B) relative to the experiment withrIL-4 and CD40L (Fig. 7), and due to the likely suboptimalfunction of cryopreserved TFH compared with freshly isolated TFH
or TFH in vivo (45). Nevertheless, these results suggested that TFH
express IL-4 and CD40L, presumably after cognate recognitionof an MHC-associated peptide presented on the surface of tumorB cells, and induce production of CCL17 and CCL22 by FL tumorcells.
CCL17 and CCL22 induce preferential migration of Tregsand IL-4–producing T cells
Because CCR4 is the only known chemokine receptor for CCL17and CCL22, and is overexpressed on Tregs (46) and Th2 cells (47),we determined whether IL-4–treated tumor cells induced prefer-ential migration of these cells. First, we cultured FL tumor cells inthe presence or absence of IL-4 for 48 h and tested the ability ofthe culture supernatants to induce chemotaxis of T cell subsets.We found that culture supernatants from IL-4–treated tumor cellsand recombinant CCL17 and CCL22 chemokines induced sig-nificant migration of Tregs in a chemotaxis assay. In contrast, themigration of Tregs in response to culture supernatants obtainedfrom tumor cells alone was not significantly different from thatobserved with control media (Fig. 10A). Treg migration was alsoobserved when recombinant CCL17 and CCL22 chemokines wereused alone, and the migration was not significantly different be-tween chemokine concentrations of 2, 20, and 200 ng/ml forCCL17 and CCL22 (data not shown). More importantly, culturesupernatants from IL-4–treated tumor cells induced preferentialmigration of Tregs compared with non-Tregs (Fig. 10B), and thispreferential migration was correlated with a higher expression of
CCR4 in Tregs than in non-Tregs (Fig. 10C). This result may offerone mechanism for increased number of Foxp3+ Tregs in FLtumors compared with tonsils (23–26).To determine the relative migration of Tregs, IFN-g–producing
(Th1), and IL-4–producing (Th2 or TFH) T cell subsets, we testedintratumoral T cells of FL in a chemotaxis assay. We observed thatTregs and IL-4–producing T cells migrated significantly more inresponse to CCL17 and CCL22 chemokines than IFN-g–produc-ing T cells (Fig. 10D). The migration of Tregs in response to tumorsupernatants was significantly inhibited by anti-CCR4 blockingAb, but not by isotype control Ab (Fig. 10E). Taken together, theseresults suggested that Tregs and IL-4–producing T cells might berecruited preferentially into the FL tumor microenvironment.
DiscussionOur results provide novel insights into the cross talk among TFH,tumor cells, and Tregs in FL. Prior reports suggested that TFH
might play a role in promoting the survival and growth of FLtumor cells through IL-4 and CD40L (10, 11, 42, 45). Our datasuggest that IL-4 and CD40L expressed by intratumoral TFH mayhave additional effects. We show that they induce expression ofCCL17 and CCL22 through paracrine effects on tumor cells in FL.Although we observed similar induction of chemokines by tonsilssamples in vitro (Fig. 9A–D), CCL17 and CCL22 were increasedin FL tissues. This may be explained by the increased numbersof IL-4–producing T cells in FL (Fig. 1F). More importantly, weobserved that these chemokines induce preferential recruitment ofTregs and IL-4–producing T cells rather than IFN-g–producingT cells into the tumor microenvironment, thus creating a positivefeedback cycle that may lead to further production of these che-mokines and an immunosuppressive tumor microenvironment thatfacilitates immune escape and promotes the survival and growthof the tumor. This vicious cycle appears to be primarily driven bythe increased number of IL-4–producing T cells in the tumormicroenvironment. Although additional studies with larger num-bers of patients are needed, the potential role of CCL22 in pro-moting tumor growth and escape is supported by our observationthat FL patients with high serum level of this chemokine at di-
FIGURE 9. CCL17 and CCL22 are induced in
autologous tumor-TFH cocultures. TFH (CD3+CD4+
CD252PD1hiCXCR5hi) were sorted by FACS from
three cryopreserved FL biopsy samples and three tonsil
samples. They were cultured in the absence or presence
of autologous tumor cells or tonsil B cells (0.35 3 106
tumor cells/well). After 96 h, CCL17 (A, C) and CCL22
(B, D) production was assessed in the culture super-
natants by ELISA. All p values were calculated using
paired Student t test.
6690 CROSS TALK AMONG TFH, TUMOR, AND TREGS IN HUMAN LYMPHOMA
at Novartis G
lobal on Novem
ber 26, 2013http://w
ww
.jimm
unol.org/D
ownloaded from

agnosis have inferior PFS (Fig. 4D). The lack of correlation be-tween CCL17 and PFS suggests that CCL22 might play a moredominant role in the tumor microenvironment. Although we foundincreased levels of CCL17 and CCL22 in the serum of FL patients,their concentrations are likely to be higher in the tumor where theyare produced compared with peripheral blood. Therefore, it is veryprobable that the chemokine gradient is in favor of active recruit-ment of Tregs and IL-4–producing T cells from the peripheralblood into the tumor microenvironment. The recruited Tregs may,in turn, suppress the function of tumor-specific effector T cellsand other immune cells such as NK cells and dendritic cells, andpromote immune evasion by the tumor.The increase in IL-4–producing T cells (Fig. 1F) and the basal
phosphorylation of STAT6 in tumor cells observed in our studies
(Fig. 2A–C) are consistent with recent reports (7, 42). IL-4+IFN-g2
CD4+ T cells have been classically described as Th2 cells, butrecent reports suggest that IL-4 in secondary lymphoid organs isalmost entirely produced by TFH cells; classical IL-4–producingTh2 cells migrate from the lymph node after activation and me-diate effector function in the peripheral tissues (48). In agreementwith this and other reports (42, 45), we observed that IL-4–pro-ducing T cells were TFH in FL (Fig. 1A–C). Recent reports alsosuggest that CXCR5+CD4+ T cells in the peripheral blood couldbe precursors of germinal center TFH cells seen in secondarylymphoid organs (49). More interestingly, circulating CXCR5+
CD4+ T cells appear to be composed of Th1-, Th2-, and Th17-likesubsets that produce IFN-g, IL-4, and IL-17, respectively (50). InFL patients, IL-4–producing CD4+ T cells recruited from the
FIGURE 10. Preferential migration of Tregs and IL-4–producing CD4+ T cells. (A, B, and E) Tumor cells isolated from FL biopsy samples were in-
cubated in the presence or absence of IL-4 (20 ng/ml) for 48 h, and culture supernatants (SN) were harvested for use in chemotaxis assays. (A and B) Tregs
and non-Tregs were isolated to .90% purity from PBMC of normal donors by MACS and used in the chemotaxis assay in the presence or absence of
control (Ctrl) media, tumor supernatants, and recombinant CCL17 and CCL22 (200 ng/ml each) as described in Materials and Methods. Representative
data on the percentage of migration of Tregs and/or non-Tregs from four independent experiments are shown. (C) Expression of CCR4 was determined by
flow cytometric analysis on CD4+Foxp32 (gray closed histograms) and CD4+Foxp3+ (black open histograms) T cells from three FL biopsy samples.
Representative data from three of eight FL samples tested are shown. (D) Intratumoral T cells were isolated to .90% purity from FL102 tumor biopsy
sample by MACS using Pan T Cell Isolation Kit and used in a chemotaxis assay in triplicate in the presence of control media (data not shown) or
recombinant CCL17 and CCL22 (200 ng/ml each). After 2 h, cells were harvested separately from upper and lower chambers, and intracellular cytokine
assay and Foxp3 staining were performed as described in Materials and Methods. The relative percentage of CD4+IFN-g+IL-42, CD4+IFN-g2IL-4+, and
Treg (CD4+CD25+CD127loFoxp3+) T cell subsets in the upper and lower chambers was determined using the following formula: (Percent T cell subset in
upper or lower chamber3 100)/(total percent of T cell subset in upper and lower chambers). (E) Chemotaxis assay was performed with isolated Tregs as in
(A). Percentage of inhibition of migration of Tregs by isotype control Ab and CCR4 blocking Ab was determined and shown as compared with IL-4–treated
tumor SN. Data shown are representative of three independent experiments. All p values were calculated using paired Student t test.
The Journal of Immunology 6691
at Novartis G
lobal on Novem
ber 26, 2013http://w
ww
.jimm
unol.org/D
ownloaded from

peripheral blood into the FL tumor microenvironment may bepredominantly Th2-like CXCR5+CD4+ TFH precursor cells thatmay transform into IL-4–producing TFH cells after migration intothe lymph node. IL-4 may also be produced by Vd1 T lymphocytesin the tumor microenvironment; IL-4–producing Vd1 T lymphocyteswere shown to be increased in number in the peripheral blood inpatients with FL, mantle cell lymphoma, and marginal-zone lym-phoma when compared with healthy donors, and Vd1 T lymphocyteswere detectable in these tumors (51). Our results and these reportsindicate that increased IL-4 in the FL tumor microenvironment is dueto TFH cells, with a possible additional contribution from Vd1 Tcells. In Hodgkin’s lymphoma, in contrast, IL-13 is the cytokinepredominantly responsible for STAT6 activation and CCL17 pro-duction (38, 52). In our studies, IL-13 was not hyperexpressed inFL tissues compared with reactive tonsils and had minimal or noeffect on the production of CCL17 and CCL22 (data not shown).Our results suggest that chemokine-driven active recruitment of
Tregs is one reason for their increased number in the FL tumormicroenvironment. However, Tregs can be induced from con-ventional T cells by tumor cells in BCLs (26, 29). Therefore,development of therapeutic approaches that inhibit both the re-cruitment and induction of Tregs may be necessary to decrease thenumber of Tregs in the tumor microenvironment. In light of thedifferential expression of CCR4 on Tregs (46) and non-Tregs (Fig.10C), and the knowledge that CCR4 is the only known receptorfor CCL17 and CCL22, our data support the development ofblocking Abs or small-molecule antagonists against CCR4 (53,54) that can be used in combination with other immunotherapeuticstrategies in therapies for FL and other B cell malignancies. Suchagents are likely to inhibit the recruitment of immunosuppressiveTregs, as well as tumor-promoting, IL-4–producing T cells, andshift the balance in favor of antitumor immunity mediated byTh1 and T cytotoxic cell 1 cells in the tumor microenvironment,thereby enhancing the efficacy of therapeutic vaccines (16, 17) andother immunomodulatory drugs.Although intratumoral Tregs have been shown to be immuno-
suppressive by in vitro studies, there is uncertainty regarding thebenefit of Treg reduction therapy because increased numbers ofFoxp3+ cells in FL tumors have been associated with improvedsurvival in FL (24, 55). However, Farinha et al. (25) observed thatonly the architectural pattern of Foxp3+ cells within FL tumors,rather than their number, influenced outcome; specifically, an intra-follicular localization pattern of Tregs correlated with decreasedsurvival. This suggests the presence of distinct Treg subsets withinthe FL tumor microenvironment, and recent studies in basic im-munology have shown that Tregs may differentiate into distinctsubsets, based on various cues from their microenvironment, toregulate distinct effector cells such as Th1, Th2, Th17, and TFH
(56–60). In FL, Tregs are present in both follicular and inter-follicular regions, potentially representing distinct subsets (25).Tregs that localize to intrafollicular regions (follicular Tregs) innormal lymphoid tissues express high levels of CXCR5 and Bcl6similar to TFH and were shown to be responsible for regulatinggerminal center reactions (59, 60). Indeed, follicular regulatorycells were recently demonstrated to be present in FL tissues (45).Whether other Treg subsets exist in FL tumors and whether CCL17and CCL22 expressed by tumor cells have differential effects onrecruitment of different Treg subsets needs to be studied in thefuture.In summary, our results provide novel insights into the inter-
actions between TFH, tumor cells, and Tregs in FL. We showedthat intratumoral TFH induce production of CCL17 and CCL22by tumor cells via two distinct mechanisms involving IL-4 andCD40L. Overexpression of CCL17 and CCL22 in the tumor mi-
croenvironment induces preferential recruitment of Tregs and IL-4–producing T cells that, in turn, may stimulate more chemokineproduction, thus creating a vicious cycle and an immunosup-pressive tumor microenvironment that promotes immune evasionand tumor survival and growth. Therapeutic strategies that inter-rupt this cycle may lead to inhibition of FL tumor growth bydepleting survival and growth factors provided by the IL-4 andCD40L expressed by TFH. Furthermore, they may alter the tumormicroenvironment by skewing the balance from immunosuppres-sion to antitumor immunity, thereby enhancing the efficacy of bothnaturally induced and therapeutically induced antitumor immuneresponses and leading to improved clinical outcomes in patientswith FL and possibly other B cell malignancies.
AcknowledgmentsWe thank Kristi M. Speights for editorial assistance.
DisclosuresThe authors have no financial conflicts of interest.
References1. 1997. A clinical evaluation of the International Lymphoma Study Group clas-
sification of non-Hodgkin’s lymphoma. The Non-Hodgkin’s Lymphoma Clas-sification Project. Blood 89: 3909–3918.
2. Tsujimoto, Y., J. Cossman, E. Jaffe, and C. M. Croce. 1985. Involvement of thebcl-2 gene in human follicular lymphoma. Science 228: 1440–1443.
3. Dolken, G., L. Dolken, C. Hirt, C. Fusch, C. S. Rabkin, and F. Schuler. 2008.Age-dependent prevalence and frequency of circulating t(14;18)-positive cells inthe peripheral blood of healthy individuals. J. Natl. Cancer Inst. Monogr. 2008:44–47.
4. Dolken, G., G. Illerhaus, C. Hirt, and R. Mertelsmann. 1996. BCL-2/JH rear-rangements in circulating B cells of healthy blood donors and patients withnonmalignant diseases. J. Clin. Oncol. 14: 1333–1344.
5. McDonnell, T. J., and S. J. Korsmeyer. 1991. Progression from lymphoid hy-perplasia to high-grade malignant lymphoma in mice transgenic for the t(14; 18).Nature 349: 254–256.
6. Kuppers, R. 2005. Mechanisms of B-cell lymphoma pathogenesis. Nat. Rev.Cancer 5: 251–262.
7. Calvo, K. R., B. Dabir, A. Kovach, C. Devor, R. Bandle, A. Bond, J. H. Shih, andE. S. Jaffe. 2008. IL-4 protein expression and basal activation of Erk in vivo infollicular lymphoma. Blood 112: 3818–3826.
8. Pangault, C., P. Ame-Thomas, P. Ruminy, D. Rossille, G. Caron, M. Baia, J. DeVos, M. Roussel, C. Monvoisin, T. Lamy, et al. 2010. Follicular lymphoma cellniche: identification of a preeminent IL-4-dependent T(FH)-B cell axis. Leuke-mia 24: 2080–2089.
9. Ame-Thomas, P., J. Le Priol, H. Yssel, G. Caron, C. Pangault, R. Jean,N. Martin, T. Marafioti, P. Gaulard, T. Lamy, et al. 2012. Characterization ofintratumoral follicular helper T cells in follicular lymphoma: role in the survivalof malignant B cells. Leukemia 26: 1053–1063.
10. Buske, C., A. Twiling, G. Gogowski, K. Schreiber, M. Feuring-Buske,G. G. Wulf, W. Hiddemann, and B. Wormann. 1997. In vitro activation of low-grade non-Hodgkin’s lymphoma by murine fibroblasts, IL-4, anti-CD40 anti-bodies and the soluble CD40 ligand. Leukemia 11: 1862–1867.
11. Schmitter, D., M. Koss, E. Niederer, R. A. Stahel, and G. Pichert. 1997. T-cellderived cytokines co-stimulate proliferation of CD40-activated germinal centreas well as follicular lymphoma cells. Hematol. Oncol. 15: 197–207.
12. Horning, S. J., and S. A. Rosenberg. 1984. The natural history of initially un-treated low-grade non-Hodgkin’s lymphomas. N. Engl. J. Med. 311: 1471–1475.
13. Schultze, J. L., M. J. Seamon, S. Michalak, J. G. Gribben, and L. M. Nadler.1997. Autologous tumor infiltrating T cells cytotoxic for follicular lymphomacells can be expanded in vitro. Blood 89: 3806–3816.
14. Lee, S. T., S. Liu, L. Radvanyi, P. Sukhumalchandra, J. J. Molldrem,E. D. Wieder, P. Hwu, Y. J. Liu, L. W. Kwak, G. Lizee, and S. S. Neelapu. 2008.A novel strategy for rapid and efficient isolation of human tumor-specific CD4(+) and CD8(+) T-cell clones. J. Immunol. Methods 331: 13–26.
15. Dave, S. S., G. Wright, B. Tan, A. Rosenwald, R. D. Gascoyne, W. C. Chan,R. I. Fisher, R. M. Braziel, L. M. Rimsza, T. M. Grogan, et al. 2004. Predictionof survival in follicular lymphoma based on molecular features of tumor-infiltrating immune cells. N. Engl. J. Med. 351: 2159–2169.
16. Bendandi, M., C. D. Gocke, C. B. Kobrin, F. A. Benko, L. A. Sternas,R. Pennington, T. M. Watson, C. W. Reynolds, B. L. Gause, P. L. Duffey, et al.1999. Complete molecular remissions induced by patient-specific vaccinationplus granulocyte-monocyte colony-stimulating factor against lymphoma. Nat.Med. 5: 1171–1177.
17. Neelapu, S. S., S. Baskar, B. L. Gause, C. B. Kobrin, T. M. Watson, A. R. Frye,R. Pennington, L. Harvey, E. S. Jaffe, R. J. Robb, et al. 2004. Human autologoustumor-specific T-cell responses induced by liposomal delivery of a lymphomaantigen. Clin. Cancer Res. 10: 8309–8317.
6692 CROSS TALK AMONG TFH, TUMOR, AND TREGS IN HUMAN LYMPHOMA
at Novartis G
lobal on Novem
ber 26, 2013http://w
ww
.jimm
unol.org/D
ownloaded from

18. McLaughlin, P., A. J. Grillo-Lopez, B. K. Link, R. Levy, M. S. Czuczman,M. E. Williams, M. R. Heyman, I. Bence-Bruckler, C. A. White, F. Cabanillas,et al. 1998. Rituximab chimeric anti-CD20 monoclonal antibody therapy forrelapsed indolent lymphoma: half of patients respond to a four-dose treatmentprogram. J. Clin. Oncol. 16: 2825–2833.
19. Witzig, T. E., A. M. Vukov, T. M. Habermann, S. Geyer, P. J. Kurtin,W. R. Friedenberg, W. L. White, H. I. Chalchal, P. J. Flynn, T. R. Fitch, andD. A. Welker. 2005. Rituximab therapy for patients with newly diagnosed,advanced-stage, follicular grade I non-Hodgkin’s lymphoma: a phase II trial inthe North Central Cancer Treatment Group. J. Clin. Oncol. 23: 1103–1108.
20. Khouri, I. F., P. McLaughlin, R. M. Saliba, C. Hosing, M. Korbling, M. S. Lee,L. J. Medeiros, L. Fayad, F. Samaniego, A. Alousi, et al. 2008. Eight-year ex-perience with allogeneic stem cell transplantation for relapsed follicular lym-phoma after nonmyeloablative conditioning with fludarabine, cyclophosphamide,and rituximab. Blood 111: 5530–5536.
21. Zou, W. 2005. Immunosuppressive networks in the tumour environment andtheir therapeutic relevance. Nat. Rev. Cancer 5: 263–274.
22. Zou, W. 2006. Regulatory T cells, tumour immunity and immunotherapy. Nat.Rev. Immunol. 6: 295–307.
23. Yang, Z. Z., A. J. Novak, M. J. Stenson, T. E. Witzig, and S. M. Ansell. 2006.Intratumoral CD4+CD25+ regulatory T-cell-mediated suppression of infiltratingCD4+ T cells in B-cell non-Hodgkin lymphoma. Blood 107: 3639–3646.
24. Carreras, J., A. Lopez-Guillermo, B. C. Fox, L. Colomo, A. Martinez,G. Roncador, E. Montserrat, E. Campo, and A. H. Banham. 2006. High numbersof tumor-infiltrating FOXP3-positive regulatory T cells are associated with im-proved overall survival in follicular lymphoma. Blood 108: 2957–2964.
25. Farinha, P., A. Al-Tourah, K. Gill, R. Klasa, J. M. Connors, and R. D. Gascoyne.2010. The architectural pattern of FOXP3-positive T cells in follicular lym-phoma is an independent predictor of survival and histologic transformation.Blood 115: 289–295.
26. Mittal, S., N. A. Marshall, L. Duncan, D. J. Culligan, R. N. Barker, andM. A. Vickers. 2008. Local and systemic induction of CD4+CD25+ regulatoryT-cell population by non-Hodgkin lymphoma. Blood 111: 5359–5370.
27. Yang, Z. Z., A. J. Novak, S. C. Ziesmer, T. E. Witzig, and S. M. Ansell. 2006.Attenuation of CD8(+) T-cell function by CD4(+)CD25(+) regulatory T cells inB-cell non-Hodgkin’s lymphoma. Cancer Res. 66: 10145–10152.
28. Hilchey, S. P., A. De, L. M. Rimsza, R. B. Bankert, and S. H. Bernstein. 2007.Follicular lymphoma intratumoral CD4+CD25+GITR+ regulatory T cells po-tently suppress CD3/CD28-costimulated autologous and allogeneic CD8+CD25-and CD4+CD25- T cells. J. Immunol. 178: 4051–4061.
29. Yang, Z. Z., A. J. Novak, S. C. Ziesmer, T. E. Witzig, and S. M. Ansell. 2007.CD70+ non-Hodgkin lymphoma B cells induce Foxp3 expression and regulatoryfunction in intratumoral CD4+CD25 T cells. Blood 110: 2537–2544.
30. Ai, W. Z., J. Z. Hou, R. Zeiser, D. Czerwinski, R. S. Negrin, and R. Levy. 2009.Follicular lymphoma B cells induce the conversion of conventional CD4+ T cellsto T-regulatory cells. Int. J. Cancer 124: 239–244.
31. Sallusto, F., P. Schaerli, P. Loetscher, C. Schaniel, D. Lenig, C. R. Mackay,S. Qin, and A. Lanzavecchia. 1998. Rapid and coordinated switch in chemokinereceptor expression during dendritic cell maturation. Eur. J. Immunol. 28: 2760–2769.
32. Saeki, H., and K. Tamaki. 2006. Thymus and activation regulated chemokine(TARC)/CCL17 and skin diseases. J. Dermatol. Sci. 43: 75–84.
33. Mantovani, A., P. A. Gray, J. Van Damme, and S. Sozzani. 2000. Macrophage-derived chemokine (MDC). J. Leukoc. Biol. 68: 400–404.
34. Kuppers, R., U. Klein, I. Schwering, V. Distler, A. Brauninger, G. Cattoretti,Y. Tu, G. A. Stolovitzky, A. Califano, M. L. Hansmann, and R. Dalla-Favera.2003. Identification of Hodgkin and Reed-Sternberg cell-specific genes by geneexpression profiling. J. Clin. Invest. 111: 529–537.
35. Schuster, S. J., S. S. Neelapu, B. L. Gause, J. E. Janik, F. M. Muggia,J. P. Gockerman, J. N. Winter, C. R. Flowers, D. A. Nikcevich, E. M. Sotomayor,et al. 2011. Vaccination with patient-specific tumor-derived antigen in first re-mission improves disease-free survival in follicular lymphoma. J. Clin. Oncol.29: 2787–2794.
36. Tosolini, M., A. Kirilovsky, B. Mlecnik, T. Fredriksen, S. Mauger, G. Bindea,A. Berger, P. Bruneval, W. H. Fridman, F. Pages, and J. Galon. 2011. Clinicalimpact of different classes of infiltrating T cytotoxic and helper cells (Th1, th2,treg, th17) in patients with colorectal cancer. Cancer Res. 71: 1263–1271.
37. Neelapu, S. S., S. Baskar, and L. W. Kwak. 2001. Detection of keyhole limpethemocyanin (KLH)-specific immune responses by intracellular cytokine assay inpatients vaccinated with idiotype-KLH vaccine. J. Cancer Res. Clin. Oncol. 127(Suppl. 2): R14–R19.
38. Buglio, D., G. V. Georgakis, S. Hanabuchi, K. Arima, N. M. Khaskhely,Y. J. Liu, and A. Younes. 2008. Vorinostat inhibits STAT6-mediated TH2 cy-tokine and TARC production and induces cell death in Hodgkin lymphoma celllines. Blood 112: 1424–1433.
39. Solal-Celigny, P., P. Roy, P. Colombat, J. White, J. O. Armitage, R. Arranz-Saez,W. Y. Au, M. Bellei, P. Brice, D. Caballero, et al. 2004. Follicular lymphomainternational prognostic index. Blood 104: 1258–1265.
40. Colgan, J., and P. Rothman. 2007. Manipulation of signaling to control allergicinflammation. Curr. Opin. Allergy Clin. Immunol. 7: 51–56.
41. Hebenstreit, D., G. Wirnsberger, J. Horejs-Hoeck, and A. Duschl. 2006. Sig-naling mechanisms, interaction partners, and target genes of STAT6. CytokineGrowth Factor Rev. 17: 173–188.
42. Liddiard, K., J. S. Welch, J. Lozach, S. Heinz, C. K. Glass, and D. R. Greaves.2006. Interleukin-4 induction of the CC chemokine TARC (CCL17) in murinemacrophages is mediated by multiple STAT6 sites in the TARC gene promoter.BMC Mol. Biol. 7: 45.
43. Ghia, P., P. Transidico, J. P. Veiga, C. Schaniel, F. Sallusto, K. Matsushima,S. E. Sallan, A. G. Rolink, A. Mantovani, L. M. Nadler, and A. A. Cardoso.2001. Chemoattractants MDC and TARC are secreted by malignant B-cellprecursors following CD40 ligation and support the migration of leukemia-specific T cells. Blood 98: 533–540.
44. Lin, L., S. Nonoyama, A. Oshiba, Y. Kabasawa, and S. Mizutani. 2003. TARCand MDC are produced by CD40 activated human B cells and are elevated in thesera of infantile atopic dermatitis patients. J. Med. Dent. Sci. 50: 27–33.
45. Owen, R. E., E. Sinclair, B. Emu, J. W. Heitman, D. F. Hirschkorn, C. L. Epling,Q. X. Tan, B. Custer, J. M. Harris, M. A. Jacobson, et al. 2007. Loss of T cellresponses following long-term cryopreservation. J. Immunol. Methods 326: 93–115.
46. Iellem, A., M. Mariani, R. Lang, H. Recalde, P. Panina-Bordignon, F. Sinigaglia,and D. D’Ambrosio. 2001. Unique chemotactic response profile and specificexpression of chemokine receptors CCR4 and CCR8 by CD4(+)CD25(+) reg-ulatory T cells. J. Exp. Med. 194: 847–853.
47. Bonecchi, R., G. Bianchi, P. P. Bordignon, D. D’Ambrosio, R. Lang, A. Borsatti,S. Sozzani, P. Allavena, P. A. Gray, A. Mantovani, and F. Sinigaglia. 1998.Differential expression of chemokine receptors and chemotactic responsivenessof type 1 T helper cells (Th1s) and Th2s. J. Exp. Med. 187: 129–134.
48. Reinhardt, R. L., H. E. Liang, and R. M. Locksley. 2009. Cytokine-secretingfollicular T cells shape the antibody repertoire. Nat. Immunol. 10: 385–393.
49. Yu, D., and C. G. Vinuesa. 2010. The elusive identity of T follicular helper cells.Trends Immunol. 31: 377–383.
50. Morita, R., N. Schmitt, S. E. Bentebibel, R. Ranganathan, L. Bourdery, G. Zurawski,E. Foucat, M. Dullaers, S. Oh, N. Sabzghabaei, et al. 2011. Human blood CXCR5(+)CD4(+) T cells are counterparts of T follicular cells and contain specific subsetsthat differentially support antibody secretion. Immunity 34: 108–121.
51. Catellani, S., A. Poggi, A. Bruzzone, P. Dadati, J. L. Ravetti, M. Gobbi, andM. R. Zocchi. 2007. Expansion of Vdelta1 T lymphocytes producing IL-4 inlow-grade non-Hodgkin lymphomas expressing UL-16-binding proteins. Blood109: 2078–2085.
52. Skinnider, B. F., U. Kapp, and T. W. Mak. 2002. The role of interleukin 13 inclassical Hodgkin lymphoma. Leuk. Lymphoma 43: 1203–1210.
53. Ishida, T., and R. Ueda. 2006. CCR4 as a novel molecular target for immuno-therapy of cancer. Cancer Sci. 97: 1139–1146.
54. Bayry, J., E. Z. Tchilian, M. N. Davies, E. K. Forbes, S. J. Draper, S. V. Kaveri,A. V. Hill, M. D. Kazatchkine, P. C. Beverley, D. R. Flower, and D. F. Tough.2008. In silico identified CCR4 antagonists target regulatory T cells and exertadjuvant activity in vaccination. Proc. Natl. Acad. Sci. USA 105: 10221–10226.
55. Alvaro, T., M. Lejeune, M. T. Salvado, C. Lopez, J. Jaen, R. Bosch, andL. E. Pons. 2006. Immunohistochemical patterns of reactive microenvironmentare associated with clinicobiologic behavior in follicular lymphoma patients. J.Clin. Oncol. 24: 5350–5357.
56. Koch, M. A., G. Tucker-Heard, N. R. Perdue, J. R. Killebrew, K. B. Urdahl, andD. J. Campbell. 2009. The transcription factor T-bet controls regulatory T cellhomeostasis and function during type 1 inflammation. Nat. Immunol. 10: 595–602.
57. Chaudhry, A., D. Rudra, P. Treuting, R. M. Samstein, Y. Liang, A. Kas, andA. Y. Rudensky. 2009. CD4+ regulatory T cells control TH17 responses ina Stat3-dependent manner. Science 326: 986–991.
58. Zheng, Y., A. Chaudhry, A. Kas, P. deRoos, J. M. Kim, T. T. Chu, L. Corcoran,P. Treuting, U. Klein, and A. Y. Rudensky. 2009. Regulatory T-cell suppressorprogram co-opts transcription factor IRF4 to control T(H)2 responses. Nature458: 351–356.
59. Chung, Y., S. Tanaka, F. Chu, R. I. Nurieva, G. J. Martinez, S. Rawal,Y. H. Wang, H. Lim, J. M. Reynolds, X. H. Zhou, et al. 2011. Follicular regu-latory T cells expressing Foxp3 and Bcl-6 suppress germinal center reactions.Nat. Med. 17: 983–988.
60. Linterman, M. A., W. Pierson, S. K. Lee, A. Kallies, S. Kawamoto, T. F. Rayner,M. Srivastava, D. P. Divekar, L. Beaton, J. J. Hogan, et al. 2011. Foxp3+ fol-licular regulatory T cells control the germinal center response. Nat. Med. 17:975–982.
The Journal of Immunology 6693
at Novartis G
lobal on Novem
ber 26, 2013http://w
ww
.jimm
unol.org/D
ownloaded from


1
SUPPLEMENTARY FIGURE LEGENDS (Rawal et al.)
Supplementary Figure 1. Self-correlation of immune cell subsets genes and expression of
IL-4Rα in FL. (A) Correlation matrix of genes associated with various immune cell subsets in
the microarray dataset of 191 FL tumors published previously by Dave et al. Immune cell subset
genes associated with TH1, TH2, TH17, TFH, TC1, Treg, NK cells, NKT, macrophage, mDC, and
pDC were evaluated. The variation from median for the correlation value is indicated by the
color bar. (B) T cells isolated from three FL biopsy samples were incubated in the presence or
absence of PMA (50 ng/ml) and ionomycin (500 ng/ml). After 48 h, IL-4 production was
assessed in the culture supernatants by ELISA. Data shown are representative of three
independent experiments. (C) Tumor cells isolated from three IgM+ FL tumors were incubated in
the presence or absence of PMA and ionomycin, soluble CD40 ligand trimer (800 ng/ml), or
antihuman IgM monoclonal antibody (10 μg/ml). After 48 h, IL-4 production was assessed in the
culture supernatants by ELISA. (D) Expression of IL-4Rα was determined by flow cytometric
analysis on CD10+CD20+ tumor cells (top) and intratumoral CD3+ T cells (bottom) from three
FL biopsy samples. The closed gray histograms show staining with the isotype control antibody,
and the open histograms show staining with IL-4Rα antibody. (E and F) Expression of relative
(E) and normalized absolute (F) IL-4Rα and IL-13R mRNA levels in FL tumors (n = 6) and
germinal center B cells (centrocytes, CC and centroblasts, CB) from reactive tonsils (n = 5 each)
were determined using publicly available cDNA microarray data (available from http://icg.cpmc.
columbia.edu/ Web_Data/JCI/2003_ JCI.htm). Log2-transformed data are median-centered for
each gene, and variation from the median is indicated by the color bar. In panel F, the mean of
the values for the two probes of IL13A1 are shown.

2
Supplementary Figure 2. CCL17 and CCL22 expression in non-Hodgkin’s lymphomas. (A)
Expression of normalized absolute CCL17 and CCL22 mRNA levels in FL tumors (n = 6) and
germinal center B cells (centrocytes, CC and centroblasts, CB) from reactive tonsils (n = 5 each)
were determined using publicly available cDNA microarray data (available from
http://icg.cpmc.columbia.edu/ Web_Data/JCI/2003_ JCI.htm). (B and C) Data from the Basso
Lymphoma Database (available from https://www.oncomine.org/ resource/login.html) were
analyzed for expression of CCL17 (B) and CCL22 (C) mRNA levels in various lymphomas
including Burkitt’s lymphoma (BL) (n = 27), chronic lymphocytic leukemia (CLL) (n = 34),
diffuse large B-cell lymphoma (DLBCL) (n = 40), follicular lymphoma (FL) (n = 6), hairy cell
leukemia (HCL) (n = 16), Hodgkin lymphoma (HL) (n = 4), mantle cell lymphoma (MCL) (n =
8), multiple myeloma (MM) (n = 4), and primary effusion lymphoma (PEL) (n = 9). Data shown
were normalized to expression levels in B cells from reactive tonsils (n = 58).
Supplementary Figure 3. CCL22 production was not significantly increased by IL-4. (A–E)
Tumor cells (A and C) and intratumoral T cells (B) isolated from lymphoma biopsy samples (A-
C) or lymphoma cell lines (D and E) were incubated in the presence or absence of IL-4 (20
ng/ml). After 48 h, CCL22 production was assessed in the culture supernatants by ELISA. FL,
follicular lymphoma; DLBCL, diffuse large B-cell lymphoma; MCL, mantle cell lymphoma;
SMZL, splenic marginal-zone lymphoma; EJI, SKI, SUDHL4, PFEIFFER, and TOLEDO,
DLBCL cell lines; RL, DHL-16, and DOHH2, transformed FL cell lines; Raji and Daudi,
Burkitt’s lymphoma cell lines; and Mino and Granta519, MCL cell lines.

3
Supplementary Table 1. Characteristics of patients at diagnosis used for correlation of
serum chemokine levels with progression-free survival (n = 38)
Characteristic No. (%)
Age Median Range 48
35-71
Sex Males Females
25 (66)13 (34)
Histology FL, Grade 1 12 (32)FL, Grade 2 26 (68)
Stage Stage III 8 (21)Stage IV 30 (79)
FLIPI Low 19 (50)Intermediate 7 (18)High 10 (26)Not available 2 (5)
Copyright © 2022 FDOKUMEN