
On the Identification of Circulating Tumor Cells in Breast Cancer
10
IEEE JOURNAL OF BIOMEDICAL AND HEALTH INFORMATICS, VOL. 18, NO. 3, MAY2014 773 On the Identification of Circulating Tumor Cells in Breast Cancer Stelios Sfakianakis, Ekaterini S. Bei, Michalis Zervakis, Member, IEEE, Despoina Vassou, and Dimitrios Kafetzopoulos Abstract—Breast cancer is a highly heterogeneous disease and very common among western women. The main cause of death is not the primary tumor but its metastases at distant sites, such as lymph nodes and other organs (preferentially lung, liver, and bones). The study of circulating tumor cells (CTCs) in peripheral blood resulting from tumor cell invasion and intravascular filtra- tion highlights their crucial role concerning tumor aggressiveness and metastasis. Genomic research regarding CTCs monitoring for breast cancer is limited due to the lack of indicative genes for their detection and isolation. Instead of direct CTC detection, in our study, we focus on the identification of factors in peripheral blood that can indirectly reveal the presence of such cells. Using selected publicly available breast cancer and peripheral blood microarray datasets, we follow a two-step elimination procedure for the iden- tification of several discriminant factors. Our procedure facilitates the identification of major genes involved in breast cancer pathol- ogy, which are also indicative of CTCs presence. Index Terms—Biological processes (BP), breast cancer (BC) sig- nature, circulating tumor cells (CTCs) in peripheral blood (PB), gene elimination. I. INTRODUCTION B REAST cancer (BC) still affects a large proportion of women in western societies. Tumor metastasis in lung, liver, or bones is the main cause of death in patients suffer- ing from the disease; therefore, it is imperative to improve the diagnostic tools in clinical procedures. Circulating tumor cells (CTCs) in peripheral blood (PB) are considered important di- agnostic factors, as they arise from primary tumors and are indicative for tumor aggressiveness and metastasis [1], [2]. Nowadays, a large number of high-dimensional gene expres- sion datasets are obtained through the exploitation of molecular techniques, such as DNA microarrays. Gene expression profil- ing of CTCs might provide the opportunity to identify markers Manuscript received May 1, 2013; revised September 17, 2013; accepted December 8, 2013. Date of publication December 16, 2013; date of current version May 1, 2014. This work was supported by “OncoSeed” Project funded by the National Strategic Reference Network 2007–13 of the Greek Ministry of Development, and by “YPERThEN” Project, which is funded by the EU and funds from Greece and Cyprus. S. Sfakianakis is with the Institute of Computer Science, Foundation for Research and Technology Hellas, Heraklion 70013, Greece (e-mail: ssfak@ ics.forth.gr). E. S. Bei, and M. Zervakis are with the Department of Electronic and Com- puter Engineering, Technical University of Crete, Chania 73100, Greece (e-mail: [email protected]; [email protected]). D. Vassou and D. Kafetzopoulos, are with the Institute of Molecular Biology and Biotechnology, Foundation for Research and Technology Hellas, Heraklion 70013, Greece (e-mail: [email protected]; [email protected]). Digital Object Identifier 10.1109/JBHI.2013.2295262 for diagnosis and prognosis in BC patients [3], toward better provision of personalized medicine [4]. Furthermore, exploring gene alterations in CTC profiles could give valuable information on the molecular mechanism of tumor cell metastasis. In this paper, we take advantage of CTC-targeted microarray studies obtained from the human PB and tissue of BC patients, as well as control individuals, in order to formulate a working hypothesis for the identification of a gene signature character- izing metastasis and the existence of CTCs. A. Related Studies In general, several microarray studies on BC tissue samples (control versus cancer tissue even from the same person) demon- strate alterations in processes manifested in gene deformations. Similar gene alterations appear in the analyzed portion of PB (control blood versus cancer blood) [5]. In addition, Barbazan et al. report that the spread of cancer relates to the detachment of malignant cells into blood [6] and Obermayer et al. [7] demon- strate that CTCs can be detected in single-cell level through spe- cific genes (six gene panel) in PB. Particular microarray studies on PB that isolate specific CTC cells report that CTCs carry characteristics from the primary cause [7], but also convey in- formation regarding the secondary (metastasis) tumor [6]. Thus, cancer-specific alterations can be identified in affected tissue ar- eas, as well as in blood. Moreover, some specific alterations in cancer might be indicative of its ability to diffuse; such genes can indirectly predict the existence of CTCs without the need to detect and/or extract them [8]. B. Two-Stage Process for CTC Hypothesis Our hypothesis supports that specific differences of cancer tissue and cancer blood are indicative of the ability of tumor to diffuse and, thus, can be used as factors for CTC estimation without direct detection. For this purpose, we used a two-stage procedure applied on several publicly available DNA microarray datasets from dif- ferent origins (tissue and blood). The first stage aims to extract gene signatures associated with pairwise differentiation between cell types and/or disease states. For instance, the comparison of cancer and control tissue provides information about the dis- criminative factors of the primary disease. Next, the compari- son between cancer blood and control PB can derive markers indicative of alterations due to the pathology, related to the CTC content and in association with the primary and secondary dis- ease. From this stage, we derive three signatures, each reflecting 2168-2194 © 2013 IEEE. Personal use is permitted, but republication/redistribution requires IEEE permission. See http://www.ieee.org/publications standards/publications/rights/index.html for more information.
Transcript of On the Identification of Circulating Tumor Cells in Breast Cancer
IEEE JOURNAL OF BIOMEDICAL AND HEALTH INFORMATICS, VOL. 18, NO. 3, MAY 2014 773
On the Identification of Circulating Tumor Cells inBreast Cancer
Stelios Sfakianakis, Ekaterini S. Bei, Michalis Zervakis, Member, IEEE, Despoina Vassou,and Dimitrios Kafetzopoulos
Abstract—Breast cancer is a highly heterogeneous disease andvery common among western women. The main cause of deathis not the primary tumor but its metastases at distant sites, suchas lymph nodes and other organs (preferentially lung, liver, andbones). The study of circulating tumor cells (CTCs) in peripheralblood resulting from tumor cell invasion and intravascular filtra-tion highlights their crucial role concerning tumor aggressivenessand metastasis. Genomic research regarding CTCs monitoring forbreast cancer is limited due to the lack of indicative genes for theirdetection and isolation. Instead of direct CTC detection, in ourstudy, we focus on the identification of factors in peripheral bloodthat can indirectly reveal the presence of such cells. Using selectedpublicly available breast cancer and peripheral blood microarraydatasets, we follow a two-step elimination procedure for the iden-tification of several discriminant factors. Our procedure facilitatesthe identification of major genes involved in breast cancer pathol-ogy, which are also indicative of CTCs presence.
Index Terms—Biological processes (BP), breast cancer (BC) sig-nature, circulating tumor cells (CTCs) in peripheral blood (PB),gene elimination.
I. INTRODUCTION
BREAST cancer (BC) still affects a large proportion ofwomen in western societies. Tumor metastasis in lung,
liver, or bones is the main cause of death in patients suffer-ing from the disease; therefore, it is imperative to improve thediagnostic tools in clinical procedures. Circulating tumor cells(CTCs) in peripheral blood (PB) are considered important di-agnostic factors, as they arise from primary tumors and areindicative for tumor aggressiveness and metastasis [1], [2].
Nowadays, a large number of high-dimensional gene expres-sion datasets are obtained through the exploitation of moleculartechniques, such as DNA microarrays. Gene expression profil-ing of CTCs might provide the opportunity to identify markers
Manuscript received May 1, 2013; revised September 17, 2013; acceptedDecember 8, 2013. Date of publication December 16, 2013; date of currentversion May 1, 2014. This work was supported by “OncoSeed” Project fundedby the National Strategic Reference Network 2007–13 of the Greek Ministryof Development, and by “YPERThEN” Project, which is funded by the EU andfunds from Greece and Cyprus.
S. Sfakianakis is with the Institute of Computer Science, Foundation forResearch and Technology Hellas, Heraklion 70013, Greece (e-mail: [email protected]).
E. S. Bei, and M. Zervakis are with the Department of Electronic and Com-puter Engineering, Technical University of Crete, Chania 73100, Greece (e-mail:[email protected]; [email protected]).
D. Vassou and D. Kafetzopoulos, are with the Institute of Molecular Biologyand Biotechnology, Foundation for Research and Technology Hellas, Heraklion70013, Greece (e-mail: [email protected]; [email protected]).
Digital Object Identifier 10.1109/JBHI.2013.2295262
for diagnosis and prognosis in BC patients [3], toward betterprovision of personalized medicine [4]. Furthermore, exploringgene alterations in CTC profiles could give valuable informationon the molecular mechanism of tumor cell metastasis.
In this paper, we take advantage of CTC-targeted microarraystudies obtained from the human PB and tissue of BC patients,as well as control individuals, in order to formulate a workinghypothesis for the identification of a gene signature character-izing metastasis and the existence of CTCs.
A. Related Studies
In general, several microarray studies on BC tissue samples(control versus cancer tissue even from the same person) demon-strate alterations in processes manifested in gene deformations.Similar gene alterations appear in the analyzed portion of PB(control blood versus cancer blood) [5]. In addition, Barbazanet al. report that the spread of cancer relates to the detachment ofmalignant cells into blood [6] and Obermayer et al. [7] demon-strate that CTCs can be detected in single-cell level through spe-cific genes (six gene panel) in PB. Particular microarray studieson PB that isolate specific CTC cells report that CTCs carrycharacteristics from the primary cause [7], but also convey in-formation regarding the secondary (metastasis) tumor [6]. Thus,cancer-specific alterations can be identified in affected tissue ar-eas, as well as in blood. Moreover, some specific alterations incancer might be indicative of its ability to diffuse; such genescan indirectly predict the existence of CTCs without the need todetect and/or extract them [8].
B. Two-Stage Process for CTC Hypothesis
Our hypothesis supports that specific differences of cancertissue and cancer blood are indicative of the ability of tumorto diffuse and, thus, can be used as factors for CTC estimationwithout direct detection.
For this purpose, we used a two-stage procedure applied onseveral publicly available DNA microarray datasets from dif-ferent origins (tissue and blood). The first stage aims to extractgene signatures associated with pairwise differentiation betweencell types and/or disease states. For instance, the comparison ofcancer and control tissue provides information about the dis-criminative factors of the primary disease. Next, the compari-son between cancer blood and control PB can derive markersindicative of alterations due to the pathology, related to the CTCcontent and in association with the primary and secondary dis-ease. From this stage, we derive three signatures, each reflecting
2168-2194 © 2013 IEEE. Personal use is permitted, but republication/redistribution requires IEEE permission.See http://www.ieee.org/publications standards/publications/rights/index.html for more information.
774 IEEE JOURNAL OF BIOMEDICAL AND HEALTH INFORMATICS, VOL. 18, NO. 3, MAY 2014
the overexpressed differential profiles of genes associated withthe specific comparison:
1) C1: comparison between cancer tissue and normal tissuein order to identify genes expressed in primary cancer;
2) C2: comparison between PB of cancer patients and normalindividuals, which identifies genes expressed in the bloodof cancer patients; and
3) C3: comparison between cancer tissue and normal PB,which identifies genes overexpressed in primary cancerand not in PB cells.
The hypothesis at this point is that PB from cancer patientscarries information regarding the primary and secondary (metas-tasis) tumor, as well as other cancer induced alterations. By com-paring the previous signatures, we can isolate markers indicativeof certain aspects of cancer, leading to closer association withthe existence of CTCs. This is the rationale for the second stageof our proposed procedure, which considers the intersection ofthe previous signatures. In particular, we consider the followingintersections:
1) C1 ∩ C2: derives genes overexpressed in cancer tissue andblood; however, it can also reflect genes overexpressed innormal blood,
2) C1 ∩ C2 ∩ C3: eliminates genes overexpressed in normalblood and involves only genes overexpressed in blood dueto cancer-associated factors.
Thus, the intersection of all three comparisons is expected toderive a gene signature, which is indicative of the presence ofCTCs and can be directly compared with factors used for theisolation of such cells.
The purpose and contribution of C3 is justified based on theconsideration of tissue-specific differences in the expression ofgenes, which have been established in biological studies evenfor the same-condition (homogeneous) population (variabilityof expression within and across populations) [9]–[12]. Basically,the inclusion of C3 aims to alleviate cross-tissue differences ap-pearing in the base populations of control breast and controlblood engaged in our study. Along these lines, if the distribu-tions in these two base populations are similar, then C3 derivessimilar results as C1 and cannot contribute any new information.However, if in certain genes there is a large increase either inthe first- (mean) or second-order (variance) statistic of controlblood over control tissue, then the effect is also mapped on thesignificance analysis for microarrays (SAM) metric used forassessing the differentiation of populations (see Section II-C).Recall that C1 compares the distribution of cancer tissue overcontrol tissue, whereas C3 compares the same distribution overcontrol blood. Thus, even though a gene might present largeSAM metric in C1, this metric can be drastically reduced whenthe mean or variance of the base population (control blood) in-creases in C3, leading to the exclusion of this gene from the C3set.
Summarizing our motivation, the intersection of sets C1 ∩ C2reveals active genes over the base levels in both tissue and blood,which could be due to cancer causality but also due to certainblood differences from tissue. In that respect, the inclusion of C3relieves the influence of overexpressed genes in blood comparedto tissue due to any reasons possibly unrelated to cancer. Such
genes are captured in the set C1 ∩ C2 — C3 and excluded fromthe overall intersection C1 ∩ C2 ∩ C3. Furthermore, discussionof the three genes excluded from our consideration due to theinvolvement of C3, as well as tests on independent datasets, isavailable in the supplementary material.
Currently, two prevalent models—progression model andmetastatic predestination model—provide evidence about tumorprogression toward metastasis [13]. Bearing in mind that bothmodels are still under scrutiny and that CTC profiles capture ei-ther primary tumor or metastasis molecular characteristics [6],we applied the two-stage methodological approach describedpreviously to derive a panel of genes that are common in primarycarcinomas and the PB of BC patients. Overall, we consider thehypothesis that this intersection, representing the common fea-tures of primary tumor and BC PB, is likely to reflect CTCsbiology. In this form, the analysis of the intersection signaturemight be biologically and therapeutically significant in terms ofthe involved processes and pathways, forming a useful clinicaldiagnostic tool.
II. METHODS AND PROCEDURES
A. BC Datasets
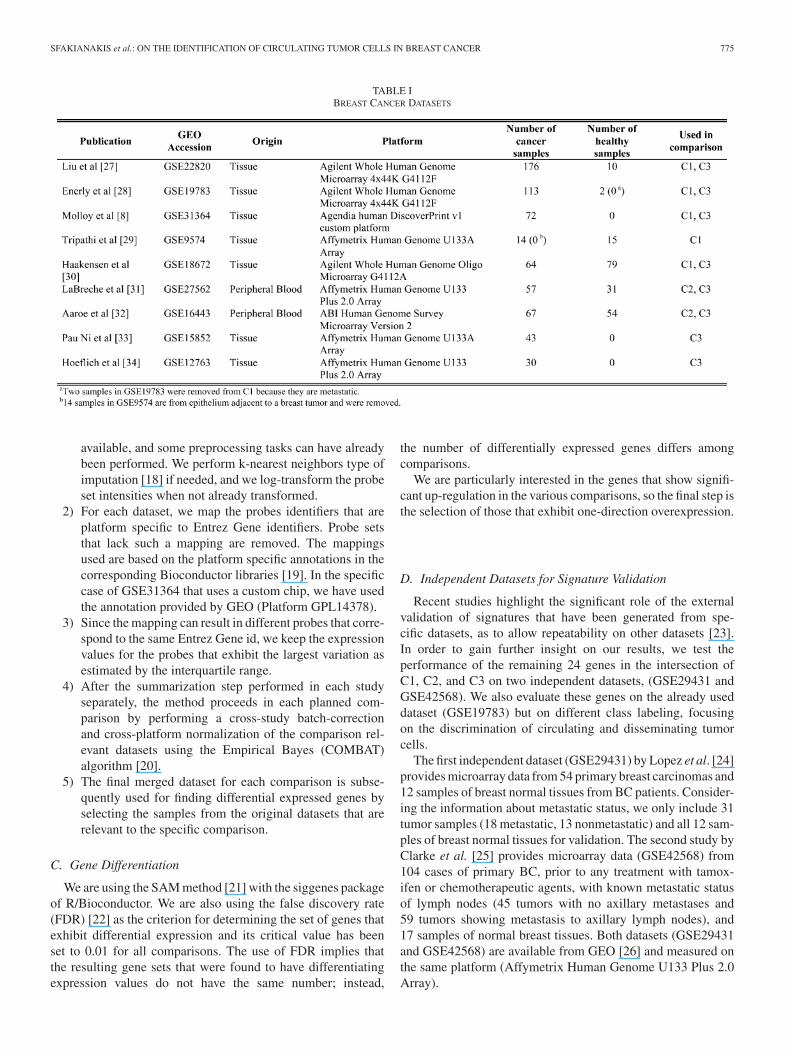
We have used nine different datasets publicly available fromthe Gene Expression Omnibus (GEO) database [14], which areshown in Table I with their relevant characteristics. Most of thedatasets provide samples from both normal and cancer breasttissues. Furthermore, there are a variety of different platforms;Affymetrix and Agilent are the most common manufacturersin this collection of datasets, while there is one dataset usinga custom microarray chip from Agendia and another one fromApplied Biosystems (ABI).
B. Dataset Integration
Unfortunately, not all of the three comparisons (C1, C2, andC3) can be robustly performed by studying a single dataset,due to the lack of samples. Even in the case of C1, which con-trasts healthy tissue samples with cancer patients, the number ofhealthy subjects is limited if a single dataset is used. Therefore,we have designed a data integration methodology that combinesdifferent datasets in a single multiplatform, multiorigin datasetwhere the microarray probe intensities have been renormalizedwith the removal of study and batch specific variations. This isnot a “meta-analysis” compliant approach because the data areintegrated at the gene expression level instead of working on thecombination of P -values, effect sizes, and other statistics thathave been computed per dataset (see [15]–[17] for examples ofsuch methodologies). Our data integration approach is desig-nated by the heterogeneity in the available datasets in terms ofthe gene transcripts used and also the biological question andthe classification of samples.
The dataset integration approach we have followed consists ofthe following steps performed for each of the three comparisons:
1) Each dataset that is relevant to a given comparison is down-loaded from the GEO in the format (e.g., preprocessed) ithas been registered. However, the raw data are not always
SFAKIANAKIS et al.: ON THE IDENTIFICATION OF CIRCULATING TUMOR CELLS IN BREAST CANCER 775
TABLE IBREAST CANCER DATASETS
available, and some preprocessing tasks can have alreadybeen performed. We perform k-nearest neighbors type ofimputation [18] if needed, and we log-transform the probeset intensities when not already transformed.
2) For each dataset, we map the probes identifiers that areplatform specific to Entrez Gene identifiers. Probe setsthat lack such a mapping are removed. The mappingsused are based on the platform specific annotations in thecorresponding Bioconductor libraries [19]. In the specificcase of GSE31364 that uses a custom chip, we have usedthe annotation provided by GEO (Platform GPL14378).
3) Since the mapping can result in different probes that corre-spond to the same Entrez Gene id, we keep the expressionvalues for the probes that exhibit the largest variation asestimated by the interquartile range.
4) After the summarization step performed in each studyseparately, the method proceeds in each planned com-parison by performing a cross-study batch-correctionand cross-platform normalization of the comparison rel-evant datasets using the Empirical Bayes (COMBAT)algorithm [20].
5) The final merged dataset for each comparison is subse-quently used for finding differential expressed genes byselecting the samples from the original datasets that arerelevant to the specific comparison.
C. Gene Differentiation
We are using the SAM method [21] with the siggenes packageof R/Bioconductor. We are also using the false discovery rate(FDR) [22] as the criterion for determining the set of genes thatexhibit differential expression and its critical value has beenset to 0.01 for all comparisons. The use of FDR implies thatthe resulting gene sets that were found to have differentiatingexpression values do not have the same number; instead,
the number of differentially expressed genes differs amongcomparisons.
We are particularly interested in the genes that show signifi-cant up-regulation in the various comparisons, so the final step isthe selection of those that exhibit one-direction overexpression.
D. Independent Datasets for Signature Validation
Recent studies highlight the significant role of the externalvalidation of signatures that have been generated from spe-cific datasets, as to allow repeatability on other datasets [23].In order to gain further insight on our results, we test theperformance of the remaining 24 genes in the intersection ofC1, C2, and C3 on two independent datasets, (GSE29431 andGSE42568). We also evaluate these genes on the already useddataset (GSE19783) but on different class labeling, focusingon the discrimination of circulating and disseminating tumorcells.
The first independent dataset (GSE29431) by Lopez et al. [24]provides microarray data from 54 primary breast carcinomas and12 samples of breast normal tissues from BC patients. Consider-ing the information about metastatic status, we only include 31tumor samples (18 metastatic, 13 nonmetastatic) and all 12 sam-ples of breast normal tissues for validation. The second study byClarke et al. [25] provides microarray data (GSE42568) from104 cases of primary BC, prior to any treatment with tamox-ifen or chemotherapeutic agents, with known metastatic statusof lymph nodes (45 tumors with no axillary metastases and59 tumors showing metastasis to axillary lymph nodes), and17 samples of normal breast tissues. Both datasets (GSE29431and GSE42568) are available from GEO [26] and measured onthe same platform (Affymetrix Human Genome U133 Plus 2.0Array).

776 IEEE JOURNAL OF BIOMEDICAL AND HEALTH INFORMATICS, VOL. 18, NO. 3, MAY 2014
Fig. 1. First step of the two-stage process for CTC hypothesis and also thedatasets used for pairwise comparisons.
III. RESULTS
A. Statistical Comparisons
Based on the proposed methodology, we have extracted thesignatures from the comparison of specific sets of genes, whichexhibit differentially overexpressed behavior as graphically il-lustrated in Fig. 1.
What is important at the second step of our process is to findthe number and reveal the biological relevance of genes belong-ing to the different sets, but also in the intersections of thesesets. Toward this direction, Fig. 2 depicts the three gene setsin relation to their cardinality (their “size”), as well as the sizeof common areas (intersections). Furthermore, Fig. 3 providesmore details regarding the number of the common genes foundin the intersections of the three gene sets. More specifically, weidentify 24 common genes in all three comparisons, 27 genes inthe intersection of C1 and C2, 137 genes in the intersection ofC1 and C3, and 59 genes in the intersection of C2 and C3.
Fig. 3 also shows the genes that have been found in commonwith other studies, in particular Molloy et al. [8] and Powellet al. [35]. From Molloy et al., we identify three genes (RPS8,WISP1, and TMEM121, shown in white) in the gene set pro-duced by comparison C1. Powel et al. report a number of genesthat are supportive for the presence of CTCs. Among them we
Fig. 2. Signatures produced by the three comparisons are shown in a Venndiagram. The size of circles that represent the signatures and the intersectionsof these circles are proportional to the number of corresponding genes. Forthe C1 comparison, we identify 3725 genes showing significant differentialoverexpression in cancer over control tissue. Similarly, for the C2 comparison,we extract 79 genes overexpressed in cancerous PB samples. Finally, the C3comparison derives 245 genes overexpressed in cancer tissue when comparedwith control PB samples.
Fig. 3. Intersections of gene signatures with the corresponding number ofup-regulated genes. A set of previously identified biomarkers is also mappedinto the different sets and intersections. Gene names with grey font are reportedin [35], while the white ones come from [8].
identify Chemokine, CXC motif, receptor 4 (CXCR4) in the 24common genes of all comparisons, glyceraldehyde-3-phosphatedehydrogenase (GAPDH) in the intersection of C1 and C3, andVimentin (VIM) in the intersection of C2 and C3. Both VIM andCXCR4 have been associated with the epithelial-mesenchymaltransition but there are additional epithelial marker genes likeKeratin 8 and Keratin 19 or metastatic genes like calgranulin-B(S100A9) that are found be overexpressed in the comparison C1.In particular S100A9 has been identified as a negative regulatorfor lymph node metastasis [36].
B. Validation Results
In order to validate our methodology, we use hierarchicalclustering on the first dataset (GSE29431) and we show thatthe 24 genes that we identified can effectively separate the pop-ulation of control (healthy) from tumor samples. We consider
SFAKIANAKIS et al.: ON THE IDENTIFICATION OF CIRCULATING TUMOR CELLS IN BREAST CANCER 777
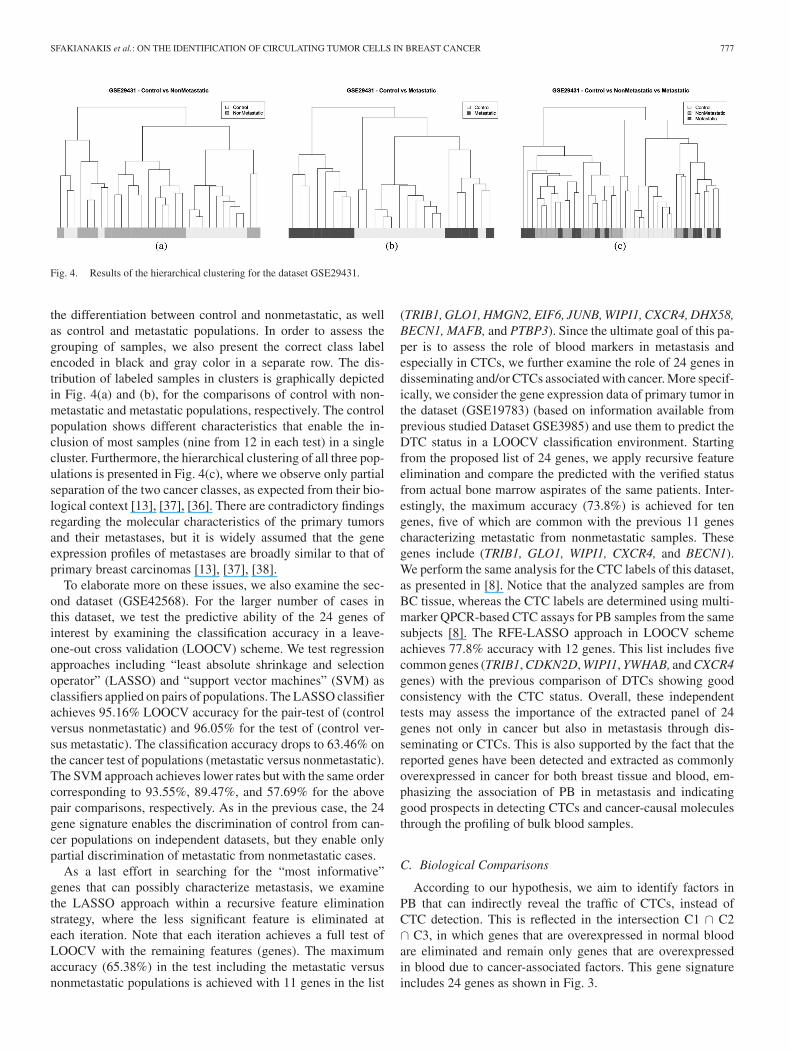
Fig. 4. Results of the hierarchical clustering for the dataset GSE29431.
the differentiation between control and nonmetastatic, as wellas control and metastatic populations. In order to assess thegrouping of samples, we also present the correct class labelencoded in black and gray color in a separate row. The dis-tribution of labeled samples in clusters is graphically depictedin Fig. 4(a) and (b), for the comparisons of control with non-metastatic and metastatic populations, respectively. The controlpopulation shows different characteristics that enable the in-clusion of most samples (nine from 12 in each test) in a singlecluster. Furthermore, the hierarchical clustering of all three pop-ulations is presented in Fig. 4(c), where we observe only partialseparation of the two cancer classes, as expected from their bio-logical context [13], [37], [36]. There are contradictory findingsregarding the molecular characteristics of the primary tumorsand their metastases, but it is widely assumed that the geneexpression profiles of metastases are broadly similar to that ofprimary breast carcinomas [13], [37], [38].
To elaborate more on these issues, we also examine the sec-ond dataset (GSE42568). For the larger number of cases inthis dataset, we test the predictive ability of the 24 genes ofinterest by examining the classification accuracy in a leave-one-out cross validation (LOOCV) scheme. We test regressionapproaches including “least absolute shrinkage and selectionoperator” (LASSO) and “support vector machines” (SVM) asclassifiers applied on pairs of populations. The LASSO classifierachieves 95.16% LOOCV accuracy for the pair-test of (controlversus nonmetastatic) and 96.05% for the test of (control ver-sus metastatic). The classification accuracy drops to 63.46% onthe cancer test of populations (metastatic versus nonmetastatic).The SVM approach achieves lower rates but with the same ordercorresponding to 93.55%, 89.47%, and 57.69% for the abovepair comparisons, respectively. As in the previous case, the 24gene signature enables the discrimination of control from can-cer populations on independent datasets, but they enable onlypartial discrimination of metastatic from nonmetastatic cases.
As a last effort in searching for the “most informative”genes that can possibly characterize metastasis, we examinethe LASSO approach within a recursive feature eliminationstrategy, where the less significant feature is eliminated ateach iteration. Note that each iteration achieves a full test ofLOOCV with the remaining features (genes). The maximumaccuracy (65.38%) in the test including the metastatic versusnonmetastatic populations is achieved with 11 genes in the list
(TRIB1, GLO1, HMGN2, EIF6, JUNB, WIPI1, CXCR4, DHX58,BECN1, MAFB, and PTBP3). Since the ultimate goal of this pa-per is to assess the role of blood markers in metastasis andespecially in CTCs, we further examine the role of 24 genes indisseminating and/or CTCs associated with cancer. More specif-ically, we consider the gene expression data of primary tumor inthe dataset (GSE19783) (based on information available fromprevious studied Dataset GSE3985) and use them to predict theDTC status in a LOOCV classification environment. Startingfrom the proposed list of 24 genes, we apply recursive featureelimination and compare the predicted with the verified statusfrom actual bone marrow aspirates of the same patients. Inter-estingly, the maximum accuracy (73.8%) is achieved for tengenes, five of which are common with the previous 11 genescharacterizing metastatic from nonmetastatic samples. Thesegenes include (TRIB1, GLO1, WIPI1, CXCR4, and BECN1).We perform the same analysis for the CTC labels of this dataset,as presented in [8]. Notice that the analyzed samples are fromBC tissue, whereas the CTC labels are determined using multi-marker QPCR-based CTC assays for PB samples from the samesubjects [8]. The RFE-LASSO approach in LOOCV schemeachieves 77.8% accuracy with 12 genes. This list includes fivecommon genes (TRIB1, CDKN2D, WIPI1, YWHAB, and CXCR4genes) with the previous comparison of DTCs showing goodconsistency with the CTC status. Overall, these independenttests may assess the importance of the extracted panel of 24genes not only in cancer but also in metastasis through dis-seminating or CTCs. This is also supported by the fact that thereported genes have been detected and extracted as commonlyoverexpressed in cancer for both breast tissue and blood, em-phasizing the association of PB in metastasis and indicatinggood prospects in detecting CTCs and cancer-causal moleculesthrough the profiling of bulk blood samples.
C. Biological Comparisons
According to our hypothesis, we aim to identify factors inPB that can indirectly reveal the traffic of CTCs, instead ofCTC detection. This is reflected in the intersection C1 ∩ C2∩ C3, in which genes that are overexpressed in normal bloodare eliminated and remain only genes that are overexpressedin blood due to cancer-associated factors. This gene signatureincludes 24 genes as shown in Fig. 3.
778 IEEE JOURNAL OF BIOMEDICAL AND HEALTH INFORMATICS, VOL. 18, NO. 3, MAY 2014
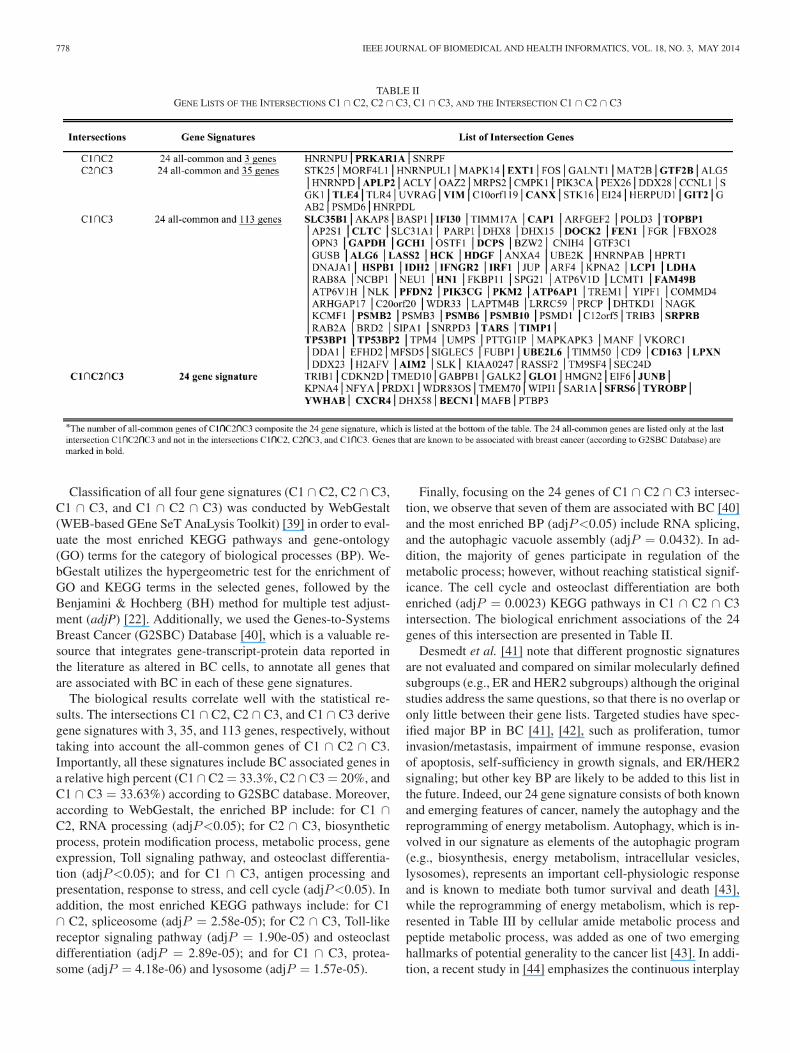
TABLE IIGENE LISTS OF THE INTERSECTIONS C1 ∩ C2, C2 ∩ C3, C1 ∩ C3, AND THE INTERSECTION C1 ∩ C2 ∩ C3
Classification of all four gene signatures (C1 ∩ C2, C2 ∩ C3,C1 ∩ C3, and C1 ∩ C2 ∩ C3) was conducted by WebGestalt(WEB-based GEne SeT AnaLysis Toolkit) [39] in order to eval-uate the most enriched KEGG pathways and gene-ontology(GO) terms for the category of biological processes (BP). We-bGestalt utilizes the hypergeometric test for the enrichment ofGO and KEGG terms in the selected genes, followed by theBenjamini & Hochberg (BH) method for multiple test adjust-ment (adjP) [22]. Additionally, we used the Genes-to-SystemsBreast Cancer (G2SBC) Database [40], which is a valuable re-source that integrates gene-transcript-protein data reported inthe literature as altered in BC cells, to annotate all genes thatare associated with BC in each of these gene signatures.
The biological results correlate well with the statistical re-sults. The intersections C1 ∩ C2, C2 ∩ C3, and C1 ∩ C3 derivegene signatures with 3, 35, and 113 genes, respectively, withouttaking into account the all-common genes of C1 ∩ C2 ∩ C3.Importantly, all these signatures include BC associated genes ina relative high percent (C1 ∩ C2 = 33.3%, C2 ∩ C3 = 20%, andC1 ∩ C3 = 33.63%) according to G2SBC database. Moreover,according to WebGestalt, the enriched BP include: for C1 ∩C2, RNA processing (adjP<0.05); for C2 ∩ C3, biosyntheticprocess, protein modification process, metabolic process, geneexpression, Toll signaling pathway, and osteoclast differentia-tion (adjP<0.05); and for C1 ∩ C3, antigen processing andpresentation, response to stress, and cell cycle (adjP<0.05). Inaddition, the most enriched KEGG pathways include: for C1∩ C2, spliceosome (adjP = 2.58e-05); for C2 ∩ C3, Toll-likereceptor signaling pathway (adjP = 1.90e-05) and osteoclastdifferentiation (adjP = 2.89e-05); and for C1 ∩ C3, protea-some (adjP = 4.18e-06) and lysosome (adjP = 1.57e-05).
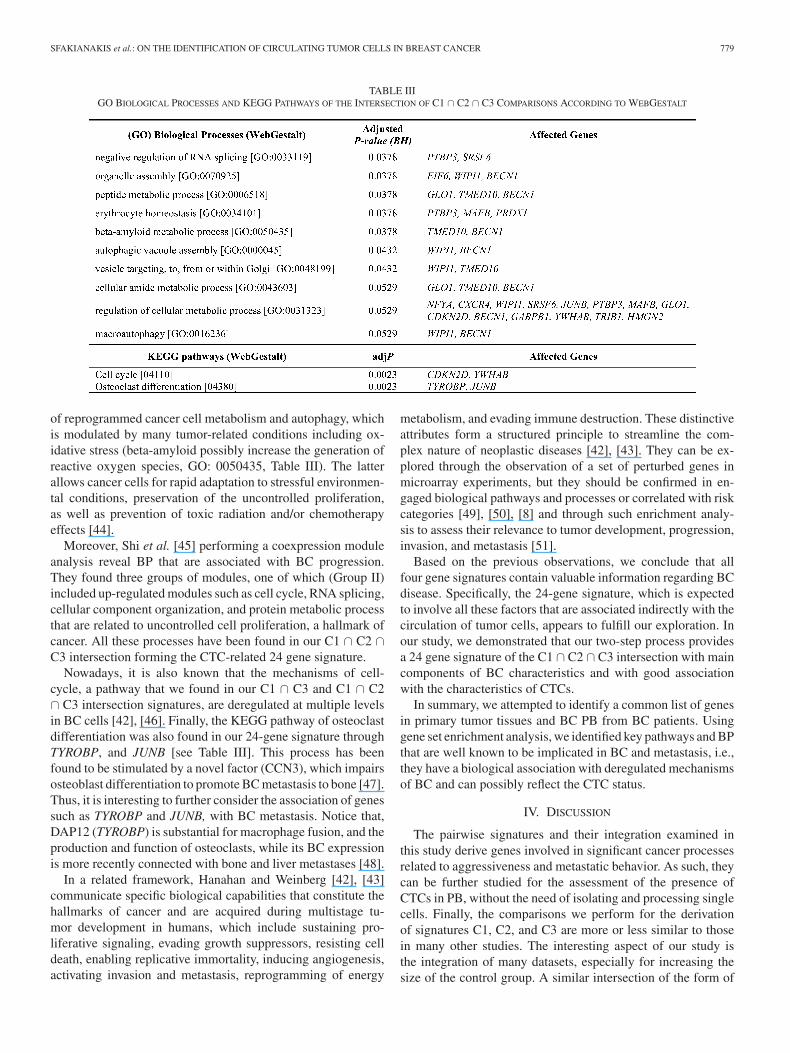
Finally, focusing on the 24 genes of C1 ∩ C2 ∩ C3 intersec-tion, we observe that seven of them are associated with BC [40]and the most enriched BP (adjP<0.05) include RNA splicing,and the autophagic vacuole assembly (adjP = 0.0432). In ad-dition, the majority of genes participate in regulation of themetabolic process; however, without reaching statistical signif-icance. The cell cycle and osteoclast differentiation are bothenriched (adjP = 0.0023) KEGG pathways in C1 ∩ C2 ∩ C3intersection. The biological enrichment associations of the 24genes of this intersection are presented in Table II.
Desmedt et al. [41] note that different prognostic signaturesare not evaluated and compared on similar molecularly definedsubgroups (e.g., ER and HER2 subgroups) although the originalstudies address the same questions, so that there is no overlap oronly little between their gene lists. Targeted studies have spec-ified major BP in BC [41], [42], such as proliferation, tumorinvasion/metastasis, impairment of immune response, evasionof apoptosis, self-sufficiency in growth signals, and ER/HER2signaling; but other key BP are likely to be added to this list inthe future. Indeed, our 24 gene signature consists of both knownand emerging features of cancer, namely the autophagy and thereprogramming of energy metabolism. Autophagy, which is in-volved in our signature as elements of the autophagic program(e.g., biosynthesis, energy metabolism, intracellular vesicles,lysosomes), represents an important cell-physiologic responseand is known to mediate both tumor survival and death [43],while the reprogramming of energy metabolism, which is rep-resented in Table III by cellular amide metabolic process andpeptide metabolic process, was added as one of two emerginghallmarks of potential generality to the cancer list [43]. In addi-tion, a recent study in [44] emphasizes the continuous interplay
SFAKIANAKIS et al.: ON THE IDENTIFICATION OF CIRCULATING TUMOR CELLS IN BREAST CANCER 779
TABLE IIIGO BIOLOGICAL PROCESSES AND KEGG PATHWAYS OF THE INTERSECTION OF C1 ∩ C2 ∩ C3 COMPARISONS ACCORDING TO WEBGESTALT
of reprogrammed cancer cell metabolism and autophagy, whichis modulated by many tumor-related conditions including ox-idative stress (beta-amyloid possibly increase the generation ofreactive oxygen species, GO: 0050435, Table III). The latterallows cancer cells for rapid adaptation to stressful environmen-tal conditions, preservation of the uncontrolled proliferation,as well as prevention of toxic radiation and/or chemotherapyeffects [44].
Moreover, Shi et al. [45] performing a coexpression moduleanalysis reveal BP that are associated with BC progression.They found three groups of modules, one of which (Group II)included up-regulated modules such as cell cycle, RNA splicing,cellular component organization, and protein metabolic processthat are related to uncontrolled cell proliferation, a hallmark ofcancer. All these processes have been found in our C1 ∩ C2 ∩C3 intersection forming the CTC-related 24 gene signature.
Nowadays, it is also known that the mechanisms of cell-cycle, a pathway that we found in our C1 ∩ C3 and C1 ∩ C2∩ C3 intersection signatures, are deregulated at multiple levelsin BC cells [42], [46]. Finally, the KEGG pathway of osteoclastdifferentiation was also found in our 24-gene signature throughTYROBP, and JUNB [see Table III]. This process has beenfound to be stimulated by a novel factor (CCN3), which impairsosteoblast differentiation to promote BC metastasis to bone [47].Thus, it is interesting to further consider the association of genessuch as TYROBP and JUNB, with BC metastasis. Notice that,DAP12 (TYROBP) is substantial for macrophage fusion, and theproduction and function of osteoclasts, while its BC expressionis more recently connected with bone and liver metastases [48].
In a related framework, Hanahan and Weinberg [42], [43]communicate specific biological capabilities that constitute thehallmarks of cancer and are acquired during multistage tu-mor development in humans, which include sustaining pro-liferative signaling, evading growth suppressors, resisting celldeath, enabling replicative immortality, inducing angiogenesis,activating invasion and metastasis, reprogramming of energy
metabolism, and evading immune destruction. These distinctiveattributes form a structured principle to streamline the com-plex nature of neoplastic diseases [42], [43]. They can be ex-plored through the observation of a set of perturbed genes inmicroarray experiments, but they should be confirmed in en-gaged biological pathways and processes or correlated with riskcategories [49], [50], [8] and through such enrichment analy-sis to assess their relevance to tumor development, progression,invasion, and metastasis [51].
Based on the previous observations, we conclude that allfour gene signatures contain valuable information regarding BCdisease. Specifically, the 24-gene signature, which is expectedto involve all these factors that are associated indirectly with thecirculation of tumor cells, appears to fulfill our exploration. Inour study, we demonstrated that our two-step process providesa 24 gene signature of the C1 ∩ C2 ∩ C3 intersection with maincomponents of BC characteristics and with good associationwith the characteristics of CTCs.
In summary, we attempted to identify a common list of genesin primary tumor tissues and BC PB from BC patients. Usinggene set enrichment analysis, we identified key pathways and BPthat are well known to be implicated in BC and metastasis, i.e.,they have a biological association with deregulated mechanismsof BC and can possibly reflect the CTC status.
IV. DISCUSSION
The pairwise signatures and their integration examined inthis study derive genes involved in significant cancer processesrelated to aggressiveness and metastatic behavior. As such, theycan be further studied for the assessment of the presence ofCTCs in PB, without the need of isolating and processing singlecells. Finally, the comparisons we perform for the derivationof signatures C1, C2, and C3 are more or less similar to thosein many other studies. The interesting aspect of our study isthe integration of many datasets, especially for increasing thesize of the control group. A similar intersection of the form of
780 IEEE JOURNAL OF BIOMEDICAL AND HEALTH INFORMATICS, VOL. 18, NO. 3, MAY 2014
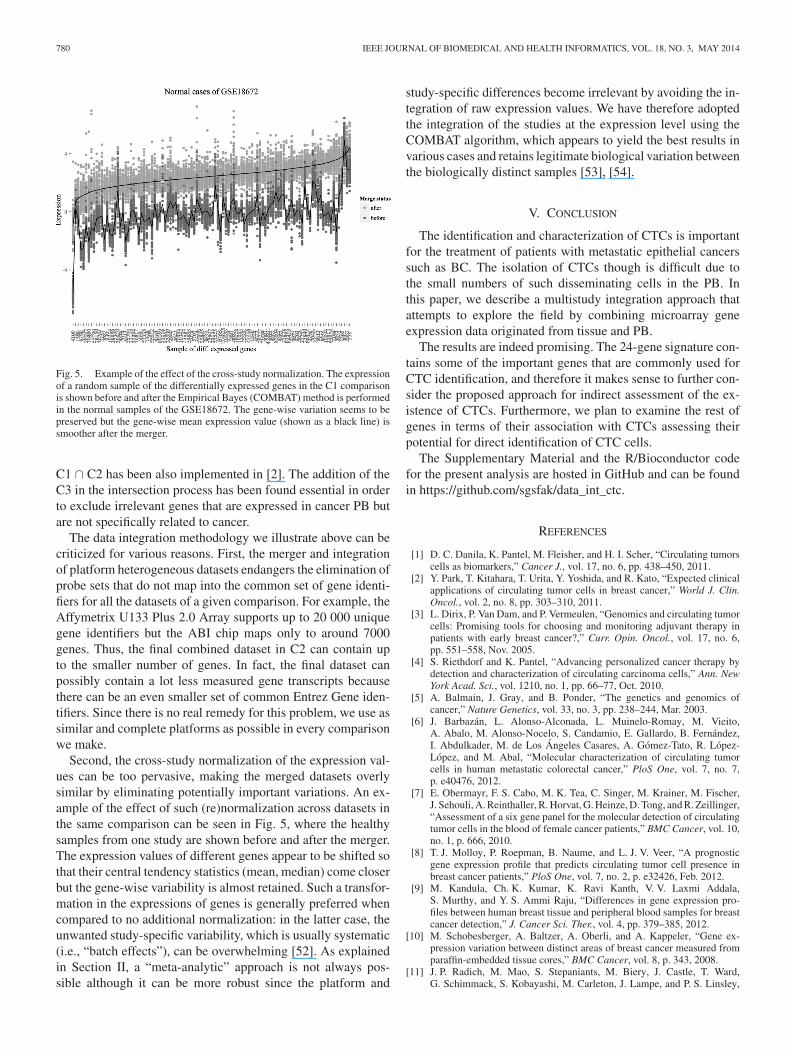
Fig. 5. Example of the effect of the cross-study normalization. The expressionof a random sample of the differentially expressed genes in the C1 comparisonis shown before and after the Empirical Bayes (COMBAT) method is performedin the normal samples of the GSE18672. The gene-wise variation seems to bepreserved but the gene-wise mean expression value (shown as a black line) issmoother after the merger.
C1 ∩ C2 has been also implemented in [2]. The addition of theC3 in the intersection process has been found essential in orderto exclude irrelevant genes that are expressed in cancer PB butare not specifically related to cancer.
The data integration methodology we illustrate above can becriticized for various reasons. First, the merger and integrationof platform heterogeneous datasets endangers the elimination ofprobe sets that do not map into the common set of gene identi-fiers for all the datasets of a given comparison. For example, theAffymetrix U133 Plus 2.0 Array supports up to 20 000 uniquegene identifiers but the ABI chip maps only to around 7000genes. Thus, the final combined dataset in C2 can contain upto the smaller number of genes. In fact, the final dataset canpossibly contain a lot less measured gene transcripts becausethere can be an even smaller set of common Entrez Gene iden-tifiers. Since there is no real remedy for this problem, we use assimilar and complete platforms as possible in every comparisonwe make.
Second, the cross-study normalization of the expression val-ues can be too pervasive, making the merged datasets overlysimilar by eliminating potentially important variations. An ex-ample of the effect of such (re)normalization across datasets inthe same comparison can be seen in Fig. 5, where the healthysamples from one study are shown before and after the merger.The expression values of different genes appear to be shifted sothat their central tendency statistics (mean, median) come closerbut the gene-wise variability is almost retained. Such a transfor-mation in the expressions of genes is generally preferred whencompared to no additional normalization: in the latter case, theunwanted study-specific variability, which is usually systematic(i.e., “batch effects”), can be overwhelming [52]. As explainedin Section II, a “meta-analytic” approach is not always pos-sible although it can be more robust since the platform and
study-specific differences become irrelevant by avoiding the in-tegration of raw expression values. We have therefore adoptedthe integration of the studies at the expression level using theCOMBAT algorithm, which appears to yield the best results invarious cases and retains legitimate biological variation betweenthe biologically distinct samples [53], [54].
V. CONCLUSION
The identification and characterization of CTCs is importantfor the treatment of patients with metastatic epithelial cancerssuch as BC. The isolation of CTCs though is difficult due tothe small numbers of such disseminating cells in the PB. Inthis paper, we describe a multistudy integration approach thatattempts to explore the field by combining microarray geneexpression data originated from tissue and PB.
The results are indeed promising. The 24-gene signature con-tains some of the important genes that are commonly used forCTC identification, and therefore it makes sense to further con-sider the proposed approach for indirect assessment of the ex-istence of CTCs. Furthermore, we plan to examine the rest ofgenes in terms of their association with CTCs assessing theirpotential for direct identification of CTC cells.
The Supplementary Material and the R/Bioconductor codefor the present analysis are hosted in GitHub and can be foundin https://github.com/sgsfak/data_int_ctc.
REFERENCES
[1] D. C. Danila, K. Pantel, M. Fleisher, and H. I. Scher, “Circulating tumorscells as biomarkers,” Cancer J., vol. 17, no. 6, pp. 438–450, 2011.
[2] Y. Park, T. Kitahara, T. Urita, Y. Yoshida, and R. Kato, “Expected clinicalapplications of circulating tumor cells in breast cancer,” World J. Clin.Oncol., vol. 2, no. 8, pp. 303–310, 2011.
[3] L. Dirix, P. Van Dam, and P. Vermeulen, “Genomics and circulating tumorcells: Promising tools for choosing and monitoring adjuvant therapy inpatients with early breast cancer?,” Curr. Opin. Oncol., vol. 17, no. 6,pp. 551–558, Nov. 2005.
[4] S. Riethdorf and K. Pantel, “Advancing personalized cancer therapy bydetection and characterization of circulating carcinoma cells,” Ann. NewYork Acad. Sci., vol. 1210, no. 1, pp. 66–77, Oct. 2010.
[5] A. Balmain, J. Gray, and B. Ponder, “The genetics and genomics ofcancer,” Nature Genetics, vol. 33, no. 3, pp. 238–244, Mar. 2003.
[6] J. Barbazan, L. Alonso-Alconada, L. Muinelo-Romay, M. Vieito,A. Abalo, M. Alonso-Nocelo, S. Candamio, E. Gallardo, B. Fernandez,I. Abdulkader, M. de Los Angeles Casares, A. Gomez-Tato, R. Lopez-Lopez, and M. Abal, “Molecular characterization of circulating tumorcells in human metastatic colorectal cancer,” PloS One, vol. 7, no. 7,p. e40476, 2012.
[7] E. Obermayr, F. S. Cabo, M. K. Tea, C. Singer, M. Krainer, M. Fischer,J. Sehouli, A. Reinthaller, R. Horvat, G. Heinze, D. Tong, and R. Zeillinger,“Assessment of a six gene panel for the molecular detection of circulatingtumor cells in the blood of female cancer patients,” BMC Cancer, vol. 10,no. 1, p. 666, 2010.
[8] T. J. Molloy, P. Roepman, B. Naume, and L. J. V. Veer, “A prognosticgene expression profile that predicts circulating tumor cell presence inbreast cancer patients,” PloS One, vol. 7, no. 2, p. e32426, Feb. 2012.
[9] M. Kandula, Ch. K. Kumar, K. Ravi Kanth, V. V. Laxmi Addala,S. Murthy, and Y. S. Ammi Raju, “Differences in gene expression pro-files between human breast tissue and peripheral blood samples for breastcancer detection,” J. Cancer Sci. Ther., vol. 4, pp. 379–385, 2012.
[10] M. Schobesberger, A. Baltzer, A. Oberli, and A. Kappeler, “Gene ex-pression variation between distinct areas of breast cancer measured fromparaffin-embedded tissue cores,” BMC Cancer, vol. 8, p. 343, 2008.
[11] J. P. Radich, M. Mao, S. Stepaniants, M. Biery, J. Castle, T. Ward,G. Schimmack, S. Kobayashi, M. Carleton, J. Lampe, and P. S. Linsley,
SFAKIANAKIS et al.: ON THE IDENTIFICATION OF CIRCULATING TUMOR CELLS IN BREAST CANCER 781
“Individual-specific variation of gene expression in peripheral bloodleukocytes,” Genomics, vol. 83, no. 6, pp. 980–988, Jun. 2004.
[12] G. Shin, T.-W. Kang, S. Yang, S.-J. Baek, Y.-S. Jeong, and S.-Y. Kim,“GENT: Gene expression database of normal and tumor tissues,” CancerInf., vol. 10, pp. 149–157, 2011.
[13] K. W. Hunter and J. Alsarraj, “Gene expression profiles and breast cancermetastasis: A genetic perspective,” Clin. Exp. Metastasis, vol. 26, no. 6,pp. 497–503, 2009.
[14] R. Edgar, M. Domrachev, and A. E. Lash, “Gene expression omnibus:NCBI gene expression and hybridization array data repository,” Nucl.Acids Res., vol. 30, no. 1, pp. 207–210, Jan. 2002.
[15] G. Marot, J.-L. Foulley, C.-D. Mayer, and F. Jaffrezic, “Moderated effectsize and P-value combinations for microarray meta-analyses,” Bioinfor-matics, vol. 25, no. 20, pp. 2692–2699, Oct. 2009.
[16] F. Jaffrezic, G. Marot, S. Degrelle, I. Hue, and J.-L. Foulley, “A structuralmixed model for variances in differential gene expression studies,” Genet.Res., vol. 89, no. 1, pp. 19–25, Feb. 2007.
[17] J. K. Choi, U. Yu, S. Kim, and O. J. Yoo, “Combining multiple microar-ray studies and modeling interstudy variation,” Bioinformatics, vol. 19,pp. i84–i90, 2003.
[18] O. Troyanskaya, M. Cantor, G. Sherlock, P. Brown, T. Hastie, R. Tibshi-rani, D. Botstein, and R. B. Altman, “Missing value estimation methodsfor DNA microarrays,” Bioinformatics, vol. 17, no. 6, pp. 520–525, Jun.2001.
[19] R. C. Gentleman, V. J. Carey, D. M. Bates, B. Bolstad, M. Dettling,S. Dudoit, B. Ellis, L. Gautier, Y. Ge, J. Gentry, K. Hornik, T. Hothorn,W. Huber, S. Iacus, R. Irizarry, F. Leisch, C. Li, M. Maechler, A. J. Rossini,G. Sawitzki, C. Smith, G. Smyth, L. Tierney, J. Y. H. Yang, and J. Zhang,“Bioconductor: Open software development for computational biologyand bioinformatics,” Genome Biol., vol. 5, no. 10, p. R80, 2004.
[20] W. E. Johnson, C. Li, and A. Rabinovic, “Adjusting batch effects in mi-croarray expression data using empirical Bayes methods,” Biostatistics,vol. 8, no. 1, pp. 118–127, Jan. 2007.
[21] V. G. Tusher, R. Tibshirani, and G. Chu, “Significance analysis of mi-croarrays applied to the ionizing radiation response,” Proc. Nat. Acad.Sci., vol. 98, no. 9, pp. 5116–5121, Apr. 2001.
[22] Y. Benjamini and Y. Hochberg, “Controlling the false discovery rate: Apractical and powerful approach to multiple testing,” J. Roy. Statist. Soc.Series B, vol. 57, pp. 289–300, 1995.
[23] S.-Y. Kim and Y. S. Kim, “A gene sets approach for identifying prognosticgene signatures for outcome prediction,” BMC Genomics, vol. 9, p. 177,2008.
[24] F. J. Lopez, M. Cuadros, C. Cano, A. Concha, and A. Blanco, “Biomed-ical application of fuzzy association rules for identifying breast cancerbiomarkers,” Med. Biol. Eng. Comput., vol. 50, no. 9, pp. 981–990, Sep.2012.
[25] C. Clarke, S. F. Madden, P. Doolan, S. T. Aherne, H. Joyce, L. O’Driscoll,W. M. Gallagher, B. T. Hennessy, M. Moriarty, J. Crown, S. Kennedy,and M. Clynes, “Correlating transcriptional networks to breast cancersurvival: A large-scale coexpression analysis,” Carcinogenesis, vol. 34,pp. 2300–2308, Jul. 2013.
[26] T. Barrett, T. O. Suzek, D. B. Troup, S. E. Wilhite, W.-C. Ngau, P. Ledoux,D. Rudnev, A. E. Lash, W. Fujibuchi, and R. Edgar, “NCBI GEO: Miningmillions of expression profiles–database and tools,” Nucleic Acids Res.,vol. 33, pp. D562–D566, Jan. 2005.
[27] R.-Z. Liu, K. Graham, D. D. Glubrecht, D. R. Germain, J. R. Mackey,and R. Godbout, “Association of FABP5 expression with poor survival intriple-negative breast cancer,” Amer. J. Pathology, vol. 178, no. 3, pp. 997–1008, Mar. 2011.
[28] E. Enerly, I. Steinfeld, K. Kleivi, S.-K. Leivonen, M. R. Aure,H. G. Russnes, J. A. Rønneberg, H. Johnsen, R. Navon, E. Rødland,R. Makela, B. Naume, M. Perala, O. Kallioniemi, V. N. Kristensen,Z. Yakhini, and A.-L. Børresen-Dale, “miRNA-mRNA integrated analy-sis reveals roles for miRNAs in primary breast tumors,” PloS One, vol. 6,no. 2, p. e16915, Feb. 2011.
[29] A. Tripathi, C. King, and A. de la Morenas, “Gene expression abnormali-ties in histologically normal breast epithelium of breast cancer patients,”Int. J. Cancer, vol. 122, pp. 1557–1566, 2008.
[30] V. D. Haakensen, M. Biong, O. C. Lingjærde, M. M. Holmen,J. O. Frantzen, Y. Chen, D. Navjord, L. Romundstad, T. Luders,I. K. Bukholm, H. K. Solvang, V. N. Kristensen, G. Ursin, A.-L. Børresen-Dale, and A. Helland, “Expression levels of uridine 5’-diphospho-glucuronosyltransferase genes in breast tissue from healthy women areassociated with mammographic density,” Breast Cancer Res., vol. 12,no. 4, p. R65, 2010.
[31] H. G. LaBreche, J. R. Nevins, and E. Huang, “Integrating factor analysisand a transgenic mouse model to reveal a peripheral blood predictor ofbreast tumors,” BMC Med. Genomics, vol. 4, p. 61, 2011.
[32] J. Aaroe, T. Lindahl, V. Dumeaux, S. Saebo, D. Tobin, N. Hagen, P. Skaane,A. Lonneborg, P. Sharma, and A. L. B. Dale, “Gene expression profiling ofperipheral blood cells for early detection of breast cancer,” Breast CancerRes., vol. 12, no. 1, p. R7, 2010.
[33] I. B. Pau Ni, Z. Zakaria, R. Muhammad, N. Abdullah, N. Ibrahim, N. AinaEmran, N. Hisham Abdullah, and S. N. A. Syed Hussain, “Gene expres-sion patterns distinguish breast carcinomas from normal breast tissues: TheMalaysian context,” Pathology—Res. Practice, vol. 206, no. 4, pp. 223–228, Apr. 2010.
[34] K. P. Hoeflich, C. O’Brien, Z. Boyd, G. Cavet, S. Guerrero, K. Jung,T. Januario, H. Savage, E. Punnoose, T. Truong, W. Zhou, L. Berry,L. Murray, L. Amler, M. Belvin, L. S. Friedman, and M. R. Lackner,“In vivo antitumor activity of MEK and phosphatidylinositol 3-kinaseinhibitors in basal-like breast cancer models,” Clin. Cancer Res., vol. 15,no. 14, pp. 4649–4664, Jul. 2009.
[35] A. A. Powell, A. H. Talasaz, H. Zhang, M. A. Coram, A. Reddy, G. Deng,M. L. Telli, R. H. Advani, R. W. Carlson, J. A. Mollick, S. Sheth,A. W. Kurian, J. M. Ford, F. E. Stockdale, S. R. Quake, R. F. Pease,M. N. Mindrinos, G. Bhanot, S. H. Dairkee, R. W. Davis, and S. S. Jeffrey,“Single cell profiling of circulating tumor cells: Transcriptional hetero-geneity and diversity from breast cancer cell lines,” PloS One, vol. 7,no. 5, p. e33788, May 2012.
[36] J. H. Choi, N. R. Shin, H. J. Moon, C. H. Kwon, G. H. Kim, G. A. Song,T. Y. Jeon, D. H. Kim, D. H. Kim, and D. Y. Park, “Identification ofS100A8 and S100A9 as negative regulators for lymph node metastasis ofgastric adenocarcinoma,” Histol. Histopathol., vol. 27, no. 11, pp. 1439–1448, Nov. 2012.
[37] B. Weigelt, A. M. Glas, L. F. A. Wessels, A. T. Witteveen, J. L. Peterse,and L. J. van’t Veer, “Gene expression profiles of primary breast tumorsmaintained in distant metastases,” Proc. Nat. Acad. Sci. United States ofAmerica, vol. 100, no. 26, pp. 15901–15905, Dec. 2003.
[38] J. M. Wu, M. J. Fackler, M. K. Halushka, D. W. Molavi, M. E. Taylor,W. W. Teo, C. Griffin, J. Fetting, N. E. Davidson, A. M. De Marzo,J. L. Hicks, D. Chitale, M. Ladanyi, S. Sukumar, and P. Argani, “Het-erogeneity of breast cancer metastases: Comparison of therapeutic targetexpression and promoter methylation between primary tumors and theirmultifocal metastases,” Clin. Cancer Res., vol. 14, no. 7, pp. 1938–1946,Apr. 2008.
[39] B. Zhang, S. Kirov, and J. Snoddy, “WebGestalt: An integrated system forexploring gene sets in various biological contexts,” Nucleic Acids Res.,vol. 33, pp. W741–W748, 2005.
[40] E. Mosca, R. Alfieri, I. Merelli, F. Viti, A. Calabria, and L. Milanesi, “Amultilevel data integration resource for breast cancer study,” BMC Syst.Biol., vol. 4, no. 1, p. 76, 2010.
[41] C. Desmedt, B. Haibe-Kains, P. Wirapati, M. Buyse, D. Larsimont,G. Bontempi, M. Delorenzi, M. Piccart, and C. Sotiriou, “Biologicalprocesses associated with breast cancer clinical outcome depend on themolecular subtypes,” Clinical Cancer Res., vol. 14, no. 16, pp. 5158–5165,Aug. 2008.
[42] D. Hanahan and R. Weinberg, “The hallmarks of cancer,” Cell, vol. 100,no. 1, pp. 57–70, 2000.
[43] D. Hanahan and R. A. Weinberg, “Hallmarks of cancer: The next genera-tion,” Cell, vol. 144, no. 5, pp. 646–674, Mar. 2011.
[44] F. Lozy and V. Karantza, “Autophagy and cancer cell metabolism,” Semin.Cell Dev. Biol., vol. 23, no. 4, pp. 395–401, Jun. 2012.
[45] Z. Shi, C. K. Derow, and B. Zhang, “Co-expression module analysis re-veals biological processes, genomic gain, and regulatory mechanisms as-sociated with breast cancer progression,” BMC Syst. Biol., vol. 4, p. 74,2010.
[46] C. E. Caldon, R. J. Daly, R. L. Sutherland, and E. A. Musgrove, “Cellcycle control in breast cancer cells,” J. Cell. Biochem., vol. 97, no. 2,pp. 261–274, 2006.
[47] V. Ouellet, K. Tiedemann, A. Mourskaia, J. E. Fong, D. Tran-Thanh,E. Amir, M. Clemons, B. Perbal, S. V. Komarova, and P. M. Siegel, “CCN3impairs osteoblast and stimulates osteoclast differentiation to favor breastcancer metastasis to bone,” Amer. J. Pathol., vol. 178, no. 5, pp. 2377–2388, May 2011.
[48] I. Shabo, H. Olsson, O. Stal, and J. Svanvik, “Breast cancer expression ofDAP12 is associated with skeletal and liver metastases and poor survival,”Clin. Breast Cancer, vol. 13, pp. 371–377, Oct. 2013.
[49] P. Wirapati, C. Sotiriou, S. Kunkel, P. Farmer, S. Pradervand, B. Haibe-Kains, C. Desmedt, M. Ignatiadis, T. Sengstag, F. E. D. E. R. Schutz,

782 IEEE JOURNAL OF BIOMEDICAL AND HEALTH INFORMATICS, VOL. 18, NO. 3, MAY 2014
D. R. Goldstein, M. Piccart, and M. Delorenzi, “Meta-analysis of geneexpression profiles in breast cancer: Toward a unified understanding ofbreast cancer subtyping and prognosis signatures,” Breast Cancer Res.,vol. 10, no. 4, p. R65, 2008.
[50] C. Fan, D. S. Oh, L. Wessels, B. Weigelt, D. S. A. Nuyten, A. B. Nobel,L. J. van’t Veer, and C. M. Perou, “Concordance among gene-expression-based predictors for breast cancer,” N. Engl. J. Med., vol. 355, no. 6,pp. 560–569, Aug. 2006.
[51] J.-H. Hung, “Gene Set/Pathway enrichment analysis,” Methods Mol. Biol.,vol. 939, pp. 201–213, 2013.
[52] J. T. Leek, R. B. Scharpf, H. C. Bravo, D. Simcha, B. Langmead,W. E. Johnson, D. Geman, K. Baggerly, and R. A. Irizarry, “Tacklingthe widespread and critical impact of batch effects in high-throughputdata,” Nature Rev. Genetics, vol. 11, no. 10, pp. 733–739, Sep. 2010.
[53] G. Tsiliki, M. Zervakis, M. Ioannou, E. Sanidas, E. Stathopoulos,G. Potamias, M. Tsiknakis, and D. Kafetzopoulos, “Multi-platform dataintegration in microarray analysis,” IEEE Trans. Inf. Technol. Biomed.,vol. 15, no. 6, pp. 806–812, Nov. 2011.
[54] A. Turnbull, R. Kitchen, A. Larionov, L. Renshaw, J. Dixon, and A. Sims,“Direct integration of intensity-level data from Affymetrix and Illuminamicroarrays improves statistical power for robust reanalysis,” BMC Med.Genomics, vol. 5, no. 1, p. 35, 2012.
Authors’ photographs and biographies not available at the time of publication.