Segmentation and Classification of Breast Tumor Using Dynamic Contrast-Enhanced MR Images
12
Segmentation and Classification of Breast Tumor Using Dynamic Contrast-Enhanced MR Images Yuanjie Zheng, Sajjad Baloch, Sarah Englander, Mitchell D. Schnall, and Dinggang Shen Department of Radiology, University of Pennsylvania, Philadelphia, PA 19104, USA Abstract Accuracy of automatic cancer diagnosis is largely determined by two factors, namely, the precision of tumor segmentation, and the suitability of extracted features for discrimination between malignancy and benignancy. In this paper, we propose a new framework for accurate characterization of tumors in contrast enhanced MR images. First, a new graph cut based segmentation algorithm is developed for refining coarse manual segmentation, which allows precise identification of tumor regions. Second, by considering serial contrast-enhanced images as a single spatio-temporal image, a spatio-temporal model of segmented tumor is constructed to extract Spatio-Temporal Enhancement Patterns (STEPs). STEPs are designed to capture not only dynamic enhancement and architectural features, but also spatial variations of pixel-wise temporal enhancement of the tumor. While temporal enhancement features are extracted through Fourier transform, the resulting STEP framework captures spatial patterns of temporal enhancement features via moment invariants and rotation invariant Gabor textures. High accuracy of the proposed framework is a direct consequence of this two pronged approach, which is validated through experiments yielding, for instance, an area of 0.97 under the ROC curve. 1 Introduction Dynamic contrast-enhanced MR imaging (DCE-MRI) is emerging as an important complementary diagnostic tool for early detection of breast cancer [1]. It involves characterizing temporal response of a tumor to a contrast agent prior to analyzing discriminating features between various tumor types. High sensitivity of DCE-MRI to breast cancer detection is, however, confounded by its relatively low specificity [2]. Existing approaches attempt to improve low specificity through better segmentation [3] and/or complete characterization of tumor (using architectural and dynamic features [4,1]). Expert manual segmentation, regarded as gold standard for tumor segmentation, is usually tedious and time consuming. In addition, it suffers from inaccuracy due to imprecision, which results in high inter- and intra-rater variability. Numerous segmentation methods [3,5,6] have recently been proposed to address these limitations. These algorithms are driven by a simple assumption that considers enhancements within tumor to be uniform, limiting only one class per tumor. Here, we propose a graph cut [7] based segmentation algorithm that accounts for spatial variations of enhancements, and allows association of multiple classes to the tumor and background for a more accurate tumor extraction. Tumor classification employs segmented tumor to extract appropriate features, which are eventually used for cancer diagnosis. Two such features, namely dynamic and architectural features [4,1,2,3], have extensively been investigated for quantifying tumor properties. For instance, an early strong enhancement with rapid washout has been observed in malignant tumors. On the other hand, a slow increase in the temporal enhancement followed by a tapering off is typically exhibited by benign tumors. Majority of the existing dynamic features exploit NIH Public Access Author Manuscript Med Image Comput Comput Assist Interv. Author manuscript; available in PMC 2010 March 17. Published in final edited form as: Med Image Comput Comput Assist Interv. 2007 ; 10(Pt 2): 393–401. NIH-PA Author Manuscript NIH-PA Author Manuscript NIH-PA Author Manuscript
-
Upload
independent -
Category
Documents
-
view
4 -
download
0
Transcript of Segmentation and Classification of Breast Tumor Using Dynamic Contrast-Enhanced MR Images

Segmentation and Classification of Breast Tumor Using DynamicContrast-Enhanced MR Images
Yuanjie Zheng, Sajjad Baloch, Sarah Englander, Mitchell D. Schnall, and Dinggang ShenDepartment of Radiology, University of Pennsylvania, Philadelphia, PA 19104, USA
AbstractAccuracy of automatic cancer diagnosis is largely determined by two factors, namely, the precisionof tumor segmentation, and the suitability of extracted features for discrimination betweenmalignancy and benignancy. In this paper, we propose a new framework for accurate characterizationof tumors in contrast enhanced MR images. First, a new graph cut based segmentation algorithm isdeveloped for refining coarse manual segmentation, which allows precise identification of tumorregions. Second, by considering serial contrast-enhanced images as a single spatio-temporal image,a spatio-temporal model of segmented tumor is constructed to extract Spatio-Temporal EnhancementPatterns (STEPs). STEPs are designed to capture not only dynamic enhancement and architecturalfeatures, but also spatial variations of pixel-wise temporal enhancement of the tumor. While temporalenhancement features are extracted through Fourier transform, the resulting STEP frameworkcaptures spatial patterns of temporal enhancement features via moment invariants and rotationinvariant Gabor textures. High accuracy of the proposed framework is a direct consequence of thistwo pronged approach, which is validated through experiments yielding, for instance, an area of 0.97under the ROC curve.
1 IntroductionDynamic contrast-enhanced MR imaging (DCE-MRI) is emerging as an importantcomplementary diagnostic tool for early detection of breast cancer [1]. It involvescharacterizing temporal response of a tumor to a contrast agent prior to analyzingdiscriminating features between various tumor types. High sensitivity of DCE-MRI to breastcancer detection is, however, confounded by its relatively low specificity [2]. Existingapproaches attempt to improve low specificity through better segmentation [3] and/or completecharacterization of tumor (using architectural and dynamic features [4,1]).
Expert manual segmentation, regarded as gold standard for tumor segmentation, is usuallytedious and time consuming. In addition, it suffers from inaccuracy due to imprecision, whichresults in high inter- and intra-rater variability. Numerous segmentation methods [3,5,6] haverecently been proposed to address these limitations. These algorithms are driven by a simpleassumption that considers enhancements within tumor to be uniform, limiting only one classper tumor. Here, we propose a graph cut [7] based segmentation algorithm that accounts forspatial variations of enhancements, and allows association of multiple classes to the tumor andbackground for a more accurate tumor extraction.
Tumor classification employs segmented tumor to extract appropriate features, which areeventually used for cancer diagnosis. Two such features, namely dynamic and architecturalfeatures [4,1,2,3], have extensively been investigated for quantifying tumor properties. Forinstance, an early strong enhancement with rapid washout has been observed in malignanttumors. On the other hand, a slow increase in the temporal enhancement followed by a taperingoff is typically exhibited by benign tumors. Majority of the existing dynamic features exploit
NIH Public AccessAuthor ManuscriptMed Image Comput Comput Assist Interv. Author manuscript; available in PMC 2010 March 17.
Published in final edited form as:Med Image Comput Comput Assist Interv. 2007 ; 10(Pt 2): 393–401.
NIH
-PA Author Manuscript
NIH
-PA Author Manuscript
NIH
-PA Author Manuscript

these simple enhancement differences within a region of interest taken inside a tumor.Architectural features, on the other hand, are driven by morphological differences, with aspiculated border and irregular shape attributed to malignancy versus a smooth border andregular shape related to benignancy. The information in such dynamic and architecturalfeatures is, however, limited in the scope in the sense that their combination lackscomprehensive spatial variations of pixel-wise temporal enhancements (TE). These spatialpatterns have been shown to be fundamentally important for distinguishing malignant andbenign tumors [4,1]. Although the spatial information incorporated in [4,1] offers someimprovement, their dependence on qualitative ratings by experts limits their utility forautomatic diagnosis.
In this paper, we propose a framework for cancer diagnosis that combines temporal, spatial,and morphological attributes of an automatically segmented tumor in a Spatio-TemporalEnhancement Pattern (STEP). STEP views a serial contrast-enhanced images as a single spatio-temporal image and consequently models its temporal variations through Fourier transformcoefficients. Spatial and morphological features are then accounted for by moment invariants[8] and Gabor texture features [9]. Our segmentation refinement algorithm coupled with STEPfeatures provides a robust framework for cancer diagnosis, which is validated with tumorclassification using a linear classifier. Instead of using the entire set of STEP features in theclassifier, we employ a simple ranking-based feature selection method that helps in finding themost discriminating features between malignancy and benignancy.
2 MethodsThis section describes our breast cancer diagnosis framework, which consists of tumorsegmentation, STEP feature extraction, and tumor classification.
2.1 SegmentationDiscrimination between benign and malignant breast tumors may be greatly enhanced byaccurate segmentation [3] that precisely identifies spatial domain of a tumor. To this end, wedevelop a graph-cut based algorithm [7] for tumor segmentation, which improves on a coarsemanual segmentation, thereby eliminating the need of an expert rater. It involves assigningsame labels to pixels with similar TE vectors by minimizing an energy functional.
TE vector Ci = [C (i, 1) ···C (i, T − 1)] of a pixel i is defined as:
(1)
where I(i, t) denotes the intensity of ith pixel at scanning time t.
The energy function is defined as below, which consists of four terms:
Zheng et al. Page 2
Med Image Comput Comput Assist Interv. Author manuscript; available in PMC 2010 March 17.
NIH
-PA Author Manuscript
NIH
-PA Author Manuscript
NIH
-PA Author Manuscript
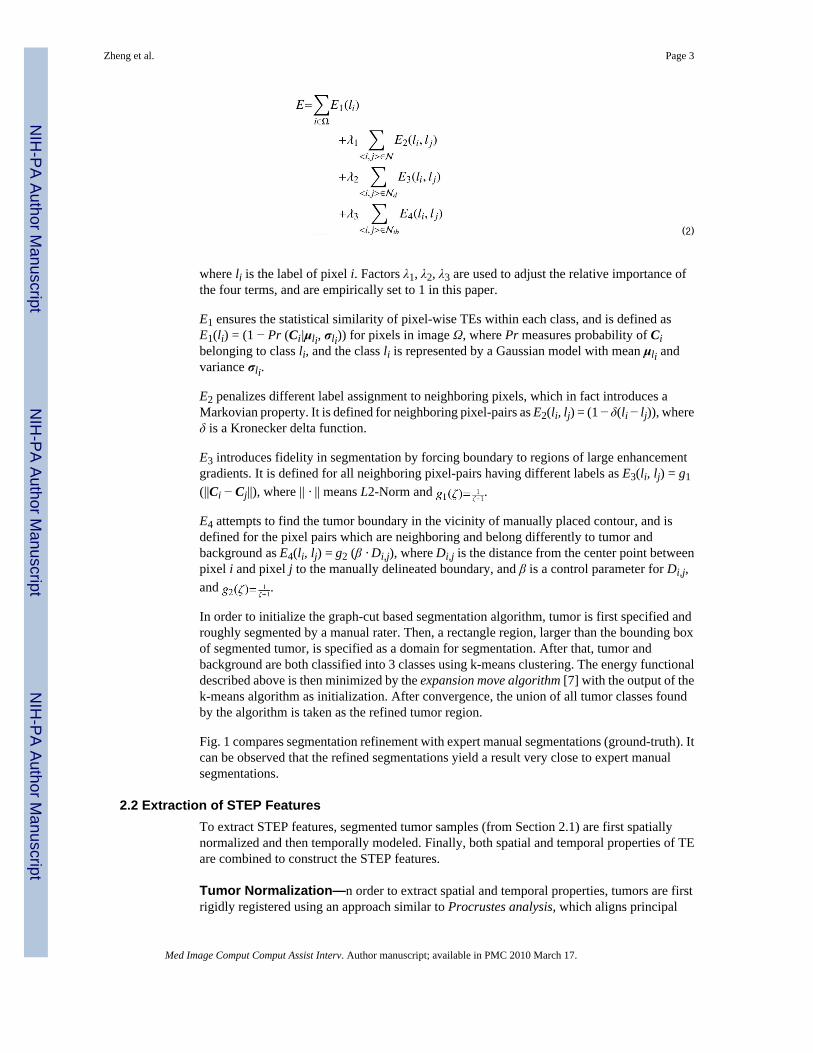
(2)
where li is the label of pixel i. Factors λ1, λ2, λ3 are used to adjust the relative importance ofthe four terms, and are empirically set to 1 in this paper.
E1 ensures the statistical similarity of pixel-wise TEs within each class, and is defined asE1(li) = (1 − Pr (Ci|μli, σli)) for pixels in image Ω, where Pr measures probability of Cibelonging to class li, and the class li is represented by a Gaussian model with mean μli andvariance σli.
E2 penalizes different label assignment to neighboring pixels, which in fact introduces aMarkovian property. It is defined for neighboring pixel-pairs as E2(li, lj) = (1 − δ(li − lj)), whereδ is a Kronecker delta function.
E3 introduces fidelity in segmentation by forcing boundary to regions of large enhancementgradients. It is defined for all neighboring pixel-pairs having different labels as E3(li, lj) = g1(||Ci − Cj||), where || · || means L2-Norm and .
E4 attempts to find the tumor boundary in the vicinity of manually placed contour, and isdefined for the pixel pairs which are neighboring and belong differently to tumor andbackground as E4(li, lj) = g2 (β · Di,j), where Di,j is the distance from the center point betweenpixel i and pixel j to the manually delineated boundary, and β is a control parameter for Di,j,and .
In order to initialize the graph-cut based segmentation algorithm, tumor is first specified androughly segmented by a manual rater. Then, a rectangle region, larger than the bounding boxof segmented tumor, is specified as a domain for segmentation. After that, tumor andbackground are both classified into 3 classes using k-means clustering. The energy functionaldescribed above is then minimized by the expansion move algorithm [7] with the output of thek-means algorithm as initialization. After convergence, the union of all tumor classes foundby the algorithm is taken as the refined tumor region.
Fig. 1 compares segmentation refinement with expert manual segmentations (ground-truth). Itcan be observed that the refined segmentations yield a result very close to expert manualsegmentations.
2.2 Extraction of STEP FeaturesTo extract STEP features, segmented tumor samples (from Section 2.1) are first spatiallynormalized and then temporally modeled. Finally, both spatial and temporal properties of TEare combined to construct the STEP features.
Tumor Normalization—n order to extract spatial and temporal properties, tumors are firstrigidly registered using an approach similar to Procrustes analysis, which aligns principal
Zheng et al. Page 3
Med Image Comput Comput Assist Interv. Author manuscript; available in PMC 2010 March 17.
NIH
-PA Author Manuscript
NIH
-PA Author Manuscript
NIH
-PA Author Manuscript

directions corresponding to the distribution of pixels of each tumor sample and scales tumorsizes for equal largest principal modes. As a result, all tumor samples are normalized to havesimilar predefined principal directions, in addition to the same “largest eigenvalues” as shownin Fig. 2.
Temporal Enhancement (TE) Modeling—While several signal decompositions, such asFourier, wavelet transforms, and wavelet packets, may be exploited to model temporal responseof a breast tissue, we adopt Fourier transform to model pixel-wise temporal enhancement, dueto its simplicity. Discrete Fourier Transform (DFT) of TE (given by Eq. (1)) yields T − 1coefficients for each pixel. Combining all pixels in the tumor results in Nt = T − 1 DFTcoefficient maps which provide a frequency domain representation of the spatio-temporalenhancement image. An example of a DFT based TE map is given in Fig. 2.
Spatial Description of TE Maps—DFT based TE maps given in Fig. 2 indicate that bothglobal morphological attributes of a tumor and local variations in the TE map can formdistinguishing characteristics of malignant and benign tumors. Accordingly, we employ twotypes of rotation-invariant features, namely, moment invariants [8] for global properties, andGabor textures [9] for local attributes. Consequently, we compute Hu’s Hm = 7 momentinvariants for each of Nt TE maps in addition to Hg = Z × K rotation-invariant Gabor texturefeatures for K orientations within a period of π and Z radial frequencies. We set K = 4 and Z =8 in our experiments.
The resulting STEP features for TE maps out of a total of Nt TE maps providea rich characterization of a tumor, thereby incorporating spatial, temporal, and morphologicalattributes.
2.3 Tumor ClassificationWe validate tumor segmentation and the resulting STEP features by classifying tumors intobenign and malignant. It should be noted that STEP features are derived for completecharacterization of a tumor, some of which may not be discriminative between the two classes.It is, therefore, important to select a smaller set of most distinctive STEP features before tumorclassification. In this paper, we employ Fisher Linear Discriminant based Linear DiscriminantAnalysis(LDA) [10] classifier, along with a simple t-score ranking-based feature selectionmethod. Although one may obtain better performance by using advanced features selection[11] and nonlinear classification [12], the results provided serve as the baseline performance.Due to limited sample size, leave-one-out cross-validation framework is employed.
3 Experimental ResultsDCE-MRI data of bilateral fat suppressed T2 weighted image for 31 subjects were acquiredfrom UPenn under PO1CA085424 (Clinical evaluation of multimodality breast imaging).Sequential post contrast acquisitions were acquired for approximately 6 minutes followingcontrast injection. There are 22 malignant and 9 benign tumors, which were histologicallyverified. All the subjected were aligned before performing our algorithms.
Two experiments were performed to evaluate the proposed segmentation algorithm and theSTEP features. Classification performance was consequently compared through receiveroperating characteristic (ROC) curves (fitted with [13]), sensitivity, specificity, and accuracyfor various tumor features.
Zheng et al. Page 4
Med Image Comput Comput Assist Interv. Author manuscript; available in PMC 2010 March 17.
NIH
-PA Author Manuscript
NIH
-PA Author Manuscript
NIH
-PA Author Manuscript

• Evaluation of Segmentation AlgorithmWe compare the performances of tumor classification on roughly-segmented tumor samplesby manual rater, segmentation-refined tumor samples, and expert-segmented tumor samples.
As indicated by ROC curves in Fig. 3, the segmentation refinement algorithm improves tumorclassification, which is consistent with the results reported in [3]. Highly coincident ROCcurves for refined segmentation based- and expert segmentation based-classification given inFig. 3 indicate that our segmentation algorithm yields a performance comparable to that forexpert segmentations.
Besides, based on all our testing samples, the mean and the standard deviation of boundarydistances between our segmentation and expert segmentation are 4.10 and 5.62 pixels, whichare much less than the mean and the standard deviation of boundary distances obtained betweenrough segmentation and expert segmentation, i.e., 7.67 and 8.24 pixels.
• Validation of STEP FeaturesPerformance of STEP features was compared with various existing features. Seven dynamicfeatures (D = {D1, ···, D7}), six architectural features (A = {A1, ···, A6}), and nine features ofspatial variations of TE (V = {V1, ···, V9}) were selected (See Appendix for details).Classification performance of individual features {A, D, V }, their combinations {A ∪ D, A ∪D ∪ V}, and the proposed STEP features was compared using feature selection and leave-one-out classification procedure explained in Section 2.3.
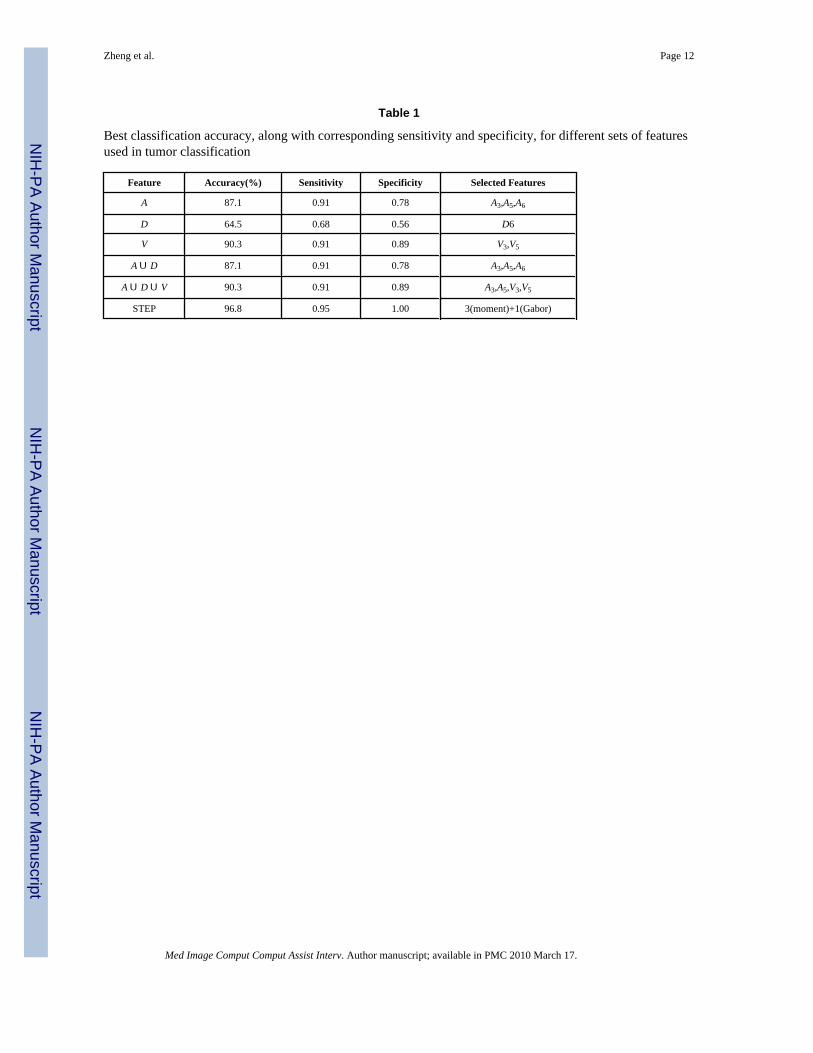
ROC curves and their AUC values for various features are given in Fig. 4. Best classificationaccuracy, corresponding sensitivity and specificity, along with features selected by our featureselection method, are listed in Table 1. Four selected STEP features (shown in the last row ofTable 1) include 3 moment invariants and 1 local Gabor texture feature.
Combining general architectural and dynamic features (A ∪ D) for tumor diagnosis, did notimprove the AUC value or the best classification rate as compared to the architectural features.This may be due to the simple ranking-based feature selection, which may fail to optimallycombine architectural and dynamic features. On the other hand, spatial variation of contrastenhancement was proved very effective in distinguishing malignant and benign tumors.Although the combination of this feature with architectural and dynamic features (A ∪ D ∪V) fell short of providing an outright improvement in classification rate (compared to V) asshown in Table 1, it improved AUC from 0.89 to 0.93 as shown in Fig. 4. This clearlydemonstrates that TE, architectural structure, and spatial variation of TE all play an importantrole in distinguishing malignant and benign tumors.
In all experiments, STEP features offered the best performance, with AUC, classification rate,sensitivity, and specificity all showing improvements. The fact that both moment invariantsand local Gabor texture features were selected as STEP features for tumor classificationvalidates our hypothesis that capturing both global and local variations of contrast enhancementis important in distinguishing between malignant and benign breast tumors. In particular, the6th moment invariant of the 2nd DFT coefficient map, the 1st moment invariant of the 1st DFTcoefficient map, the 2nd moment invariant of the 4th DFT coefficient map, and one texturefeature were selected, respectively.
4 ConclusionIn this paper, we have proposed a framework for extracting Spatio-Temporal EnhancementPattern (STEP) that completely characterizes three tumor properties, namely, temporalenhancement, architectural structure, and spatial variations of pixel-wise temporal
Zheng et al. Page 5
Med Image Comput Comput Assist Interv. Author manuscript; available in PMC 2010 March 17.
NIH
-PA Author Manuscript
NIH
-PA Author Manuscript
NIH
-PA Author Manuscript
enhancement. STEP features were validated through tumor classification, where experimentalresults show better tumor classification performance with STEP features, than that withindividual and pairwise features. We have also shown that STEP features are benefited greatlyby the proposed segmentation refinement algorithm as indicated by the tumor classificationresults, which are consistent with those for expert segmentations. Future work involvesextensive evaluation of our methods with a larger database.
References1. Schnall M, et al. Diagnostic architectural and dynamic features at breast MR imaging: Multicenter
study. Radiology 2006;238:42–53. [PubMed: 16373758]2. Gilhuijs K, et al. Computerized analysis of breast lesions in three dimensions using dynamic magnetic-
resonance imaging. Med Phys 1998;25:1647–1654. [PubMed: 9775369]3. Tanner, C., et al. Classification improvement by segmentation refinement: Application to contrast-
enhanced MR-mammography. In: Barillot, C.; Haynor, DR.; Hellier, P., editors. LNCS; MICCAI;2004; Heidelberg: Springer; 2004. p. 184-191.
4. Szabo B, et al. Dynamic MR imaging of the breast: Analysis of kinetic and morphologic diagnosticcriteria. Acta Radiol 2003;44:379–386. [PubMed: 12846687]
5. Meinel L, et al. Breast MRI lesion classification: Improved performance of human readers with abackpropagation neural network computer-aided diagnosis (CAD) system. J Magn Reson Imaging2007;25:89–95. [PubMed: 17154399]
6. Wismuller A, et al. Segmentation and classification of dynamic breast magnetic resonance image data.J Electron Imaging 2006;15:013020–1–013020–13.
7. Boykov Y, et al. Fast approximate energy minimization via graph cuts. IEEE Trans Pattern Anal MachIntell 2001;23:1222–1239.
8. Hu M. Visual pattern recognition by moment invariants. IRE Trans Information Theory 1962:179–187.
9. Tan T. Rotation invariant texture features and their use in automatic script identification. IEEE TransPattern Anal Mach Intell 1998;20:751–756.
10. Lachenbruch, P. Discriminant Analysis. Hafner Press; 1975.11. Guyon I, et al. Gene selection for cancer classification using support vector machines. Mach Learn
2002;46:389–422.12. Vapnik, V. Statistical Learning Theory. Wiley Interscience; New York, NY, USA: 1998.13. Metz C, et al. Maximum likelihood estimation of receiver operating characteristic (ROC) curves from
continuously-distributed data. Stat Med 1998;17:1033–1053. [PubMed: 9612889]14. Tanner C, et al. Does registration improve the performance of a computer aided diagnosis system for
dynamic contrast-enhanced MR mammography. ISBI 2006 2006:466–469.15. Chen W, et al. Computerized interpretation of breast MRI: Investigation of enhancement-variance
dynamics. Med Phys 2004;31:1076–1082. [PubMed: 15191295]16. Chen, X., et al. Simultanous segmentation and registration of contrast-enhanced breast MRI. In:
Christensen, GE.; Sonka, M., editors. LNCS; IPMI; 2005; Heidelberg: Springer; 2005. p. 126-137.
5 AppendixFor the dynamic features, we selected the standard deviation of enhancement (D1), maximumwashout (D2) [14], the maximum uptake (D3), uptake rate (D4), washout rate (D5) [15], andthe two features (D6) and (D7) extracted from the enhancement curve modelled by the Hayton-Brady pharmacodynamic model in [16]. Notice that the dynamic features were all computedfrom the average intensities over the tumor area at every time point.
For the architectural features, we selected the compactness (A1) [14], circularity (A2) [15],irregularity (A3), eccentricity (A4), rectangularity (A5), and entropy of radial length distribution(A6) [3].
Zheng et al. Page 6
Med Image Comput Comput Assist Interv. Author manuscript; available in PMC 2010 March 17.
NIH
-PA Author Manuscript
NIH
-PA Author Manuscript
NIH
-PA Author Manuscript
The features that can account for spatial variations of TE are the variance of uptake (V1), changein variance of uptake (V2), margin gradient (V3), variance of margin gradient (V4), variance ofradial gradient histogram (V5) [2], the maximum variation of enhancement (V6), theenhancement-variance increasing rate (V7), the enhancement-variance decreasing rate (V8),and the enhancement-variance (V9) at the first post-contrast frame [15].
Zheng et al. Page 7
Med Image Comput Comput Assist Interv. Author manuscript; available in PMC 2010 March 17.
NIH
-PA Author Manuscript
NIH
-PA Author Manuscript
NIH
-PA Author Manuscript
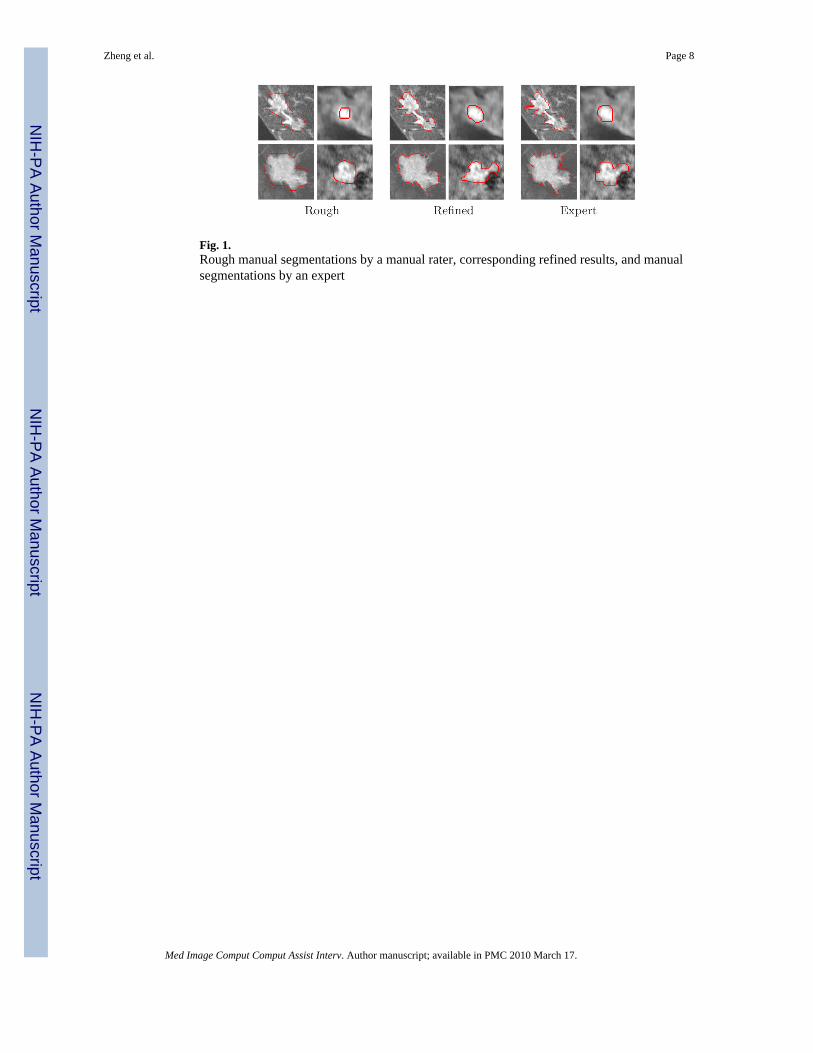
Fig. 1.Rough manual segmentations by a manual rater, corresponding refined results, and manualsegmentations by an expert
Zheng et al. Page 8
Med Image Comput Comput Assist Interv. Author manuscript; available in PMC 2010 March 17.
NIH
-PA Author Manuscript
NIH
-PA Author Manuscript
NIH
-PA Author Manuscript
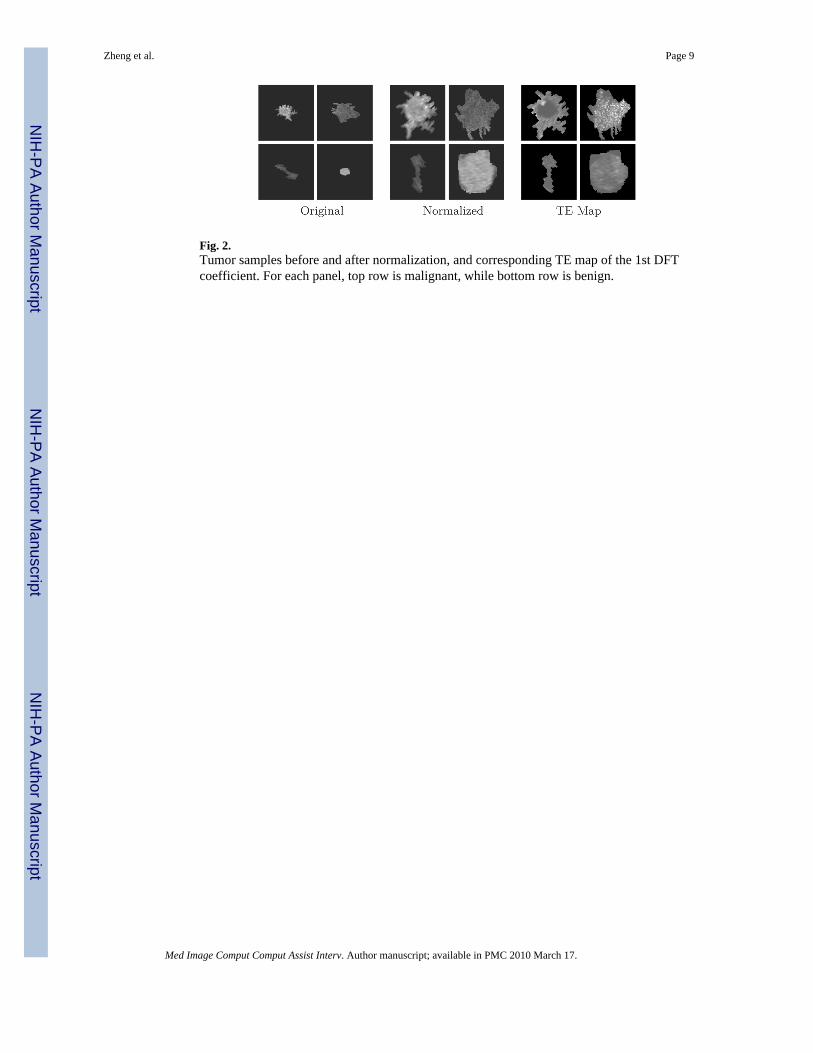
Fig. 2.Tumor samples before and after normalization, and corresponding TE map of the 1st DFTcoefficient. For each panel, top row is malignant, while bottom row is benign.
Zheng et al. Page 9
Med Image Comput Comput Assist Interv. Author manuscript; available in PMC 2010 March 17.
NIH
-PA Author Manuscript
NIH
-PA Author Manuscript
NIH
-PA Author Manuscript

Fig. 3.ROC curves of tumor classification on rough segmentation, refinement segmentation, andexpert segmentation, along with their AUC values. Notice that ROC curves of ‘refinement’and ‘expert’ are overlapped together, as identical curves.
Zheng et al. Page 10
Med Image Comput Comput Assist Interv. Author manuscript; available in PMC 2010 March 17.
NIH
-PA Author Manuscript
NIH
-PA Author Manuscript
NIH
-PA Author Manuscript

Fig. 4.ROC curves of tumor classification using different sets of features. The corresponding AUCvalues are also provided. Notice that ROC curves of A and A ∪ D are overlapped together, asidentical curves.
Zheng et al. Page 11
Med Image Comput Comput Assist Interv. Author manuscript; available in PMC 2010 March 17.
NIH
-PA Author Manuscript
NIH
-PA Author Manuscript
NIH
-PA Author Manuscript
NIH
-PA Author Manuscript
NIH
-PA Author Manuscript
NIH
-PA Author Manuscript
Zheng et al. Page 12
Table 1
Best classification accuracy, along with corresponding sensitivity and specificity, for different sets of featuresused in tumor classification
Feature Accuracy(%) Sensitivity Specificity Selected Features
A 87.1 0.91 0.78 A3,A5,A6
D 64.5 0.68 0.56 D6
V 90.3 0.91 0.89 V3,V5
A ∪ D 87.1 0.91 0.78 A3,A5,A6
A ∪ D ∪ V 90.3 0.91 0.89 A3,A5,V3,V5
STEP 96.8 0.95 1.00 3(moment)+1(Gabor)
Med Image Comput Comput Assist Interv. Author manuscript; available in PMC 2010 March 17.