MORPHOLOGIC ASSESSMENT OF EXTRACELLULAR MATRIX SCAFFOLDS FOR PATCH
Upload
independentCategory
view
0download
0
Molecular and MorphologicCharacterization of Superficial- andDeep-Subcutaneous Adipose TissueSubdivisions in Human ObesityRaffaella Cancello1, Alessandra Zulian2, Davide Gentilini1, Sabrina Maestrini1, Alberto Della Barba3,Cecilia Invitti2, Davide Cor�a4, Michele Caselle5, Antonio Liuzzi6 and Anna Maria Di Blasio1
Objective: Human abdominal subcutaneous white adipose tissue (SAT) is composed of two different
subcompartments: a ‘‘superficial’’ SAT (SSAT), located between the skin and a fibrous-fascia plane; and a
deeper SAT, located under this fibrous fascia plane, indicated as ‘‘deep’’ SAT (DSAT).
Design and Methods: In order to investigate whether SSAT and DSAT have different molecular and
morphological features, paired SSAT/DSAT biopsies were collected from 10 female obese patients and
used for microarray and morphologic analysis. The stroma-vascular fraction cells were also isolated from
both depots and cultured in vitro to assess the lipid accumulation rate.
Results: SSAT and DSAT displayed different patterns of gene expression, mainly for metabolic and
inflammatory genes, respectively. Detailed gene expression analysis indicated that several metabolic
genes, including adiponectin, are preferentially expressed in SSAT, whereas inflammatory genes are over-
expressed in DSAT. Despite a similar lipid accumulation rate in vitro, in vivo SSAT showed a significant
adipocyte hypertrophy together with a significantly lower inflammatory infiltration and vascular vessel
lumen mean size, when compared to DSAT.
Conclusions: These data show that, SSAT and DSAT are functionally and morphologically different and
emphasize the importance of considering independent these two adipose depots when investigating SAT
biology and obesity complications.
Obesity (2013) 00, 0000-0000. doi:10.1002/oby.20417
IntroductionThe increasing evidence of the complexity of fat metabolic patterns
emphasizes the importance of studying adipose tissue at anatomic,
cellular and molecular levels. Compared to tissues with a confined
localization in the body, the adipose tissue, or ‘‘adipose organ’’ as
firstly defined by Cinti (1,2), is composed by a multiple series of
well-defined depots, mainly located at two corporal levels in mam-
mals: superficial (or subcutaneous, composed by white adipocytes
and, in the interscapular region, by brown adipocytes) and visceral
compartments (mainly composed by white adipocytes) (3-5).
In humans, the subcutaneous adipose tissue (SAT) of the abdominal
region is in continuity with the dermal tissue and it is usually consid-
ered as a unique, homogeneous fat depot. However, in this region
SAT is composed by two anatomically different layers, located,
respectively, above and below a connective plane named fascia super-ficialis, or Scarpa’s fascia and usually indicated as superficial
‘‘thigh’’ SAT (SSAT) and subfascial, or deep, ‘‘thigh’’ adipose tissue
(DSAT) (5,6). The fascia is clearly visible by magnetic resonance
imaging and ultrasonography (7-9). The layering of SAT was recon-
sidered after the advent of liposuction surgical techniques (3) and
SAT subcompartments were analyzed in detail by CT scanning tech-
niques, both in lean and obese subjects (4-7). The SSAT is often very
thin in humans but the relative amount is depending on body mass
index, fat mass, gender, and ethnicity (9). The DSAT is predominant
posteriorly at the L4-L5 interspace and the anterior and posterior
DSAT compartments are contiguous. The DSAT extends superiorly at
least to the inferior aspect of the ribs and inferiorly in a contiguous
fashion to the lower crease of the buttocks. In some individuals, the
1 Laboratory of Molecular Biology, Istituto Auxologico Italiano, IRCCS, Milan, Italy. Correspondence: Raffaella Cancello ([email protected])2 Department of Medical Sciences and Rehabilitation, Istituto Auxologico Italiano, IRCCS, Milan, Italy 3 Department of Surgery, Casa di Cura Igea, Milan, Italy4 Systems Biology Laboratory, Institute for Cancer Research and Treatment (IRCC), School of Medicine, University of Torino, Candiolo, Italy 5 NationalInstitute of Nuclear Physics (INFN), Department of Theoretical Physics, University of Torino, Torino, Italy 6 Division of General Medicine, Istituto AuxologicoItaliano, IRCCS, Ospedale S. Giuseppe, Verbania, Italy
Disclosure: The authors have no competing interests.
Additional Supporting Information may be found in the online version of this article.
Received: 18 June 2012 Accepted: 29 January 2013 Published online 20 March 2013. doi:10.1002/oby.20417
www.obesityjournal.org Obesity | VOLUME 000 | NUMBER 000 | MONTH 2013 1
Original ArticleOBESITY BIOLOGY AND INTEGRATED PHYSIOLOGY
Obesity

DSAT extends inferiorly into the upper leg region. At the level of the
L4-L5 interspace, the posterior-lateral portion of the fascia is often
penetrated by what appears to be a neurovascular bundle from the
dorsal spine (7-9). Furthermore, the amount of DSAT is highly corre-
lated to fasting insulin, especially in men (5,10). An hypothesis for a
‘‘thermo-insulator role’’ of SSAT and a ‘‘metabolic-mode role’’ for
DSAT has already been proposed, based on the studies on swine adi-
pose tissue (11,12) suggesting differences in lipogenic and lipolitic
activities (13). At gross anatomy level, SSAT appears macroscopi-
cally lamellar, i.e., with adipocytes organized in vertically oriented
and closely spaced septa dividing the adipose tissue in regular tightly
packed lobules, whereas DSAT is less defined and characterized by a
loose areolar morphology, i.e., by adipocytes distributed in an irregu-
lar manner (9). A different embryologic origin of cells composing the
two subcutaneous adipose layers was suggested in swine, based on
proliferation, enzymatic, fatty acid composition, and morphologic dif-
ferences (5,9,13). However, these data are not available for SSAT and
DSAT adipocytes in humans.
In normal weight healthy subjects, we have previously shown an inde-
pendent and unexpected metabolic role for DSAT (14,15) and a
recently published study provided evidence that, in morbidly obese
patients, the degree of DSAT inflammation is related to the severity
of liver disease (NASH and fibro inflammatory hepatic lesions) (16).
In this study, we employed microarray and morphological techni-
ques to better investigate SSAT and DSAT in a cohort of severely
obese patients, aiming to further identify their specific molecular
and morphological differences.
Materials and MethodsSubjects and adipose tissue biopsiesThe present study is in accordance with the Declaration of Helsinki
and it was approved by the Ethical Committee of Istituto Auxolo-
gico Italiano. A signed informed consent was obtained from each
enrolled patient. Surgical biopsies of whole abdominal SAT were
collected per-operatively from 10 obese female patients (BMI: 37.5
6 9.9 kg/m2; age: 48.2 6 10.6 years; mean 6 standard deviation),
during dermolipectomy procedures, a postbariatric surgical removal
of adipose tissue and excessive skin (17,18). Each collected biopsy
was weighed and stored in 1 ml of DMEM (Invitrogen Corporation,
Jefferson City, MO) supplemented with 2.5% Bovine Serum Albu-
min (BSA, Sigma, St. Louis, MO) per 1 g of tissue. The collected
biopsy was immediately transferred to the laboratory and processed.
Tissue, cell isolation and culture conditionsThe two layers composing SAT as well as the fibrous fascia were
clearly visible (Supporting Information Figure 1). The skin was
always present in the sample in order to properly orientate the biopsy
and DSAT/SSAT paired samples were isolated and processed inde-
pendently from each collected sample, for a total of 20 biopsies. A
fragment of the whole adipose tissue biopsy was immediately frozen
in liquid nitrogen for RNA extraction (see below), another fragment
was formalin-fixed and the remaining material was digested with 1
mg/ml collagenase type 2 (Sigma, St. Louis, MO) for at least 1 h at
37�C under shaking. The digested tissue was then filtered through a
sterile gauze and a nylon filter (BD Bioscience 1 Becton Drive Frank-
lin Lakes, NJ). The stroma-vascular fraction (SVF) cells were isolated
by centrifugation and then treated with a buffer containing 154 mM
NH4Cl, 10 mM KHCO3, and 0.1 mM EDTA for lysis of red blood
cells. SVF cells were plated and cultured in a medium containing a
1:1 mixture of Ham’s F12/DMEM (Invitrogen Corporation, Jefferson
City, MO) supplemented with 10% foetal bovine serum (Sigma, St.
Louis, MO) until confluence. At confluence, cells were differentiated
into mature adipocytes using NH-AdipoDiff medium (Miltenyi Biotec
Bergisch Gladbach, Germany) for 10 days. Intracellular triglyceride
storage levels were assessed by AdipoRed staining, according to the
manufacturer protocol (Lonza, Milan, Italy).
Isolation of RNA from SSAT/DSATApproximately 500 mg of frozen adipose tissue was homogenized in
RLT buffer (Qiagen) and transferred into a 2-ml centrifuge tubes.
RNA from the SSAT and DSAT was extracted using the RNeasy
FIGURE 1 Panel A: Heat map of significant genes in SSAT and DSAT (n ¼ 6). Eachrow represents the expression profile of an mRNA across significant differentiallyexpressed genes and each column represents a sample. Red and green colors,respectively, represent either higher or lower expression levels of the mRNA (me-dian-centered). Panel B: Microarray average signal ratio for some ‘‘inflammatory’’and ‘‘metabolic’’ genes in SSAT vs. DSAT (n ¼ 6). [Color figure can be viewed inthe online issue, which is available at wileyonlinelibrary.com.]
Obesity Superficial and Deep Adipose Tissue Cancello et al.
2 Obesity | VOLUME 000 | NUMBER 000 | MONTH 2013 www.obesityjournal.org

Mini Kit (Qiagen) according to the manufacturer protocol and sam-
ples were then treated with the RNase-Free DNase Set (Qiagen).
Concentration and quality of the extracted RNA were determined by
the NanoDropH ND-1000 spectrophotometer (NanoDrop Technolo-
gies, USA) and RNA integrity verified by gel-electrophoresis.
Gene expression analysisA total of 12 samples, corresponding to paired SSAT/DSAT biopsies
from six patients, were independently analyzed by microarray. Gene
expression profile was evaluated using HumanHT-12 v3 BeadChips
whole-genome hybridization assay (Illumina, San Diego, CA), which
is based upon fluorescence detection of biotin-labeled cRNA. Each
array contains full-length 50-mer probes representing more than
48,000 well-annotated RefSeq transcripts, including >25,400 unique,
curated, and up-to-date genes derived from the National Center for
Biotechnology Information Reference Sequence database. Initially,
300 ng of total RNA was converted to cDNA, followed by an in vitrotranscription step to generate Biotin-16-UTP-labeled cRNA using the
Ambion Illumina Total Prep RNA Amplification Kit (Ambion,
TABLE 1 SSAT annotation clusters
Annotation cluster 1 Enrichment score: 1.88Category Term Count P-ValueGOTERM_BP_FAT GO:0006006�glucose metabolic process 6 0.002
GOTERM_BP_FAT GO:0019318�hexose metabolic process 6 0.006
GOTERM_BP_FAT GO:0005996�monosaccharide metabolic process 6 0.012
GOTERM_BP_FAT GO:0006091�generation of precursor metabolites and energy 5 0.013
Annotation cluster 2 Enrichment score: 1.68Category Term Count P-ValueGOTERM_BP_FAT GO:0030258�lipid modification 6 6.70E-05
GOTERM_BP_FAT GO:0006635�fatty acid beta-oxidation 3 0.012
KEGG_PATHWAY hsa03320:PPAR signaling pathway 4 0.016
GOTERM_BP_FAT GO:0009062�fatty acid catabolic process 3 0.020
GOTERM_BP_FAT GO:0019395�fatty acid oxidation 3 0.024
GOTERM_BP_FAT GO:0034440�lipid oxidation 3 0.024
GOTERM_BP_FAT GO:0046395�carboxylic acid catabolic process 4 0.03
GOTERM_BP_FAT GO:0016054�organic acid catabolic process 4 0.031
GOTERM_BP_FAT GO:0006631�fatty acid metabolic process 5 0.034
SP_PIR_KEYWORDS fatty acid metabolism 3 0.049
Annotation cluster 3 Enrichment score: 1.66Category Term Count P-ValueSP_PIR_KEYWORDS cell cycle control 3 0.013
INTERPRO IPR013763:Cyclin-related 3 0.021
INTERPRO IPR006670:Cyclin 3 0.023
SMART SM00385:CYCLIN 3 0.031
Annotation cluster 4 Enrichment score: 1.50Category Term Count P-ValueGOTERM_BP_FAT GO:0009719�response to endogenous stimulus 10 8.95E�11GOTERM_BP_FAT GO:0009725�response to hormone stimulus 9 0.0019
GOTERM_BP_FAT GO:0010033�response to organic substance 12 0.0048
GOTERM_BP_FAT GO:0032870�cellular response to hormone stimulus 5 0.0093
GOTERM_BP_FAT GO:0043434�response to peptide hormone stimulus 5 0.015
GOTERM_MF_FAT GO:0019900�kinase binding 5 0.02
GOTERM_BP_FAT GO:0043627�response to estrogen stimulus 4 0.02
GOTERM_BP_FAT GO:0048545�response to steroid hormone stimulus 5 0.03
Annotation cluster 5 Enrichment score: 1.4Category Term Count P-ValueGOTERM_BP_FAT GO:0006928�cell motion 8 0.028
GOTERM_BP_FAT GO:0016477�cell migration 6 0.028
GOTERM_BP_FAT GO:0051674�localization of cell 6 0.042
Original Article ObesityOBESITY BIOLOGY AND INTEGRATED PHYSIOLOGY
www.obesityjournal.org Obesity | VOLUME 000 | NUMBER 000 | MONTH 2013 3

Austin, TX) as per manufacturer’s instructions. The labelled probes
were mixed with hybridization reagents and hybridized overnight to
the HumanHT-12 v3 BeadChips (Illumina, San Diego, CA). Follow-
ing washing and staining, the BeadChips were imaged using the Illu-
mina BeadArray Reader (Illumina, San Diego, CA) to measure fluo-
rescence intensity for each probe. One BeadChip with 12 arrays was
used. Slide was immediately scanned and first quality check, back-
ground correction, and normalization of the data were done by
Beadstudio expression module v 3.2.7 (Illumina). Differential gene
expression was assessed using Genome Studio software (Illumina). P-values were corrected for multiple testing using Benjamini and Hoch-
berg False Discovery Rates. A differential expression score �13 was
considered statistically significant (P < 0.05).
Heat map of gene expression profiles was obtained by GEDAS (Gene
Expression Data Analysis Suite; http://sourceforge.net/projects/gedas)
software, an extension of Cluster 3.0 (Eisen Lab’s Cluster and Tree
View software). The microarray data are MIAME compliant (19).
TABLE 2 DSAT annotation clusters
Annotation cluster 1 Enrichment score: 5.67 P-ValueCategory Term
GOTERM_BP_FAT GO:0009611�response to wounding 1.68E�08GOTERM_BP_FAT GO:0006954�inflammatory response 8.93E�08GOTERM_BP_FAT GO:0006952�defense response 6.09E�11
Annotation cluster 2 Enrichment score: 2.94Category Term P-ValueGOTERM_CC_FAT GO:0005730�nucleolus 2.05E�11GOTERM_CC_FAT GO:0043233�organelle lumen 8.15E�10GOTERM_CC_FAT GO:0031974�membrane-enclosed lumen 8.27E�10GOTERM_CC_FAT GO:0070013�intracellular organelle lumen 2.69E�10GOTERM_CC_FAT GO:0031981�nuclear lumen 9.68E�09GOTERM_CC_FAT GO:0043228�non-membrane-bounded organelle 0.014
GOTERM_CC_FAT GO:0043232�intracellular non-membrane-bounded organelle 0.014
Annotation cluster 3 Enrichment score: 2.37Category Term P-ValueKEGG_PATHWAY hsa04610:Complement and coagulation cascades 9.89E�08SP_PIR_KEYWORDS Innate immunity 2.27E�09GOTERM_BP_FAT GO:0006956�complement activation 8.00E�10GOTERM_BP_FAT GO:0002541�activation of plasma proteins involved in acute inflammatory Response 9.77E�09GOTERM_BP_FAT GO:0002526�acute inflammatory response 1.31E�10SP_PIR_KEYWORDS Complement pathway 2.29E�12SP_PIR_KEYWORDS Immune response 3.12E�12GOTERM_BP_FAT GO:0006958�complement activation, classical pathway 3.36E�12GOTERM_BP_FAT GO:0050778�positive regulation of immune response 4.14E�11GOTERM_BP_FAT GO:0002455�humoral immune response mediated by circulating immunoglobulin 5.12E�10GOTERM_BP_FAT GO:0002253�activation of immune response 0.001
Annotation cluster 4 Enrichment score: 2.30 P-ValueCategory TermSP_PIR_KEYWORDS Lysosome 4.51E�12GOTERM_CC_FAT GO:0005764�lysosome 0.007
GOTERM_CC_FAT GO:0000323�lytic vacuole 0.007
GOTERM_CC_FAT GO:0005773�vacuole 0.022
Annotation cluster 5 Enrichment score: 2.18 P-ValueCategory TermGOTERM_BP_FAT GO:0009991�response to extracellular stimulus 0.0021
GOTERM_BP_FAT GO:0031667�response to nutrient levels 0.0070
Obesity Superficial and Deep Adipose Tissue Cancello et al.
4 Obesity | VOLUME 000 | NUMBER 000 | MONTH 2013 www.obesityjournal.org

Functional annotationsSignificant gene-lists, based on Illumina-IDs, were uploaded to
DAVID (Database for Annotation, Visualization, and Integrated Dis-
covery) (20,21), analyzed with Ingenuity Pathway Analysis (IPA; In-
genuity SystemsVR , Mountain View, CA, http://www.ingenuity.com,
www.ingenuity.com), and ToppGene suite open access-software
(22). The networks, reported in Supporting Information figures,
were generated through the use of Ingenuity Pathways Analysis
(Ingenuity SystemsVR , www.ingenuity.com).
The Functional Analysis of a network identified the biological func-
tions that were most significant to the genes in the network. Fisch-
er’s exact test was used to calculate a P-value determining the prob-
ability that each biological function assigned to that network is
because of the chance alone.
Validations of microarray data by real timequantitative PCR (RTqPCR)The cDNAs were obtained by reverse-transcription with SuperScript
III (Invitrogen, Carlsbad, CA) from 1 lg of total RNA for all col-
lected samples (20 samples of paired SSAT/DSAT correspondingt to
10 enrolled patients). At room temperature, 1 lg of the total RNA
was treated with DNaseI for 15 min. The reaction was incubated at
25�C for 5 min, 42�C for 30 min, and 85�C for 5 min, then stored at
�20�C until use. We selected some differentially expressed genes
underwent expression-level verification using RTqPCR. This was
done using the 7300 Real Time PCR System with TaqMan probes
(Applied Biosystems, Foster City, CA). Data were analyzed using the
SDS v.1.4 software (Software Diversified Systems, Spring Lake Park,
MN). Cycle threshold (Ct) was defined as the cycle number at which
a significant increase in the fluorescence signal was firstly detected.
The mRNA levels were normalized to ribosomal protein large P0
(RPLP0) a very well suited, normalizing gene for mRNA quantifica-
tion, producing a delta Ct value. The relative quantization was then
obtained by the 2�DDCt method and indicated by arbitrary units (AU).
Characterization of adipose tissue morphologyFor morphological studies, adipose tissue samples (20 samples of
paired SSAT/DSAT biopsies of the 10 enrolled patients) were fixed
in 4% buffered formalin overnight at 4�C, washed and paraffin em-
bedded. The size and density of adipocytes as well as blood vessels
in the adipose tissues were determined by haematoxylin/eosin
stained sections using Image-Pro Plus 4.0 software. For each sample,
five randomly selected sectional areas, measuring at least 200 cell
diameters, were analyzed and blood vessels counted and measured
using an image analysis system (Leica QWin image analysis and
processing). The estimation of macrophage number was performed
as previously described (23). In brief, 5-lm sections were mounted
on glass slides, deparaffinized in xylol and stained for CD68 using
anti-CD68 monoclonal mouse antihuman antibody (Dako, dilution
1:100), using standard immuno-histochemistry methods. Macro-
phages were identified in the adipose parenchyma (CD68 within
blood vessels were excluded), when cytoplasmic staining for CD68
was present along with an identifiable mononuclear nucleus, and
presented as the number per 100 adipocytes (% macrophages).
Fibrosis was estimated by Masson’s trichrome staining kit (Bioptica,
Italy) and a score was assigned for 10 randomly observed fields (0,
1, 2 for a fibrosis area covering, respectively, the 5%, 15%, or >
25% of the observed field) and expressed as mean 6 SD. Images
were acquired using an optical microscope coupled with a digital
camera (Leica DMR280) and were analyzed using the software
Leica QWin image analysis and processing.
Statistical analysesData are shown as means 6 standard errors of the mean unless
stated otherwise. Statistical analysis was performed using SPSS ver-
sion 12.0 (Chicago, IL) and Graph Pad (SAS). For genes analyzed
by RTqPCR, significant differences were determined by Wilcoxon
nonparametric paired test. The correlations between mRNA levels
and microarray average signals of the different transcripts were
examined by the nonparametric Spearman’s rank correlation test. P-values < 0.05 were considered to be statistically significant.
ResultsSuperficial SAT showed a lamellar and dense structure, with adipo-
cytes organized in parallel layers of a compact appearance. In con-
trast DSAT, in agreement with previous observations (9), showed a
more loose and areolar appearance (Supporting Information Figure
1). The fibrous fascia superficialis was visible in all collected sam-
ples and was discarded during separation of SSAT and DSAT, as
well as the skin layer.
Global gene expression in SSAT and DSATIn order to identify differentially expressed genes between SSAT
and DSAT, we performed a microarray analysis in paired SSAT/
DSAT samples of six morbidly obese patients. A total of 37,800
genes, corresponding to 48,796 probes, were correctly detected after
the scanning procedure and 14,415 genes had a significant average
signal detection (P-value < 0.05). A total of 7422 genes had an av-
erage detection signal with a P-value < 0.001. Using Genome studio
we performed differential expression analysis and obtained a list of
137 genes (corresponding to 347 probes) overexpressed in SSAT
and 120 genes (corresponding to 250 probes) overexpressed in
DSAT. The significant differentially expressed genes without an
associated gene symbol were 17.5% in SSAT and 34.1% in DSAT.
Significant genes were also analyzed by a Heat Map, a two-dimen-
sional representation of gene expression data, in which each row
represents the expression profile of mRNA across significant differ-
entially expressed genes and each column represents a sample. A
separated pattern of expression is clearly visible (Figure 1A).
Analyzing the SSAT/DSAT average signal (AVG) ratio fold-
change, an over-expression of lipid-adipocyte specific genes in
SSAT was observed, with an exception for serum amyloid protein
genes SAA1, SAA2, and SAA4, acute phase inflammatory genes.
adiponectin (ADIPOQ), adiponectin receptor 2 (ADIPOR2) and cav-
eolin 2 (CAV2) were significantly overexpressed by SSAT, whereas
leptin receptor gene (LEPR), apolipoprotein C1 (APOC1) adrenergic
alpha 1B receptor (ADRAB1), adenosin A2a receptor (ADORA2A),
inducible prostaglandin-endoperoxide synthase type 2 (PTGS2 or
COX2), interleukin 1 receptor antagonist (IL1RN) genes were over-
expressed by DSAT (Figure 1B).
Original Article ObesityOBESITY BIOLOGY AND INTEGRATED PHYSIOLOGY
www.obesityjournal.org Obesity | VOLUME 000 | NUMBER 000 | MONTH 2013 5
Functional annotations of significant genesFunctional annotations of SSAT/DSAT overexpressed genes were
based on Illumina ID using three different annotating tools (i.e., thatare based on different algorithms and integrating systems): 1) the
open source DAVID (the Database for Annotation, Visualization
and Integrated Discovery), which provides a comprehensive set of
functional annotations behind large list of genes, is widely used to
understand if there are differentially regulated genes that fall into
discrete functional groups (20,21;2) the IPA-Ingenuity systems (a
tool that helps researchers to model, analyze and understand over-
represented pathways of ‘‘omics’’ data helping to identify significant
biological pathways by comparing the overlap of differentially
expressed genes and all genes in the human genome with the gene
sets associated with well-known pathways); and 3) the ToppGene
Suite (ToppGene and TopFun integrate a vast number of genomic
data from humans and can be used for the analysis of gene func-
tional enrichment and for the prioritization of disease gene candi-
dates, respectively, deriving the probability that each annotation is
related to the gene in question) (22). Based on these methods, the
annotation ‘‘Lipid Metabolism’’ was the only one common to both
SSAT and DSAT, despite a higher level of significance for SSAT.
The genes preferentially expressed by SSAT were annotated as
‘‘Cytoplasm, Mitochondria, intracellular organelle’’ and as ‘‘Lipidmetabolism, Small molecules Biochemistry, Molecular Transport" by
DAVID annotation tool (Table 1) and as ‘‘Protein Trafficking, Car-bohydrate Metabolism’’ by IPA-Ingenuity annotation system
(Supporting Information Table 1). The SSAT genes prioritized by
ToppGene suite were mainly ‘‘adipocyte-specific’’ genes, as
reported in the Supporting Information table (Supporting Informa-
tion Table 2, upper panel). The first gene identified by this system
is the ADIPOQ (also well known as adiponectin) and it represents
the gene that best describe the SSAT depot.
DSAT overexpressed genes were mainly annotated as ‘‘Response toexternal stimulus, Inflammatory response, Defence response’’ and as
‘‘Cellular Movement, cell to cell signalling interactions’’ by DAVID
annotating system (Table 2) and as ‘‘Cell death’’ by IPA Ingenuity
annotation system (Supporting Information Table 3). The ToppGene
suite for gene prioritization identified the first gene that better repre-
sents the DSAT as APOC-1 gene, also known as apolipoprotein C1
(Supporting Information Table 2, lower panel). The first eight genes
prioritized for SSAT and DSAT by ToppGene suite are reported as
annexe (Supporting Information Table 2).
The SSAT gene network, identified by IPA-Ingenuity systems based
on regulatory relationships between the genes significant in this
dataset, was mainly characterized by ‘‘metabolic genes’’ with insulin
receptor as a central hub (Supporting Information Figure 2A). By
the same method, the most significant gene network identified for
DSAT included a large majority of ‘‘inflammatory genes’’, with a
central hub for fibrinogen (Supporting Information Figure 2B).
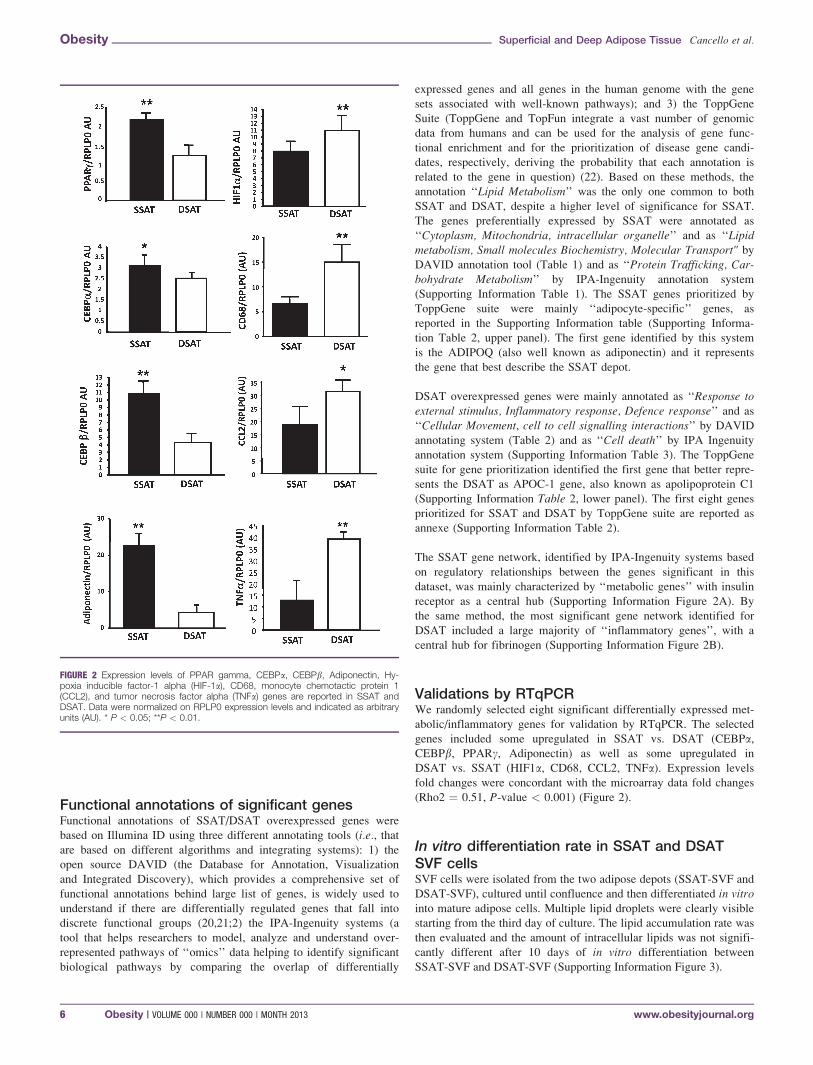
Validations by RTqPCRWe randomly selected eight significant differentially expressed met-
abolic/inflammatory genes for validation by RTqPCR. The selected
genes included some upregulated in SSAT vs. DSAT (CEBPa,CEBPb, PPARc, Adiponectin) as well as some upregulated in
DSAT vs. SSAT (HIF1a, CD68, CCL2, TNFa). Expression levels
fold changes were concordant with the microarray data fold changes
(Rho2 ¼ 0.51, P-value < 0.001) (Figure 2).
In vitro differentiation rate in SSAT and DSATSVF cellsSVF cells were isolated from the two adipose depots (SSAT-SVF and
DSAT-SVF), cultured until confluence and then differentiated in vitrointo mature adipose cells. Multiple lipid droplets were clearly visible
starting from the third day of culture. The lipid accumulation rate was
then evaluated and the amount of intracellular lipids was not signifi-
cantly different after 10 days of in vitro differentiation between
SSAT-SVF and DSAT-SVF (Supporting Information Figure 3).
FIGURE 2 Expression levels of PPAR gamma, CEBPa, CEBPb, Adiponectin, Hy-poxia inducible factor-1 alpha (HIF-1a), CD68, monocyte chemotactic protein 1(CCL2), and tumor necrosis factor alpha (TNFa) genes are reported in SSAT andDSAT. Data were normalized on RPLP0 expression levels and indicated as arbitraryunits (AU). * P < 0.05; **P < 0.01.
Obesity Superficial and Deep Adipose Tissue Cancello et al.
6 Obesity | VOLUME 000 | NUMBER 000 | MONTH 2013 www.obesityjournal.org

Morphologic differences in SSAT and DSATThe morphology of each collected SSAT/DSAT paired samples was
studied and the adipocyte hypertrophy, inflammation (by CD68þ
cells estimation), fibrosis and vascularization were estimated. A sig-
nificant adipocyte hypertrophy was observed in SSAT compared to
DSAT (P < 0.01) whereas DSAT contained more CD68 immune-
positive cells than SSAT in the parenchyma (P < 0.001) (Figure 3).
Moreover, the two depots had comparable levels of overall fibrosis
(Figure 3). The number of vascular vessels was significantly higher
in SSAT than DSAT, despite a significantly smaller mean lumen
size (Figure 3).
DiscussionIn this study we show that, in obese patients, human abdominal
SSAT and DSAT subcompartments are different both at molecularand morphologic levels. The molecular profile observed was mainly‘‘metabolic’’ for SSAT: this depot was characterized by adipocytehypertrophy and a lower level of inflammatory cells infiltration.DSAT displayed an ‘‘inflammatory’’ molecular profile probably
because of the significantly higher inflammatory cells infiltration.Moreover, in SSAT and DSAT a similar degree of fibrosis but a dif-ferent vessel density and mean size was observed. Our study is inagreement with the recently published data, suggesting a specific
FIGURE 3 Adipocyte mean size (lm), inflammatory infiltration (percentage of CD68 immunopositive cells), fibrosisscore, mean lumen vessel size area (lm2), and vascular vessel density in SSAT (black bars) and DSAT (grey bars)are shown. A representative picture of SSAT and DSAT (40� magnification) is shown and large vessels in DSAT indi-cated by arrows.
Original Article ObesityOBESITY BIOLOGY AND INTEGRATED PHYSIOLOGY
www.obesityjournal.org Obesity | VOLUME 000 | NUMBER 000 | MONTH 2013 7

role for DSAT in obesity hepatic complications (16). In addition,thanks to microarray analysis, we have been able to identify poten-tial markers of these two depots that could be taken into account
when studying human adipose tissue and obesity complications.
Indeed, despite a global metabolic role for SSAT, the SAA protein
genes were preferentially expressed in this compartment suggesting
a possible link between SSAT and renal disease. Taken together
with previous reports (16), the data presented herein further support
the hypothesis that SSAT and DSAT have different roles in the
appearance of obesity complications and should be deeply investi-
gated in the future. We must underline that, as clinical data of the
enrolled patients were unavailable, these results presented herein are
based exclusively on computational analysis and thus they must be
validated by clinical observations in larger cohorts of morbidly
obese patients.
The results presented herein are also in agreement with the recently
published data on superficial and DSAT in swine (24), also showing
that lipid metabolism features, typical of SSAT, and inflammatory-
immunologic profile of DSAT, are regulated by methylation. The
existence of an epigenetic regulation of SSAT/DSAT-gene expres-
sion has yet to be confirmed in humans.
The different characteristics of the two adipose layers here
described may be relevant for the analysis of some previously
published data related to fat removal in the abdomen with differ-
ent surgical techniques, liposuction and dermolipectomy. Liposuc-
tion and dermolipectomy are the most frequently used surgical
techniques to address obesity. While liposuction of the abdomen
have contrasting effects on insulin sensitivity and in decreasing
vascular risk factors (25,26), dermolipectomy procedures seem to
improve glucose handling and to decrease levels of some inflam-
matory circulating markers (i.e., TNFa and IL6) (27). Indeed, it is
tempting to speculate that during liposuction a less amount of
DSAT could be removed accounting for a modest metabolic
effect. Conversely, by dermolipectomy a larger amount of DSAT
removal might be linked to the observed metabolic improvements
(27). Further studies in larger populations are certainly needed to
confirm these findings.
In addition, morphologic differences observed for DSAT and
SSAT may also have implications for site-specific differences in
adipose cell biology. A lower in vitro lipolytic activity has
already been demonstrated for DSAT, indicating that these two
adipose depots are metabolically different (28). In agreement with
our previously reported data for SSAT/DSAT adipose precursors
in lean subjects (14,15), in this study we did not observe differ-
ences in in vitro triglycerides accumulation rate in precursor cells
isolated from the two depots of obese patients. These findings
may suggest that the increase of SSAT and DSAT is not deter-
mined by a different functional activity of precursor cells per sebut it is likely affected by environmental ‘‘extra-adipocyte’’ fac-
tors such as vascularization, innervations, and extra cellular ma-
trix remodeling.
We here propose that, when studying human subcutaneous abdomi-
nal adipose tissue, both for gene expression and protein content/
secretion or morphology, is important to clearly indicate the collec-
tion of either SSAT or DSAT (or eventually both depots without
distinction). Indeed, as clearly demonstrated by the present study,
sampling of abdominal adipose tissue from above or below the fas-
cia could lead to a great variability in the results and might explain
some conflicting data in the literature.
In summary, we have further characterized the molecular and mor-
phological differences of abdominal SSAT and DSAT in morbidly
obese patients. The physiological relevance and the applicability of
all presented findings are crucial to expand the knowledge of obesity
complications and to improve translational research.O
AcknowledgmentsThe authors would like to thank Laura Ermellino and Anna Rita
Grindati for technical assistance with adipose tissue samples proc-
essing as well as Dr. M. Besozzi for the free access to anatomical
pathology laboratory facilities at the Istituto Auxologico Italiano,
Cusano Milanino, Italy.
VC 2013 The Obesity Society
References1. Cinti S. The adipose organ. Prostaglandins Leukot Essent Fatty Acids 2005;73:9-15.
2. Cinti S. Anatomy of the adipose organ. Eat Weight Disord 2000;5:132-142.
3. Alexander HG, Dugdale AE. Fascial planes within subcutaneous fat in humans. EurJ Clin Nutr 1992;46:903-906.
4. Gasperoni C, Salgarello M. Rationale of subdermal superficial liposuction related tothe anatomy of subcutaneous fat and the superficial fascial system. Aesthetic PlastSurg 1995)19:13-20
5. Kelley DE, Thaete FL, Troost F, Huwe T, Goodpaster BH. Subdivisions of subcuta-neous abdominal adipose tissue and insulin resistance. Am J Physiol EndocrinolMetab 2000;278:E941-E948.
6. Deschenes D, Couture P, Dupont P, Tchernof A. Subdivision of the subcutaneousadipose tissue compartment and lipid-lipoprotein levels in women. Obes Res 2003;11:469-476.
7. Kvist H, Sjostrom L, Tylen U. Adipose tissue volume determinations in women bycomputed tomography: technical considerations. Int J Obes 1986;10:53-67.
8. Kohli S, Sniderman AD, Tchernof A, Lear SA. Ethnic-specific differences in ab-dominal subcutaneous adipose tissue compartments. Obesity 2010;18:2177-2183.
9. Smith SR, Lovejoy JC, Greenway F, et al. Contributions of total body fat, abdomi-nal subcutaneous adipose tissue compartments, and visceral adipose tissue to themetabolic complications of obesity. Metabolism 2001;50:425-435.
10. Goodpaster BH, Thaete FL, Simoneau JA, Kelley DE. Subcutaneous abdominal fatand thigh muscle composition predict insulin sensitivity independently of visceralfat. Diabetes 1997;46:1579-1585.
11. Mersmann HJ, Koong LJ. Effect of plane of nutrition on adipose tissue lipidmetabolism in genetically obese and lean pigs. J Nutr 1984;114:862-868.
12. Mersmann HJ, Leymaster KA Differential deposition and utilization of backfatlayers in swine. Growth 1984;48:321-330.
13. Hood RL, Allen CE Lipogenic enzyme activity in adipose tissue during the growthof swine with different propensities to fatten. J Nutr 1973;103:353-362.
14. Walker GE, Verti B, Marzullo P, et al. Deep subcutaneous adipose tissue: a distinctabdominal adipose depot. Obesity 2007;15:1933-1943.
15. Walker GE, Marzullo P, Verti B, et al. Subcutaneous abdominal adipose tissue sub-compartments: potential role in rosiglitazone effects. Obesity 2008;16:1983-1991.
16. Tordjman J, Divoux A, Prifti E, et al. Structural and inflammatory heterogeneity insubcutaneous adipose tissue: relation with liver histopathology in morbid obesity. JHepatol 2012;56:1152-1158.
17. De Jong RH, Grazer FM. Perioperative management of cosmetic liposuction. PlastReconstr Surg 2001;107:1039-1044.
18. Oba H. Large volume tumescent anesthesia for extensive liposuction in orientalpatients: lidocaine toxicity and its safe dose level. Plast Reconstr Surg 2003;111:945-946.
19. Brazma A. Minimum Information About a Microarray Experiment (MIAME)-suc-cesses, failures, challenges. Scientific World Journal 2009;9:420-423.
20. Huang da W, Sherman BT, Lempicki RA. Systematic and integrative analysis oflarge gene lists using DAVID bioinformatics resources. Nat Protoc 2009;4:44-57.
21. Huang da W, Sherman BT, Zheng X, et al. Extracting biological meaning fromlarge gene lists with DAVID. Curr Protoc Bioinformatics (Chapter 13), 2009:Unit13.11.
22. Chen J, Bardes EE, Aronow BJ, Jegga AG. ToppGene Suite for gene list enrich-ment analysis and candidate gene prioritization. Nucleic Acids Res 2009;37:W305-W311.
Obesity Superficial and Deep Adipose Tissue Cancello et al.
8 Obesity | VOLUME 000 | NUMBER 000 | MONTH 2013 www.obesityjournal.org

23. Cancello R, Henegar C, Viguerie N, et al. Reduction of macrophage infiltration andchemoattractant gene expression changes in white adipose tissue of morbidly obesesubjects after surgery-induced weight loss. Diabetes 2005;54:2277-2286.
24. Mingzhou L, Tao W, Honglong W, et al. Genome-Wide DNA methylation changesbetween the superficial and deep backfat tissues of the pig. Int J Mol Sci 2012;13:7098-7108.
25. Klein S, Fontana L, Young VL, et al. Absence of an effect of liposuction on insulinaction and risk factors for coronary heart disease. N Engl J Med 2004;350:2549-2557.
26. Giugliano G, Nicoletti G, Grella E, Giugliano F, Esposito K, Scuderi N, D’AndreaF. Effect of liposuction on insulin resistance and vascular inflammatory markers inobese women. Br J Plast Surg 2004;57:190-194.
27. Rizzo MR, Paolisso G, Grella R, et al. Is dermolipectomy effective in improving in-sulin action and lowering inflammatory markers in obese women? Clin Endocrinol2005;63:253-258.
28. Enevoldsen LH, Simonsen L, Stallknecht B, Galbo H, Bulow J. In vivo human lipo-lytic activity in preperitoneal and subdivisions of subcutaneous abdominal adiposetissue. Am J Physiol Endocrinol Metab 2001;281:E1110-E1114.
Original Article ObesityOBESITY BIOLOGY AND INTEGRATED PHYSIOLOGY
www.obesityjournal.org Obesity | VOLUME 000 | NUMBER 000 | MONTH 2013 9
Copyright © 2022 FDOKUMEN