![Non-amine dopamine transporter probe [3H]tropoxene distributes to dopamine-rich regions of monkey brain](https://static.fdokumen.com/doc/165x107/63224d2f050768990e0fcb6c/non-amine-dopamine-transporter-probe-3htropoxene-distributes-to-dopamine-rich.jpg)
Imaging Human Mesolimbic Dopamine Transmission With Positron Emission Tomography. Part II:...
24
Imaging Human Mesolimbic Dopamine Transmission With Positron Emission Tomography: I. Accuracy and Precision of D 2 Receptor Parameter Measurements in Ventral Striatum *†‡Osama Mawlawi, *†‡Diana Martinez, *‡Mark Slifstein, ‡Allegra Broft, ‡Rano Chatterjee, *‡Dah-Ren Hwang, *†‡Yiyun Huang, †Norman Simpson, ‡Kim Ngo, †Ronald Van Heertum, and *†‡Marc Laruelle Departments of *Psychiatry and †Radiology, Columbia University College of Physicians and Surgeons, and ‡Division of Functional Brain Mapping, Department of Analytical Pharmacology, New York State Psychiatric Institute, New York, NY, U.S.A. Summary: Dopamine transmission in the ventral striatum (VST), a structure which includes the nucleus accumbens, ven- tral caudate, and ventral putamen, plays a critical role in the pathophysiology of psychotic states and in the reinforcing ef- fects of virtually all drugs of abuse. The aim of this study was to assess the accuracy and precision of measurements of D 2 receptor availability in the VST obtained with positron emis- sion tomography on the high-resolution ECAT EXACT HR+ scanner (Siemens Medical Systems, Knoxville, TN, U.S.A.). A method was developed for identification of the boundaries of the VST on coregistered high-resolution magnetic resonance imaging scans. Specific-to-nonspecific partition coefficient (V 3 ) and binding potential (BP) of [ 11 C]raclopride were mea- sured twice in 10 subjects, using the bolus plus constant infu- sion method. [ 11 C]Raclopride V 3 in the VST (1.86 ± 0.29) was significantly lower than in the dorsal caudate (DCA, 2.33 ± 0.28) and dorsal putamen (DPU, 2.99 ± 0.26), an observation con- sistent with postmortem studies. The reproducibility of V 3 and BP were appropriate and similar in VST (V 3 test–retest vari- ability of 8.2% ± 6.2%, intraclass correlation coefficient 0.83), DCA (7.7% ± 5.1%, 0.77), DPU (6.0% ± 4.1%, 0.71), and striatum as a whole (6.3% ± 4.1%, 0.78). Partial volume effects analysis revealed that activities in the VST were sig- nificantly contaminated by counts spilling over from the adja- cent DCA and DPU: 70% ± 5% of the specific binding mea- sured in the VST originated from D 2 receptors located in the VST, whereas 12% ± 3% and 18% ± 3% were contributed by D 2 receptors in the DCA and DPU, respectively. Thus, accu- racy of D 2 receptor measurement is improved by correction for partial voluming effects. The demonstration of an appropriate accuracy and precision of D 2 receptor measurement with [ 11 C]raclopride in the VST is the first critical step toward the use of this ligand in the study of synaptic dopamine transmis- sion at D 2 receptors in the VST using endogenous competition techniques. Key Words: Dopamine—D 2 receptor—Nucleus accumbens—Partial volume effects—Positron emission to- mography—[ 11 C]Raclopride—Ventral striatum. Dopaminergic mesencephalic projections originating in the midbrain are classically divided into nigrostriatal, mesolimbic, and mesocortical systems (Lindvall and Bjorklund, 1978). The nigrostriatal system projects from the substantia nigra to the dorsal striatum and is involved in sensorimotor coordination and initiation of movement. The mesolimbic system projects from the ventral teg- mental area (VTA) to limbic structures such as nucleus the accumbens, hippocampus, and amygdala. The meso- cortical system projects from the VTA to cortical regions (mainly medial prefrontal and cingulate cortices). The mesolimbic and mesocortical systems are involved in the regulation of attention, motivation, and drive (Mogenson et al., 1980). Dopaminergic transmission in the nucleus accumbens is centrally involved in the rewarding effects of alcohol and other drugs of abuse (Koob, 1992; Di Chiara, 1995). The therapeutic effects of antipsychotic drugs appear to be related to their ability to block dopa- mine D 2 receptors in the nucleus accumbens (Deutch et al., 1991). Therefore, alterations of dopamine D 2 recep- tor transmission is believed to be involved in a range of neuropsychiatric conditions. In rodents, the striatum is divided into anatomically well-delineated structures—the nucleus accumbens (“limbic striatum”) and the caudate-putamen (“sensori- motor” striatum). In primates, cortical and subcortical Received January 3, 2001; final revision received April 6, 2001; accepted April 10, 2001. Supported by the Public Health Service (NIMH RO1-MH54192, NIMH K02 MH01603–0, NIDA RO1-DA10219–01) and the Lieber Center for Schizophrenia Research. Address correspondence and reprint requests to Dr. Osama Mawlawi, New York State Psychiatric Institute, 1051 Riverside Dr., Unit 31, New York, NY 10032, U.S.A. Journal of Cerebral Blood Flow and Metabolism 21:1034–1057 © 2001 The International Society for Cerebral Blood Flow and Metabolism Published by Lippincott Williams & Wilkins, Inc., Philadelphia 1034
Transcript of Imaging Human Mesolimbic Dopamine Transmission With Positron Emission Tomography. Part II:...
Imaging Human Mesolimbic Dopamine Transmission WithPositron Emission Tomography: I. Accuracy and Precision of
D2 Receptor Parameter Measurements in Ventral Striatum
*†‡Osama Mawlawi, *†‡Diana Martinez, *‡Mark Slifstein, ‡Allegra Broft, ‡Rano Chatterjee,*‡Dah-Ren Hwang, *†‡Yiyun Huang, †Norman Simpson, ‡Kim Ngo, †Ronald Van Heertum, and
*†‡Marc Laruelle
Departments of *Psychiatry and †Radiology, Columbia University College of Physicians and Surgeons, and ‡Division ofFunctional Brain Mapping, Department of Analytical Pharmacology, New York State Psychiatric Institute, New York, NY, U.S.A.
Summary: Dopamine transmission in the ventral striatum(VST), a structure which includes the nucleus accumbens, ven-tral caudate, and ventral putamen, plays a critical role in thepathophysiology of psychotic states and in the reinforcing ef-fects of virtually all drugs of abuse. The aim of this study wasto assess the accuracy and precision of measurements of D2
receptor availability in the VST obtained with positron emis-sion tomography on the high-resolution ECAT EXACT HR+scanner (Siemens Medical Systems, Knoxville, TN, U.S.A.). Amethod was developed for identification of the boundaries ofthe VST on coregistered high-resolution magnetic resonanceimaging scans. Specific-to-nonspecific partition coefficient(V3�) and binding potential (BP) of [11C]raclopride were mea-sured twice in 10 subjects, using the bolus plus constant infu-sion method. [11C]Raclopride V3� in the VST (1.86 ± 0.29) wassignificantly lower than in the dorsal caudate (DCA, 2.33 ± 0.28)and dorsal putamen (DPU, 2.99 ± 0.26), an observation con-sistent with postmortem studies. The reproducibility of V3� andBP were appropriate and similar in VST (V3� test–retest vari-
ability of 8.2% ± 6.2%, intraclass correlation coefficient �0.83), DCA (7.7% ± 5.1%, 0.77), DPU (6.0% ± 4.1%, 0.71),and striatum as a whole (6.3% ± 4.1%, 0.78). Partial volumeeffects analysis revealed that activities in the VST were sig-nificantly contaminated by counts spilling over from the adja-cent DCA and DPU: 70% ± 5% of the specific binding mea-sured in the VST originated from D2 receptors located in theVST, whereas 12% ± 3% and 18% ± 3% were contributed byD2 receptors in the DCA and DPU, respectively. Thus, accu-racy of D2 receptor measurement is improved by correction forpartial voluming effects. The demonstration of an appropriateaccuracy and precision of D2 receptor measurement with[11C]raclopride in the VST is the first critical step toward theuse of this ligand in the study of synaptic dopamine transmis-sion at D2 receptors in the VST using endogenous competitiontechniques. Key Words: Dopamine—D2 receptor—Nucleusaccumbens—Partial volume effects—Positron emission to-mography—[11C]Raclopride—Ventral striatum.
Dopaminergic mesencephalic projections originatingin the midbrain are classically divided into nigrostriatal,mesolimbic, and mesocortical systems (Lindvall andBjorklund, 1978). The nigrostriatal system projects fromthe substantia nigra to the dorsal striatum and is involvedin sensorimotor coordination and initiation of movement.The mesolimbic system projects from the ventral teg-mental area (VTA) to limbic structures such as nucleusthe accumbens, hippocampus, and amygdala. The meso-
cortical system projects from the VTA to cortical regions(mainly medial prefrontal and cingulate cortices). Themesolimbic and mesocortical systems are involved in theregulation of attention, motivation, and drive (Mogensonet al., 1980). Dopaminergic transmission in the nucleusaccumbens is centrally involved in the rewarding effectsof alcohol and other drugs of abuse (Koob, 1992; DiChiara, 1995). The therapeutic effects of antipsychoticdrugs appear to be related to their ability to block dopa-mine D2 receptors in the nucleus accumbens (Deutch etal., 1991). Therefore, alterations of dopamine D2 recep-tor transmission is believed to be involved in a range ofneuropsychiatric conditions.
In rodents, the striatum is divided into anatomicallywell-delineated structures—the nucleus accumbens(“limbic striatum”) and the caudate-putamen (“sensori-motor” striatum). In primates, cortical and subcortical
Received January 3, 2001; final revision received April 6, 2001;accepted April 10, 2001.
Supported by the Public Health Service (NIMH RO1-MH54192,NIMH K02 MH01603–0, NIDA RO1-DA10219–01) and the LieberCenter for Schizophrenia Research.
Address correspondence and reprint requests to Dr. OsamaMawlawi, New York State Psychiatric Institute, 1051 Riverside Dr.,Unit 31, New York, NY 10032, U.S.A.
Journal of Cerebral Blood Flow and Metabolism21:1034–1057 © 2001 The International Society for Cerebral Blood Flow and MetabolismPublished by Lippincott Williams & Wilkins, Inc., Philadelphia
1034

inputs related to the limbic system (limbic lobe andamygdala) project not only to the accumbens, but also tothe ventral caudate nucleus and the ventral putamen(Lynd-Balta and Haber, 1994). Thus, in primates, thecritical functional organization opposes the limbic-related “ventral striatum” (VST, which includes accum-bens, ventral caudate and ventral putamen) and the “dor-sal” striatum (dorsal caudate [DCA] and dorsal putamen[DPU]). Until recently, positron emission tomography(PET) and single photon emission computed tomography(SPECT) imaging of striatal D2 receptors has been lim-ited to the striatum as a whole. Because the sizes of thedorsal caudate and putamen are much larger than the sizeof the VST, the dorsal striatum contributes to the major-ity of the “striatal signal” when the striatum is analyzedas a whole.
Recent progress in the resolution of PET camerasmight allow quantification of radioactive signal from theVST. For example, Drevets et al. (1999, 2001) recentlyreported that amphetamine-induced displacement of theD2 receptor radiotracer, [11C]raclopride, was larger in theanteroventral striatum compared with the dorsal caudatein baboons and humans, an observation consistent withmicrodialysis studies showing larger amphetamine-induced dopamine release in the accumbens comparedwith the caudate-putamen in rodents (Di Chiara et al.,1993). The ability to quantify D2 receptors in the humanVST would be extremely valuable in understanding therole of meso-limbic D2 receptor transmission in healthand disease.
As a first step toward this goal, the current studyevaluated the reproducibility of D2 receptor binding po-tential (BP) measurements with [11C]raclopride in theVST, DCA, and DPU in 10 healthy volunteers studiedtwice. The authors used the [11C]raclopride bolus plusconstant infusion method as refined by Watabe et al.(2000). [11C]Raclopride was administered as a bolus plusconstant infusion for 90 minutes. This infusion protocolallows the establishment of an equilibrium state, gener-ally achieved as early as 40 minutes after initiation of theprocedure. Emission data were collected with the high-resolution ECAT EXACT HR+ PET scanner, and datafrom 40 to 90 minutes were used to calculate distributionvolumes in striatal subregions. After a 30- to 60-minuteresting period, the experiment was repeated, and the re-producibility of the measurement was evaluated. Be-cause partial volume effects (PVE) were expected to re-sult in significant contamination of activities in the VSTby activities originating in the DCA and DPU, PVE cor-rection was applied to the data according to a model ofthe point spread function of the scanner used in theseexperiments.
D2 receptor concentration is much less in extrastriatalcompared with striatal regions, and [11C]raclopride isgenerally considered inappropriate for the measurement
of extrastriatal D2 receptors. However, given the well-established sensitivity of [11C]raclopride to competitionby endogenous dopamine (Volkow et al., 1994; Carsonet al., 1997), the authors also investigated the displace-ability and reproducibility of thalamic [11C]racloprideuptake in this data set, to assess the feasibility of mea-suring changes in endogenous dopamine concentration inthe thalamus using [11C]raclopride (Volkow et al., 1997).
MATERIALS AND METHODS
SubjectsThe authors report here the results of 23 experiments in 13
healthy volunteers. Ten healthy volunteers (4 males, 6 females,aged 33 ± 13 years, range 22 to 59, with these and subsequentvalues given as mean ± SD) participated in the test–retest study.Subjects were scanned twice on the same day to evaluate thereproducibility of the outcome measures (20 scans). These 20experiments were acquired successively, and all experimentsacquired were included in the analysis, to provide a represen-tative and unbiased estimate of the reproducibility of the mea-surements. In addition, 3 subjects (27 ± 2.8 years; 1 male and2 females) participated in an experiment designed to assessthe displaceability of [11C]raclopride brain uptake in the thala-mus. These subjects underwent one scanning session duringwhich haloperidol was administered after establishment ofequilibrium.
The absence of medical, neurologic, and psychiatric history(including alcohol and drug abuse) was assessed by history,review of systems, physical examination, routine blood tests,pregnancy test, urine toxicology, and electrocardiogram. Thestudy was approved by the Columbia Presbyterian MedicalCenter and New York State Psychiatric Institute InstitutionalReview Boards, and subjects provided written informed con-sent after receiving an explanation of the study.
RadiochemistryO-desmethyl raclopride hydrobromide, precursor for the
preparation of [11C]raclopride, was generously provided by theAstra Arcus Pharmaceutical Company (Sodertalje, Sweden).[11C]Methyl triflate was produced by passing [11C]methyl io-dide through a silver triflate furnace according to Jewett’s pro-cedure (Jewett, 1992). Briefly, 11CO2 was bubbled into a tet-rahydrofuran (THF) solution of lithium aluminum hydride.Concentrated hydrogen iodide was added, and [11C]methyl io-dide was distilled through a stream of argon through a silvertriflate furnace (195°C) to yield [11C]methyl triflate, which wastrapped in a solution of O-desmethyl raclopride hydrobromideand sodium hydroxide in dimethylsulfoxide. After a 5-minutereaction at 90°C, the crude product was purified by high pres-sure liquid chrotomatography (HPLC) (column: PhenomenexC18, 10 micron, 25 × 1 cm; solvent: 30% acetonitrile and 70%0.1 mol/L ammonium formate-0.5% acetic acid; flow rate: 10mL/min). The product fraction was diluted with water and passedthrough a classic C18 Sep-Pak (Waters, Milford, MA, U.S.A.).The final product was recovered from the Sep-Pak using 1 mLethanol. The ethanol solution was mixed with saline and filteredthrough a 0.22-micron filter and collected in a sterile vial.
Mean specific activity at the time of injection was 2117 ±652 Ci/mmol for the test–retest studies (n � 20). No significantdifferences were observed in the specific activities of the test(2237 ± 717 Ci/mmol, n � 10) and retest (1996 ± 593Ci/mmol, n �10) studies (paired t-test, P � 0.40). Mean spe-cific activity for the haloperidol experiments was 2600 ± 815Ci/mmol (n � 3).
QUANTIFICATION OF VENTROSTRIATAL D2 RECEPTORS WITH PET 1035
J Cereb Blood Flow Metab, Vol. 21, No. 9, 2001
Positron emission tomography protocolSubject preparation included placement of two venous cath-
eters (one for radiotracer infusion and one for blood sampling).Head movement was prevented with a polyurethane head im-mobilizer system (Soule Medical, Tampa, FL, U.S.A.) moldedaround the subject’s head (Mawlawi et al., 1999).
Test–retest studies. Positron emission tomography imagingwas performed with the ECAT EXACT HR+ PET scanner(Siemens/CTI). In three-dimensional mode, this camera pro-vides an inplane resolution of 4.3 mm, 4.5 mm, 5.4 mm, and 8.0mm full width at half maximum (FWHM) at a distance of 0, 1,10, and 20 cm from the center of the field of view (FOV),respectively (Brix et al., 1997). Slice spacing is 2.46 mm, andaxial resolution in three-dimensional mode is 4.1, 5.1, and 7.8mm FWHM at 0, 10, and 20 cm of the FOV. A 15-minutetransmission scan was obtained before radiotracer injection forattenuation correction.
[11C]Raclopride was delivered in a 60-mL syringe and ad-ministered by a computer-operated pump (IMED pump;Gemini PC-1, San Diego, CA, U.S.A.). At time 0, a bolus doseof 30 mL was given over 3 minutes. At 3 minutes, the rate ofinfusion was decreased to 0.28 mL min−1 and this rate wasmaintained for the remaining 87 minutes. The bolus to infusionrate ratio (Kbol) was 1.75 hours (or 105 minutes). This ratio wasselected based on the optimization procedure published byWatabe et al. (2000).
Mean activity available in the 60 mL syringe at the time ofthe initiation of the injection was 18.9 ± 6.5 mCi. Accountingfor the decay, mean activity effectively injected was 12.7 ± 4.5mCi. Activities available for test (19.5 ± 5.9 mCi) and reteststudies (18.3 ± 7.4 mCi) were not significantly different (pairedt-test, P � 0.58). The injected mass for test (3.3 ± 1.52 �g) andretest (3.26 ± 1.28 �g) studies were not significantly different(P � 0.89). Emission data were collected in the three-dimensional mode for 90 minutes as 24 successive frames ofincreasing duration (3 * 20 seconds, 2 * 1 min, 2 * 2 min, 1 *3 min, 16 * 5 min). Reconstruction was performed using amodel-based scatter correction technique (Watson et al., 1996),attenuation correction based on transmission data, and a Sheppfilter with a cutoff of 0.5 cycles/projection rays.
Haloperidol experiments. The PET procedure was identicalto the one used for the test–retest studies, with the followingexceptions: (1) studies were acquired on the ECAT EXACT 47(three-dimensional in plane and axial resolutions of 6 mm and4.6 mm FWHM, respectively, at the center of the FOV, slicespacing of 3.375 mm, (Wienhard et al., 1992);(2) total durationof the experiment was 120 minutes (bolus volume of 25.6 mLover 3 minutes; infusion rate of 0.25 mL min−1 for 117 min-utes; Kbol of 105 minutes); (3) haloperidol was injected IV over1 minute at 60 minutes at a dose of 0.2 mg kg−1 (n � 1) or 0.3mg kg−1 (n � 2). Accounting for the decay, the mean activityeffectively injected into the subjects was 14.7 ± 4.9 mCi.
Plasma analysis[11C]Raclopride plasma concentration was measured in 5
venous samples (40, 50, 60, 70, and 80 minutes). After cen-trifugation (10 minutes at 1,800 g), plasma activity was mea-sured in a sodium iodide well counter (Wallac 1480 Wizard 3MAutomatic Gamma Counter, Gaithersburg, MD, U.S.A.). Theparent fraction was measured as follows: plasma (0.5 mL) waspipetted into a centrifuge tube with 0.7 mL of acetonitrile. Thetube was mixed and centrifuged (3.5 minutes at 15,000 g). Theliquid phase was separated from the precipitate and injectedinto the HPLC. The HPLC eluate was fraction-collected in 5counting tubes (4.4 mL each). The precipitate, the 0.1 mLsolution, and the HPLC fractions then were counted by a
gamma counter. The HPLC system comprised a Waters 510isocratic pump, a Rheodyne injector equipped with a 2-mLsample loop, a C18 analytical column (Phenomenex, Torrance,CA, U.S.A.; 10 micron, 4.6 × 250 mm), a Bioscan Flow Cellgamma detector (Bioscan, Washington, DC, U.S.A.), and afraction collector. The column was eluted with a mixture ofacetonitrile (33%) and aqueous 0.1 mol/L ammonium formatewith 0.5% acetic acid (67%) at a flow rate of 2 mL/min. Beforeplasma sample analysis, the retention time of the parent tracerwas established using the Bioscan gamma counter. The reten-tion times of the metabolites and the parent compound were 2and 8 minutes, respectively. The parent fraction was calculatedas the ratio of the fractions containing the parent to the totalamount collected.
Plasma parent concentration at time t was obtained by cal-culating the product of total plasma activity and the fraction ofactivity corresponding to the parent compound as measuredwith HPLC. Plasma parent steady-state concentration (CSS,�Ci mL−1) was calculated as the average of the five determi-nations of plasma parent concentration. Clearance of the parentcompound (L h−1) was calculated as the ratio of the infusionrate (mCi h−1) to CSS (Rowland and Tozer, 1989; Abi-Darghamet al., 1994).
For the determination of the plasma free fraction (f1), trip-licate 200 �L aliquots of plasma collected before tracer injec-tion were mixed with radiotracer, pipetted into ultrafiltrationunits (Centrifree, Amicon, Danvers, MA, U.S.A.), and centri-fuged at room temperature (20 minutes at 4000 g) (Gandelmanet al., 1994). Plasma and ultrafiltrate activities were counted,and f1 was calculated as the ratio of ultrafiltrate activity to totalplasma activity. Triplicate aliquots of tracer in pH 7.4 Tris-buffer also were processed to determine the filter retention offree [11C]raclopride.
Magnetic resonance imaging protocolMagnetic resonance images were acquired on a GE 1.5 T
Signa Advantage system. After a sagittal scout (localizer), per-formed to identify the anterior commissure–posterior commis-sure (AC-PC) plane (1 minute), a transaxial T1-weighted se-quence with 1.5-mm slice thickness was acquired in a coronalplane orthogonal to the AC-PC plane over the whole brain withthe following parameters: 3-dimensional SPGR (spoiled gradi-ent recalled acquisition in the steady state); repetition time �34 milliseconds; echo time � 5 milliseconds; flip angle � 45°;slice thickness � 1.5 mm and zero gap; 124 slices; FOV 22 ×16 cm; 256 × 192 matrix, reformatted to 256 × 256, yielding avoxel size of 1.5 mm × 0.85 mm × 0.85 mm; time of acquisitionwas 11 minutes.
Regions of interestImage analysis was performed within MEDx (version 2.11;
Sensor Systems, Sterling, VA, U.S.A.). Regions of interest(ROIs) boundaries were traced on MRI slices oriented in thecoronal plane. The following ROIs were drawn: VST, DCA,DPU, and thalamus. The cerebellum, a structure devoid of D2
and D3 receptors in humans, was used as the region of refer-ence. The whole striatal region (STR) was calculated as thepixelwise weighted sum of VST, DCA, and DPU.
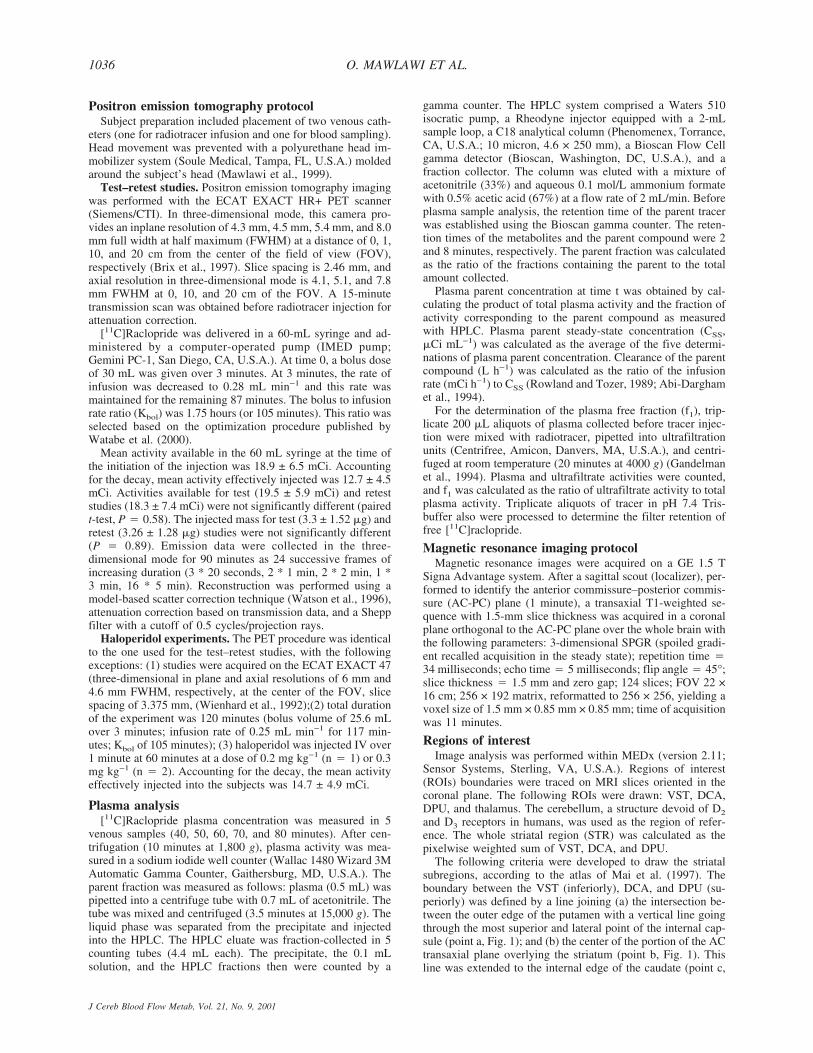
The following criteria were developed to draw the striatalsubregions, according to the atlas of Mai et al. (1997). Theboundary between the VST (inferiorly), DCA, and DPU (su-periorly) was defined by a line joining (a) the intersection be-tween the outer edge of the putamen with a vertical line goingthrough the most superior and lateral point of the internal cap-sule (point a, Fig. 1); and (b) the center of the portion of the ACtransaxial plane overlying the striatum (point b, Fig. 1). Thisline was extended to the internal edge of the caudate (point c,
O. MAWLAWI ET AL.1036
J Cereb Blood Flow Metab, Vol. 21, No. 9, 2001
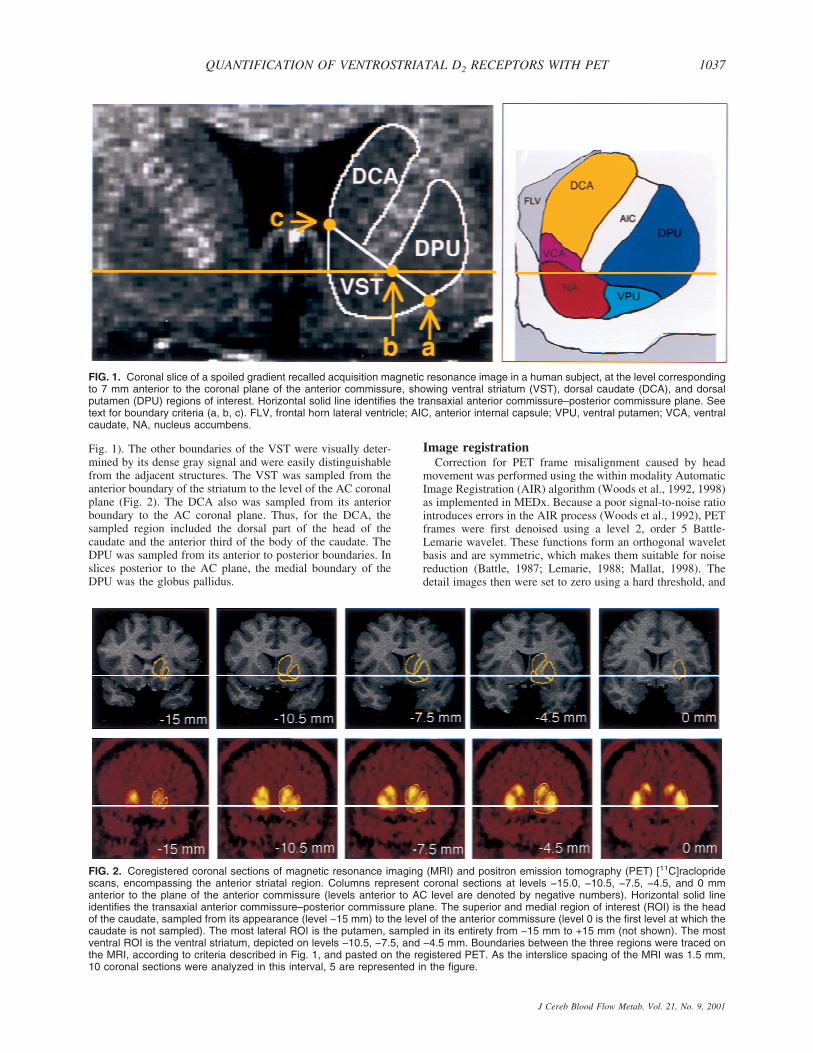
Fig. 1). The other boundaries of the VST were visually deter-mined by its dense gray signal and were easily distinguishablefrom the adjacent structures. The VST was sampled from theanterior boundary of the striatum to the level of the AC coronalplane (Fig. 2). The DCA also was sampled from its anteriorboundary to the AC coronal plane. Thus, for the DCA, thesampled region included the dorsal part of the head of thecaudate and the anterior third of the body of the caudate. TheDPU was sampled from its anterior to posterior boundaries. Inslices posterior to the AC plane, the medial boundary of theDPU was the globus pallidus.
Image registrationCorrection for PET frame misalignment caused by head
movement was performed using the within modality AutomaticImage Registration (AIR) algorithm (Woods et al., 1992, 1998)as implemented in MEDx. Because a poor signal-to-noise ratiointroduces errors in the AIR process (Woods et al., 1992), PETframes were first denoised using a level 2, order 5 Battle-Lemarie wavelet. These functions form an orthogonal waveletbasis and are symmetric, which makes them suitable for noisereduction (Battle, 1987; Lemarie, 1988; Mallat, 1998). Thedetail images then were set to zero using a hard threshold, and
FIG. 1. Coronal slice of a spoiled gradient recalled acquisition magnetic resonance image in a human subject, at the level correspondingto 7 mm anterior to the coronal plane of the anterior commissure, showing ventral striatum (VST), dorsal caudate (DCA), and dorsalputamen (DPU) regions of interest. Horizontal solid line identifies the transaxial anterior commissure–posterior commissure plane. Seetext for boundary criteria (a, b, c). FLV, frontal horn lateral ventricle; AIC, anterior internal capsule; VPU, ventral putamen; VCA, ventralcaudate, NA, nucleus accumbens.
FIG. 2. Coregistered coronal sections of magnetic resonance imaging (MRI) and positron emission tomography (PET) [11C]raclopridescans, encompassing the anterior striatal region. Columns represent coronal sections at levels −15.0, −10.5, −7.5, −4.5, and 0 mmanterior to the plane of the anterior commissure (levels anterior to AC level are denoted by negative numbers). Horizontal solid lineidentifies the transaxial anterior commissure–posterior commissure plane. The superior and medial region of interest (ROI) is the headof the caudate, sampled from its appearance (level −15 mm) to the level of the anterior commissure (level 0 is the first level at which thecaudate is not sampled). The most lateral ROI is the putamen, sampled in its entirety from −15 mm to +15 mm (not shown). The mostventral ROI is the ventral striatum, depicted on levels −10.5, −7.5, and −4.5 mm. Boundaries between the three regions were traced onthe MRI, according to criteria described in Fig. 1, and pasted on the registered PET. As the interslice spacing of the MRI was 1.5 mm,10 coronal sections were analyzed in this interval, 5 are represented in the figure.
QUANTIFICATION OF VENTROSTRIATAL D2 RECEPTORS WITH PET 1037
J Cereb Blood Flow Metab, Vol. 21, No. 9, 2001

the resultant images were inverse wavelet transformed back tothe spatial domain. To address the problem of image bound-aries during the application of the forward wavelet transforma-tion, the authors mirrored the boundary pixel values with theimage edge acting as a pivot. Denoised frames were registeredto a denoised frame of reference and the resultant transforma-tion matrix (TM1) was saved. The frame of reference waschosen as the frame with the highest noise equivalent counts(NEC), calculated as T2/(T+S+R), where T, S, and R are true,scatter, and random counts recorded over the frame duration,respectively (Strother et al., 1990). This frame corresponded tothe first 5-minute frame (10 to 15 minutes). The effectivenessof the within modality registration on denoised images wasassessed by comparing time-activity curves before and afterframe realignment.
The denoised frame of reference (10 to 15 minutes) wascoregistered to the MRI, using the between-modality AIR pro-cedure (Woods et al., 1993). The resulting transformation ma-trix (TM2) was saved. TM1 and TM2 then were applied con-secutively to each of the original PET frames.
For every frame but the first 5-minute frame (15 to 90 min-utes, i � 1 to 15), the length of the spatial vector characterizingthe spatial shift of the brain location in frame (i) relative to theprevious frame (i-1) was estimated by the translocation im-posed by the spatial registration on 9 pixels, corresponding tothe center of each ROI (n � 8) and the cerebellum. The Eu-clidean distance between the location of each of these pixels inframe (i) and (i-1) was computed. The average length of thetranslocation vectors at the nine pixels was used as a globalindex of brain spatial shift between frames (i) and (i-1). Thismeasure provided an estimate of the magnitude of head motionduring frame acquisition and was used to calculate the imageblurring introduced by head motion. Motion-related blurringthen was taken into account for the estimations of PVE affect-ing the images.
Outcome measures[11C]Raclopride was assumed to be at equilibrium during
the 40- to 90-minute interval. The quality of the equilibriumwas evaluated by measuring the change over time of regionalactivities during the 40- to 90-minute interval. The slope ofthe regression of activities over time was expressed as a per-centage of the mean value during the interval. The noise in thebrain measurement was estimated by the SD of the regionalactivities in the 10 frames of the 40- to 90-minute interval(5-minute frames) and was expressed as percentage of the meanvalue (%CV).
Specifically bound radioligand concentration (B, �Ci/mL) ineach ROI was derived as the difference between the activity inthe ROI (AROI) and the region of reference (AREF, cerebellum).Right and left regions were averaged. The relation betweenequilibrium values of B, the intracerebral free radioligand (F),the equilibrium dissociation constant (KD), and the maximumnumber of available binding sites (Bmax) is given by the Mi-chaelis–Menten equation:
B =BMAX × F
KD + F(1)
At tracer dose, F is negligible relative to KD, and Eq. 1simplifies to
B
F=
BMAX
KD(2)
The concentration of the intracerebral free radioligand (F) isnot directly measurable. Assuming that at equilibrium, the freeradiotracer equilibrates on both sides of the blood–brain barrier,F is equal to the free radiotracer concentration in the plasma atsteady state, given by the product of the plasma free fraction(f1) and the steady-state concentration of the radiotracer (CSS,�Ci/mL)
AROI − ACER
f1CSS=
B
F=
BMAX
KD(3)
Whereas the outcome measure derived in Eq. 3 is the onlyexpression of the Bmax/KD ratio that depends exclusively onreceptor parameters and corresponds to the original definitionof the binding potential (Mintun et al., 1984), the use of thisoutcome measure requires the measurement of the plasma freefraction (f1). Because this measurement is often found unreli-able for radiotracers with free fractions less than 10%, othermore practical and reproducible outcome measures have beenintroduced. Here, the term binding potential (BP; mL of plasmaper g of brain tissue, assuming a brain tissue density of 1) isused to denote the equilibrium ratio between the specific bind-ing and the plasma CSS:
BP =AROI − ACER
CSS=
f1BMAX
KD(4)
Another outcome measure, the specific-to-nonspecific equi-librium partition coefficient, is given by the equilibrium ratiobetween the specific binding and the activity in the referenceregion, which includes both free and nonspecific binding, withf2 being the free fraction in the region of reference. V3� is usedto denote this ratio:
V3� =AROI − ACER
ACER=
f2BMAX
KD(5)
The equality between free [11C]raclopride concentrations onboth sides of the blood–brain barrier at equilibrium can bewritten as
f1CSS = f2ACER (6)
from which it follows that the distribution volume of the cer-ebellum relative to the Css, V2, is equal to the f1/f2 ratio.
V2 =ACER
CSS=
f1
f2(7)
Thus, the use of BP (as defined here) as an outcome measurefor between-subject comparison implies the assumption of nobetween-subject differences in nonspecific binding to plasmaproteins (f1). The use of V3� as an outcome measure forbetween-subject comparison implies the assumption of nobetween-subject differences in nonspecific binding in thebrain (f2).
For equilibrium analysis, the specific-to-nonspecific ratio attime t, R(t), was calculated for each frame from 40 to 90 min-utes (n � 10) as (AROI − ACER)/ACER. V3� was derived as theaverage R(t) for this sampling interval. Binding potential wascalculated as the average specific binding during that intervalover the average of the five plasma measurements—that is,(AROI − ACER)/CSS. Equilibrium analyzes were performed withand without correction for activity present in the brain vascu-lature. The contribution of the blood activity in the vasculatureto the regional activity was calculated assuming a 5% blood
O. MAWLAWI ET AL.1038
J Cereb Blood Flow Metab, Vol. 21, No. 9, 2001
volume (Mintun et al., 1984) and a cell-to-plasma [11C]raclo-pride partition coefficient of 1.
Regional V3� was also derived with kinetic modeling usingthe simplified reference tissue method (SRTM; Lammertsmaand Hume, 1996) implemented in MATLAB (The MathWorks, South Natick, MA, U.S.A.). This analysis derives threeparameters from the observed relation between a reference re-gion and an ROI, based upon an assumed relation between thereference region and the arterial input function. These are R1,the ratio of K1 in the ROI relative to cerebellar K1 (where K1,mL min−1 g−1, is the regional blood flow times the extraction),the parameter k2 (min−1, rate of diffusion of the tracer out of thebrain), and V3�. No smothing was applied to the data beforethe SRTM fit. Equal weight was given to each frame in theSRTM fit.
Test–retest variability was calculated as the absolute value ofthe difference between the test and retest divided by the aver-age of the test and retest values. The reliability of the measure-ments was assessed by the intraclass correlation coefficient(ICC), calculated as (Kirk, 1982):
BSMSS − WSMSS
BSMSS + (n − 1)WSMSS(8)
where BSMSS is the mean sum of squares between subjects,WSMSS is the mean sum of squares within subjects, and n isthe number of repeated observations (n � 2 in this study). Thiscoefficient estimates the reliability of the measurement andassumes values from −1 (no reliability, that is, BSMSS � 0) to1 (maximum reliability, achieved in the case of identity be-tween test and retest, that is, WSMSS � 0).
For haloperidol experiments, the haloperidol-induced de-crease in [11C]raclopride V3� was calculated by comparing theposthaloperidol measurement of V3� (90- to 120-minute inter-val) to the baseline V3� (40- to 60-minute interval).
Partial volume effect analysisThe relatively small size of the VST and its proximity to
other regions with high [11C]raclopride uptake (DPU andDCA) raised concerns about the recovery of true activities cap-tured in the VST region of interest measurements and about thecontamination of VST measurements by activity spilled overfrom the DPU and DCA. These effects were evaluated by as-suming uniform activity distribution within each region, form-ing the geometric transfer matrix (GTM) (Rousset et al., 1998;Slifstein et al., 2000), calculating true activity in each region,and estimating recovery and contamination associated with un-corrected images.
The first step of this analysis was to form the GTM. Becauseof the limited resolution of the camera, a fraction of the countsoriginating in a given region spill out into surrounding regions.Conversely, counts measured in a given region include countsspilled in from surrounding regions. The GTM describes thecontribution of each source region to the measured regionalactivities. The GTM is a R × R matrix, where R is the numberof regions and the ij element is the spillover from region j intoregion i. In the GTM, the spillover is described as the averagefraction of the true activity in the source region j (Tj) present inthe voxels of the measured region i. Note that the diagonal ofGTM represents the contribution of a region to itself, that is, theactivity recovery.
The GTM was formed by analysis of the MRI images byusing routines implemented in MATLAB. Because the resolu-tion of the PET camera varies with the location of the voxel inthe FOV, the position of the brain relative to the FOV duringthe PET scan was taken into account. From the MRI, R binary
image sets were formed, with voxel values equal to 1 in thesource region and 0 elsewhere. Nine regions were considered:left and right DCA, DPU, VST, thalamus, and brain tissue notincluded in these regions (background region). Note that thebackground region included the rest of the brain, and that themeasured cerebellar activity was used as the measured activityfor the background region. This choice neglected possible re-gional differences in nonspecific binding, even lower activitylevels in the adjacent lateral ventricles, and the presence of alow density of D2 receptors in the external pallidum (Joyce etal., 1991; Hall et al., 1996). These nine binary image sets wereresampled into the original orientation (transaxial), location,and resolution of the PET images. Resampled binary imageswere smoothed with a model point spread function (PSF) de-signed to simulate the characteristics of the PSF of the PETscanner, creating 9 blurred image sets with voxel values be-tween 1 and 0. The PSF used elliptical gaussian kernels. Afterthe smoothing process, the ij element of the GTM was mea-sured by summing voxel values in region i on the smoothedimages of source region j, then dividing by the sum of thenumber of voxels in region i. Because the location of the brainrelative to the FOV varied between test and retest, this opera-tion was performed for both test and retest studies, yielding atotal of 180 smoothed binary image sets and 20 GTMs.
The second step was to calculate true activities in each re-gion. The measured activity in the ith region (mi) equals aweighted sum of the true values in all source regions, with theweights appearing in the ith row of GTM.
mi = GTMi1T1 + GTMi2T2 + … + GTMiRTR (9)
from which it can be seen that the measured activity mi dependsboth on the geometric relations between region i and the otherregions (as embodied in GTMij) and the relative values of thetrue activity levels in the source regions (Tj). Estimates of thetrue activities T � [T1, T2, … TR]� were obtained by multi-plying the vector of measured activities m � [m1, m2 … mR]�by the inverse of the GTM.
T = GTM−1 × m (10)
The third step was to calculate for each region the fraction ofmeasured specific binding corresponding to specific binding toD2 receptors located in the region itself (“authentic” specificbinding). For this analysis, background activity was subtractedfrom T in all regions to form TS (vector of true regional specificbinding), and a specific binding matrix (SBM) was calculatedas SBMij � GTMij * TSj. The ij element of the SBM repre-sented the fraction of binding measured in a target region icontributed by binding located in a source region j. The con-tribution of each source region j then was expressed as a per-centage of measured binding in target region i. This analysisallowed the assessment of the regional fidelity of measured D2
receptor BP in the absence of PVE corrections. Note that thediagonal of SBM represents the percentage of specific bindingin a given region that is contributed by the region itself, that is,the specific binding recovery. Conversely, the off-diagonal val-ues represent the percentage of specific binding in a givenregion contributed by the specific binding in another region, thesum of which is the specific binding contamination.
These analyzes were completed at three levels of resolu-tion—system resolution, realistic image resolution, and “worstcase scenario” resolution.
The first analysis (system resolution) was performed at thesystem resolution level of the camera. The inplane FWHMvaried linearly in the radial direction from 4.3 mm at the center
QUANTIFICATION OF VENTROSTRIATAL D2 RECEPTORS WITH PET 1039
J Cereb Blood Flow Metab, Vol. 21, No. 9, 2001

of the FOV to 8.15 mm at 20 cm from the center of the FOV.The tangential FWHM varied from 4.3 mm to 5 mm. In theaxial direction, the FWHM varied from 4.1 mm at the trans-verse center of the FOV to 8.1 mm at 20 cm. These numberswere obtained by measuring the resolution of the camera usedin these studies and are consistent with published specificationsfor the HR+ scanner (Brix et al., 1997). This analysis providedestimates of PVE at a theoretical upper limit of resolution.
The second analysis (realistic image resolution) was per-formed at the resolution level of the image, to account foradditional blurring introduced by the reconstruction filter(Shepp 0.5 filter) and by average head motion. The FWHM ofthe Shepp 0.5 filter is 2.48 mm. The average head motionduring frame acquisition was estimated by the length of theglobal brain translocation vector imposed by AIR during thePET frame realignment. For the second analysis, the valuecorresponding to the average length of this vector observed forframes included in the sampling interval (40 to 90 minutes) wasused. This analysis provided estimates of PVE under realisticimaging conditions.
The third analysis (“worst case scenario” resolution) wasperformed using the average plus 2 SD value of the global braintranslocation vectors observed for frames included in the sam-pling interval. This analysis provided estimates of PVE underconditions of significant head movement within a scan frame.
Global resolution (FWHMG) resulting from various sourcesof blurring (FWHMi) was calculated as
FWHMG = �FWHM12 + FWHM2
2 (11)
and applied in a spatially dependent manner in the radial, tan-gential, and axial directions.
Statistical analysisValues were expressed as mean ± SD. Significant differences
were assessed with factorial or repeated measures analysis ofvariance (ANOVA), as appropriate. Relations between continu-ous variables were analyzed with the Pearson product momentcorrelation coefficient. A two-tailed P � 0.05 was selected asthe significance level.
RESULTS
Region of interest volumesVolumes of VST were 2546 ± 754 mm3 (%CV of
29%), ranging from 1410 to 3960 mm3. Volumes ofDCA were 4872 ± 501 mm3 (%CV of 10%), rangingfrom 4315 to 5788 mm3. Volumes of DPU were 7703 ±491 mm3 (%CV of 6%), ranging from 6774 to 8779mm3. The average volumetric contributions of DPU,DCA, and VST to the whole striatal region were 51%,32%, and 17%, respectively.
Registration analysisThe length of between-frame spatial shift imposed by
AIR increased from early to late frames; the total dura-tion of scanning before frame i was predictive of themagnitude of spatial correction imposed by AIR occur-ring between frame i and frame i-1 (r2 � 0.75, P <0.001, Fig. 3). There was no significant difference be-tween average spatial shift during test (1.12 ± 0.41 mm)and retest (1.02 ± 0.39) conditions (paired t-tests, P �0.64), suggesting that subjects did not move more during
the second study of the day as compared with the firststudy. The authors observed significant between-subjectdifferences in spatial shifts (P � 0.032), suggesting thatsome subjects moved more than others. The between-frame spatial shift imposed by AIR was used as an esti-mate of within-frame head movements. During the sam-pling interval, the average brain translocation per framewas 1.32 ± 0.36 mm. This value was used in the secondPVE analysis. For each frame of the sampling interval,the authors also calculated the value corresponding to theaverage plus 2 SD of the brain translocation vector, todefine an upper limit of the movement estimates. Thisanalysis yielded a value of 3.31 ± 1.14 mm. This valuewas used in the third PVE analysis.
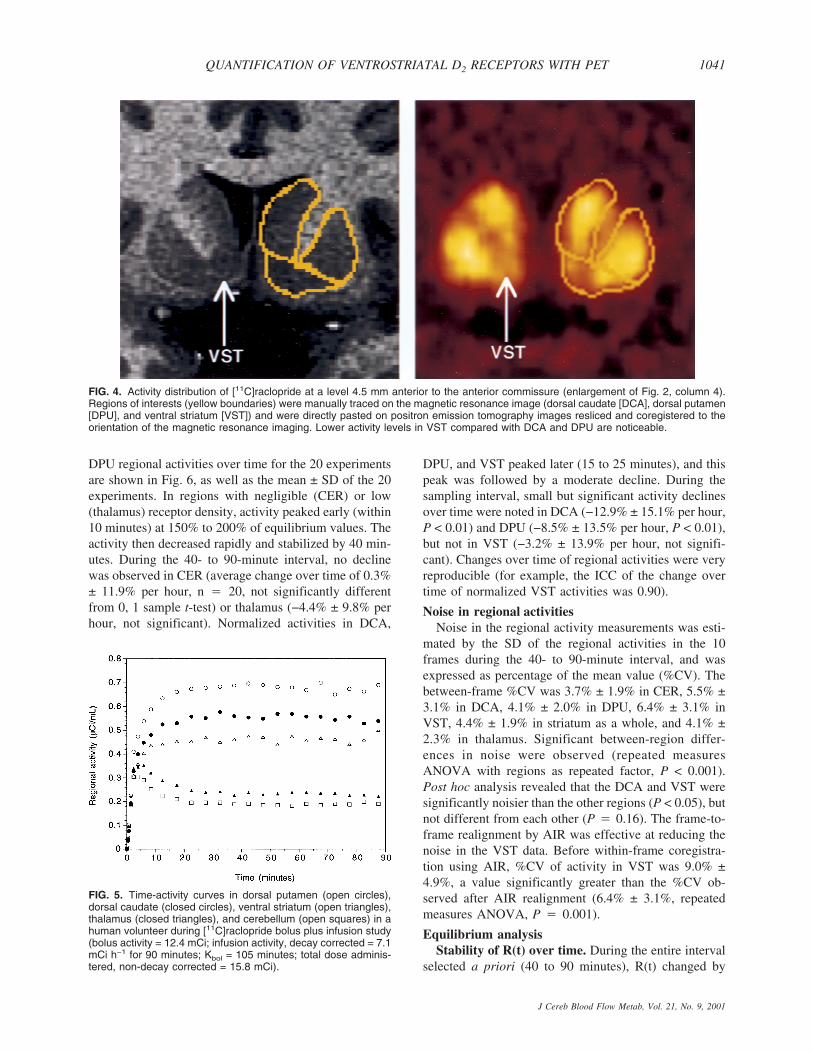
Stability of regional activitiesActivity concentrated in all striatal subregions, with
lower levels in VST compared with DCA and DPU (Fig.4). All regions displayed relatively stable levels of ac-tivities during the predefined sampling interval (40 to 90minutes, Fig. 5). Regional activities were normalized tomean activity in the sampling interval, and normalizedregional activities were plotted over time. Normalized
FIG. 3. Average (±SEM) of global brain spatial shift imposed bythe Automated Image Registration algorithm (AIR) during frame-to-frame realignment as a function of frame acquisition time rela-tive to the beginning of the experiment. Values of the y-axis rep-resent the spatial shift in brain position between each frame i andi-1. Global brain spatial shift was calculated as the average Eu-clidean distance between the positions of nine pixels (located atthe center of the nine regions of interest) during frames i and i-1.A significant relation was found between time of frame acquisitionand spatial shift from the preceding frame (r2 = 0.75, P < 0.001).The increased global brain spatial shift imposed by AIR for lateframes compared with early frames might be because subjectsmove more at the end of the experiment, because the lower countrate of the later frames induces randomness in the AIR process,or some combination of both factors.
O. MAWLAWI ET AL.1040
J Cereb Blood Flow Metab, Vol. 21, No. 9, 2001
DPU regional activities over time for the 20 experimentsare shown in Fig. 6, as well as the mean ± SD of the 20experiments. In regions with negligible (CER) or low(thalamus) receptor density, activity peaked early (within10 minutes) at 150% to 200% of equilibrium values. Theactivity then decreased rapidly and stabilized by 40 min-utes. During the 40- to 90-minute interval, no declinewas observed in CER (average change over time of 0.3%± 11.9% per hour, n � 20, not significantly differentfrom 0, 1 sample t-test) or thalamus (−4.4% ± 9.8% perhour, not significant). Normalized activities in DCA,
DPU, and VST peaked later (15 to 25 minutes), and thispeak was followed by a moderate decline. During thesampling interval, small but significant activity declinesover time were noted in DCA (−12.9% ± 15.1% per hour,P < 0.01) and DPU (−8.5% ± 13.5% per hour, P < 0.01),but not in VST (−3.2% ± 13.9% per hour, not signifi-cant). Changes over time of regional activities were veryreproducible (for example, the ICC of the change overtime of normalized VST activities was 0.90).
Noise in regional activitiesNoise in the regional activity measurements was esti-
mated by the SD of the regional activities in the 10frames during the 40- to 90-minute interval, and wasexpressed as percentage of the mean value (%CV). Thebetween-frame %CV was 3.7% ± 1.9% in CER, 5.5% ±3.1% in DCA, 4.1% ± 2.0% in DPU, 6.4% ± 3.1% inVST, 4.4% ± 1.9% in striatum as a whole, and 4.1% ±2.3% in thalamus. Significant between-region differ-ences in noise were observed (repeated measuresANOVA with regions as repeated factor, P < 0.001).Post hoc analysis revealed that the DCA and VST weresignificantly noisier than the other regions (P < 0.05), butnot different from each other (P � 0.16). The frame-to-frame realignment by AIR was effective at reducing thenoise in the VST data. Before within-frame coregistra-tion using AIR, %CV of activity in VST was 9.0% ±4.9%, a value significantly greater than the %CV ob-served after AIR realignment (6.4% ± 3.1%, repeatedmeasures ANOVA, P � 0.001).
Equilibrium analysisStability of R(t) over time. During the entire interval
selected a priori (40 to 90 minutes), R(t) changed by
FIG. 5. Time-activity curves in dorsal putamen (open circles),dorsal caudate (closed circles), ventral striatum (open triangles),thalamus (closed triangles), and cerebellum (open squares) in ahuman volunteer during [11C]raclopride bolus plus infusion study(bolus activity = 12.4 mCi; infusion activity, decay corrected = 7.1mCi h−1 for 90 minutes; Kbol = 105 minutes; total dose adminis-tered, non-decay corrected = 15.8 mCi).
FIG. 4. Activity distribution of [11C]raclopride at a level 4.5 mm anterior to the anterior commissure (enlargement of Fig. 2, column 4).Regions of interests (yellow boundaries) were manually traced on the magnetic resonance image (dorsal caudate [DCA], dorsal putamen[DPU], and ventral striatum [VST]) and were directly pasted on positron emission tomography images resliced and coregistered to theorientation of the magnetic resonance imaging. Lower activity levels in VST compared with DCA and DPU are noticeable.
QUANTIFICATION OF VENTROSTRIATAL D2 RECEPTORS WITH PET 1041
J Cereb Blood Flow Metab, Vol. 21, No. 9, 2001

−12.6% ± 13.8% in DCA, −7.2% ± 11.1% in DPU, and−7.6% ± 11.7% in thalamus; these values were signifi-cantly different from 0 (1 sample t-test, P < 0.05). Nosignificant change over time was observed for R(t) in theVST (2.6% ± 13.8%, P � 0.41). In all ROIs, R(t) valueswere within ±10% of V3� during the 40- to 90-minuteinterval.
Regional values. Values during test and retest of V3�calculated during the 40- to 90-minute interval are pre-sented in Table 1. Significant differences in [11C]raclo-pride V3� were noted between the three striatal subre-gions (repeated measures ANOVA with region as re-peated factor, P < 0.001). The greatest density of D2
receptors was measured in the DPU (2.99 ± 0.26), fol-lowed by the DCA (2.33 ± 0.28) and the VST (1.86 ±0.29). The thalamus showed low values of [11C]raclo-pride V3� (0.37 ± 0.06).
Test–retest reproducibility. None of the regionsshowed a significant change between the test and theretest V3� values (repeated measures ANOVA, not sig-nificant, Table 1). The test–retest variability of the wholestriatum V3� was 6.3% ± 4.1%. The test–retest variabilityof V3� in the DCA, DPU, and VST were 7.7% ± 5.1%,6.0% ± 4.1%, and 8.2% ± 6.2%, respectively. No sig-nificant differences were observed in the test–retestvariability of V3� between the three striatal subregions(repeated measures ANOVA with regions as repeatedmeasure, P � 0.36). Furthermore, the test–retest vari-ability of the striatal subregion V3� values were not sta-tistically different from the test–retest variability of V3�in the striatum as a whole (P > 0.05 for each subregion).V3� ICC values were 0.78, 0.77, 0.71, and 0.83 forwhole striatum, DCA, DPU, and VST, respectively, in-dicating that the measurement method detected true
FIG. 6. Time-activity curves in the dorsal putamen (DPU) in 20 [11C]raclopride bolus plus constant infusion experiments in 10 subjects(each subject studied twice). For each experiment, DPU activities were normalized to the mean activity recorded during the 40- to90-minute interval. (A) The 20 individual curves and (B) the mean ± SD at each time point. (B) The use of a constant and predeterminedKbol value (105 minutes) leads to overshoot and undershoot situations in the sampled group. (A) On average, this Kbol was associatedwith a slight overshoot peaking at 25 minutes, but activity levels stabilized within ±10% of mean values in the sampling interval (40 to 90minutes).
TABLE 1. Equilibrium analysis of [11C]raclopride V3� (40 to 90 minutes):reproducibility and reliability
Region Test Retest Change (%) Variability (%) ICC
Striatal subregions:Dorsal caudate 2.38 ± 0.27 2.29 ± 0.32 −4.3 ± 8.5 7.7 ± 5.1 0.77Dorsal putamen 3.02 ± 0.24 2.95 ± 0.31 −2.4 ± 7.1 6.0 ± 4.1 0.71Ventral striatum 1.83 ± 0.29 1.88 ± 0.32 2.6 ± 10.3 8.2 ± 6.2 0.83
Whole striatum 2.62 ± 0.25 2.56 ± 0.30 −2.4 ± 7.4 6.3 ± 4.1 0.78Thalamus 0.39 ± 0.05 0.36 ± 0.10 −8.7 ± 22.2 19.2 ± 18.5 0.33
Values are mean ± SD V3� (unitless) of 10 subjects studied twice. Change (%) is thedifference between test and retest values, expressed as the percentage of the average of testand retest values. Variability is the absolute value of change. ICC, intraclass correlationcoefficient.
O. MAWLAWI ET AL.1042
J Cereb Blood Flow Metab, Vol. 21, No. 9, 2001

between-subject differences. In contrast, measurement ofthalamic [11C]raclopride V3� was affected by largewithin-subject variability (± 19% ± 18%) and a low ICC(0.33). The test–retest variability of thalamic V3� wassignificantly greater than the variability of the striatalsubregion V3� values (repeated measures ANOVA, P �0.011, followed by post hoc analysis with P < 0.05 foreach thalamus to striatal subregion contrast).
Effectiveness of AIR. Automatic Image Registrationdid not significantly improve the test–retest variability ofV3� in the DCA (from 8.9% ± 8.0% before AIR to 7.7%± 5.1% after AIR, P � 0.68) or the DPU (from 7.4% ±4.6% before AIR to 6.0% ± 4.1% after AIR, P � 0.43).However, AIR induced a significant reduction in thevariability of V3� in the VST (from 21.3% ± 16.9% be-fore AIR to 8.2% ± 6.2% after AIR, P � 0.03). Regard-ing reliability, AIR provided dramatic improvements inthe ICC in all regions examined. Figure 7 shows thechange in test–retest variability of V3� in DPU and VSTprovided by AIR in all ten subjects. Notably, the twosubjects in which AIR did not improve test–retest vari-ability of V3� in VST are the two subjects with the leastvariability in the absence of AIR.
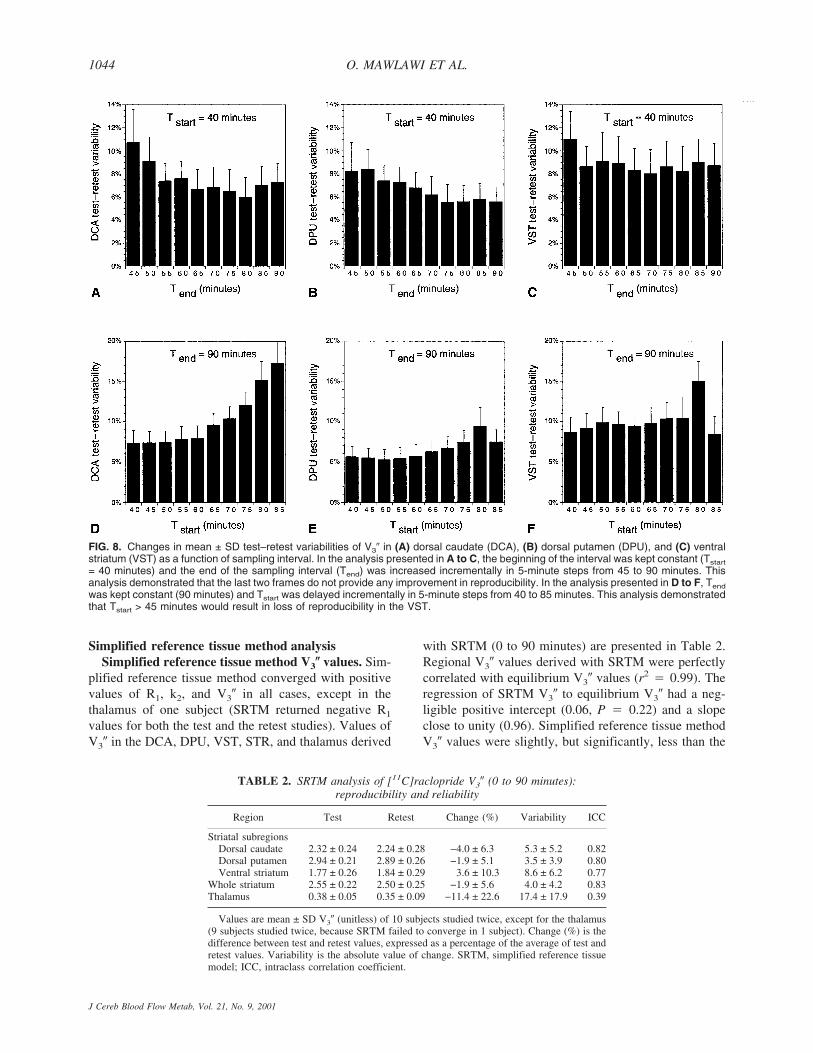
Sampling interval and reproducibility. The relationbetween Tend and reproducibility of V3� measurementswas investigated by comparing 9 sampling intervals,with Tstart fixed at 40 minutes and Tend increasing from45 to 90 minutes in increments of 5 minutes (Fig. 8,upper row). Varying Tend had a significant effect on test–retest variability when all regions were analyzed together(repeated measures ANOVA with intervals as repeated
factor, P < 0.001). When analyzing the regions sepa-rately, this effect reached significance in the DCA (P �0.003) and DPU (0.007), but not in the VST (P � 0.60)or thalamus (P � 0.86). The best combined reproduci-bility of the 3 striatal subregions (lowest average test–retest variability of the 3 striatal subregions) wasachieved with Tend of 80 minutes. Thus, the acquisitionof the last two frames did not provide any observableimprovement in measurement reproducibility.
The effect of Tstart on V3� reproducibility was evalu-ated by measuring test–retest variability using 9 differentsampling intervals with Tstart increasing from 40 to 85minutes in increments of 5 minutes (Fig. 8, lower row)and Tend constrained to 90 minutes. Varying Tstart sig-nificantly affected variability when all regions were ana-lyzed together (P < 0.001). In the analysis by subregion,this effect reached significance in the DCA (P < 0.001)and thalamus (P < 0.001), but not in the DPU (P � 0.09)and VST (P � 0.17). The best combined reproducibilityof the 3 striatal subregions (lowest average test–retestvariability of the 3 striatal subregions) was achieved withTstart of 40 minutes.
The authors also studied the test–retest variability ofV3� for any combination of Tstart and Tend, with Tstart
greater than 40 minutes. The best test–retest variabilitywas observed in the 60- to 80-minute interval for theDCA (5.3%), 70- to 80-minute interval for the DPU(4.4%), and 45- to 70-minute interval for the VST(8.0%). The optimal interval for the average test–retestvariability of the 3 regions was the 60- to 80-minuteinterval (6.4%).
FIG. 7. Effectiveness of Automatic Image Registration (AIR) frame-to-frame realignment in reducing test–retest variability of V3� mea-surements in (A) dorsal putamen (DPU) and (B) ventral striatum (VST). Data were analyzed with and without AIR frame-to-frameprocessing. Each point represents values of test–retest variability in the 10 pairs, without and with AIR realignment. The procedure didnot significantly improve the reproducibility of DPU V3� measurements. In contrast, in the VST, the mean ± SD variability improved from21.3% ± 16.9% before AIR to 8.2% ± 6.2% after AIR. This analysis illustrates that V3� measurement in the VST is very vulnerable to headmotion and misregistration.
QUANTIFICATION OF VENTROSTRIATAL D2 RECEPTORS WITH PET 1043
J Cereb Blood Flow Metab, Vol. 21, No. 9, 2001
Simplified reference tissue method analysisSimplified reference tissue method V3� values. Sim-
plified reference tissue method converged with positivevalues of R1, k2, and V3� in all cases, except in thethalamus of one subject (SRTM returned negative R1
values for both the test and the retest studies). Values ofV3� in the DCA, DPU, VST, STR, and thalamus derived
with SRTM (0 to 90 minutes) are presented in Table 2.Regional V3� values derived with SRTM were perfectlycorrelated with equilibrium V3� values (r2 � 0.99). Theregression of SRTM V3� to equilibrium V3� had a neg-ligible positive intercept (0.06, P � 0.22) and a slopeclose to unity (0.96). Simplified reference tissue methodV3� values were slightly, but significantly, less than the
FIG. 8. Changes in mean ± SD test–retest variabilities of V3� in (A) dorsal caudate (DCA), (B) dorsal putamen (DPU), and (C) ventralstriatum (VST) as a function of sampling interval. In the analysis presented in A to C, the beginning of the interval was kept constant (Tstart
= 40 minutes) and the end of the sampling interval (Tend) was increased incrementally in 5-minute steps from 45 to 90 minutes. Thisanalysis demonstrated that the last two frames do not provide any improvement in reproducibility. In the analysis presented in D to F, Tend
was kept constant (90 minutes) and Tstart was delayed incrementally in 5-minute steps from 40 to 85 minutes. This analysis demonstratedthat Tstart > 45 minutes would result in loss of reproducibility in the VST.
TABLE 2. SRTM analysis of [11C]raclopride V3� (0 to 90 minutes):reproducibility and reliability
Region Test Retest Change (%) Variability ICC
Striatal subregionsDorsal caudate 2.32 ± 0.24 2.24 ± 0.28 −4.0 ± 6.3 5.3 ± 5.2 0.82Dorsal putamen 2.94 ± 0.21 2.89 ± 0.26 −1.9 ± 5.1 3.5 ± 3.9 0.80Ventral striatum 1.77 ± 0.26 1.84 ± 0.29 3.6 ± 10.3 8.6 ± 6.2 0.77
Whole striatum 2.55 ± 0.22 2.50 ± 0.25 −1.9 ± 5.6 4.0 ± 4.2 0.83Thalamus 0.38 ± 0.05 0.35 ± 0.09 −11.4 ± 22.6 17.4 ± 17.9 0.39
Values are mean ± SD V3� (unitless) of 10 subjects studied twice, except for the thalamus(9 subjects studied twice, because SRTM failed to converge in 1 subject). Change (%) is thedifference between test and retest values, expressed as a percentage of the average of test andretest values. Variability is the absolute value of change. SRTM, simplified reference tissuemodel; ICC, intraclass correlation coefficient.
O. MAWLAWI ET AL.1044
J Cereb Blood Flow Metab, Vol. 21, No. 9, 2001

equilibrium V3� values, by 2.1% ± 3.7% in the DCA(repeated measures ANOVA with method as repeatedfactor, P � 0.012), by 2.2% ± 3.8% in the DPU (re-peated measures ANOVA with method as repeated fac-tor, P � 0.017), and by 2.6% ± 3.8% in the VST (re-peated measures ANOVA with method as repeated fac-tor, P � 0.031). Simplified reference tissue method V3�values were not different from equilibrium V3� values inthe thalamus (P � 0.65). Regional cerebral blood flow(rCBF) relative to the cerebellum (R1) values were sig-nificantly different across regions (DCA: 0.89 ± 0.07;DPU: 1.06 ± 0.09; VST: 0.98 ± 0.08; thalamus: 1.03 ±0.10, repeated measures ANOVA, P < 0.0001).
Stability of simplified reference tissue methodanalysis over time. The minimal scanning time need-ed to derive time-invariant estimates of regional V3�by SRTM was defined by analyzing data with increas-ing Tend (increments of 5 minutes, from Tend � 10minutes to Tend � 90 minutes) and keeping Tstart fixedat 0 minute. Results were expressed as a percentageof the reference value (Tend � 90 minutes). This anal-ysis demonstrated the quasi absence of a time-dependent bias in DCA and DPU for Tend > 20 minutes,
whereas VST showed lower V3� values for Tend < 60minutes, and noisy results for Tend < 30 minutes(Fig. 9A to 9C).
Reproducibility of simplified reference tissuemethod V3�. Compared with equilibrium analysis, thetest–retest variability of SRTM (Table 2) was signifi-cantly better in the DCA (repeated measures ANOVAwith method of analysis as repeated factor, P �0.01) andDPU (P � 0.0027), but not in the VST (P � 0.57) orthalamus (P � 0.12). The effect of scanning time ontest–retest variability of SRTM V3� also was investigatedfor 40 minutes < Tend < 90 minutes. Taking the 3 striatalsubregions together, Tend had a significant impact ontest–retest variability (repeated measures ANOVA, P �0.007). The best combined reproducibility (lowest aver-age test–retest variability of the three regions) wasachieved with Tend � 80 minutes (5.4%). In analysis bysubregion, this effect reached significance in the VST (P� 0.01), but not in DCA (P � 0.24) and DPU (P �0.47, Fig. 9E to 9F). Together, these data indicate thatincreasing Tend greater than 45 minutes did not provideappreciable improvement of DCA and DPU V3� deriva-tion with SRTM, but that the V3� determination in the
FIG. 9. Scanning time and performance of the simplified reference tissue method (SRTM) analysis. Data were analyzed using SRTM withincreasing Tend (5-minute increments from Tend = 10 minutes to Tend = 90 minutes) and keeping Tstart fixed at 0 minute. Mean ± SD ofV3� in (A) dorsal caudate (DCA), (B) dorsal putamen (DPU), and (C) ventral striatum (VST) expressed as percentage of value derivedat 90 minutes. Whereas essentially 20 minutes of scanning would be appropriate to derive V3� in DCA and DPU, 60 minutes of scanningis required to derive unbiased V3� in VST. Test–retest variability of SRTM derived V3� in (D) DCA, (E) DPU, and (F) VST for scanningperiods ranging from 0 to 45 minutes to 0 to 90 minutes. Scanning more than 60 minutes does not improve the test–retest variability.
QUANTIFICATION OF VENTROSTRIATAL D2 RECEPTORS WITH PET 1045
J Cereb Blood Flow Metab, Vol. 21, No. 9, 2001
VST benefited from at least 60 minutes of dataacquisition.
Plasma analysisTotal plasma activity increased during the 40- to 90-
minute interval by 16% ± 23% per hour (significantlydifferent from 0, one sample t-test, P < 0.01). The frac-tion of activity corresponding to the parent compounddecreased over time by −10% ± 12% (P < 0.0005). Theplasma parent compound concentration was stable overtime (average change of −1% ± 14%, P � 0.89). The testand retest values of total activity clearance, parent frac-tion, total (bound and free) parent clearance, and freefraction (f1) are listed in Table 3. Measurement of thetotal activity, parent fraction, and total parent were veryreproducible and were associated with high ICC values.In contrast, measurement of f1 (3.5% ± 0.48%) was as-sociated with ICC values close to 0, indicating similarbetween- and within-subject variability (the assay failedto detect significant between-subject differences inf1 values).
Cerebellum V2
Cerebellum V2 was 0.44 ± 0.10 mL g−1 in test condi-tions and 0.46 ± 0.09 mL g−1 in retest conditions. Nosignificant differences were observed in cerebellum V2
between test and retest conditions (repeated measuresANOVA, P � 0.20). The variability was ± 5.4% ± 4.8%,and the ICC was close to unity (0.95). Thus, measure-ment of cerebellum V2 identified reproducible between-subject differences, establishing significant between-subject differences in f1/f2 ratios. The free fraction in thecerebellum (f2), calculated as f1/V2, was 7.8% ± 1.7%.
[11C]Raclopride binding potentialValues of [11C]raclopride BP are listed in Table 4. No
significant differences were observed between test andretest measurements (repeated measures ANOVA withregional [11C]raclopride BP as repeated measure, P >0.05 for all regions). The test–retest variability of[11C]raclopride BP was not statistically different fromthe test–retest variability of [11C]raclopride V3� (re-peated measures ANOVA with outcome measure vari-ability as repeated measure and region as cofactor; re-gion: P � 0.06; outcome measure, P � 0.47; outcome ×region interaction, P � 0.83). The ICCs of [11C]raclo-
pride BP were significantly better than the ICCs of V3�(repeated measures ANOVA, P � 0.04).
[11C]Raclopride Bmax/KD
The [11C]raclopride Bmax/KD ratio was calculated asBP/f1 (Eq. 4). Regional BP/f1 values were 32.7 ± 6.3 mLg−1 for STR, 31.4 ± 7.4 mL g−1 for DCA, 40 ± 8.9 mLg−1 for DPU, 25.0 ± 6.3 mL g−1 for VST, and 5.1 ± 2.0mL g−1 for thalamus. As expected from the low repro-ducibility of the f1 measurement, the test–retest variabil-ity of BP/f1 was high (19.2% ± 51.4% in STR, 16.7% ±48.6% in DCA, 19.4% ± 52.5% in DPU, 25.6% ± 57.1%in VST, 14.5% ± 66.1% in thalamus). All ICCs for BP/f1
were negative (−0.23 for STR, −0.24 for DCA, −0.27 forDPU, −0.05 for VST, −0.01 for thalamus). Similarly, thereproducibility of cerebellar distribution volume relativeto the free parent plasma concentration V2/f1 (13.6 ± 2.5mL g−1) was poor (variability of ± 18.6% ± 27%), withICC of −0.06.
The main interest in calculating BP/f1 (� Bmax/KD)was to compare this value to in vitro measurements of[3H]raclopride binding in human brain. Assuming a KD
for raclopride of 1 nmol/L, the value of BP/f1 in thestriatum (32.7 mL g−1) would indicate a Bmax of 32.7nmol/L, which is in the range of in vitro values (Hall etal., 1988). Accepting this KD value, the average occu-pancy of D2 receptors in these studies was calculated.Free concentration of [11C]raclopride (F, nmol/L), cal-culated as f2AREF(�Ci/mL)/SA(mCi/mmol), was 0.0051± 0.0025 nmol/L. D2 receptor occupancy by [11C]raclo-pride, calculated as 100 × F/(KD + F), was negligible(1.01% ± 0.51%).
Vascular correctionAssuming a blood volume corresponding to 5% of the
regional volume, activity in the vasculature contributedto 15.9% ± 2% of CER activity, 11.6% ± 1.7% of thala-mus activity, 5.6% ± 0.8% of VST activity, 4.8% ± 0.8%of DCA activity, and 4.0% ± 0.5% of DPU activity.Because vasculature activity contributed more to the cer-ebellum signal than to the signal of other regions, re-gional V3� calculated with the vascular-corrected distri-bution volumes were greater (DCA: 2.78 ± 0.40; DPU:3.56 ± 0.38; VST: 2.21 ± 0.39; thalamus: 0.45 ± 0.10)than the uncorrected values (Table 1). The test–retest
TABLE 3. Plasma analysis
Parameter Test Retest Change (%) Variability (%) ICC
Clearance activity (L/h) 9.8 ± 2.0 10.3 ± 2.4 6.2 ± 12.9 8.9 ± 8.8 0.79Parent fraction (%) 73.7 ± 6.4% 70.3 ± 6.4% −4.5 ± 5.9 5.4 ± 5.8 0.65Clearance total parent (L/h) 13.4 ± 3.3 15.0 ± 4.7 11.6 ± 15.1 13.7 ± 9.3 0.77Free fraction (f1, %) 3.6 ± 0.8% 3.3 ± 0.6% −3.8 ± 23.7 18.2 ± 24.5 −0.07
Values are mean ± SD of 10 subjects studied twice. Change (%) is the difference between test and retest values, expressedas a percentage of the average of test and retest. Variability is the absolute value of change. ICC, intraclass correlationcoefficient.
O. MAWLAWI ET AL.1046
J Cereb Blood Flow Metab, Vol. 21, No. 9, 2001
variability of V3� corrected for the vascular contributionwas ± 7.9% ± 5.3% in the DCA, 6.0% ± 4.8% in DPU,8.1% ± 6.4% in VST, 6.3% ± 4.8% in STR, and 20% ±18% in thalamus. Thus, the vascular correction had noimpact on the reproducibility of the measurement (com-pare with Table 1). Binding potential values were unaf-fected by the vascular correction, because (AROI −ACER)/CSS � ((AROI − VC) − (ACER − VC))/CSS, whereVC represents vascular contribution.
Partial volume effect analysisEstimates of final image resolution. Partial volume
effect analysis was performed at three levels of resolu-tion. The first analysis was performed at the system reso-lution level (FWHM at the center of FOV of 4.3 mm,with radial, transverse, and axial resolution varying inspace as described in Materials and Methods). The sec-ond analysis was performed at realistic image resolutionlevel, combining system resolution (4.3 mm), filter reso-lution (2.5 mm), and average length of the brain trans-location vectors imposed by AIR to realign frame i toframe i-1 during the 40- to 90-minute interval (1.32 mm)to yield a FWHM at the center of the FOV of 5.1 mm.The third analysis, corresponding to a “worst casescenario,” combined the system resolution (4.3 mm),filter resolution (2.5 mm), and a motion vector equal to
the average plus 2 SD of the length of the brain translo-cation vectors during the 40- to 90-minute interval (3.31mm) to yield a FWHM at the center of the FOV of6.0 mm.
Geometric transfer matrix. At the highest resolution(FWHM of 4.3 mm), the recovery in the VST was 53%± 5%. At FWHM of 5.1 and 6 mm, recovery in the VSTwas 46% ± 5% and 41% ± 5%, respectively. Activityrecovery was better in the DCA (66% ± 2%, 61% ± 2%,and 56% ± 2% at FWHM of 4.1, 5.2, and 6 mm, respec-tively) and DPU (65% ± 1%, 61% ± 2%, and 56% ± 2%at FWHM of 4.1, 5.2, and 6 mm, respectively). Thethalamus had the best recovery (75% ± 2%, 70% ± 2%,and 66% ± 2% at FWHM of 4.1, 5.2, and 6 mm, respec-tively). Table 5 presents the average values of the GTMsobtained assuming 5.1 mm FWHM (realistic image reso-lution level).
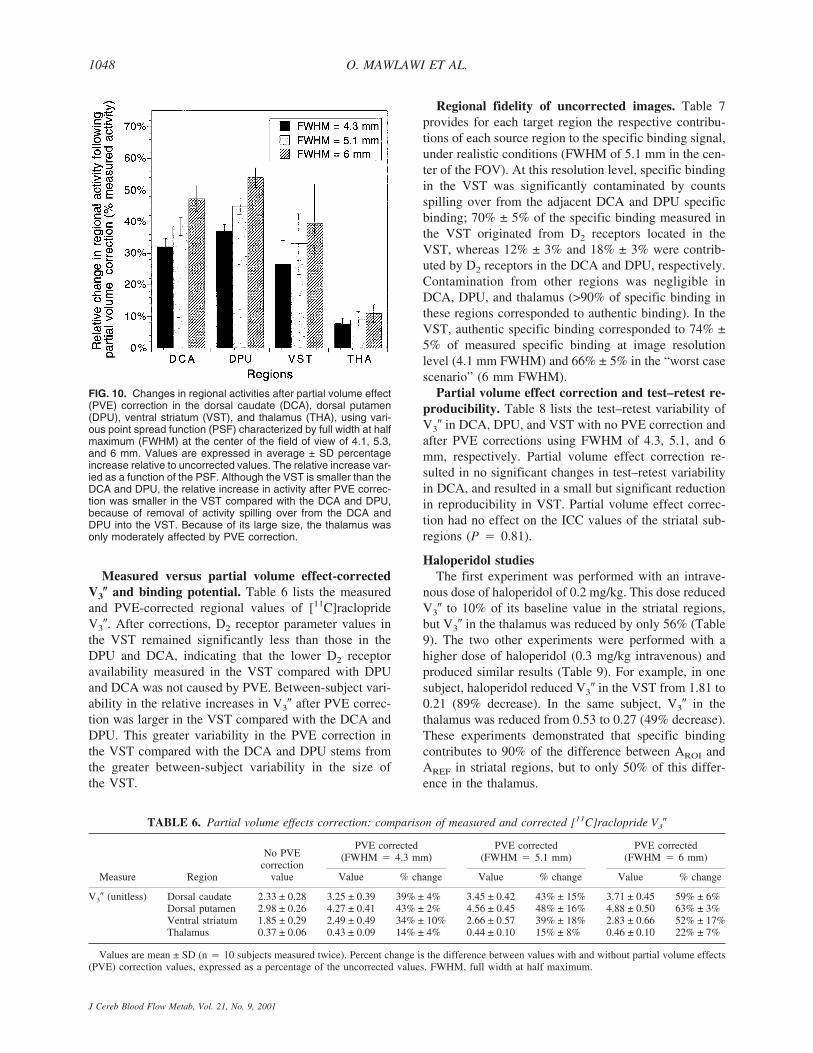
Partial volume effect correction. Figure 10 showsthe effect of PVE correction on regional activities at thethree levels of resolution studied. For the VST, correct-ing for the partial recovery and removing contaminationof the other regions resulted in a net activity gain of 26%± 8%, 33% ± 10%, and 40% ± 12% at FWHM of 4.3,5.1, and 6 mm, respectively. These relative gains weregreater in the DCA and DPU. Partial volume effect cor-rection had little effect on activities in the thalamus.
TABLE 4. [11C]Raclopride BP in striatal subregions: reproducibilityand reliability
RegionTest
(mL g−1)Retest
(mL g−1) Change (%) Variability (%) ICC
Striatal subregionsDorsal caudate 1.04 ± 0.22 1.05 ± 0.21 0.9 ± 6.7 5.6 ± 3.4 0.95Dorsal putamen 1.32 ± 0.28 1.35 ± 0.25 2.8 ± 6.1 5.1 ± 4.0 0.95Ventral striatum 0.80 ± 0.21 0.87 ± 0.21 7.7 ± 9.3 10.6 ± 5.2 0.89
Whole striatum 1.15 ± 0.25 1.18 ± 0.23 2.8 ± 5.9 5.2 ± 3.7 0.95Thalamus 0.17 ± 0.04 0.17 ± 0.05 −6.5 ± 26.5 18.5 ± 19.2 0.70
Values are mean ± SD BP (mL g−1) of 10 subjects studied twice. Change (%) is thedifference between test and retest values, expressed as a percentage of the average of test andretest. Variability is the absolute value of change. BP, binding potential; ICC, intraclasscorrelation coefficient.
TABLE 5. Partial volume effects correction: geometric transfer matrix
RegionDCA(left)
DCA(right)
DPU(left)
DPU(right)
VST(left)
VST(right)
THA(left)
THA(right) Background
DCA (left) 60.6 ± 1.9 0.0 ± 0.0 1.1 ± 0.4 0.0 ± 0.0 2.5 ± 0.6 0.0 ± 0.0 0.0 ± 0.0 0.0 ± 0.0 35.9 ± 1.7DCA (right) 0.0 ± 0.0 61.1 ± 2.3 0.0 ± 0.0 0.8 ± 0.3 0.0 ± 0.0 2.5 ± 0.9 0.0 ± 0.0 0.0 ± 0.0 36.1 ± 2.2DPU (left) 0.6 ± 0.2 0.0 ± 0.0 61.2 ± 1.1 0.0 ± 0.0 1.8 ± 0.5 0.0 ± 0.0 0.0 ± 0.0 0.0 ± 0.0 36.4 ± 1.6DPU (right) 0.0 ± 0.0 0.6 ± 0.2 0.0 ± 0.0 60.0 ± 1.4 0.0 ± 0.0 2.2 ± 0.9 0.0 ± 0.0 0.0 ± 0.0 37.5 ± 1.6VST (left) 5.4 ± 1.6 0.0 ± 0.0 6.5 ± 1.2 0.0 ± 0.0 47.6 ± 4.0 0.0 ± 0.0 0.0 ± 0.1 0.0 ± 0.0 40.6 ± 3.4VST (right) 0.0 ± 0.0 5.9 ± 1.4 0.0 ± 0.0 7.4 ± 1.3 0.0 ± 0.0 45.4 ± 5.5 0.0 ± 0.0 0.0 ± 0.1 42.3 ± 5.1THA (left) 0.0 ± 0.0 0.0 ± 0.0 0.0 ± 0.0 0.0 ± 0.0 0.0 ± 0.1 0.0 ± 0.0 70.5 ± 2.1 1.6 ± 0.6 28.3 ± 2.4THA (right) 0.0 ± 0.0 0.0 ± 0.0 0.0 ± 0.0 0.0 ± 0.0 0.0 ± 0.0 0.0 ± 0.0 1.7 ± 0.7 70.1 ± 1.3 28.7 ± 2.3Background 0.1 ± 0.0 0.1 ± 0.0 0.1 ± 0.0 0.1 ± 0.0 0.0 ± 0.0 0.0 ± 0.0 0.1 ± 0.0 0.1 ± 0.0 93.7 ± 0.5
Values are means ± SD (n � 20) the contribution of true activity in each source region (columns) to the activity measured in each region (rows),expressed as a percentage of the true activity of the source region. Values are average of 20 geometric transfer matrixes obtained assuming full widthat half maximum of 5.1 mm at the center of the field of view (realistic conditions). The diagonal values represent the percentage of true activity inthe region that is present in the region itself (activity recovery). DCA, dorsal caudate; DPU, dorsal putamen; VST, ventral striatum; THA, thalamus.
QUANTIFICATION OF VENTROSTRIATAL D2 RECEPTORS WITH PET 1047
J Cereb Blood Flow Metab, Vol. 21, No. 9, 2001
Measured versus partial volume effect-correctedV3� and binding potential. Table 6 lists the measuredand PVE-corrected regional values of [11C]racloprideV3�. After corrections, D2 receptor parameter values inthe VST remained significantly less than those in theDPU and DCA, indicating that the lower D2 receptoravailability measured in the VST compared with DPUand DCA was not caused by PVE. Between-subject vari-ability in the relative increases in V3� after PVE correc-tion was larger in the VST compared with the DCA andDPU. This greater variability in the PVE correction inthe VST compared with the DCA and DPU stems fromthe greater between-subject variability in the size ofthe VST.
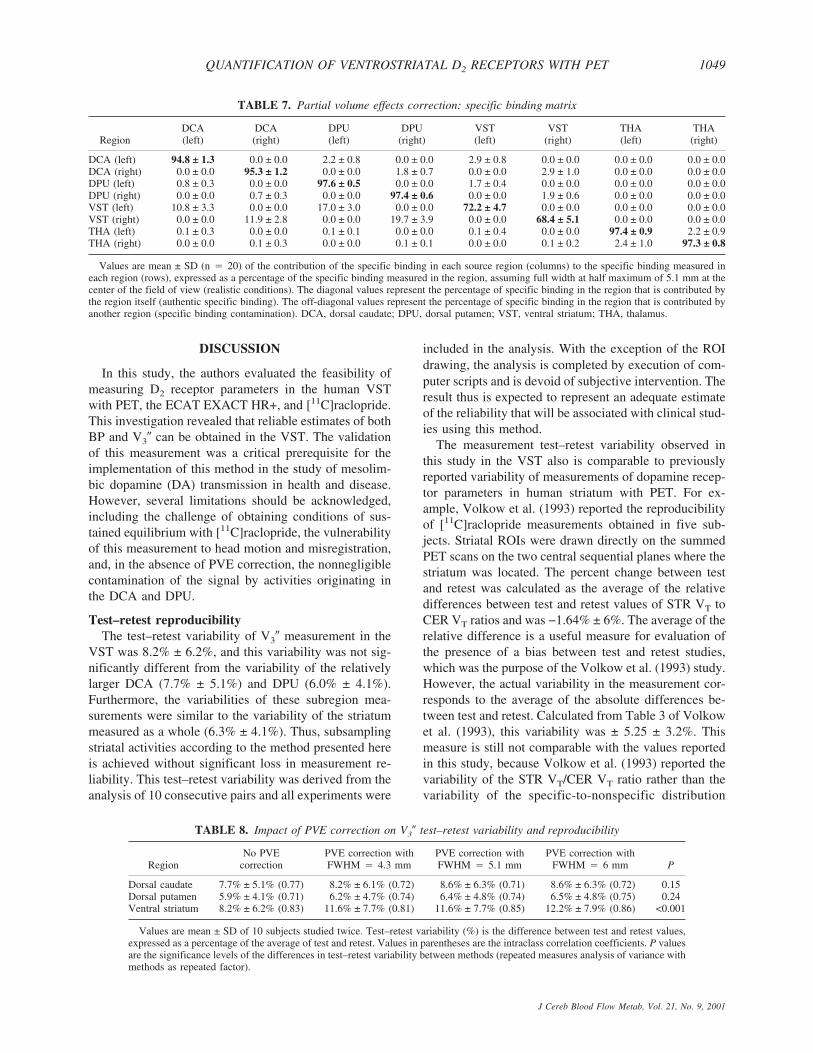
Regional fidelity of uncorrected images. Table 7provides for each target region the respective contribu-tions of each source region to the specific binding signal,under realistic conditions (FWHM of 5.1 mm in the cen-ter of the FOV). At this resolution level, specific bindingin the VST was significantly contaminated by countsspilling over from the adjacent DCA and DPU specificbinding; 70% ± 5% of the specific binding measured inthe VST originated from D2 receptors located in theVST, whereas 12% ± 3% and 18% ± 3% were contrib-uted by D2 receptors in the DCA and DPU, respectively.Contamination from other regions was negligible inDCA, DPU, and thalamus (>90% of specific binding inthese regions corresponded to authentic binding). In theVST, authentic specific binding corresponded to 74% ±5% of measured specific binding at image resolutionlevel (4.1 mm FWHM) and 66% ± 5% in the “worst casescenario” (6 mm FWHM).
Partial volume effect correction and test–retest re-producibility. Table 8 lists the test–retest variability ofV3� in DCA, DPU, and VST with no PVE correction andafter PVE corrections using FWHM of 4.3, 5.1, and 6mm, respectively. Partial volume effect correction re-sulted in no significant changes in test–retest variabilityin DCA, and resulted in a small but significant reductionin reproducibility in VST. Partial volume effect correc-tion had no effect on the ICC values of the striatal sub-regions (P � 0.81).
Haloperidol studiesThe first experiment was performed with an intrave-
nous dose of haloperidol of 0.2 mg/kg. This dose reducedV3� to 10% of its baseline value in the striatal regions,but V3� in the thalamus was reduced by only 56% (Table9). The two other experiments were performed with ahigher dose of haloperidol (0.3 mg/kg intravenous) andproduced similar results (Table 9). For example, in onesubject, haloperidol reduced V3� in the VST from 1.81 to0.21 (89% decrease). In the same subject, V3� in thethalamus was reduced from 0.53 to 0.27 (49% decrease).These experiments demonstrated that specific bindingcontributes to 90% of the difference between AROI andAREF in striatal regions, but to only 50% of this differ-ence in the thalamus.
FIG. 10. Changes in regional activities after partial volume effect(PVE) correction in the dorsal caudate (DCA), dorsal putamen(DPU), ventral striatum (VST), and thalamus (THA), using vari-ous point spread function (PSF) characterized by full width at halfmaximum (FWHM) at the center of the field of view of 4.1, 5.3,and 6 mm. Values are expressed in average ± SD percentageincrease relative to uncorrected values. The relative increase var-ied as a function of the PSF. Although the VST is smaller than theDCA and DPU, the relative increase in activity after PVE correc-tion was smaller in the VST compared with the DCA and DPU,because of removal of activity spilling over from the DCA andDPU into the VST. Because of its large size, the thalamus wasonly moderately affected by PVE correction.
TABLE 6. Partial volume effects correction: comparison of measured and corrected [11C]raclopride V3�
Measure Region
No PVEcorrection
value
PVE corrected(FWHM � 4.3 mm)
PVE corrected(FWHM � 5.1 mm)
PVE corrected(FWHM � 6 mm)
Value % change Value % change Value % change
V3� (unitless) Dorsal caudate 2.33 ± 0.28 3.25 ± 0.39 39% ± 4% 3.45 ± 0.42 43% ± 15% 3.71 ± 0.45 59% ± 6%Dorsal putamen 2.98 ± 0.26 4.27 ± 0.41 43% ± 2% 4.56 ± 0.45 48% ± 16% 4.88 ± 0.50 63% ± 3%Ventral striatum 1.85 ± 0.29 2.49 ± 0.49 34% ± 10% 2.66 ± 0.57 39% ± 18% 2.83 ± 0.66 52% ± 17%Thalamus 0.37 ± 0.06 0.43 ± 0.09 14% ± 4% 0.44 ± 0.10 15% ± 8% 0.46 ± 0.10 22% ± 7%
Values are mean ± SD (n � 10 subjects measured twice). Percent change is the difference between values with and without partial volume effects(PVE) correction values, expressed as a percentage of the uncorrected values. FWHM, full width at half maximum.
O. MAWLAWI ET AL.1048
J Cereb Blood Flow Metab, Vol. 21, No. 9, 2001
DISCUSSION
In this study, the authors evaluated the feasibility ofmeasuring D2 receptor parameters in the human VSTwith PET, the ECAT EXACT HR+, and [11C]raclopride.This investigation revealed that reliable estimates of bothBP and V3� can be obtained in the VST. The validationof this measurement was a critical prerequisite for theimplementation of this method in the study of mesolim-bic dopamine (DA) transmission in health and disease.However, several limitations should be acknowledged,including the challenge of obtaining conditions of sus-tained equilibrium with [11C]raclopride, the vulnerabilityof this measurement to head motion and misregistration,and, in the absence of PVE correction, the nonnegligiblecontamination of the signal by activities originating inthe DCA and DPU.
Test–retest reproducibilityThe test–retest variability of V3� measurement in the
VST was 8.2% ± 6.2%, and this variability was not sig-nificantly different from the variability of the relativelylarger DCA (7.7% ± 5.1%) and DPU (6.0% ± 4.1%).Furthermore, the variabilities of these subregion mea-surements were similar to the variability of the striatummeasured as a whole (6.3% ± 4.1%). Thus, subsamplingstriatal activities according to the method presented hereis achieved without significant loss in measurement re-liability. This test–retest variability was derived from theanalysis of 10 consecutive pairs and all experiments were
included in the analysis. With the exception of the ROIdrawing, the analysis is completed by execution of com-puter scripts and is devoid of subjective intervention. Theresult thus is expected to represent an adequate estimateof the reliability that will be associated with clinical stud-ies using this method.
The measurement test–retest variability observed inthis study in the VST also is comparable to previouslyreported variability of measurements of dopamine recep-tor parameters in human striatum with PET. For ex-ample, Volkow et al. (1993) reported the reproducibilityof [11C]raclopride measurements obtained in five sub-jects. Striatal ROIs were drawn directly on the summedPET scans on the two central sequential planes where thestriatum was located. The percent change between testand retest was calculated as the average of the relativedifferences between test and retest values of STR VT toCER VT ratios and was −1.64% ± 6%. The average of therelative difference is a useful measure for evaluation ofthe presence of a bias between test and retest studies,which was the purpose of the Volkow et al. (1993) study.However, the actual variability in the measurement cor-responds to the average of the absolute differences be-tween test and retest. Calculated from Table 3 of Volkowet al. (1993), this variability was ± 5.25 ± 3.2%. Thismeasure is still not comparable with the values reportedin this study, because Volkow et al. (1993) reported thevariability of the STR VT/CER VT ratio rather than thevariability of the specific-to-nonspecific distribution
TABLE 8. Impact of PVE correction on V3� test–retest variability and reproducibility
RegionNo PVE
correctionPVE correction withFWHM � 4.3 mm
PVE correction withFWHM � 5.1 mm
PVE correction withFWHM � 6 mm P
Dorsal caudate 7.7% ± 5.1% (0.77) 8.2% ± 6.1% (0.72) 8.6% ± 6.3% (0.71) 8.6% ± 6.3% (0.72) 0.15Dorsal putamen 5.9% ± 4.1% (0.71) 6.2% ± 4.7% (0.74) 6.4% ± 4.8% (0.74) 6.5% ± 4.8% (0.75) 0.24Ventral striatum 8.2% ± 6.2% (0.83) 11.6% ± 7.7% (0.81) 11.6% ± 7.7% (0.85) 12.2% ± 7.9% (0.86) <0.001
Values are mean ± SD of 10 subjects studied twice. Test–retest variability (%) is the difference between test and retest values,expressed as a percentage of the average of test and retest. Values in parentheses are the intraclass correlation coefficients. P valuesare the significance levels of the differences in test–retest variability between methods (repeated measures analysis of variance withmethods as repeated factor).
TABLE 7. Partial volume effects correction: specific binding matrix
RegionDCA(left)
DCA(right)
DPU(left)
DPU(right)
VST(left)
VST(right)
THA(left)
THA(right)
DCA (left) 94.8 ± 1.3 0.0 ± 0.0 2.2 ± 0.8 0.0 ± 0.0 2.9 ± 0.8 0.0 ± 0.0 0.0 ± 0.0 0.0 ± 0.0DCA (right) 0.0 ± 0.0 95.3 ± 1.2 0.0 ± 0.0 1.8 ± 0.7 0.0 ± 0.0 2.9 ± 1.0 0.0 ± 0.0 0.0 ± 0.0DPU (left) 0.8 ± 0.3 0.0 ± 0.0 97.6 ± 0.5 0.0 ± 0.0 1.7 ± 0.4 0.0 ± 0.0 0.0 ± 0.0 0.0 ± 0.0DPU (right) 0.0 ± 0.0 0.7 ± 0.3 0.0 ± 0.0 97.4 ± 0.6 0.0 ± 0.0 1.9 ± 0.6 0.0 ± 0.0 0.0 ± 0.0VST (left) 10.8 ± 3.3 0.0 ± 0.0 17.0 ± 3.0 0.0 ± 0.0 72.2 ± 4.7 0.0 ± 0.0 0.0 ± 0.0 0.0 ± 0.0VST (right) 0.0 ± 0.0 11.9 ± 2.8 0.0 ± 0.0 19.7 ± 3.9 0.0 ± 0.0 68.4 ± 5.1 0.0 ± 0.0 0.0 ± 0.0THA (left) 0.1 ± 0.3 0.0 ± 0.0 0.1 ± 0.1 0.0 ± 0.0 0.1 ± 0.4 0.0 ± 0.0 97.4 ± 0.9 2.2 ± 0.9THA (right) 0.0 ± 0.0 0.1 ± 0.3 0.0 ± 0.0 0.1 ± 0.1 0.0 ± 0.0 0.1 ± 0.2 2.4 ± 1.0 97.3 ± 0.8
Values are mean ± SD (n � 20) of the contribution of the specific binding in each source region (columns) to the specific binding measured ineach region (rows), expressed as a percentage of the specific binding measured in the region, assuming full width at half maximum of 5.1 mm at thecenter of the field of view (realistic conditions). The diagonal values represent the percentage of specific binding in the region that is contributed bythe region itself (authentic specific binding). The off-diagonal values represent the percentage of specific binding in the region that is contributed byanother region (specific binding contamination). DCA, dorsal caudate; DPU, dorsal putamen; VST, ventral striatum; THA, thalamus.
QUANTIFICATION OF VENTROSTRIATAL D2 RECEPTORS WITH PET 1049
J Cereb Blood Flow Metab, Vol. 21, No. 9, 2001
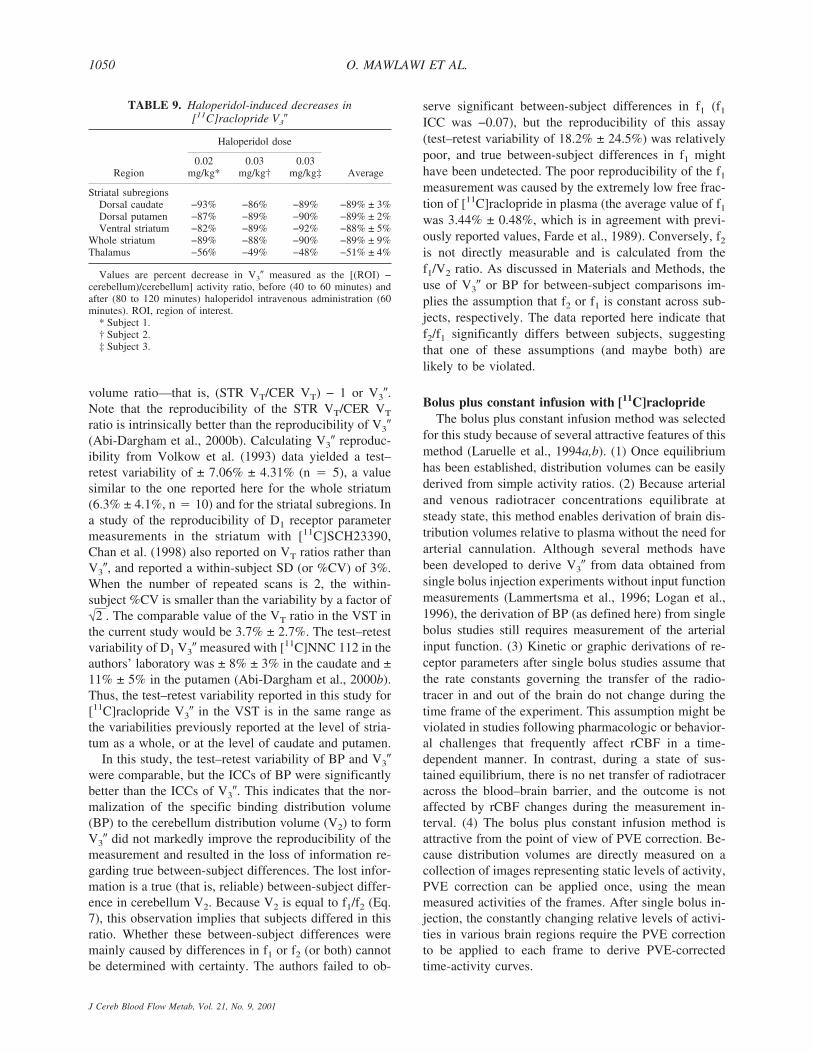
volume ratio—that is, (STR VT/CER VT) − 1 or V3�.Note that the reproducibility of the STR VT/CER VT
ratio is intrinsically better than the reproducibility of V3�(Abi-Dargham et al., 2000b). Calculating V3� reproduc-ibility from Volkow et al. (1993) data yielded a test–retest variability of ± 7.06% ± 4.31% (n � 5), a valuesimilar to the one reported here for the whole striatum(6.3% ± 4.1%, n � 10) and for the striatal subregions. Ina study of the reproducibility of D1 receptor parametermeasurements in the striatum with [11C]SCH23390,Chan et al. (1998) also reported on VT ratios rather thanV3�, and reported a within-subject SD (or %CV) of 3%.When the number of repeated scans is 2, the within-subject %CV is smaller than the variability by a factor of√
2 . The comparable value of the VT ratio in the VST in
the current study would be 3.7% ± 2.7%. The test–retestvariability of D1 V3� measured with [11C]NNC 112 in theauthors’ laboratory was ± 8% ± 3% in the caudate and ±11% ± 5% in the putamen (Abi-Dargham et al., 2000b).Thus, the test–retest variability reported in this study for[11C]raclopride V3� in the VST is in the same range asthe variabilities previously reported at the level of stria-tum as a whole, or at the level of caudate and putamen.
In this study, the test–retest variability of BP and V3�were comparable, but the ICCs of BP were significantlybetter than the ICCs of V3�. This indicates that the nor-malization of the specific binding distribution volume(BP) to the cerebellum distribution volume (V2) to formV3� did not markedly improve the reproducibility of themeasurement and resulted in the loss of information re-garding true between-subject differences. The lost infor-mation is a true (that is, reliable) between-subject differ-ence in cerebellum V2. Because V2 is equal to f1/f2 (Eq.7), this observation implies that subjects differed in thisratio. Whether these between-subject differences weremainly caused by differences in f1 or f2 (or both) cannotbe determined with certainty. The authors failed to ob-
serve significant between-subject differences in f1 (f1
ICC was −0.07), but the reproducibility of this assay(test–retest variability of 18.2% ± 24.5%) was relativelypoor, and true between-subject differences in f1 mighthave been undetected. The poor reproducibility of the f1
measurement was caused by the extremely low free frac-tion of [11C]raclopride in plasma (the average value of f1
was 3.44% ± 0.48%, which is in agreement with previ-ously reported values, Farde et al., 1989). Conversely, f2
is not directly measurable and is calculated from thef1/V2 ratio. As discussed in Materials and Methods, theuse of V3� or BP for between-subject comparisons im-plies the assumption that f2 or f1 is constant across sub-jects, respectively. The data reported here indicate thatf2/f1 significantly differs between subjects, suggestingthat one of these assumptions (and maybe both) arelikely to be violated.
Bolus plus constant infusion with [11C]racloprideThe bolus plus constant infusion method was selected
for this study because of several attractive features of thismethod (Laruelle et al., 1994a,b). (1) Once equilibriumhas been established, distribution volumes can be easilyderived from simple activity ratios. (2) Because arterialand venous radiotracer concentrations equilibrate atsteady state, this method enables derivation of brain dis-tribution volumes relative to plasma without the need forarterial cannulation. Although several methods havebeen developed to derive V3� from data obtained fromsingle bolus injection experiments without input functionmeasurements (Lammertsma et al., 1996; Logan et al.,1996), the derivation of BP (as defined here) from singlebolus studies still requires measurement of the arterialinput function. (3) Kinetic or graphic derivations of re-ceptor parameters after single bolus studies assume thatthe rate constants governing the transfer of the radio-tracer in and out of the brain do not change during thetime frame of the experiment. This assumption might beviolated in studies following pharmacologic or behavior-al challenges that frequently affect rCBF in a time-dependent manner. In contrast, during a state of sus-tained equilibrium, there is no net transfer of radiotraceracross the blood–brain barrier, and the outcome is notaffected by rCBF changes during the measurement in-terval. (4) The bolus plus constant infusion method isattractive from the point of view of PVE correction. Be-cause distribution volumes are directly measured on acollection of images representing static levels of activity,PVE correction can be applied once, using the meanmeasured activities of the frames. After single bolus in-jection, the constantly changing relative levels of activi-ties in various brain regions require the PVE correctionto be applied to each frame to derive PVE-correctedtime-activity curves.
TABLE 9. Haloperidol-induced decreases in[11C]raclopride V3�
Region
Haloperidol dose
Average0.02
mg/kg*0.03
mg/kg†0.03
mg/kg‡
Striatal subregionsDorsal caudate −93% −86% −89% −89% ± 3%Dorsal putamen −87% −89% −90% −89% ± 2%Ventral striatum −82% −89% −92% −88% ± 5%
Whole striatum −89% −88% −90% −89% ± 9%Thalamus −56% −49% −48% −51% ± 4%
Values are percent decrease in V3� measured as the [(ROI) −cerebellum)/cerebellum] activity ratio, before (40 to 60 minutes) andafter (80 to 120 minutes) haloperidol intravenous administration (60minutes). ROI, region of interest.
* Subject 1.† Subject 2.‡ Subject 3.
O. MAWLAWI ET AL.1050
J Cereb Blood Flow Metab, Vol. 21, No. 9, 2001
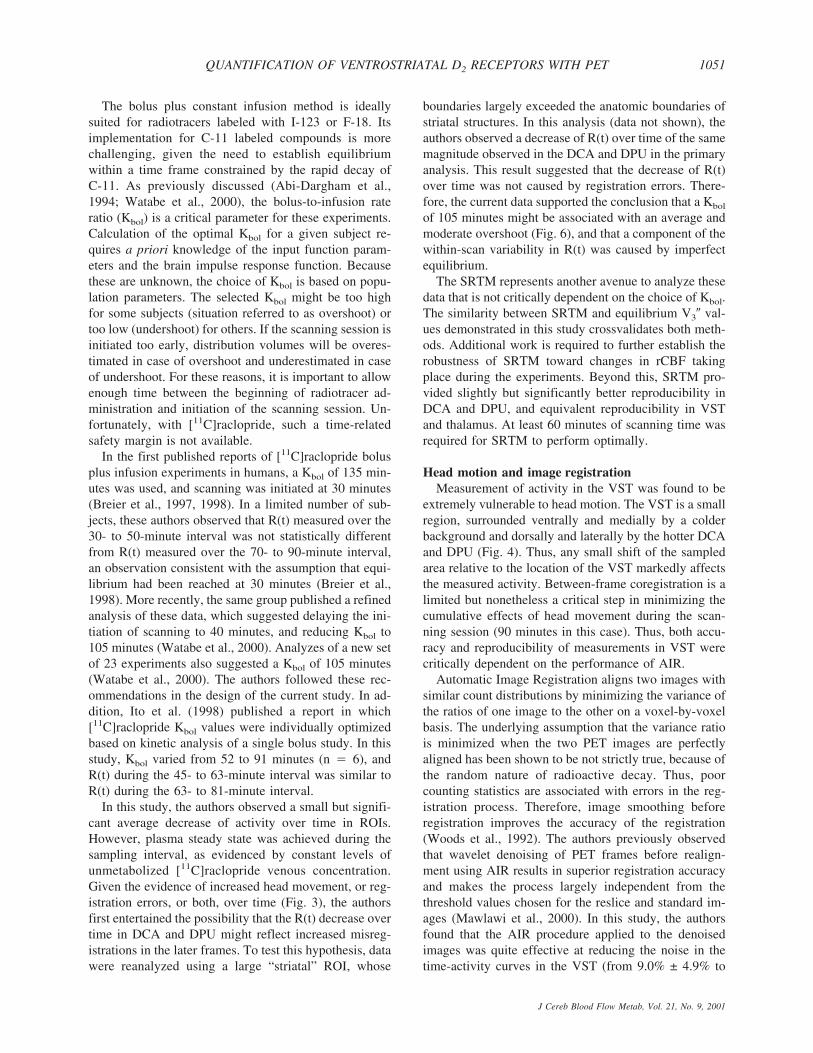
The bolus plus constant infusion method is ideallysuited for radiotracers labeled with I-123 or F-18. Itsimplementation for C-11 labeled compounds is morechallenging, given the need to establish equilibriumwithin a time frame constrained by the rapid decay ofC-11. As previously discussed (Abi-Dargham et al.,1994; Watabe et al., 2000), the bolus-to-infusion rateratio (Kbol) is a critical parameter for these experiments.Calculation of the optimal Kbol for a given subject re-quires a priori knowledge of the input function param-eters and the brain impulse response function. Becausethese are unknown, the choice of Kbol is based on popu-lation parameters. The selected Kbol might be too highfor some subjects (situation referred to as overshoot) ortoo low (undershoot) for others. If the scanning session isinitiated too early, distribution volumes will be overes-timated in case of overshoot and underestimated in caseof undershoot. For these reasons, it is important to allowenough time between the beginning of radiotracer ad-ministration and initiation of the scanning session. Un-fortunately, with [11C]raclopride, such a time-relatedsafety margin is not available.
In the first published reports of [11C]raclopride bolusplus infusion experiments in humans, a Kbol of 135 min-utes was used, and scanning was initiated at 30 minutes(Breier et al., 1997, 1998). In a limited number of sub-jects, these authors observed that R(t) measured over the30- to 50-minute interval was not statistically differentfrom R(t) measured over the 70- to 90-minute interval,an observation consistent with the assumption that equi-librium had been reached at 30 minutes (Breier et al.,1998). More recently, the same group published a refinedanalysis of these data, which suggested delaying the ini-tiation of scanning to 40 minutes, and reducing Kbol to105 minutes (Watabe et al., 2000). Analyzes of a new setof 23 experiments also suggested a Kbol of 105 minutes(Watabe et al., 2000). The authors followed these rec-ommendations in the design of the current study. In ad-dition, Ito et al. (1998) published a report in which[11C]raclopride Kbol values were individually optimizedbased on kinetic analysis of a single bolus study. In thisstudy, Kbol varied from 52 to 91 minutes (n � 6), andR(t) during the 45- to 63-minute interval was similar toR(t) during the 63- to 81-minute interval.
In this study, the authors observed a small but signifi-cant average decrease of activity over time in ROIs.However, plasma steady state was achieved during thesampling interval, as evidenced by constant levels ofunmetabolized [11C]raclopride venous concentration.Given the evidence of increased head movement, or reg-istration errors, or both, over time (Fig. 3), the authorsfirst entertained the possibility that the R(t) decrease overtime in DCA and DPU might reflect increased misreg-istrations in the later frames. To test this hypothesis, datawere reanalyzed using a large “striatal” ROI, whose
boundaries largely exceeded the anatomic boundaries ofstriatal structures. In this analysis (data not shown), theauthors observed a decrease of R(t) over time of the samemagnitude observed in the DCA and DPU in the primaryanalysis. This result suggested that the decrease of R(t)over time was not caused by registration errors. There-fore, the current data supported the conclusion that a Kbol
of 105 minutes might be associated with an average andmoderate overshoot (Fig. 6), and that a component of thewithin-scan variability in R(t) was caused by imperfectequilibrium.
The SRTM represents another avenue to analyze thesedata that is not critically dependent on the choice of Kbol.The similarity between SRTM and equilibrium V3� val-ues demonstrated in this study crossvalidates both meth-ods. Additional work is required to further establish therobustness of SRTM toward changes in rCBF takingplace during the experiments. Beyond this, SRTM pro-vided slightly but significantly better reproducibility inDCA and DPU, and equivalent reproducibility in VSTand thalamus. At least 60 minutes of scanning time wasrequired for SRTM to perform optimally.
Head motion and image registrationMeasurement of activity in the VST was found to be
extremely vulnerable to head motion. The VST is a smallregion, surrounded ventrally and medially by a colderbackground and dorsally and laterally by the hotter DCAand DPU (Fig. 4). Thus, any small shift of the sampledarea relative to the location of the VST markedly affectsthe measured activity. Between-frame coregistration is alimited but nonetheless a critical step in minimizing thecumulative effects of head movement during the scan-ning session (90 minutes in this case). Thus, both accu-racy and reproducibility of measurements in VST werecritically dependent on the performance of AIR.
Automatic Image Registration aligns two images withsimilar count distributions by minimizing the variance ofthe ratios of one image to the other on a voxel-by-voxelbasis. The underlying assumption that the variance ratiois minimized when the two PET images are perfectlyaligned has been shown to be not strictly true, because ofthe random nature of radioactive decay. Thus, poorcounting statistics are associated with errors in the reg-istration process. Therefore, image smoothing beforeregistration improves the accuracy of the registration(Woods et al., 1992). The authors previously observedthat wavelet denoising of PET frames before realign-ment using AIR results in superior registration accuracyand makes the process largely independent from thethreshold values chosen for the reslice and standard im-ages (Mawlawi et al., 2000). In this study, the authorsfound that the AIR procedure applied to the denoisedimages was quite effective at reducing the noise in thetime-activity curves in the VST (from 9.0% ± 4.9% to
QUANTIFICATION OF VENTROSTRIATAL D2 RECEPTORS WITH PET 1051
J Cereb Blood Flow Metab, Vol. 21, No. 9, 2001

6.4% ± 3.1%), improving test–retest variability in theVST (from 21.3% ± 16.9% to 8.2% ± 6.2%), and in-creasing the ICC in the VST (from −0.57 to 0.83). Theauthors also observed that AIR applied to denoised im-ages provided superior reproducibility compared withAIR applied to original images (data not shown, see Mar-tinez et al., 2000). Misregistration artifacts could possi-bly be further reduced by visual inspection of the scansand manual shift of the ROI boundaries. However, be-cause this process involves subjective judgements, thisoption was a priori deemed unacceptable.
This analysis also revealed that the average braintranslocation imposed by the realignment process wassmall (1.32 ± 0.36 mm per frame). The small head mo-tion (1 to 2 mm) measured with this method was inagreement with head motion measured with an externaltracking system (Green et al., 1994) in volunteers whoseheads were embedded in the same head immobilizationsystem (polyurethane head immobilizer) used in thisstudy (unpublished data). The authors observed signifi-cant between-subject differences in translocation vectorlengths, confirming the empirical observation that somesubjects move more than others.
The length of the translocation vector also signifi-cantly increased during the scan. The authors’ initial in-terpretation of this observation was that it reflected thefact that subjects become increasingly restless as the du-ration of the experiment increases. However, the poorercounting statistics of the later frames might introducemore error or randomness in the realignment process,despite the denoising step. To explore this hypothesisfurther, the authors performed AIR realignment of de-noised [11C]raclopride frames obtained in baboons underanesthesia (n � 3 experiments). Because it is reasonableto assume that the baboon’s head does not move, theexpectation was that the translocation vector would bezero. In fact, the authors observed nonzero values of thetranslocation vector, as well as an increase of the trans-location vector over time, from 0.54 ± 0.08 mm in the20- to 30-minute frame to 1.43 ± 0.21 in the 60- to70-minute frame. This observation confirmed the origi-nal observation of Woods et al. (1992) on phantom data,that within PET coregistration is associated with a sig-nal-to-noise dependent error. The fact that AIR is asso-ciated with error is also suggested by the observation thatin two subjects, with almost perfect reproducibility ofVST in the absence of any frame-to-frame registration,the AIR procedure actually resulted in a small increasein test–retest variability (Fig. 7). Additional work is re-quired to characterize the relation between NEC and themagnitude of this error, to introduce a threshold of thetranslocation vector below which the registration isomitted. Another strategy to explore would be to varythe level of smoothing as the NEC rate decreases withscan duration.
Protocol optimizationThe poorer counting statistics and apparent increases
in head motion observed in later frames suggested thatthese frames might introduce as much noise as valuableinformation to the measurement. Indeed, evaluation oftest–retest reproducibility over different scan durationsrevealed that the last two frames could be deleted with-out any loss of reproducibility (Fig. 8, upper row), sug-gesting that a Tend of 80 minutes would be appropriate.In addition, a decrease in the scanning time, and there-fore in the duration of [11C]raclopride infusion, will in-crease the fraction of activity available at the beginningof the experiment that will be injected into the subjects(less of the activity will decay while in the infusionpump). Thus, more NEC would be recorded per unittime. Computations of the total NEC collected during thescan in relation to scan and infusion duration for a fixedactivity dose, with a Kbol of 105 minutes and a Tstart of 40minutes, revealed that 101 minutes was the optimal scanduration, beyond which the total NEC recorded duringthe scan starts to decrease (see Appendix). Thus, scan-ning and infusing for 90 minutes still records more NECthan scanning and infusing for 80 minutes. Nonetheless,this analysis does not take into account the increase inhead motion over time and the increasing difficulties incoregistration associated with poor counting statistics.These factors are responsible for the observation that,while infusing for 90 minutes, scanning for 80 minutes isas good as scanning for 90 minutes. Therefore, scanningfor 80 minutes while infusing for 80 minutes shouldtranslate into a net gain in measurement quality.
The question of Tstart is more complicated to assess.Tstart of 40 minutes might be associated with a populationaverage bias toward slight overestimation of V3� (givena Kbol of 105 minutes), but analysis of the effect of Tstart
on the test–retest reproducibility revealed that only thefirst scan could be deleted without penalty. Thus, a Tstart
of 45 minutes might reduce the bias associated with lackof equilibrium, but the gain associated with this modifi-cation is not as evident as the gain associated with de-leting the last 2 frames.
In this study, data were acquired continuously for theentire 90 minutes. In the clinical implementation of thisprotocol, it would not be required to start scanning before40 minutes. The reduced scanning time (40 to 80 minutesinstead to 0 to 90 minutes) should reduce the head mo-tion associated with prolonged scanning sessions. Thus,the combination of a shorter scanning time (40 to 80minutes) with increased NEC might translate into furtherimprovement in reliability of outcome measures.
Partial volume effect correctionPostreconstruction PVE correction methods are based
on the linear property of the PSF as an operator acting on
O. MAWLAWI ET AL.1052
J Cereb Blood Flow Metab, Vol. 21, No. 9, 2001
the image space. This property leads to great simplifica-tion of the modeling of PVE, because each homogenoussource of activity can be treated as a separate image.Based on this property, published methods essentiallydiffer on the number and nature of “regions” that can betreated as homogenous from the point of view of activity.At one extreme, regions can be defined in terms of tissueclasses (gray, white, CSF) (Meltzer et al., 1990, 1999;Muller-Gartner et al., 1992; Labbe et al., 1996). At theother extreme, each pixel could be considered as a re-gion, although this method would be impractical andassociated with large propagation of error. Between thetwo, the assumption of homogenous activities withinanatomically defined ROIs offers an appropriate com-promise, in terms of plausibility, flexibility, and feasibil-ity (Labbe et al., 1998; Rousset et al., 1998). In thisstudy, a modified version of the method developed byRousset et al. was used (1998), with the main differencebeing in the model formation of the PSF in image space.The authors previously validated their implementation ofthis method in the scanner used in these studies (Slifsteinet al., 2000).
The accuracy of PVE correction is highly dependenton several factors, including appropriate model forma-tion of the PSF, proper identification of the ROIs, andcorrect PET to MRI coregistration. Another importantfactor in human studies is head motion during frameacquisition, which can be modeled as an additionalblurring over and above the intrinsic blurring of thesystem and of the image reconstruction process. Becauseno external monitoring system was available in thisstudy, estimates of head motion were derived from thebrain translocation imposed by AIR on between-framerealignment. Therefore, the use of a 5.1-mm FWHMat the center of the FOV is based on a reasonable esti-mator of the effective final resolution, whereas the PVEcorrection using a 6 mm FWHM should be viewed as anupper limit.
Partial volume effect resulted in significant increasesin activity in all striatal subregions. The magnitude ofthis increase (40% to 60%) was consistent with correc-tions applied to human basal ganglia phantoms (Roussetet al., 1998) and with previously published PVE correc-tions of striatal [18F]DOPA concentrations (Rousset etal., 2000). Interestingly, despite the smaller size of theVST compared with the DPU and DCA, the net relativeincrease in VST resulting from PVE correction wassmaller than in the DCA and DPU (Fig. 10). The reasonfor this apparent paradox is that the VST is more con-taminated by the other two regions, because of regionaldifferences in size and true activities.
Enhanced quantification accuracy after PVE correc-tion results from improved recovery and decontamina-tion. Although all three ROIs (DCA, DPU, and VST)were affected by incomplete recovery, only the VST was
significantly affected by contamination. To correct forrecovery per se is important for between-subject com-parisons, provided that differences in regional volumesof interest are large enough to justify the propagation oferror associated with PVE correction. Partial volume ef-fect correction might not be required for within-subjectexperimental design, to the extent that the conditionsunder study (such as changes in receptor availability) donot affect the volumes of interest and that contaminationis not an issue. For example, the authors previously dem-onstrated both experimentally and theoretically that theestimation of the occupancy of 5-HT1A receptors by pin-dolol in the dorsal raphe nuclei as measured with PETand [11C]WAY 100635 is unbiased by the large PVEaffecting this region, essentially because this structure islocated in the middle of a large region devoid of specificbinding and is not contaminated by specific binding fromother regions (Martinez et al., 2001).
The PVE correction analysis reported here demon-strates that this condition is not fulfilled for the [11C]ra-clopride signal in the VST. During realistic conditions(FWHM � 5.1 mm), only 70% ± 5% of the specificbinding measured in the VST originates from D2 recep-tors located in the VST, whereas 12% ± 3% and 18% ±3% are contributed by D2 receptors in the DCA andDPU, respectively. During less favorable conditions(FWHM � 6 mm), these estimates changed to 66% ±5%, 14% ± 3%, and 21% ± 4% for the VST, DCA, andDPU contributions, respectively. The nonnegligible con-tamination of the VST signal by the DPU and DCAsupports the usefulness of PVE correction for the mea-surement of D2 receptor parameters in this region, notonly between subjects, but also for within-subject de-signs. For example, studies comparing mesolimbic andnigrostriatal occupancies of D2 receptors by dopamineor antipsychotic drugs will gain power from PVEcorrection.
Another strategy for handling the contamination prob-lem would be to optimize the size and location of thesampling area, to sample the signal in an area associatedwith lower contamination. The delineation of such a sub-sampling region could be defined on the blurred DCAand DPU MRI binary images, so as to remain less thanan acceptable contamination threshold. Subsampling ofthe VST would also reduce vulnerability to misregistra-tion, but would be associated with decreased countingstatistics. A comparison of these two methods in terms ofgain in accuracy and loss of reproducibility is warranted.
Comparison with in vitro valuesThe primary analysis of the images revealed signifi-
cantly lower D2 receptor availability in the VST com-pared with the DCA and DPU. The lower [11C]racloprideuptake in the VST relative to the DCA and DPU was
QUANTIFICATION OF VENTROSTRIATAL D2 RECEPTORS WITH PET 1053
J Cereb Blood Flow Metab, Vol. 21, No. 9, 2001
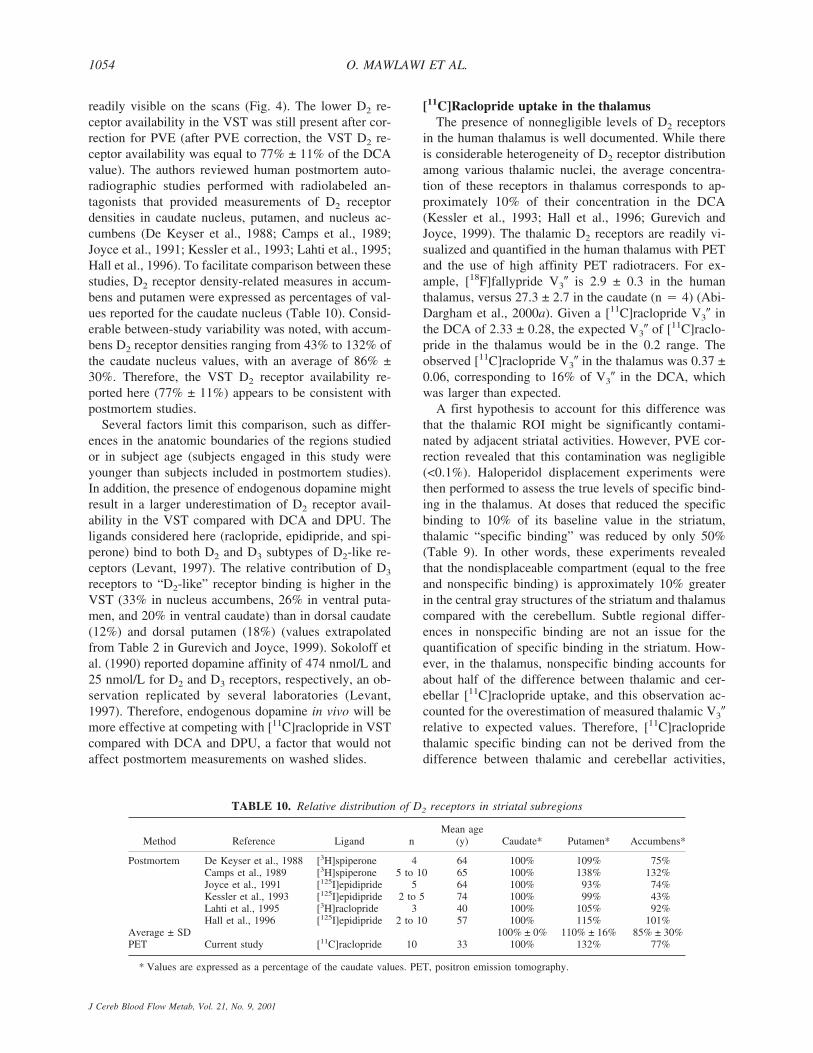
readily visible on the scans (Fig. 4). The lower D2 re-ceptor availability in the VST was still present after cor-rection for PVE (after PVE correction, the VST D2 re-ceptor availability was equal to 77% ± 11% of the DCAvalue). The authors reviewed human postmortem auto-radiographic studies performed with radiolabeled an-tagonists that provided measurements of D2 receptordensities in caudate nucleus, putamen, and nucleus ac-cumbens (De Keyser et al., 1988; Camps et al., 1989;Joyce et al., 1991; Kessler et al., 1993; Lahti et al., 1995;Hall et al., 1996). To facilitate comparison between thesestudies, D2 receptor density-related measures in accum-bens and putamen were expressed as percentages of val-ues reported for the caudate nucleus (Table 10). Consid-erable between-study variability was noted, with accum-bens D2 receptor densities ranging from 43% to 132% ofthe caudate nucleus values, with an average of 86% ±30%. Therefore, the VST D2 receptor availability re-ported here (77% ± 11%) appears to be consistent withpostmortem studies.
Several factors limit this comparison, such as differ-ences in the anatomic boundaries of the regions studiedor in subject age (subjects engaged in this study wereyounger than subjects included in postmortem studies).In addition, the presence of endogenous dopamine mightresult in a larger underestimation of D2 receptor avail-ability in the VST compared with DCA and DPU. Theligands considered here (raclopride, epidipride, and spi-perone) bind to both D2 and D3 subtypes of D2-like re-ceptors (Levant, 1997). The relative contribution of D3
receptors to “D2-like” receptor binding is higher in theVST (33% in nucleus accumbens, 26% in ventral puta-men, and 20% in ventral caudate) than in dorsal caudate(12%) and dorsal putamen (18%) (values extrapolatedfrom Table 2 in Gurevich and Joyce, 1999). Sokoloff etal. (1990) reported dopamine affinity of 474 nmol/L and25 nmol/L for D2 and D3 receptors, respectively, an ob-servation replicated by several laboratories (Levant,1997). Therefore, endogenous dopamine in vivo will bemore effective at competing with [11C]raclopride in VSTcompared with DCA and DPU, a factor that would notaffect postmortem measurements on washed slides.
[11C]Raclopride uptake in the thalamusThe presence of nonnegligible levels of D2 receptors
in the human thalamus is well documented. While thereis considerable heterogeneity of D2 receptor distributionamong various thalamic nuclei, the average concentra-tion of these receptors in thalamus corresponds to ap-proximately 10% of their concentration in the DCA(Kessler et al., 1993; Hall et al., 1996; Gurevich andJoyce, 1999). The thalamic D2 receptors are readily vi-sualized and quantified in the human thalamus with PETand the use of high affinity PET radiotracers. For ex-ample, [18F]fallypride V3� is 2.9 ± 0.3 in the humanthalamus, versus 27.3 ± 2.7 in the caudate (n � 4) (Abi-Dargham et al., 2000a). Given a [11C]raclopride V3� inthe DCA of 2.33 ± 0.28, the expected V3� of [11C]raclo-pride in the thalamus would be in the 0.2 range. Theobserved [11C]raclopride V3� in the thalamus was 0.37 ±0.06, corresponding to 16% of V3� in the DCA, whichwas larger than expected.
A first hypothesis to account for this difference wasthat the thalamic ROI might be significantly contami-nated by adjacent striatal activities. However, PVE cor-rection revealed that this contamination was negligible(<0.1%). Haloperidol displacement experiments werethen performed to assess the true levels of specific bind-ing in the thalamus. At doses that reduced the specificbinding to 10% of its baseline value in the striatum,thalamic “specific binding” was reduced by only 50%(Table 9). In other words, these experiments revealedthat the nondisplaceable compartment (equal to the freeand nonspecific binding) is approximately 10% greaterin the central gray structures of the striatum and thalamuscompared with the cerebellum. Subtle regional differ-ences in nonspecific binding are not an issue for thequantification of specific binding in the striatum. How-ever, in the thalamus, nonspecific binding accounts forabout half of the difference between thalamic and cer-ebellar [11C]raclopride uptake, and this observation ac-counted for the overestimation of measured thalamic V3�relative to expected values. Therefore, [11C]raclopridethalamic specific binding can not be derived from thedifference between thalamic and cerebellar activities,
TABLE 10. Relative distribution of D2 receptors in striatal subregions
Method Reference Ligand nMean age
(y) Caudate* Putamen* Accumbens*
Postmortem De Keyser et al., 1988 [3H]spiperone 4 64 100% 109% 75%Camps et al., 1989 [3H]spiperone 5 to 10 65 100% 138% 132%Joyce et al., 1991 [125I]epidipride 5 64 100% 93% 74%Kessler et al., 1993 [125I]epidipride 2 to 5 74 100% 99% 43%Lahti et al., 1995 [3H]raclopride 3 40 100% 105% 92%Hall et al., 1996 [125I]epidipride 2 to 10 57 100% 115% 101%
Average ± SD 100% ± 0% 110% ± 16% 85% ± 30%PET Current study [11C]raclopride 10 33 100% 132% 77%
* Values are expressed as a percentage of the caudate values. PET, positron emission tomography.
O. MAWLAWI ET AL.1054
J Cereb Blood Flow Metab, Vol. 21, No. 9, 2001
which makes the use of this ligand to quantify D2 recep-tor availability in the thalamus impractical. In addition,the test–retest variability of thalamic V3� was high (±19.2 ± 18.5%) and the ICC of thalamic uptake was poor(0.33). Thus, in the authors’ opinion, [11C]raclopride isnot a ligand of choice to measure D2 receptor availabilityin the thalamus.
ConclusionThis study demonstrated that reliable estimates of D2
receptor availability parameters can be obtained in thehuman VST using [11C]raclopride, the ECAT EXACTHR+PET scanner, and the bolus plus constant infusionmethod. Relative D2 receptor availability in the VST,DCA, and DPU measured in this study was consistentwith predictions from postmortem studies. The test–retest variability associated with the measurement in theVST was comparable with the one associated with mea-surements of activities in DCA and DPU, and in thestriatum as a whole. In contrast, the measurement ofthalamic D2 receptors with [11C]raclopride was found tobe unreliable and of questionable physiologic signifi-cance. Determination of D2 receptor parameters in theVST was found to be critically vulnerable to head motionand misregistration. These studies require a good headimmobilization system, a good cooperation from the sub-jects, and an effective frame realignment algorithm. Au-tomatic Image Registration applied to denoised frameswas effective at realigning the frames and improving theprecision of the VST measurement, but its performancewas affected by low counts in the later frames. Reducingthe scanning time from 0 to 90 minutes to 40 to 80minutes should translate into further improvement of re-producibility, because of reduced head movement andhigher counts per frame. Partial volume effect analysisrevealed a significant contamination (approximately30%) of the counts measured in the VST by counts origi-nating from the DCA and DPU. Thus, PVE correction isdesirable for both between- and within-subject experi-mental designs. The demonstration of an appropriate ac-curacy and precision of D2 receptor parameters measure-ments with [11C]raclopride in the VST is the first criticalstep toward the use of this ligand to study synaptic do-pamine transmission at D2 receptors in the VST usingcompetitive techniques (Laruelle, 2000).
Acknowledgments: The authors thank Richard Carson,Ph.D. and Adrian Lammertsma, Ph.D. for sharing data andinsights, and Suehee Chung, Nicole Eftychiou, Ingrid Gelbard,Bea Reig, Julie Montoya, Audrey Perez, Mali Pratap, JustinePidcock, Richard Weiss, Kris Wolff, and the technologists ofthe Columbia PET Center for excellent technical assistance.
REFERENCES
Abi-Dargham A, Laruelle M, Seibyl J, Rattner Z, Baldwin RM, ZoghbiSS, Zea-Ponce Y, Bremner JD, Hyde TM, Charney DS, Hoffer PB,
Innis RB (1994) SPECT measurement of benzodiazepine receptorsin human brain with [123-I]iomazenil: kinetic and equilibriumparadigms. J Nucl Med 35:228–238
Abi-Dargham A, Hwang DR, Huang Y, Zea-Ponce Y, Martinez D,Lombardo I, Broft A, Hashimoto T, Slifstein M, Mawlawi O, VanHeertum R, Laruelle M (2000a) Reliable quantification of bothstriatal and extrastriatal D2 receptors in humans with [18F]fal-lypride. J Nucl Med 41:139P
Abi-Dargham A, Martinez D, Mawlawi O, Simpson N, Hwang DR,Slifstein M, Anjilvel S, Pidcock J, Guo NN, Lombardo I, Mann JJ,Van Heertum R, Foged C, Halldin C, Laruelle M (2000b) Mea-surement of striatal and extrastriatal dopamine D1 receptor bindingpotential with [11C]NNC 112 in humans: validation and reproduc-ibility. J Cereb Blood Flow Metab 20:225–243
Battle G (1987) A block spin construction of ondelettes 1. Lemariefunctions. Communications in Mathematical Physics 7:601–615
Breier A, Su TP, Saunders R, Carson RE, Kolachana BS, deBarto-lomeis A, Weinberger DR, Weisenfeld N, Malhotra AK, EckelmanWC, Pickar D (1997) Schizophrenia is associated with elevatedamphetamine-induced synaptic dopamine concentrations: evidencefrom a novel positron emission tomography method. Proc NatlAcad Sci U S A 94:2569–2574
Breier A, Adler CM, Weisenfeld N, Su TP, Elman I, Picken L, Mal-hotra AK, Pickar D (1998) Effects of NMDA antagonism on stria-tal dopamine release in healthy subjects: application of a novelPET approach. Synapse 29:142–147
Brix G, Zaers J, Adam LE, Bellemann ME, Ostertag H, Trojan H,Haberkorn U, Doll J, Oberdorfer F, Lorenz WJ (1997) Perfor-mance evaluation of a whole-body PET scanner using the NEMAprotocol. National Electrical Manufacturers Association. J NuclMed 38:1614–1623
Camps M, Cortes R, Gueye B, Probst A, Palacios JM (1989) Dopaminereceptors in human brain: autoradiographic distribution of D2 sites.Neuroscience 28:275–290
Carson RE, Breier A, deBartolomeis A, Saunders RC, Su TP, SchmallB, Der MG, Pickar D, Eckelman WC (1997) Quantification ofamphetamine-induced changes in [C-11]raclopride binding withcontinuous infusion. J Cereb Blood Flow Metab 17:437–447
Chan GL, Holden JE, Stoessl AJ, Doudet DJ, Wang Y, Dobko T,Morrison KS, Huser JM, English C, Legg B, Schulzer M, CalneDB, Ruth TJ (1998) Reproducibility of the distribution of carbon-11-SCH 23390, a dopamine D1 receptor tracer, in normal subjects.J Nucl Med 39:792–797
De Keyser J, Claeys A, De Backer JP, Ebinger G, Roels F, VauquelinG (1988) Autoradiographic localization of D1 and D2 dopaminereceptors in the human brain. Neurosci Lett 91:142–147
Deutch A, Moghadam B, Innis R, Krystal J, Aghajanian G, Bunney B,Charney D (1991) Mechanisms of action of atypical antipsychoticdrugs. Implication for novel therapeutic strategies for schizophre-nia. Schizophrenia Res 4:121–156
Di Chiara G, Tanda G, Frau R, Carboni E (1993) On the preferentialrelease of dopamine in the nucleus accumbens by amphetamine:further evidence obtained by vertically implanted concentric dialy-sis probes. Psychopharmacology 112:398–402
Di Chiara G (1995) The role of dopamine in drug abuse viewed fromthe perspective of its role in motivation. Drug Alcohol Depend38:95–137
Drevets WC, Price JC, Kupfer DJ, Kinahan PE, Lopresti B, Holt D,Mathis C (1999) PET measures of amphetamine-induced dopa-mine release in ventral versus dorsal striatum. Neuropsychophar-macology 21:694–709
Drevets WC, Gautier C, Price JC, Kupfer DJ, Kinahan PE, Grace AA,Price JL, Mathis CA (2001) Amphetamine-induced dopamine re-lease in human ventral striatum correlates with euphoria. Biol Psy-chiatry 49:81–96
Farde L, Eriksson L, Blomquist G, Halldin C (1989) Kinetic analysis ofcentral [11C]raclopride binding to D2 dopamine receptors studiedby PET: a comparison to the equilibrium analysis. J Cereb BloodFlow Metab 9:696–708
Gandelman MS, Baldwin RM, Zoghbi SS, Zea-Ponce Y, Innis RB(1994) Evaluation of ultrafiltration for the free fraction determi-nation of single photon emission computerized tomography
QUANTIFICATION OF VENTROSTRIATAL D2 RECEPTORS WITH PET 1055
J Cereb Blood Flow Metab, Vol. 21, No. 9, 2001

(SPECT) radiotracers: �-CIT, IBF and iomazenil. J Pharm Sci83:1014–1019
Green MV, Seidel J, Stein SD, Tedder TE, Kempner KM, Kertzman C,Zeffiro TA (1994) Head movement in normal subjects duringsimulated PET brain imaging with and without head restraint. JNucl Med 35:1538–1546
Gurevich EV, Joyce JN (1999) Distribution of dopamine D3 receptorexpressing neurons in the human forebrain: comparison with D2receptor expressing neurons. Neuropsychopharmacology 20:60–80
Hall H, Farde L, Sedvall G (1988) Human dopamine receptors sub-types-in vitro binding analysis using [3H]SCH 23390 and [3H]ra-clopride. J Neural Transm 73:7–21
Hall H, Farde L, Halldin C, Hurd YL, Pauli S, Sedvall G (1996)Autoradiographic localization of extrastriatal D2-dopamine recep-tors in the human brain using [125I]epidepride. Synapse 23:115–123
Ito H, Hietala J, Blomqvist G, Halldin C, Farde L (1998) Comparisonof the transient equilibrium and continuous infusion method forquantitative PET analysis of [11C]raclopride binding. J CerebBlood Flow Metab 18:941–50
Jewett D (1992) A simple synthesis of [11C]methyl triflate. Int J RadAppl Instrum [A] 43:1383–1385
Joyce JN, Janowsky A, Neve K (1991) Characterization and distribu-tion of [125I]epidepride binding to dopamine D2 receptors in basalganglia and cortex in human brain. J Pharmacol Exp Ther257:1253–2263
Kessler RM, Whetsell WO, Ansari MS, Votaw JR, de Paulis T, ClantonJA, Schmidt DE, Mason NS, Manning RG (1993) Identification ofextrastriatal dopamine D2 receptors in postmortem human brainwith [125I]epidipride. Brain Res 609:237–343
Kirk RE (1982) Experimental design: procedures for the behavioralsciences. Pacific Grove, CA: Brooks/Cole Publishing
Koob GF (1992) Drugs of abuse: anatomy, pharmacology and functionof reward pathways. Trends Pharmacol Sci 13:177–184
Labbe C, Froment JC, Kennedy A, Ashburner J, Cinotti L (1996)Positron emission tomography metabolic data corrected for corti-cal atrophy using magnetic resonance imaging. Alzheimer Dis As-soc Disord 10:141–170
Labbe C, Koepp M, Ashburner J, Spinks T, Richardson M, Duncan JS,Cunningham V (1998) Absolute PET quantification with correc-tion for partial volume effects within cerebral structures. In: Quan-titative functional brain imaging with positron emission tomogra-phy (Carson RE, Daube-Whitherspoon ME, Herscovitch P, eds),San Diego, CA: Academic press, pp 59–66
Lahti RA, Roberts RC, Tamminga CA (1995) D2-family receptor dis-tribution in human postmortem tissue: an autoradiographic study.Neuroreport 6:2505–2512
Lammertsma AA, Bench CJ, Hume SP, Osman S, Gunn K, Brooks DJ,Frackowiak RS (1996) Comparison of methods for analysis ofclinical [11C]raclopride studies. J Cereb Blood Flow Metab16:42–52
Lammertsma AA, Hume SP (1996) Simplified reference tissue modelfor PET receptor studies. Neuroimage 4:153–158
Laruelle M, Abi-Dargham A, Al-Tikriti MS, Baldwin RM, Zea-PonceY, Zoghbi SS, Charney DS, Hoffer PB, Innis RB (1994a) SPECTquantification of [123I]iomazenil binding to benzodiazepine recep-tors in nonhuman primates. II. Equilibrium analysis of constantinfusion experiments and correlation with in vitro parameters. JCereb Blood Flow Metab 14:453–465
Laruelle M, Al-Tikriti MS, Zea-Ponce Y, Zoghbi SS, Baldwin RM,Charney DS, Hoffer PB, Kung HF, Innis RB (1994b) In vivoquantification of dopamine D2 receptors parameters in nonhumanprimates with [123I]iodobenzofuran and single photon emissioncomputerized tomography. Eur J Pharmacol 263:39–51
Laruelle M (2000) Imaging synaptic neurotransmission with in vivobinding competition techniques: a critical review. J Cereb BloodFlow Metab 20:423–451
Lemarie PG (1988) Ondelettes with exponential localization. Journalde Mathematiques Pures et Appliques 67:227–236
Levant B (1997) The D-3 dopamine receptor: neurobiology and poten-tial clinical relevance. Pharmacol Rev 49:231–252
Lindvall O, Bjorklund A (1978) Anatomy of the dopaminergic neuronsystems in the rat brain. Adv Biochem Psychopharmacol 19:1–23
Logan J, Fowler JS, Volkow ND, Wang GJ, Ding YS, Alexoff DL(1996) Distribution volume ratios without blood sampling fromgraphical analysis of PET data. J Cereb Blood Flow Metab16:834–840
Lynd-Balta E, Haber SN (1994) The organization of midbrain projec-tion to the ventral striatum in the primate. Neuroscience 59:609–623
Mai JC, Assheuer J, Paxinos G (1997) Atlas of the human brain. SanDiego, CA: Academic Press
Mallat SG (1998) A theory for multi resolution signal decomposition:the wavelet representation. IEEE Transaction on Pattern Analysis& Machine Intelligence 7:674–693
Martinez D, Mawlawi O, Simpson N, Hwang DR, Kegeles L, Broft A,Abi-Dargham A, Van Heertum R, Laruelle M (2000) Comparisonof amphetamine-induced endogenous dopamine release in striatalsubstructures in humans using PET. Abstr Soc Neurosci 26:1327
Martinez D, Hwang D, Mawlawi O, Slifstein M, Kent J, Simpson N,Parsey RV, Hashimoto T, Huang Y, Shinn A, Van Heertum R,Abi-Dargham A, Caltabiano S, Malizia A, Cowley H, Mann JJ,Laruelle M (2001) Differential occupancy of somatodendritic andpostsynaptic 5HT(1A) receptors by pindolol. A dose-occupancystudy with [11C]WAY 100635 and positron emission tomographyin humans. Neuropsychopharmacology 24:209–229
Mawlawi OM, Weiss R, Shinn A, Pidcock J, Slifstien M, Laruelle M(1999) Performance characteristics of a head immobilization de-vice for PET imaging. J Nucl Med 40:281P
Mawlawi O, Chatarjee A, Slifstein M, Laruelle M (2000) Waveletdenoising of PET images: effect on the accuracy of the AIR algo-rithm. NeuroImage 11:S57
Meltzer CC, Leal JP, Mayberg HS, Wagner HN Jr, Frost JJ (1990)Correction of PET data for partial volume effects in human cere-bral cortex by MR Imaging. J Comp Assist Tomogr 14:561–570
Meltzer CC, Kinahan PE, Greer PJ, Nichols TE, Comtat C, CantwellMN, Lin MP, Price JC (1999) Comparative evaluation of MR-based partial-volume correction schemes for PET. J Nucl Med40:2053–2065
Mintun MA, Raichle ME, Kilbourn MR, Wooten GF, Welch MJ (1984)A quantitative model for the in vivo assessment of drug bindingsites with positron emission tomography. Ann Neurol 15:217–227
Mogenson GJ, Jones DL, Yim CY (1980) From motivation to action:functional interface between the limbic system and the motor sys-tem. Prog Neurobiol 14:69–97
Muller-Gartner HW, Links JM, Prince JL, Bryan RN, McVeigh E, LealJP, Davatzikos C, Frost JJ (1992) Measurement of radiotracer con-centration in brain gray matter using positron emission tomogra-phy: MRI-based correction for partial volume effects. J CerebBlood Flow Metab 12:571– 583
Rousset OG, Ma Y, Evans AC (1998) Correction for partial volumeeffects in PET: principle and validation. J Nucl Med 39:904–911
Rousset OG, Deep P, Kuwabara H, Evans AC, Gjedde AH, CummingP (2000) Effect of partial volume correction on estimates of theinflux and cerebral metabolism of 6-[(18)F]fluoro-L-dopa studiedwith PET in normal control and Parkinson’s disease subjects. Syn-apse 37:81–89
Rowland M, Tozer TN (1989) Clin Pharmacokinet. Philadelphia: Lea& Febiger
Slifstein M, Mawlawi O, Laruelle M (2000) Partial volume effect cor-rection: methodological considerations. In: Physiological imagingof the brain with PET (Gjedde A, Hansen S, Knudsen G, PaulsonO, eds), San Diego, CA: Academic Press, pp 65–71
Sokoloff P, Giros B, Martres M-P, Bouthenet M-L, Schwartz J-C(1990) Molecular cloning and characterization of a novel dopa-mine receptor D3 as a target for neuroleptics. Nature 347:146–151
Strother SC, Casey ME, Hoffman EJ (1990) Measuring PET scannersensitivity: relating count rates to image signal to noise ratios usingnoise equivalent counts. IEEE Transactions on Nuclear Science37:783–788
Volkow ND, Fowler JS, Wang GJ, Dewey SL, Schyler D, MacGregorR, Logan J, Alexoff D, Shea C, Hitzemann R, Angrist B, Wolf AP(1993) Reproducibility of repeated measures of carbon-11-raclopride binding in the human brain. J Nucl Med 34:609–613
Volkow ND, Wang G-J, Fowler JS, Logan J, Schlyer D, Hitzemann R,Lieberman J, Angrist B, Pappas N, MacGregor R, Burr G, Cooper
O. MAWLAWI ET AL.1056
J Cereb Blood Flow Metab, Vol. 21, No. 9, 2001
T, Wolf AP (1994) Imaging endogenous dopamine competitionwith [11C]raclopride in the human brain. Synapse 16:255–262
Volkow ND, Wang GJ, Fowler JS, Logan J, Gatley SJ, Hitzemann R,Chen AD, Dewey SL, Pappas N (1997) Decreased striatal dopa-minergic responsiveness in detoxified cocaine-dependent subjects.Nature 386:830–833
Watabe H, Endres CJ, Breier A, Schmall B, Eckelman WC, Carson RE(2000) Measurement of dopamine release with continuous infusionof [11C]raclopride: optimization and signal-to-noise consider-ations. J Nucl Med 41:522–530
Watson CC, Newport D, Casey ME (1996) A single scatter simulationtechnique for scatter correction in 3D PET. In: Three dimensionalimage reconstruction in radiology and nuclear medicine (GrangeatP, Amans J-L, eds), Amsterdam: Kluwer Academic, pp 255–268
Wienhard K, Eriksson L, Grootoonk S, Casey M, Pietrzyk U, HeissWD (1992) Performance evaluation of the positron scanner ECATEXACT. J Comp Assist Tomgr 16:804–13
Woods RP, Cherry SR, Mazziotta JC (1992) Rapid automated algo-rithm for aligning and reslicing PET images. J Comp Assist To-mogr 16:620–633
Woods RP, Mazziotta JC, Cherry SR (1993) MRI-PET registrationwith automated algorithm. J Comput Assist Tomogr 17:536–546
Woods RP, Grafton ST, Holmes CJ, Cherry SR, Mazziotta JC (1998)Automated image registration: I. General methods and intra-subject, intramodality validation. J Comput Assist Tomogr 22:139–152
APPENDIX
The following computation was performed to find thescan duration that maximizes the total recorded noiseequivalent counts (NEC) using a bolus plus constant in-fusion of a C-11 labeled radiotracer, with the constraintsthat scanning starts at 40 minutes and Kbol is fixed at 105
minutes. Let ID equal the total injected dose and � rep-resent the fraction of ID contained in the bolus. ThenKbol satisfies the following equation:
�ID
Kbol=
(1 − �)IDTotal infusion time
Let Tend represent the total infusion time. Then
Tend = Kbol
1 − �
�
Assume that the peak value of the NECR curve isproportional to the bolus dose �ID, say peak � a × �ID.Also assume NEC rate follows a monoexponential pro-file starting at time p, the time of the peak, with decayconstant � � ln(2)/(half-life of 11C) � 0.034 (mean P� 4.25 ± 1.46 minutes). Then the area under the NECRcurve from t � 40 to the end of the infusion is
��40−p�
�Tend−p�a�IDe−�tdt =
a�ID
−�e−�t|40−p
105�1��−1�−p
=a�ID
�ep��e−40� − e−105�1��−1���
The value of � that maximizes this expression is in-dependent of p, a, and ID and is equal to 0.51. Theassociated Tend is 101 minutes.
QUANTIFICATION OF VENTROSTRIATAL D2 RECEPTORS WITH PET 1057
J Cereb Blood Flow Metab, Vol. 21, No. 9, 2001