Parkinsons disease and dopamine transporter neuroimaging: a critical review
Upload
independentCategory
view
5download
0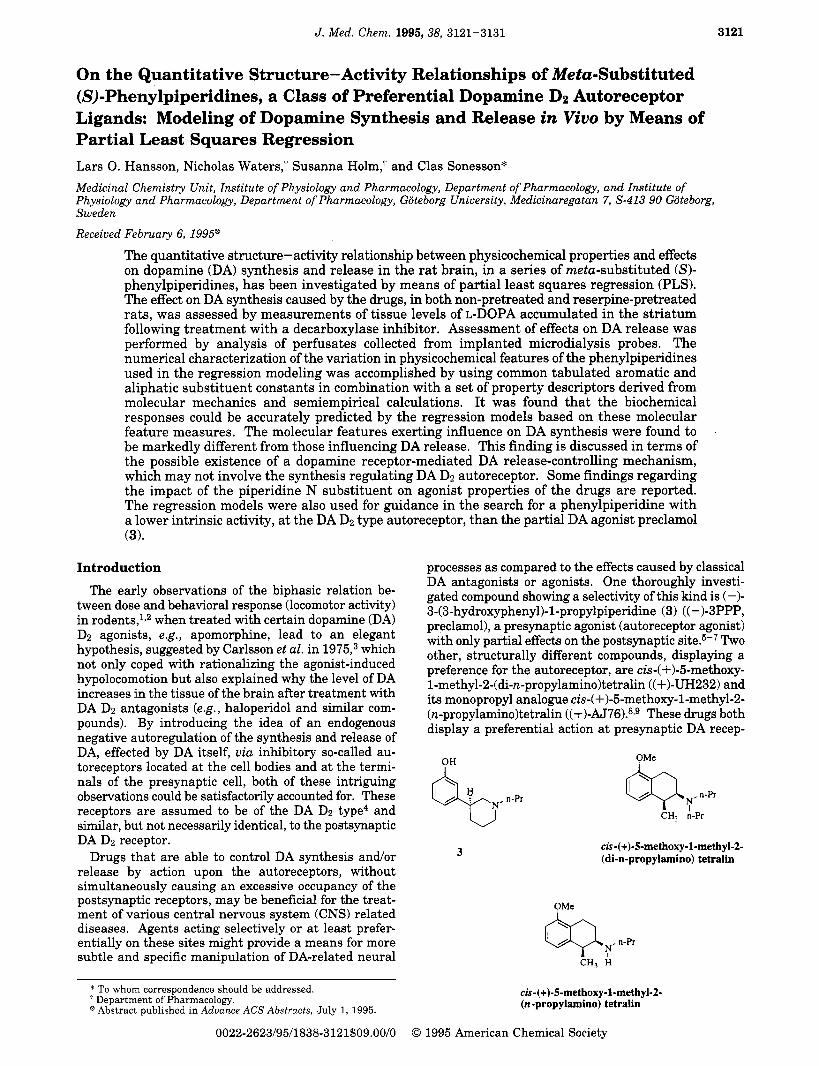
J . Med. Chem. 1995,38, 3121-3131 3121
On the Quantitative Structure-Activity Relationships of Meta-Substituted (S)-Phenylpiperidines, a Class of Preferential Dopamine D2 Autoreceptor Ligands: Modeling of Dopamine Synthesis and Release in Vivo by Means of Partial Least Squares Regression Lars 0. Hansson, Nicholas Waters,? Susanna Holm,+ and Clas Sonesson* Medicinal Chemistry Unit, Institute of Physiology and Pharmacology, Department of Pharmacology, and Institute of Physiology and Pharmacology, Department of Pharmacology, Goteborg University, Medicinaregatan 7, S-413 90 Goteborg, Sweden
Received February 6, 1995@
The quantitative structure-activity relationship between physicochemical properties and effects on dopamine (DA) synthesis and release in the rat brain, in a series of meta-substituted (SI- phenylpiperidines, has been investigated by means of partial least squares regression (PLS). The effect on DA synthesis caused by the drugs, in both non-pretreated and reserpine-pretreated rats, was assessed by measurements of tissue levels of L-DOPA accumulated in the striatum following treatment with a decarboxylase inhibitor. Assessment of effects on DA release was performed by analysis of perfusates collected from implanted microdialysis probes. The numerical characterization of the variation in physicochemical features of the phenylpiperidines used in the regression modeling was accomplished by using common tabulated aromatic and aliphatic substituent constants in combination with a set of property descriptors derived from molecular mechanics and semiempirical calculations. It was found that the biochemical responses could be accurately predicted by the regression models based on these molecular feature measures. The molecular features exerting influence on DA synthesis were found to be markedly different from those influencing DA release. This finding is discussed in terms of the possible existence of a dopamine receptor-mediated DA release-controlling mechanism, which may not involve the synthesis regulating DA D2 autoreceptor. Some findings regarding the impact of the piperidine N substituent on agonist properties of the drugs are reported. The regression models were also used for guidance in the search for a phenylpiperidine with a lower intrinsic activity, a t the DA Dz type autoreceptor, than the partial DA agonist preclamol (3).
Introduction
The early observations of the biphasic relation be- tween dose and behavioral response (locomotor activity) in rodents,1,2 when treated with certain dopamine (DA) D2 agonists, e.g., apomorphine, lead to an elegant hypothesis, suggested by Carlsson et al. in 1975,3 which not only coped with rationalizing the agonist-induced hypolocomotion but also explained why the level of DA increases in the tissue of the brain after treatment with DA D2 antagonists (e.g., haloperidol and similar com- pounds). By introducing the idea of an endogenous negative autoregulation of the synthesis and release of DA, effected by DA itself, via inhibitory so-called au- toreceptors located at the cell bodies and at the termi- nals of the presynaptic cell, both of these intriguing observations could be satisfactorily accounted for. These receptors are assumed to be of the DA D2 type4 and similar, but not necessarily identical, to the postsynaptic DA D2 receptor.
Drugs that are able to control DA synthesis and/or release by action upon the autoreceptors, without simultaneously causing an excessive occupancy of the postsynaptic receptors, may be beneficial for the treat- ment of various central nervous system (CNS) related diseases. Agents acting selectively or at least prefer- entially on these sites might provide a means for more subtle and specific manipulation of DA-related neural
processes as compared to the effects caused by classical DA antagonists or agonists. One thoroughly investi- gated compound showing a selectivity of this kind is (-1- 3-(3-hydroxyphenyl)-l-propylpiperidine (3) ((-)-3PPP, preclamol), a presynaptic agonist (autoreceptor agonist) with only partial effects on the postsynaptic ~ i t e . ~ - ~ Two other, structurally different compounds, displaying a preference for the autoreceptor, are cis-(+)-5-methoxy- 1-methyl-24di-n-propy1amino)tetralin ((+)-UH232) and its monopropyl analogue cis-( +)d-methoxy-1-methyl-2- (n-propy1amino)tetralin ((+)-AJ76).8~9 These drugs both display a preferential action at presynaptic DA recep-
OH I
3
OMe
N, n-Pr I
CH, n-Pr
~~-(+)-5-methoxy-l-methyl-2- (di-n-propylamino) tetralin
* To whom correspondence should be addressed. + Department of Pharmacology. @Abstract published in Advance ACS Abstracts, July 1, 1995.
cis-(+)-5-methoxy-l-methyl-2- (n -propylamino) tetralin
0022-2623/95/1838-3121$09.00/0 0 1995 American Chemical Society
3122 Journal of Medicinal Chemistry, 1995, Vol. 38, No. 16 Hansson et al.
x X
Hydrogen donor ( I ) Group dipole moment (2) Molecular refractivity (3) Swain and Luptons F (4) Swain and Luptons R ( 5 ) Hammett constants (6-7)
Boltzmann distribution for each torsional angle, 21, increment 15'(14-25)
n PC Model (MMX)
Tabulated U / R Proton affinity H,RNR (10)
TPft po lu constant U* (8)
Figure 1. Physicochemical description of the molecules.
tors, but in contrast to 3, they act as antagonists at this site along with moderate or low levels of postsynaptic antag~nism.~ These agents are capable of producing a mild locomotor stimulation in rodents, despite the fact that they are classified as antagonists. The behavioral effect of these drugs may be explained by their ability to increase the synaptic levels of DA by action on the autoreceptors combined with their relatively low pro- pensity to antagonize the postsynaptic site.
In a recent article, we reported on the synthesis and pharmacological effects of a series of novel S-3-substi- tuted phenylpiperidines. It was found that a large portion of the investigated structures possessed a marked in vivo preference for the presynaptic DA receptor as judged by their pharmacological profiles.1° In the series of structures under study, the aromatic substituent in the 3-position and the piperidine N substituent were subjected to variations (Figure 1 and Table 1). These structures were found to display pharmacological profiles ranging from profiles similar to that of (+)-AJ76 to profiles closer to that of (-)-3PPP, albeit none being as powerful an agonist at the presyn- aptic site as is (-)-3PPP. We believed that these results would provide a useful source of in vivo data reflecting the rate of DA synthesis and release, making it possible to perform a comprehensive in vivo quantitative struc- ture-activity relationship (QSAR) study of these 3-sub- stituted (-1-(5')-phenylpiperidines. To broaden the range of structural features in this investigation, we decided to include additional data regarding compounds of this class not covered in our original investigation but that are available in reports by others." The biological testing reported in this paper was performed at our
Proton affinity, H,RX (9) Total surface, x, ( 1 I )
Relative energy at etch torsional angle, 22, increment 15' (26-49) Nonpolar saturated surface area, R,,,, (12) Nonpolar unsaturated surface area, R,,,, (13)
laboratories, a fortunate circumstance which ensured that the data gathered from these sources were fully comparable with the data from our experiments. Fur- thermore, access to the raw data, including dose- response curves from the models of interest, made incorporation of such data in the modeling possible. The dose-response data were crucial because all biological responses were taken as maximum effects produced by the test compounds, i.e., efficacy was modeled rather than potency. The biological data reported in ref 10 include also several in vitro binding assays and loco- motor activity. However, initial QSAR attempts using these variables were unsuccessful. Further, in vitro binding data have previously shown poor correlation to in vivo measures of DA synthesis and release in this structural class.1°
One recently synthesized compound, (+)-(S)-l-allyl- 3-phenylpiperidine (33), not previously reported was also included in the present modeling work. The biological data are shown in Table 1.
Recent clinical trials suggest that 3 may possess antipsychotic efficacy in man.12J3 However, the slight behavioral activation and tolerance observed in these studies indicate that 3 has a somewhat too high intrinsic activity, at the DA D:! type autoreceptors, to be optimal as an antipsychotic agent, although such activation may turn out to be beneficial in cases with negative sym- toms.14 Therefore it was of great interest to develop a compound with a pharmacological profile resembling that of 3 but with a lower intrinsic activity. Another requirement was that this compound should lack any oxygen atom directly attached to the aromatic ring, since this has been found to lower the oral bioavailabil-

QSAR of Meta-Substituted (S)-Phenylpiperidines
Table 1. Structural Variation and Biological Activity in the Series of (S)-Phenylpiperidines (XA and RN refer to the generic structure in Figure 1)
Journal of Medicinal Chemistry, 1995, Vol. 38, No. 16 3123
DOPA accumulationa non-pretreated rats reserpine-pretreated rats DA releasea
entry XA RN (100 pmoVkg) (100 pmollkg) (200 pmollkg) control 1 2 3 4 5 6 7 8 9 10 11 12 13 14 15 16 17 18 19 20 21 22 23 24 25 26 27 28 29 30 31 32 33 34 35 36
Br NHz OH CH30 CN CH3S02 CH3S03 CCH CH3CO CF3S03 H CHzCN CHdCHz)z CHzOH CN CN CN CN CN CN CF3S03 CF3S03 CF3S03 CF3S03 OH OH OH OH OH OH CN CN H CHO SCH3 3-thienyl
n-Pr n-Pr n-Pr n-Pr n-Pr n-Pr n-Pr n-Pr n-Pr n-Pr n-Pr n-Pr n-Pr n-Pr allyl H Me Et phenethyl i-Pr phenethyl Me Et n-Bu H Me Et i-Pr n-Bu phenethyl n-Bu
allyl n-Pr n-Pr n-Pr
S-BU
100 199 f 56 128 f 4b 141 f 14b 131 f llb 268 f 16b 319 f 15b 249 f 6b 136 f 8b 243 f 21b 264 f 13b 140 f lob 207 f lob 190 f 41b 118 f 7b 257 f 20b 271 f lgb 215 f 6b 318 f lgb 176 f lob 301 f 17b 111 f 8b 157 f 4 286 f 23b 234 f 10
44cre 5lCle
12oef 47 f 7 86e9 37eg
100 101 f 126 91 f l o b 30 f 7btc 66 f 6*
105 i 12b 95 f 96 92 f 3b
73 i: 6b 85 f 4b 65 f 3b1d 57 f l l b 62 f 3b 50 f 5b 85 f 8b
66 f 2b
20 f 3f 28 f 4 18 f 5 22 f 8f 22 f 4 71 f 8d
83 f 6 92 f 5d
100 372 f 60
400 & 60
411 f 84 293 f 42 239 f 17 270 f 16 196 f 19 233 f 22 543 f 52
191 f 5 593 f 84
223 f 19
81 f 7
143 f 22
56 f 9
282 f 34 364 f 13
106 i 14d
a Values refer to maximum effects after subcutaneous injection relative to saline controls. Note that the DA release results refer to Data taken from maximum levels between 20 and 100 min after administration and not the 60 min value which is reported in ref 10.
ref 10. 227 pmoLkg. 50 pmolkg. e Data taken from ref 11. f 107 pmoVkg. 8 3.7 pmollkg.
ity by extensive first-pass elimination via O-glucoron- idation.15 Consequently, if models predictive of all relevant end points could be established, this would be very helpful in the development of such structures.
Partial least squares regression (PLS) as a statistical tool in QSAR analysesl6-l8 circumvents the problems of collinearity and multi~ollinearityl~ and also offers the obvious advantage to handle data sets where the number of independent variables is greater than the number of observations, in contrast to the more con- ventional methods, like multiple linear regression and stepwise multiple regression.20 These important prop- erties are unique to PLS regression, a t least among methods implemented in commercially available soft- ware. PLS was therefore considered the method of choice for o w purposes. The independent variables used to denote and characterize the physicochemical variation in the series of structures investigated in- cluded conventional tabulated QSAR descriptors and also a number of variables obtained from molecular mechanics and semiempirical calculations. A method to generate variables that may account for the influence of directional (rotational) flexibility of molecular sub- units, by means of estimating their relative population at different angular directions, was also employed.21 Another calculated property included was the in vacuo proton affinity at the basic nitrogen atom of the piperi-
dine ring, as well as a t the different aromatic substit- uents.22 Since protonation at these sites is mutually dependent, we included cross product and square terms to better account for the influence of protonation.
Materials and Methods Biology. Synthesis and biological testing protocols
have been reported elsewhere.1° In brief, the in vivo biological activities modeled were the maximum changes (i.e., efficacy) in the biosynthesis of ~-3,6dihydroxyphe- nylalanine (L-DOPA) in the limbic and striatal regions of the rat brain, measured after subsequent treatment with the decarboxylase inhibitor NSD 1015.23 This assay was performed with or without reserpine pre- treatment of the rats.
The pretreatment with reserpine was carried out 18 h prior to administration of the test compound. The values recorded were expressed as percent of controls and selected at a dose where a maximum effect accord- ing to the dose-response curve had been reached (100 pmolkg sc unless otherwise stated). The change in levels of extracellular DA in the striatal region of the rat brain, as measured by microdialysis in the awake and freely moving rat,24 was taken as an estimate of the efficacies of the test compounds (200 pmoykg sc unless otherwise stated) with respect to DA release. Note that the results reported in ref 10 refer to DA levels
3124 Journal of Medicinal Chemistry, 1995, Vol. 38, No. 16 Hansson et al.
ZI 'z, Rl'R2
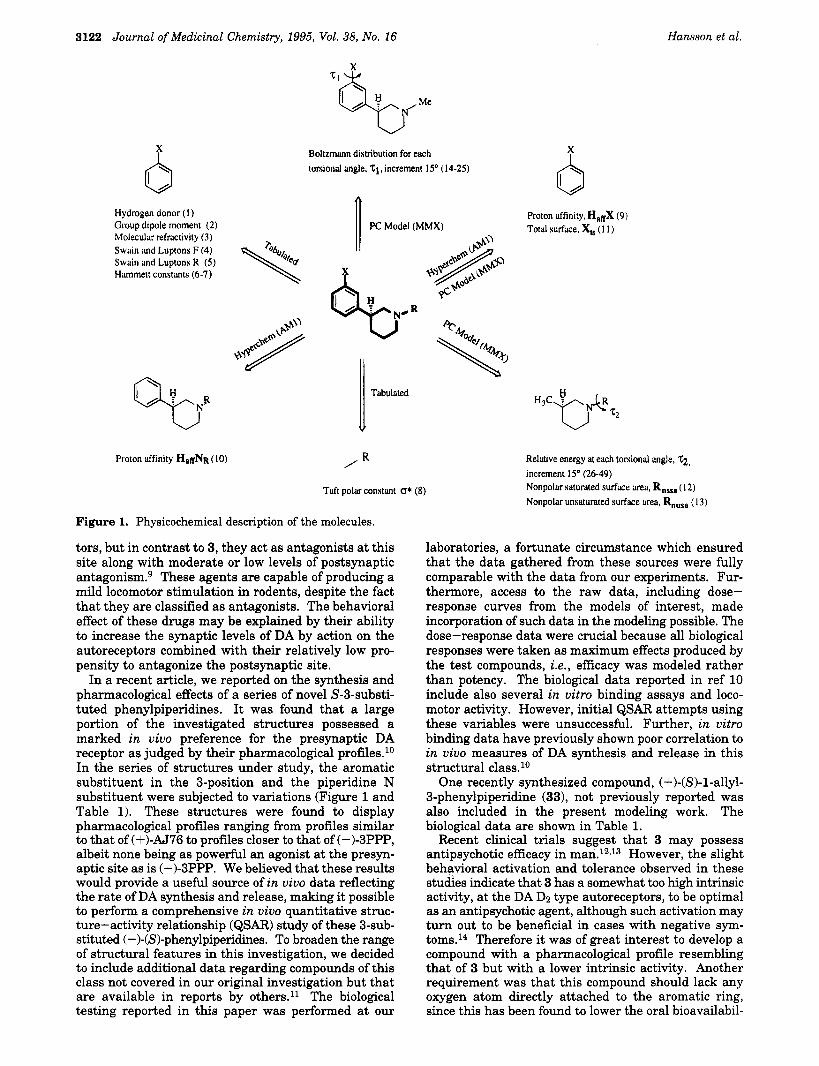
Figure 2. Definitions of torsional angles; tl and t2 = 0".
measured at 60 min, whereas in this investigation the maximum levels were used (20-100 min). The biologi- cal response values are summarized in Table 1. The variation in structural features spanned by the inves- tigated compounds is also presented in this table.
Molecular Mechanics and Semiempirical Cal- culations. The molecular mechanics calculations per- formed in this work employed either the MMX or MM+ force fields as implemented in the PCModel 4.OZ5 and HyperChem 3.0 software,26 respectively. In the dihedral driver computations run for the angles indicated in Figure 2, the MMX force field was employed. The semiempirical (AM11 calculations were performed using HyperChem 3.0. Semiempirical calculations were in all cases preceded by a molecular dynamics heating- cooling sequence (simulated annealingz7) followed by a geometry optimization, in both cases using the MM+ force field. Structure refinements were obtained using a conjugate gradient minimizer according to the Polak- Ribiere method. The convergence criterion was always set to <0.05 kJlA mol. The above calculations were done using an IBM 486 compatible PC.
PLS Regression Modeling. For the computation of PLS regression models, we used the SIMCA-S 5.la software package.z8 All variables used in these com- putations were initially scaled t o zero mean and unit variance (auto scaling). This was followed by an opti- mization of the variable scaling to improve on the predictive properties of the models. (For more details about this procedure, see below.) The statistical sig- nificance of the models obtained was judged by their cross-validated R2 (cumulated Qz or Rzcv based on PRESS statistics) using three different sizes of the cross validation group^.^^^^^ Thus, all calculations were re- peated performing the cross validation with different numbers of observations held-out-at-a-time. The num- ber of observations held-out-at-a-time selected were one (11, two (21, and N13, where N denotes the number of observations in the full dataset. The latter refers to predicting the dependent variable values of an excluded one-third of the observations by the PLS models ob- tained from the remaining two-thirds of the observa- tions. Evaluation of the data-fitting abilities of the models was performed by calculation of the conventional R2. To investigate the sensitivity of the regression coefficients to perturbations (exclusion or inclusion of data), observations (compounds) were excluded until each observation had been excluded exactly once from the original dataset. The resulting N subsets, each consisting of N - 1 observations, were then used to compute N regression submodels, always extracting the same number of PLS components as in the full model. The results from these submodels were then used to obtain estimates of the regression parameters and their errors. The method used here is known as the jack- knife.31 This method has been shown to yield unbiased
estimates of a wide range of statistical parameters regardless of their d i s t r i b u t i ~ n . ~ ~ The jackknife esti- mate of a parameter, 8, is expressed as in formula 1 below, where the 8* denotes the parameter derived from the full dataset and 8i the parameter from the subset where the ith observation has been excluded. Formula 2 below gives the jackknife estimate of the standard error 48). In this formula & denotes the average of the 8is.
The jackknife has been shown to reasonably well approximate the results obtained by the b ~ o t s t r a p , ~ ~ , ~ ~ another method commonly used in this context (i.e., in the QSAR module of Sybil; Tripos Assoc. Inc.). How- ever, we found the former easier t o perform when using software not supporting such procedures for statistical evaluation of regression coefficients. The submodels obtained in the jackknife procedure were also used to make external predictions of the held-out observations from each submodel. In this way, external predictions of all compounds included in the full model were obtained.
To maximize the predictive power of the PLS models, we decided to optimize the independent variable weights. Because PLS regression is scaling dependent, this will directly influence the properties of the independent variables as regressors. In the case of the commonly used unit variance scaling, the variances of all variables are allowed to exert equal influence on the PLS model, including those lacking any relation to the dependent variable which will consequently only introduce noise t o the model. Different approaches to the issue of variable weight optimization have been reported, and some authors have stated that "the best PLS model can only be identified after appropriate ~ c a l i n g " . ~ ~ , ~ ~ In our work, these weights were determined by, as a first step, the assignment of variables sharing some conceptual similarity to blocks where a weight common to all of the variables within each block could be used. This step aimed at reducing the number of weights to be opti- mized to a level where it was practicable t o utilize a statistical experimental plan to investigate their influ- ence on the selected response. In this work we have attempted, throughout, to improve on the predictive properties of the models by maximizing the Rzcv, rather than search for optimum data-fitting abilities. This was accomplished by modeling RZcv as a function of these weights. The variable weights of the different blocks were varied according to the scheme in a Plackett- Burman design in five levels. The weights were varied between 0.15 and 1.85 relative t o the weights corre- sponding to unit variance scaling.36 Although the resolution of the chosen Plackett-Burman design may be too low (resolution 3) for strict optimization purposes, the resulting regression models of the variable weight influence on Rzcv could reveal major trends and were finally used in a series of iterations to establish better conditions. In most cases a weight only slightly offset

QSAR of Meta-Substituted @)-Phenylpiperidines
Table 2. Summary of the Physicochemical Descriptors Used in the PLS Regression Models
Journal of Medicinal Chemistry, 1995, Vol. 38, No. 16 3125
weight variable identity source units group model1 model2 model3
1 2 3 4 5 6 7 8 9
10 11 12
13
14-25
26-49
50 51 52
~ ~~
H-bond donor property of XA (HD) group dipole moment @R) molecular refractivity (MR) Swain and Lupton's F Swain and Lupton's R Hammett constant (u,,,) Hammett constant (up) Taft polar constant (8) proton affinity in gaseous phase (HaffN~) proton affinity in gaseous phase (H,RXA) total vdW surface area of substructure X (XtJ nonpolar saturated vdW surface area
nonpolar unsaturated vdW surface area
relative population of the X substituent at different torsional angels rl(0-165" with
relative energy of the torsional driver for substituent NR at different angels r2 (0-345"
square of variable 9 square of variable 10 cross term (product) of variables 9 and 10
of substructure NR
of substructure NR (kum)
15" increments)
with 15" increments)
tabulated tabulated tabulated tabulated tabulated tabulated tabulated tabulated MM+/AMl MM+/AMl MMX
MMX
MMX
MMX
MMX
debye
kcal/mol !rmol A2
A2
N
N
A B C D D D D E F F G
G
G
H
I
1.50 1.30 0.6 1.85 1.85 1.85 1.85 0 1 1 1
1
1
0.3
0 1 1 1
1.85 1.85 1.00 1.25 1.25 1.25 1.25 0 1 1 0.5
0.5
0.5
0.4
0.9 1 1 1
0 0.9 1.40 0 0 0 0 1.35 0.25 0.25 0.25
0.25
0.25
0
1 1 1 1
from that corresponding to unit variance scaling was found to be the optimum. For full details about the use of statistical experimental design and optimization, see Box et ~ 1 . ~ ~ All above calculations were performed on an IBM 486 compatible PC.
Physicochemical Description of the Molecules. The physicochemical description of the included struc- tures was realized by using tabulated values of com- monly used QSAR descriptor^^^-^^ and by computing different structural properties by means of either mo- lecular mechanics or semiempirical calculations. The variables were choosen as to account thoroughly for electronic, steric, and lipophilic properties of the com- pounds. The variable values were collected from com- putations on different truncated substructural elements of the drugs, as indicated in Figure 1. The backbone was dissected into these elements to keep the compu- tational times within reasonable limits and to make it possible to find relevant tabulated data (ie., ordinary substituent constants of monosubstituted benzenes and aliphatic substituents). No tabulated values of the aromatic group dipole moment ,DR (variable 2) or the molecular refractivity M R (variable 3) of the triflate group are as yet available in the literature. However, these values were approximated by means of PLS models using training sets consisting of a large number of substituents with known values of ,DR and MR, all characterized by several independent variables descrip- tive of charge delocalization and size. A summary of the variables used to describe the physicochemical properties of the 36 compounds investigated is shown in Table 2.
The proton affinities (Hafi) were calculated in ac- cordance with the method described by Dewar et a1.22 using AM1 estimates of the heats of formation for the free base and the protonated base, while this quantity for the proton was an experimentally determined value. The equation below yielded the actual value of the proton affinities.
T w o eets of torsion angle variables were generated by estimating the relative population (from the corre- sponding relative energies) at different angles, using 15" increments and the coarse approximation that only these states were existing.21 The energy was minimized at each increment, using monopole charges for the calculation of the electrostatic energy terms (PCModel default). In the torsional driver calculation on tz, the chair conformation of the piperidine ring with an equatorial methyl group was used. The relative popula- tion at each angle was calculated from Boltzmann's law of distribution at 300 K for tl. It was later found that converting the energies into relative populations offered no advantage over the direct use of relative energies, which were used for t 2 instead of relative populations. The zero angle values of ti and t 2 refer to the eclipsed conformations, as shown in Figure 2. For compounds with an aromatic triflate or mesylate group, a 2D driver was used. In these cases the lowest energy valley was used for the estimation of the relative population at different directions about the 71 torsion. There was one exception in the alignment rule for tl indicated in Figure 2. This was made for the formyl group. In this case the hydrogen was chosen as the reference to obtain coherence over the series, with respect to the more electron dense part of the substituent (mainly carbonyl oxygens and free electron pairs in esters or ethers). The CF3 group of the phenol triflates was, however, consid- ered as bulk in this respect. The size of the van der Waals surfaces was obtained from structures energy minimized by molecular mechanics calculations using the PCModel4.0.
Development of a Compound with a Desired Pharmacological Profile. As mentioned above, we wanted to develop a compound with a rather specific pharmacological profile. The required compound should resemble 3 but with a lower intrinsic activity at the presynaptic autoreceptors (Le., less efficacious in lower- ing the DOPA accumulation in reserpine-pretreated animals). Several possible variations of the aromatic substituent as well as the substituent at the piperidine
3126 Journal of Medicinal Chemistry, 1995, Vol. 38, No. 16
-0.3 -
Hansson et al.
1
Table 3. Results from the Scrambling of the Dependent' Variable When Only Using Variables 14-25 (Model 1) or 26-49 (Model 3) as Regressors
R2, described dependent no. of significant variance (%) in leave-l-out- variable PLS componentsa X Y at-a time
real scramble 1 scramble 2 scramble 3 scramble 4 scramble 5
real scramble 1 scramble 2 scramble 3 scramble 4 scramble 5
1 0 0 0 0 0
l b 0 0 0 0 0
Model 1 Y Data 39.3 50.6 37.7 -0.3 16.4 2.2 6.2 4.4
17.7 6.3 20.3 8.8
42.6 47.7 44.6 32.9 29.7 1.3 41.0 -0.079 11.2 7.2 17.1 21.3
Model 3 Y Data
0.457 -0.144 -0.20 -0.221 -0.199 -0.226
0.298 -0.009 -0.730 -0.383 -0.931 -0.405
a Three PLS components were initially calculated in all cases, regardless of significance. After a nonsignificant second compo- nent, a third significant component was found (when including this component an R2, = 0.613 was obtained). Significant components according to cross validation (individual component R2, I 0.09718).
nitrogen were investigated by making predictions using the models reported below. In these computations it was found that a compound possessing an aromatic 3-flUOrO and an N-n-propyl substituent would satisfac- torily fulfill the stated requirements. Compound 37 was then synthesized to test this assumption.
Results Optimization of Variable Weights. The way by
which the independent variables were divided into nine discrete blocks in the optimization procedure is indi- cated in Table 2, where also the variable weights used for each model are given. After an initial screening in each case it was found that one to three groups could be excluded. This resulted in final optimizations in six to eight groups of variables. Variables not used in a specific model are indicated with 0. This reflects that the initial screening suggested an optimum weight close to 0.
Evaluation of the Torsional Driver Variables. The validity of these variables as descriptors for regres- sion purposes may be questioned due to the somewhat unconventional method used to generate them. To confirm our belief that simple estimates of a relative population at different directions could be useful in the assessment of directional influence on biological re- sponses, we made some brief investigations aimed at revealing whether the predictive power of these vari- ables occurred purely by chance or not. A series of PLS regression analyses were performed on variables 14- 25, using only these variables as regressors with a real or a scrambled dependent variable as regressand. The
Table 4. Statistics of the PLS Regression Models
Regression coefficients Model 1
o'6 1
Regression coefficients Model 2 0.6 1
-0,6 ' I
I 3 5 7 Y I I 13 I5 17 IY 21 23 25 27 29 31 33 35 37 39 41 43 45 47 49 51
OS6 1 Regression coefficients Model 3
T
I 3 5 7 9 I I 13 IS 17 19 21 23 25 27 ZY 31 33 35 37 3Y 41 43 45 47 4Y 51
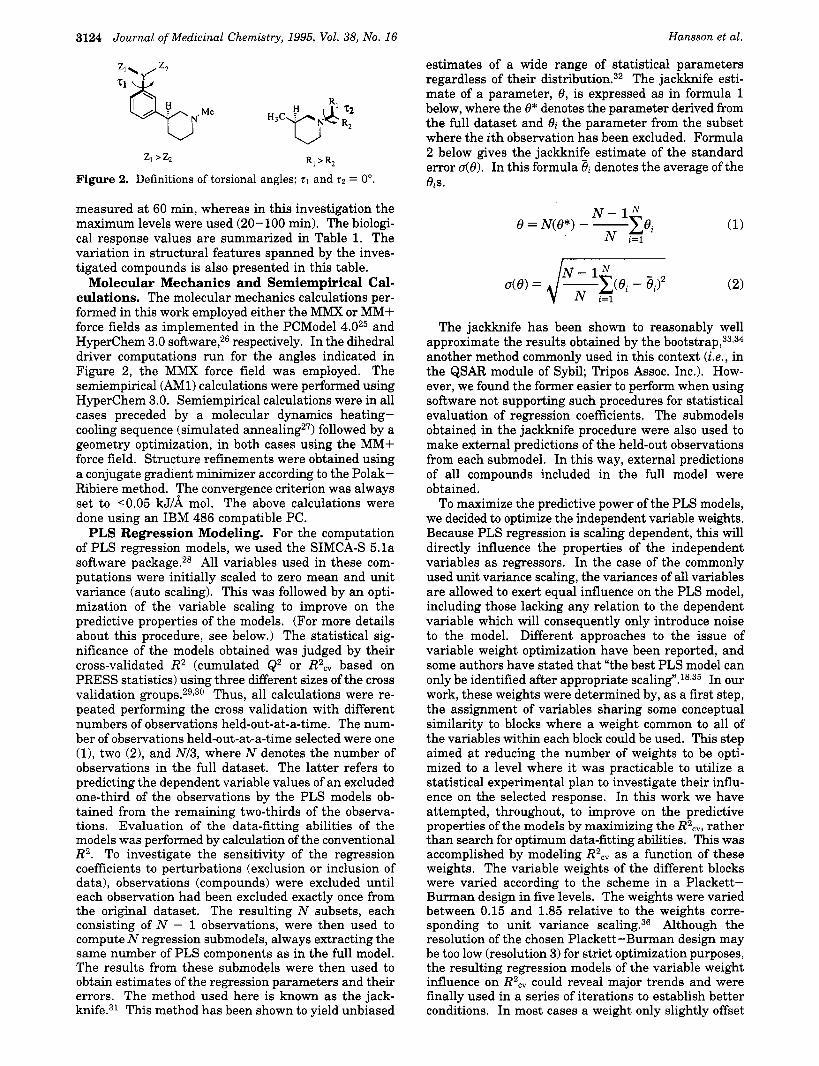
Figure 3. Jackknife estimates of regression coefficients with standard errors from model 1 (DOPA non-pretreated rats), model 2 (DOPA reserpine-treated rats), and model 3 (DA release). The variables used in the models are listed in Table 2.
dependent variable values used here were taken from model 1 (N = 30). The result of this investigation is shown in Table 3. Similarly, we selected a range of compounds (N = 10) from model 3 (only three com- pounds representative of the n-propyl substituent were selected to avoid a strong bias due to overrepresenta- tion) to validate variables 26-49 which were intended to account for the influence of the flexibility of the piperidine N substituent. The outcomes of both experi- ments are shown in Table 3. The cross validation results in this trial indicated that the relations of the independent variables to biological responses are clearly better than chance.
Modeling of DOPA Accumulation in Non-pre- treated Rats (Model 1). Data from the testing of 30 compounds in non-pretreated rats yielded a three- component PLS model which was statistically evaluated according to the methods described above. The inde- pendent variables used in this model are listed in Table
described R2 from external no. ofPLS variance (%) in R2,
model componentsa X Yb leave-1-out-at-a-time leave-2-out-at-a-time leave-AV3-0ut-at-a-time medictions 1 3 68.4 88.0 0.73 2 4 62.1 95.8 0.83 3 5 91.0 95.9 0.721
0.71 0.842 0.763
0.66 0.784 0.856
0.68 0.63" 0.6W
a Significant components according to cross validation (individual component R2, I 0.097). * Identical to conventional R2 x 100. Based on back transformed Y values. R2 = 0.74 if compound 2 is excluded. Based on back transformed Y values. R2 = 0.84 if compound 21 is excluded (see discussion).

QSAR of Meta-Substituted (S)-Phenylpiperidines Journal of Medicinal Chemistry, 1995, Vol. 38, No. 16 3127
330. - - 3 280' U L1
230'
$ 180'
4 8 130- 0
c
8 0 ' 5
30.'
3
30
2 9 a
e. . 26
25 28
i R2 = 0.88 I . .
-20 30 80 130 180 230 280 330
Calculated DOPA acc. ( % of Ctrl.)
. 16
. 13
0 3 21
27 14 2 - 0
29 e 26 28
25 a*
R2 = 0.68
- 2 0 4 . I ' I . I . I . , . , . , ' -20 30 80 130 I80 230 280 330
Externally Predicted DOPA ace. (% of Ctrl.)
A B Figure 4. Calculated and externally predicted vs observed in vivo activities in non-pretreated rats (model 1).
I
4 . 2 1
13 0
14
0 5
7 .I
3 5 . . 2
9 *
34 E :o 3 1
0 1 1
12
R2 =
6 a
0.90
0 20 40 60 80 100 120
Calculated DOPA ace. ( % of Ctrl.) 0 20 40 60 80 100 120
Externally Predicted DOPA ace. ( % of Ctrl.)
A B Figure 5. Calculated and externally predicted vs observed in vivo activities in reserpine-pretreated rats (model 2).
2. The model statistics are summarized in Table 4. In Figure 3 jackknife estimates of the centered and scaled regression coefficients are given with their standard errors. The data fitting and the predictive abilities of the model are displayed in Figure 4A,B, respectively. In this model the three significant components ex- plained 66% (PLSl), 12.7% (PLSB), and 9.3% (PLS3) of the biological response, respectively. The variables found to be most influential in this respect were those describing the electronic interaction between substitu- ent XA and the aromatic system, variables 4-7. These variables alone accounted for 53.7% of the variability in the present data, as evaluated by the VINFM (variable influence on the model) parameter.18 The H-donating ability of XA (variable 1) explained 9.5%, whereas its group dipole moment (variable 2) accounted for 5.4%. An additional description of this response, amounting to ca. 8%, was provided by variables related to calculated basicities (9, 10, and 50-52) at XA and the piperidine nitrogen. The only descriptor related to size found to exert influence here was the unsaturated area at the RN group which was shown to contribute by explaining 7.4% of the variance in DOPA accumulation. Despite that the torsion angle data (14-25) alone were shown to be predictive of the biological response (Table 31, these variables were almost devoid of influence in this model. This discrepancy may at first seem confus-
ing, but a reasonable explanation is presented in the Discussion section.
Modeling of DOPA Accumulation in Reserpine- Pretreated Rats (Model 2). A four-component PLS model was calculated from the data on the 23 com-' pounds investigated in the reserpine-pretreated rat. In this case the logarithm of the dependent variable was used in the PLS regression analysis. The graphs shown refer to back-transformed data (the logarithms of Y converted back to nonlogarithm values). The statistical evaluation of the model is shown in Table 4 and Figure 3. The data fitting and the predictive abilities of the model are displayed in Figure 5A,B, respectively. The four significant components extracted in this model explained 77.8% (PLSl), 9% (PLSB), 6.9% (PLS3), and 2% (PLS4) of the observed variance in the biological response, respectively. Estimates of the fraction of explained variance in Y by the X variables, using the VINFM parameter, revealed that the RN torsional energy descriptors (26-49) had the most profound influence on the biological response. These variables accounted for 48.3% of the Y variable variance, which is in good agreement with the findings reported for model 3 Y data in Table 3 (47.7%). Other descriptors with major impact on the response were those related to the torsion angle of XA (14-26) and those related to electronic effects on the aromatic ring caused by XA (4-
3128 Journal of Medicinal Chemistry, 1995, Vol. 38, No. 16
500 '
400 '
300.
200'
100'
Hansson et al.
3 e 6001 IS
I I
R2 0.96
0 4 . I , . , . , - , . I .
0 100 200 300 400 500 600 700
Calculated DA release (% of Ctrl.)
A
7 0 0 ~ 1 600
5 0. 3 3 0 " 3
32r 0 6 .R
0 )' I 8 ' 0 . * 9
I 4
@ 3 6 23
28 R2 = 0.60
0 4 . I . 1 . I . 1 . I . 1 . I 0 100 200 300 400 500 600 700
Externally Predicted DA Release (A of Ctrl.)
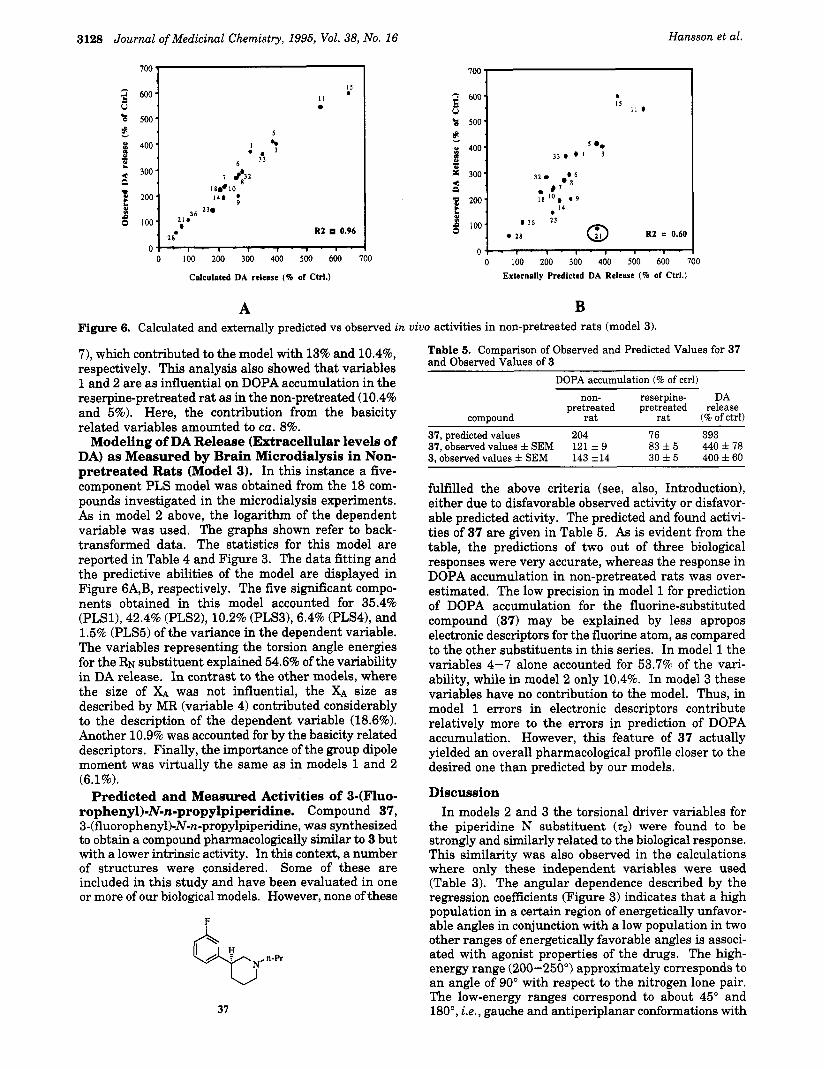
B Figure 6. Calculated and externally predicted vs observed in vivo activities in non-pretreated rats (model 3).
7), which contributed to the model with 13% and 10.4%, respectively. This analysis also showed that variables 1 and 2 are as influential on DOPA accumulation in the reserpine-pretreated rat as in the non-pretreated (10.4% and 5%). Here, the contribution from the basicity related variables amounted to ca. 8%.
Modeling of DA Release (Extracellular levels of DA) as Measured by Brain Microdialysis in Non- pretreated Rats (Model 3). In this instance a five- component PLS model was obtained from the 18 com- pounds investigated in the microdialysis experiments. As in model 2 above, the logarithm of the dependent variable was used. The graphs shown refer to back- transformed data. The statistics for this model are reported in Table 4 and Figure 3. The data fitting and the predictive abilities of the model are displayed in Figure 6A,B, respectively. The five significant compo- nents obtained in this model accounted for 35.4% (PLSl), 42.4% (PLSB), 10.2% (PLS3), 6.4% (PLS41, and 1.5% (PLS5) of the variance in the dependent variable. The variables representing the torsion angle energies for the RN substituent explained 54.6% of the variability in DA release. In contrast to the other models, where the size of XA was not influential, the XA size as described by MR (variable 4) contributed considerably to the description of the dependent variable (18.6%). Another 10.9% was accounted for by the basicity related descriptors. Finally, the importance of the group dipole moment was virtually the same as in models 1 and 2 (6.1%).
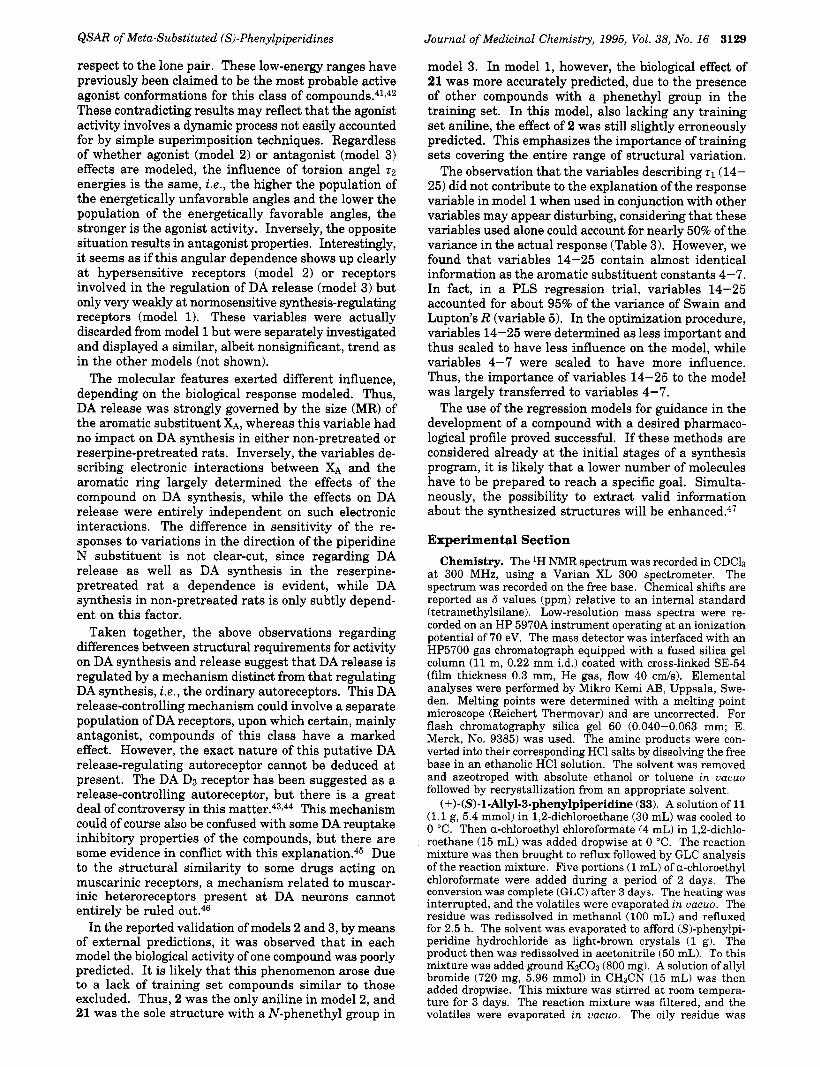
Predicted and Measured Activities of 3-(Nuo- ropheny1)-N-n-propylpiperidine. Compound 37, 3-(fluorophenyl)-N-n-propylpiperidine, was synthesized to obtain a compound pharmacologically similar to 3 but with a lower intrinsic activity. In this context, a number of structures were considered. Some of these are included in this study and have been evaluated in one or more of our biological models. However, none of these
37
Table 5. Comparison of Observed and Predicted Values for 37 and Observed Values of 3
DOPA accumulation (% of ctrl) non- reserpine- DA
pretreated pretreated release compound rat rat (% of ctrl)
37, observed values 5 SEM 121 1 9 83f5 440f78 3, observed values ?L SEM 143 114 30f5 400160
37, predicted values 204 76 393
fulfilled the above criteria (see, also, Introduction), either due to disfavorable observed activity or disfavor- able predicted activity. The predicted and found activi- ties of 37 are given in Table 5. As is evident from the table, the predictions of two out of three biological responses were very accurate, whereas the response in DOPA accumulation in non-pretreated rats was over- estimated. The low precision in model 1 for prediction of DOPA accumulation for the fluorine-substituted compound (37) may be explained by less apropos electronic descriptors for the fluorine atom, as compared to the other substituents in this series. In model 1 the variables 4-7 alone accounted for 53.7% of the vari- ability, while in model 2 only 10.4%. In model 3 these variables have no contribution to the model. Thus, in model 1 errors in electronic descriptors contribute relatively more to the errors in prediction of DOPA accumulation. However, this feature of 37 actually yielded an overall pharmacological profile closer to the desired one than predicted by our models.
Discussion In models 2 and 3 the torsional driver variables for
the piperidine N substituent (z2) were found to be strongly and similarly related to the biological response. This similarity was also observed in the calculations where only these independent variables were used (Table 3). The angular dependence described by the regression coefficients (Figure 3) indicates that a high population in a certain region of energetically unfavor- able angles in conjunction with a low population in two other ranges of energetically favorable angles is associ- ated with agonist properties of the drugs. The high- energy range (200-250") approximately corresponds t o an angle of 90" with respect to the nitrogen lone pair. The low-energy ranges correspond to about 45" and 180", i.e., gauche and antiperiplanar conformations with
QSAR of Meta-Substituted (S)-Phenylpiperidines
respect to the lone pair. These low-energy ranges have previously been claimed to be the most probable active agonist conformations for this class of compound^.^^,^^ These contradicting results may reflect that the agonist activity involves a dynamic process not easily accounted for by simple superimposition techniques. Regardless of whether agonist (model 2) or antagonist (model 3) effects are modeled, the influence of torsion angel z2
energies is the same, i.e., the higher the population of the energetically unfavorable angles and the lower the population of the energetically favorable angles, the stronger is the agonist activity. Inversely, the opposite situation results in antagonist properties. Interestingly, it seems as if this angular dependence shows up clearly at hypersensitive receptors (model 2) or receptors involved in the regulation of DA release (model 3) but only very weakly at normosensitive synthesis-regulating receptors (model 1). These variables were actually discarded from model 1 but were separately investigated and displayed a similar, albeit nonsignificant, trend as in the other models (not shown).
The molecular features exerted different influence, depending on the biological response modeled. Thus, DA release was strongly governed by the size (MR) of the aromatic substituent XA, whereas this variable had no impact on DA synthesis in either non-pretreated or reserpine-pretreated rats. Inversely, the variables de- scribing electronic interactions between XA and the aromatic ring largely determined the effects of the compound on DA synthesis, while the effects on DA release were entirely independent on such electronic interactions. The difference in sensitivity of the re- sponses t o variations in the direction of the piperidine N substituent is not clear-cut, since regarding DA release as well as DA synthesis in the reserpine- pretreated rat a dependence is evident, while DA synthesis in non-pretreated rats is only subtly depend- ent on this factor.
Taken together, the above observations regarding differences between structural requirements for activity on DA synthesis and release suggest that DA release is regulated by a mechanism distinct from that regulating DA synthesis, i .e., the ordinary autoreceptors. This DA release-controlling mechanism could involve a separate population of DA receptors, upon which certain, mainly antagonist, compounds of this class have a marked effect. However, the exact nature of this putative DA release-regulating autoreceptor cannot be deduced at present. The DA D3 receptor has been suggested as a release-controlling autoreceptor, but there is a great deal of controversy in this matter.43,44 This mechanism could of course also be confused with some DA reuptake inhibitory properties of the compounds, but there are some evidence in conflict with this e ~ p l a n a t i o n . ~ ~ Due to the structural similarity to some drugs acting on muscarinic receptors, a mechanism related to muscar- inic heteroreceptors present at DA neurons cannot entirely be ruled
In the reported validation of models 2 and 3, by means of external predictions, it was observed that in each model the biological activity of one compound was poorly predicted. It is likely that this phenomenon arose due to a lack of training set compounds similar to those excluded. Thus, 2 was the only aniline in model 2, and 21 was the sole structure with a N-phenethyl group in
Journal of Medicinal Chemistry, 1995, Vol. 38, No. 16 3129
model 3. In model 1, however, the biological effect of 21 was more accurately predicted, due to the presence of other compounds with a phenethyl group in the training set. In this model, also lacking any training set aniline, the effect of 2 was still slightly erroneously predicted. This emphasizes the importance of training sets covering the entire range of structural variation.
The observation that the variables describing zl(14- 25) did not contribute to the explanation of the response variable in model 1 when used in conjunction with other variables may appear disturbing, considering that these variables used alone could account for nearly 50% of the variance in the actual response (Table 3). However, we found that variables 14-25 contain almost identical information as the aromatic substituent constants 4-7. In fact, in a PLS regression trial, variables 14-25 accounted for about 95% of the variance of Swain and Lupton's R (variable 5). In the optimization procedure, variables 14-25 were determined as less important and thus scaled to have less influence on the model, while variables 4-7 were scaled to have more influence. Thus, the importance of variables 14-25 to the model was largely transferred to variables 4-7.
The use of the regression models for guidance in the development of a compound with a desired pharmaco- logical profile proved successful. If these methods are considered already at the initial stages of a synthesis program, it is likely that a lower number of molecules have to be prepared to reach a specific goal. Simulta- neously, the possibility to extract valid information about the synthesized structures will be enhanced.47
Experimental Section Chemistry. The lH NMR spectrum was recorded in CDC13
at 300 MHz, using a Varian XL 300 spectrometer. The spectrum was recorded on the free base. Chemical shifts are reported as 6 values (ppm) relative to an internal standard (tetramethylsilane). Low-resolution mass spectra were re- corded on an HP 5970A instrument operating a t an ionization potential of 70 eV. The mass detector was interfaced with an HP5700 gas chromatograph equipped with a fused silica gel column (11 m, 0.22 mm i.d.1 coated with cross-linked SE-54 (film thickness 0.3 mm, He gas, flow 40 c d s ) . Elemental analyses were performed by Mikro Kemi AB, Uppsala, Swe- den. Melting points were determined with a melting point microscope (Reichert Thermovar) and are uncorrected. For flash chromatography silica gel 60 (0.040-0.063 mm; E. Merck, No. 9385) was used. The amine products were con- verted into their corresponding HC1 salts by dissolving the free base in an ethanolic HC1 solution. The solvent was removed and azeotroped with absolute ethanol or toluene in uacuo followed by recrystallization from an appropriate solvent. (+)-(S)-l-Allyl-3-phenylpiperidine (33). A solution of 11
(1.1 g, 5.4 mmol) in 1,2-dichloroethane (30 mL) was cooled to 0 "C. Then a-chloroethyl chloroformate (4 mL) in 1,2-dichlo- roethane (15 mL) was added dropwise a t 0 "C. The reaction mixture was then brought to reflux followed by GLC analysis of the reaction mixture. Five portions (1 mL) of a-chloroethyl chloroformate were added during a period of 2 days. The conversion was complete (GLC) after 3 days. The heating was interrupted, and the volatiles were evaporated in vacuo. The residue was redissolved in methanol (100 mL) and refluxed for 2.5 h. The solvent was evaporated to afford (SI-phenylpi- peridine hydrochloride as light-brown crystals (1 g). The product then was redissolved in acetonitrile (50 mL). To this mixture was added ground Kzco3 (800 mg). A solution of allyl bromide (720 mg, 5.96 mmol) in CH&N (15 mL) was then added dropwise. This mixture was stirred a t room tempera- ture for 3 days. The reaction mixture was filtered, and the volatiles were evaporated in uacuo. The oily residue was
3130 Journal of Medicinal Chemistry, 1995, Vol. 38, No. 16
chromatographed on a silica gel column with Me0H:CHzClz (1:9, v/v) as eluent. Collection of the fractions containing pure product followed by evaporation of the solvent afforded pure 33 (430 mg, 42%). The amine was converted into its hydro- chloride salt and recrystallized from ethanolhopropyl ether: mp 190-194 "C; 'H NMR (300 MHz, CDC13) 6 1.45 (qd, J = 12.8, 2.7 Hz, 1 H), 1.65-2.0 (m, 5 H), 2.8 (t t , J = 11.8,3.7 Hz, 1 H), 3.0-3.1 (m, 4 H), 5.1-5.2 (m, 2 H), 5.9 (m, 1 HI, 7.44-7.6 (m, 4 H); MS m / z (re1 intensity, 70 eV) 201.15 (M+, 361,200.15 (231, 104.1 (241, 91.1 (251, 84.10 (100); [aIz0~ + 0.3" (C 1.0, MeOH). Anal. ( C ~ ~ H Z O N ~ C I ) C, H, N. (-)-(S)-3-(3-Fluorophenyl)-l-propylpiperidine (37). A
solution of 2 (550 mg, 2.39 mmol), concentrated HCl(660 pL), and water (4.4 mL) was cooled to 0 "C. Then a solution (515 pL) of NaNOz (2.9 g) in water (7.5 mL) was added in one portion. The mixture was stirred for 2.5 h at 0 "C, and then HPFs (1.1 mL 65%) was added dropwise. The reaction mixture was evaporated in U ~ C U O (1 mmHg) overnight to remove all volatiles. The residue was then heated to 190 "C for 30 min under an argon atmosphere. The oily residue was dissolved in a mixture of water (100 mL), concentrated hydrochloride (2 mL), and then stirred for 30 min. The acidic water solution was basified with 10% sodium carbonate solution. The result- ing water mixture was extracted several times with dichlo- romethane. The extract was dried (MgS04), filtered, and evaporated to dryness. The oily residue was chromatographed on a silica gel column with Me0H:CHZClz (1:19, v/v) as eluent. Collection of the fractions containing pure product and evapo- ration of the solvent afforded pure 37 (225 mg, 42%). The amine was converted into its hydrochloride salt and recrystal- lized from ethanollisopropyl ether. The racemic compound has been reported earlier:48 mp 210-212 "C (HC1); [alz0~ -6.7" (c 1.0, MeOH). Anal. (C14H21F1N1Cll) C, H, N.
Acknowledgment. The financial support provided by the Upjohn Co., Kalamazoo, MI, is gratefully ac- knowledged. We also thank Kirsten Sonniksen, Lena Wolter, Lena Lofberg, and Aqa Schedwin for their work with biochemical and microdialysis experiments and HPLC analysis.
Supporting Information Available: All calculated and tabulated values for each object (16 pages). Ordering informa- tion is given on any current masthead page.
References (1) Strombom, U. Catecholamine Receptor Agonists: Effects on
Motor Activity and Rate of Tyrosine Hydroxylation in Mouse Brain. Naunyn-Schmiedeberg' Arch. Pharmucol. 1976,292,167- 176.
(2) Di Chiara, G.; Porceddu, M. L.; Vargiu, L.; Argiolas, A.; Gessa, G. L. Evidence for dopamine receptors mediating sedation in the mouse brain. Nature 1976,264, 564-567.
(3) Carlsson, A. Dopaminergic Autoreceptors. In Chemical Tools in Catecholamine Research; Almgren, O., Carlsson, A., Engel, J., Eds.; North-Holland Publishing Co.: Amsterdam, The Nether- lands, 1975; pp 219-225.
(4) Di Chiara, G.; Porceddu, M. L.; Spano, P. F.; Gessa, G. L. Haloperidol increases and apomorphine decreases striatal dopa- mine metabolism after destruction of striatal dopamine-sensitive adenylate cyclase by kainic acid. Brain Res. 1977, 130, 374- 382.
(5) Hjorth, S.; Carlsson, A.; Clark, D.; Svensson, K.; Wikstrom, H.; Sanchez, D.; Lindberg, P.; Hacksell, U.; Arvidsson, L.-E.; Jo- hansson, A,; Nilsson, J . L. G. Central Dopamine Receptor Agonist and Antagonist Actions of the Enantiomers of 3-PPP. Psychopharmacology 1983, 81, 89-99.
(6) Clark, D.; Hjorth, S.; Carlsson, A. Dopamine Receptor Ago- nists: Mechanism Underlying Autoreceptor Selectivity. I Review of the Evidence. J . Neural Transm. 1985, 62, 1-52.
(7) Clark, D.; Hjorth, S.; Carlsson, A. Dopamine Receptor Ago- nists: Mechanism Underlying Autoreceptor Selectivity. I1 Theo- retical Considerations. J . Neural Transm. 1985, 62, 171-207.
(8) Johansson, A. M.; Arvidsson, L.-E.; Hacksell, U.; Nilsson, L. G.; Svensson, K.; Hjorth, S.; Clark, D.; Carlsson, A,; Sanchez, D.; Andersson, B.; Wikstrom, H. Novel Dopamine Receptor Agonists and Antagonists with Preferential Action on Autoreceptors. J . Med. Chem. 1985,28, 1049-1053.
(9) Svensson, K.; Johansson, A. M.; Magnusson, T.; Carlsson, A. (+I- AJ 76 and (+)-UH 232: Central Stimulants Acting as Prefer- ential Dopamine Autoreceptor Antagonists. Naunyn-Schmiede- bergs Arch. Pharmacol. 1986, 334, 234-245.
Hansson et al.
(10) Sonesson, C.; Lin, C.-H.; Hansson, L.; Waters, N.; Svensson, K.; Carlsson, A.; Smith, M. W.; Wikstrom, H. Substituted (SI- Phenylpiperidines and Rigid Congeners as Preferential Dopa- mine Autoreceptor Antagonists: Synthesis and Structure-Activ- ity Relationships. J. Med. Chem. 1994, 37, 2735-2753.
(11) Wikstrom, H.; Sanchez, D.; Lindberg, P.; Hacksell, U.; Arvidsson, L.-E.; Johansson, A.; Thorberg, S.-0.; Nilsson, J. L. G.; Svensson, K.; Hjorth, S.; Clark, D.; Carlsson, A. Resolved 343-hydroxyphe- ny1)-N-n-propylpiperidine, 3-PPP and its Analogues: Central Dopamine Receptor Activity. J . Med. Chem. 1984, 27, 1030- 1036.
(12) Tamminga, C. A.; Cascella, N. G.; Lahti, R. A,; Lindberg, M.; Carlsson, A. Pharmacological Properties of (-)-3PPP (preclamol) in Man. J . Neural Transm., G'en. Sect. 1992,88, 165-175.
(13) Lahti, A. C.; Albert, P. K; Warfel, D. T.; Lahti, R. A,; Tamminga, C. A. Novel Antidopaminergic Strategies for the Treatment of Schizophrenia. Schizophr. Res. 1995, 15, 157.
(14) Prof. Arvid Carlsson, personal communication. (15) Thorberg, S.-0.; Berg, S.; Lundstrom, J.; Pettersson, B.; Wijk-
stram. A.: Sanchez. D.: Lindbere. P.: Nilsson. J. L. G. Carbamate Ester' Derivatives' as' Potentiil Prodrugs of the Presynaptic Dopamine Autoreceptor Agonist (-)-3-(3-Hydroxyphenyl)-N-pro- pylpiperidine. J. Med. Chem. 1987, 30, 2008-2012. Norinder, U.; Hogberg, T. A Quantitative Structure-Activity Relationship for some Dopamine Dz Antagonists of Benzamide Type. Acta Pharm. Nord. 1992,4, 73-78. de Paulis, T. Quantitative Structure-Affinity Relationships of Dopamin Dz Receptor Antagonists: A Comparison between Orthopramides and 6-Methoxysalicylamides. Helu. Chim. Acta
Davies, A. M.; Gensmantel, N. P.; Johansson, E.; Marriott, D. P. The Use of GRID Program in the 3-D QSAR Analysis of a Series of Calcium-Channel Agonists. J . Med. Chem. 1994, 37,
Topliss, J . G.; Edwards, R. P. Chance Factors in Studies of Quantitative Structure-Activity Relationships. J . Med. Chem. 1979,22, 1238-1244. Clark, M.; Cramer, R. D., 111. The Probability of Chance Correlation Using Partial Least Squares (PLS). Quant. Struct: Act. Relat. 1993, 12, 137-145. Hansson, L. 0.; Ennis, M. D.; Stjernlof, P. Structure-Activity Relationships in the 8-Amino-6,7,8,9-tetrahydro-3H-benzo[el- indole Ring System. Part 111: QSAR Analysis of Serotonin B-HT~A Effects In Vivo and In Vitro by Means of Partial Least Squares Regression (PLS). Manuscript in preparation. Dewar, M. J. S.; Dieter, K. M. Evaluation of AM1 Calculated Proton Affinities and Deprotonation Enthalpies. J . Am. Chem.
Carlsson, A.; Davis, J. N.; Kehr, W.; Lindqvist, M.; Atack, C. V. Simultaneous Measurement of Tyrosine and Tryptophan Hy- droxylase Activities in Brain in Vivo Using an Inhibitor of the Aromatic Amino Acid Decarboxylase. Naunyn-Schmiedebergs Arch. Pharmacol. 1972,275, 153-168. Waters, N.; Lagerkvist, S.; Lofoerg, L.; Piercey, M.; Carlsson, A. The Dopamine D3 Receptor and Autoreceptor Preferring Antagonists (+)-AJ76 and (+)-UH232; a Microdialysis Study. Eur. J . Pharmacol. 1993,242, 151-163. Version 4.0 PCModel, Serena Software, Bloomington, IN. Version 3.0 Hyperchem, Autodesk Inc., Sausalito, CA. Mager, P. P. A2 agonist: Structure-Activity Relationships of 2-(Cycloalkylalkyny1)-adenosine Derivatives. Eur. J. Med. Chem.
1991, 74, 241-253.
963-972.
SOC. 1986,108, 8075-8086.
1994,29, 369-380. Version 5.la SIMCA-S. Umetri AB. Umei, Sweden. Wold, S. Cross-Validatory Estimation of the Number of Com- ponents in Factor and Principal Components Models. Techno- metrics 1978, 20, 397-405. Cramer, R. D., 111; Bunce, J . D.; Patterson, D. E.; Frank, I. E. Crossvalidation, Bootstrapping, and Partial Least Squares Compared with Multiple Regression in Conventional QSAR Studies. Quant. Struct.-Act. Relat. 1988, 7, 18-25. Miller, R. G. The Jackknife-a Review. Biometrika 1974,61,1-16. Miller, R. G. A Trustworthy Jackknife. Ann. Math. Stat. 1964, 35, 1594-1605. Efron, B. Bootstrap Methods: Another Look at the Jackknife. Ann. Stat. 1979, 7; 1-26. Diaconis, P.; Efron, B. Computer-Intensive Methods in Statistics. Sci. Am. 1983,248, 96-108. Cruciani, G.; Watson, K. A. Comparative Molecular Field Analysis Using GRID Force-Field and GOLPE Variable Selection Methods in a Study of Inhibitors of Glycogen Phosphorylase b. J. Med. Chem. 1994,37, 2589-2601. Wold, S.; Dum, W. J., 111; Hellberg, S. Pattern Recognition as a Tool for Drug Design. In Drug Design, Fact or Fantasy; Jolles, G., Wooldridge, K. R. H., Eds.; Academic Press: London, 1984; pp 95-117. Box, G. E. P.; Hunter, W. G.; Hunter, J . S. Statistics for Exper- imenters: A n Introduction to Design, Data Analysis, and Model
QSAR of Meta-Substituted (S)-Phenylpiperidines
Building; John Wiley & Sons, Inc.: New York, 1978. (38) Hansch, C.; Leo, A.; Taft, R. W. A Survey of Hammett Substitu-
ent Constants and Resonance and Field Parameters. Chem. Rev. 1991,91, 165-195.
(39) Lien, E. J.; Guo, Z.-R.; Li, R.-L.; Su, C.-T. Use of Dipole Moment as a Parameter in Drug-Receptor Interaction and Quantitative Structure-Activity Relationship Studies. J. Pharm. Sci. 1082,
(40) Takayama, C.; Fujita, T.; Nakajima, M. Quantitative Separation of Electronic and Steric Substituent Effects in Reactions between Aliphatic Amines and Electronic Acceptors. J. Org. Chem. 1079, 44, 2871-2879.
(41) Liljefors, T.; Wikstrom, H. A Molecular Mechanics Approach to the Understanding of Presynaptic Selectivity for Centrally Acting Dopamine Receptor Agonists of the Phenylpiperidine Series. J. Med. Chem. 1986,29, 1896-1904.
(42) Liljefors, T.; Bogeso, K. P.; Hyttel, J.; WikstrBm, H.; Svensson, K.; Carlsson, A. Pre- and Postsynaptic Dopaminergic Activities of Indolizidine and Quinolizidine Derivatives of 343-Hydroxy- phenyl)-N-(n-propy1)piperidine (3-PPP). Further Developments
71, 641-655.
Journal of Medicinal Chemistry, 1995, Vol. 38, No. 16 3131
of a Dopamine Receptor Model. J. Med. Chem. 1990,33,1015- 1022.
(43) Schwartz, J.-C.; Levesque, D.; Martres, M. P.; Sokoloff, P. Dopamine D3 Receptor: Basic and Clinical Aspects. Clin. Neu- mpharmacol. 1993,16,295-314.
(44) Waters, N.; Svensson, K.; Haadsma-Svensson, S. R.; Smith, M. W.; Carlsson, A. The Dopamine D3-Receptor: a Postsynaptic Receptor Inhibitory on Rat Locomotor Activity. J. Neural Tmnsm., Gen. Sect. 1993, 94, 11-19.
(45) Waters, N.; et al. Manuscript in preparation. (46) Nordvall, G. Muscarinic Receptors: Interactions with Agonists
and Antagonists. Doctoral Thesis, University of Uppsala, Swe- den, ISBN 91-554-3400-2, 1994.
(47) Hellberg, S. A multivariate approach to QSAR. Doctoral Thesis, UmeA University, ISBN 91-7174-236-0, 1986.
(48) Hacksell, U.; Arvidsson, L.-E.; Svensson, U.; Nilsson, L. G.; Sanchez, D.; Wikstrom, H.; Lindberg, P.; Hjorth, S.; Carlsson, A. 3-Phenylpiperidines. Central Dopamine-Autoreceptor Stimu- lating Activity. J. Med. Chem. 1981,24, 1475-1482.
JM9500941
Copyright © 2022 FDOKUMEN


![Non-amine dopamine transporter probe [3H]tropoxene distributes to dopamine-rich regions of monkey brain](https://static.fdokumen.com/doc/165x107/63224d2f050768990e0fcb6c/non-amine-dopamine-transporter-probe-3htropoxene-distributes-to-dopamine-rich.jpg)