Self-triggering reaction kinetics between nitrates and aluminium powder
Upload
independentCategory
view
3download
0
Identifying a rainfall event threshold triggering
herbicide leaching by preferential flow
G. S. McGrath,1 C. Hinz,1 M. Sivapalan,2,3,4 J. Dressel,5,6 T. Putz,5 and H. Vereecken5
Received 5 October 2008; revised 1 September 2009; accepted 11 September 2009; published 16 February 2010.
[1] How can leaching risk be assessed if the chemical flux and/or the toxicity is highlyuncertain? For many strongly sorbing pesticides it is known that their transport throughthe unsaturated zone occurs intermittently through preferential flow, triggered bysignificant rainfall events. In these circumstances the timing and frequency of theserainfall events may allow quantification of leaching risk to overcome the limitations offlux prediction. In this paper we analyze the leaching behavior of bromide and twoherbicides, methabenzthiazuron and ethidimuron, using data from twelve uncroppedlysimeters, with high-resolution climate data, in order to identify the rainfall controls onrapid solute leaching. A regression tree analysis suggested that a coarse-scale fortnightlyto monthly water balance was a good predictor of short-term increases in drainage andbromide transport. Significant short-term herbicide leaching, however, was betterpredicted by the occurrence of a single storm with a depth greater than a 19 mm threshold.Sampling periods where rain events exceeded this threshold accounted for between38% and 56% of the total mass of herbicides leached during the experiment. Thesame threshold only accounted for between 1% and 10% of the total mass of bromideleached. On the basis of these results, we conclude that in this system, the leaching risks ofstrongly sorbing chemicals can be quantified by the timing and frequency of theselarge rainfall events. Empirical and modeling approaches are suggested to apply thisfrequentist approach to leaching risk assessment to other soil-climate systems.
Citation: McGrath, G. S., C. Hinz, M. Sivapalan, J. Dressel, T. Putz, and H. Vereecken (2010), Identifying a rainfall event threshold
triggering herbicide leaching by preferential flow, Water Resour. Res., 46, W02513, doi:10.1029/2008WR007506.
1. Introduction
[2] If asked to characterize the risk of pesticide move-ment to groundwater, there are two aspects one shouldconsider. The first is the consequences of the application.Most modeling and field studies consider this aspect, asthey focus on the prediction or measurement of the concen-tration which reaches a certain depth. However, low con-centrations of a chemical can potentially pose a risk [Hayeset al., 2003], the toxicity is often uncertain [McCarty andBorgert, 2006], and model predictions of the concentrationare often highly uncertain [Giambelluca et al., 1996].Therefore, there appears to be a need for alternatives toflux prediction for risk assessment.[3] Some modeling studies consider the second compo-
nent of a risk matrix (Table 1), the likelihood. However, those
modeling studies focus on deriving probability distributionsof leached amounts, and therefore suffer the same limita-tions just described. No studies have yet considered thefrequency of leaching events as a possible measure ofleaching risk. This is relevant for many pesticides andmetals which strongly sorb to the soil as there is asignificant body of evidence which indicates that they aretransported predominantly through fast flow pathways,such as surface runoff and preferential flow episodically,during discrete rainfall events [Leonard, 1990; Flury, 1996;Kladivko et al., 2001]. Therefore, knowledge of the fre-quency of these events and their timing with respect tochemical application may provide a hitherto neglectedopportunity to quantify leaching risk.[4] In the unsaturated zone these rapid flow pathways
often consist of biopores, structural voids and texturalheterogeneities. The triggering of flow through these macro-pores occurs when the rainfall intensity exceeds the infil-tration capacity of the surrounding soil matrix or when thesoil wets sufficiently to fill the largest pores [Beven andGermann, 1982]. These thresholds are why pesticide leach-ing appears episodic, as not every rainfall event will triggerrapid preferential flow. Another important consideration isthat the water in preferential flow pathways needs to haveinteracted significantly with the soil matrix where thepesticides reside. For those pesticides which strongly sorbto soil this is often near the soil surface [Flury, 1996; Allaireet al., 2002]. Rapid pesticide transport associated withmacropore flow is therefore driven by the upper boundary
1School of Earth and Environment, University of Western Australia,Crawley, Western Australia, Australia.
2Centre for Water Research, University of Western Australia, Crawley,Western Australia, Australia.
3Department of Water Management, Faculty of Civil Engineering andGeosciences, Delft University of Technology, Delft, Netherlands.
4Department of Geography and Department of Civil and EnvironmentalEngineering, University of Illinois at Urbana-Champaign, Urbana, Illinois,USA.
5Agrosphere, ICG-4, Forschungszentrum Julich GmbH, Julich, Germany.6Now at BASF SE, Limburgerhof, Germany.
Copyright 2010 by the American Geophysical Union.0043-1397/10/2008WR007506$09.00
W02513
WATER RESOURCES RESEARCH, VOL. 46, W02513, doi:10.1029/2008WR007506, 2010ClickHere
for
FullArticle
1 of 12
condition, in particular rainfall events which cause thesethresholds to be exceeded.[5] Recently the structure of rainfall has begun to be
included within a developing theory of preferential flow andpesticide leaching [Heppell et al., 2002; Malone et al.,2004; Struthers et al., 2007; McGrath et al., 2007, 2008a,2008b; Nolan et al., 2008]. Heppell et al. [2002] usedrepeated applications of a mobile tracer at the soil surface toidentify a combination of rain event duration and rain eventintensity as controls on the amount of preferential flowoccurring in a heavy clay soil. The distribution of rainfallwithin an event is also known to have a significant impactupon the amount of chemical preferentially transported[Malone et al., 2004; McGrath et al., 2008a]. Nolan et al.[2008] recently conducted classification and regression treeanalysis of modeled pesticide transport to evaluate the roleof various climatic factors. They found that both short, i.e.,large rain events shortly after application, and long timescale, i.e., seasonality in climate, controlled leachedamounts. For large cumulative leaching they also foundseasonal rainfall thresholds as a control in association withclay content. The role of individual events or the frequencyof preferential flow events was not assessed. These studiessuggest that with knowledge of the statistical properties ofrainfall, which trigger preferential flow, we may be able topredict how and when different soils vary in their suscep-tibility to rapid pesticide transport. Experimental studieshowever, have so far failed to quantify the rain eventcontrols on pesticide transport [Flury, 1996; Kladivko etal., 2001]. In this paper we seek to quantify those rainevents by applying a novel analysis of a high-qualityherbicide leaching experiment. The experiment entailed a3 year lysimeter monitoring program, measuring the trans-port of two herbicides: methabenzthiazuron (MBT) (CAS18691-97-9), isotope labeled ethidimuron (ETD) (CAS30043-49-3), and a bromide tracer [Dressel, 2003]. Prefer-ential flow has been established as a significant componentof the water balance [Kasteel et al., 2006] and to rapidlytransport pesticides [Putz et al., 1998] in the soils used inthis experiment.[6] As bromide is very mobile and will be rapidly moved
below the surface of the soil, we expect that in the dynamicsof transport, the effect of fluctuations of rainfall at the upperboundary will be significantly dampened. Therefore, coarseresolution rainfall and average water balance statistics willdescribe its transport. The herbicides however stronglyadsorb to the soil, and will persist near the soil surface formuch longer. Previous modeling has demonstrated that inthe absence of preferential flow the herbicides are notexpected to be transported through the lysimeter during
the experiment [Dressel, 2003]. Therefore, given the prox-imity of these chemicals to the upper boundary and thethresholds required to trigger rapid preferential flow nearthe soil surface, we hypothesize that rainfall statistics whichreflect intense rain events will predict the occurrence ofpotentially significant herbicide leaching periods.[7] Rainfall is characterized here by indicators such as
rainfall event properties such as the interstorm period, stormduration and storm intensity as well as time averaged rainfallintensities for various intervals ranging from 10 minutes upto the temporal resolution of solute flux measurementswhich ranges from 2 weeks to 2 months. Using regressiontree analysis these storm and rainfall resolution statistics arerelated to the water flow and solute transport observed in theexperiment. The data-based approach was adopted in orderto identify the rainfall controls, independent of any hydro-logical model structures. The paper is organized as follows.First we provide an overview of the experiment and relevantresults from that work. After an initial exploratory dataanalysis the results of the regression tree analyses arediscussed. On the basis of these results we propose a simplestorm event indicator which can be used to give a predictionof the probability and timing of large herbicide leachingevents in the experimental system. Finally, we outline how afrequentist approach to leaching risk could be implementedusing these results.
2. Methods
[8] The data used here were generated as part of a largerstudy aimed at evaluating solute transport at the plot andfield scales [Putz et al., 1999; Dressel, 2003]. The followingbriefly summarizes the experimental design, relevant resultsfrom that work and our analysis of it.
2.1. Site Description
[9] The leaching experiment was conducted simultaneous-ly at two sites: Merzenhausen, Julich, Germany (MRZ)located at approximately 6�1704600 longitude 50�5504700 lati-tude; and at Institute Agrosphare, Forschungszentrum Julich(FZJ) located approximately 10 km south east of MRZ. Inthe 25 years prior to the experiment the mean daily airtemperature at FZJ varied seasonally between �5 to 24�C inphase with the evaporation (92 mm month�1 to 9 mmmonth�1) and rainfall (78 mm month�1 to 51 mmmonth�1). The soil used in the experiments is classified assilt loam, and reportedly had earthworm burrows in abun-dance up to 2.5 m below ground surface [Putz et al., 1998].The saturated hydraulic conductivity of the soil at 10–16 cmdepth was determined to be approximately 17.5 mm h�1
[Dressel, 2003]. Table S1 in the auxiliary material providesmore detail on soil properties, as determined by Putz [1993].1
2.2. Lysimetry
[10] During November 1993, a total of 12 stainless steelcylinders were cored into the ground at the MRZ field siteto collect undisturbed soil monoliths. These cylinders were110 cm tall with an upper surface area of 0.5 or 1.0 m2. Thecylinders, containing the soil, were then assembled intolysimeters. In October 1995 six of these lysimeters were
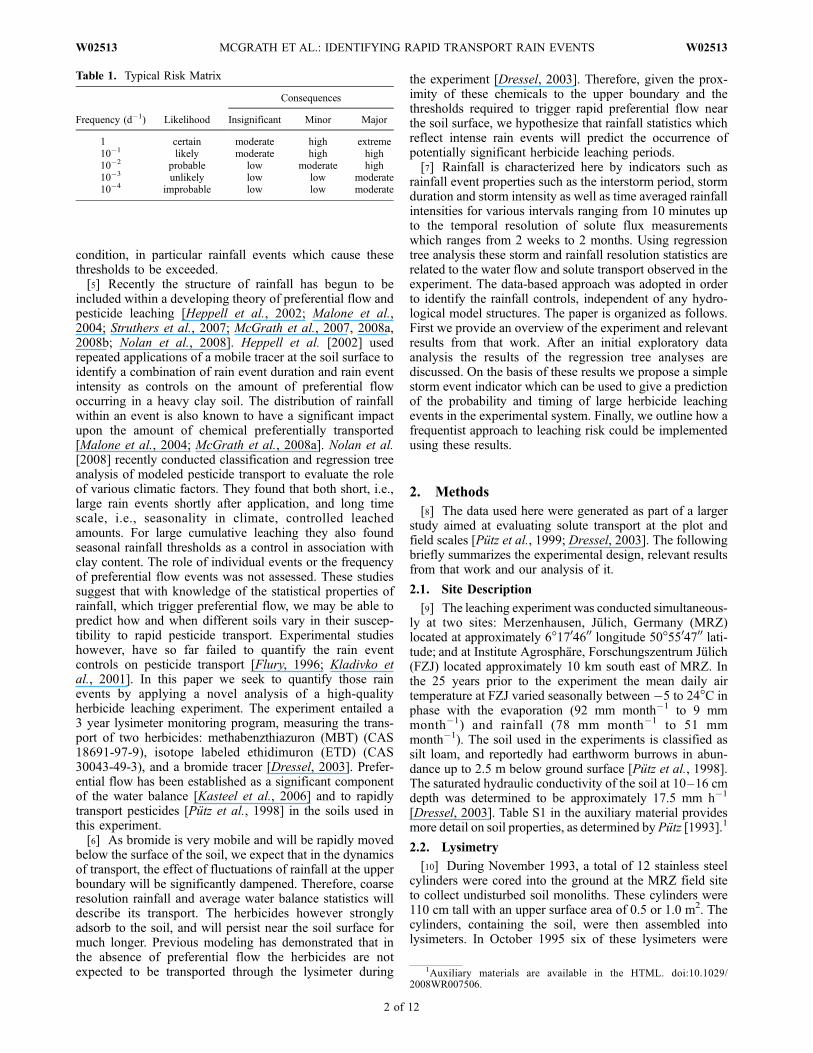
Table 1. Typical Risk Matrix
Frequency (d�1) Likelihood
Consequences
Insignificant Minor Major
1 certain moderate high extreme10�1 likely moderate high high10�2 probable low moderate high10�3 unlikely low low moderate10�4 improbable low low moderate
1Auxiliary materials are available in the HTML. doi:10.1029/2008WR007506.
2 of 12
W02513 MCGRATH ET AL.: IDENTIFYING RAPID TRANSPORT RAIN EVENTS W02513

placed in situ at MRZ to be studied in conjunction with afield-scale experiment, while the remaining six were in-stalled at the lysimeter facility at FZJ. Following sprayapplication of all three substances on 13 November 1997,percolate was collected from each lysimeter on 43 occasionsbetween 2 December 1997 and 15 November 2000, initiallyat weekly to fortnightly intervals, then increasing to monthlythen bimonthly sampling. The lysimeters were maintainedfree of vegetation by occasional shallow mechanicalweeding and application of a commercial grade, broadspectrum herbicide, Roundup
1
, the active ingredient ofwhich is glyphosate. These applications occurred on 2 May1997, 2 July 1997, and 5 November 1999 at 4 L ha�1.The lysimeters were otherwise not irrigated during theexperiment.
2.3. Climate Data
[11] Weather stations collected data from September 1996to June 2000. The weather station at MRZ was locatedwithin 50 m of all six lysimeters while at FZJ the weatherstation was approximately 200 m from the lysimeter facility.Rainfall was measured with a tipping bucket rain gauge(Thiess, Gottingen) at a resolution of 10 minutes. Windspeed at 0.02 m (heat wire anemometer, Type 8470, TSI,Aachen Germany), 0.2 and 2 m (bowl anemometer, PortonA100, Walz, Effeltrich, Germany), global radiation at 2 m
(pyranometer LI-200SA, LI-COR, Lincoln, USA), airtemperature and humidity at 2 m (psychrometer, Thiess,Gottingen, Germany) were also measured at 10 min inter-vals. Evaporation reported here is presented as potentialevaporation, calculated using the Penman equation (seeDressel [2003, p. 101] for details). Rainfall and potentialevaporation measured at FZJ, as well as leachate samplingtimes are shown in Figure 1.
2.4. Chemical Application and Analysis
[12] The chemicals used in the study consisted of bromide(Br�) as potassium bromide (KBr) and the herbicidesmethabenzthiazuron (MBT), 1-Benzothiazol-2-yl-1,3-dimethylurea, and ethidimuron (ETD), 1,3-Dimethyl-3-(5-ethylsulfonyl-1,3,4-thiadiazol-2-yl)-urea, which was14C-labeled in the thiadiazole-2 position. The chemicalswere applied to the lysimeters on 13 November 1997 at1.57 kg ha�1, 1.72 kg ha�1 of active ingredient for ETD andMBT, respectively, and 311 kg ha�1 for Br� with a pesticidesprayer by hand in a 0.2 mm pulse. The herbicides wereapplied in a formulation with comparable properties to thecommercial grade products Ustilan
1
(ETD) and Tribunil1
(MBT) [Dressel, 2003].[13] Chemical analysis of the herbicides was conducted by
HPLC-MS/MS. Radioactivity was measured by liquid scin-tillation counting. Bromide was analyzed by ion exchange
Figure 1. Evaporation and rainfall at different temporal resolutions at Forschungszentrum Julich.Shown are (a) daily potential evaporation and leachate sampling dates (circles), (b) daily averaged rainfallintensity, (c) hourly averaged rainfall intensity, and (d) 10 min resolution rainfall intensity.
W02513 MCGRATH ET AL.: IDENTIFYING RAPID TRANSPORT RAIN EVENTS
3 of 12
W02513

chromatography. The quantitation limits established for theanalyses were 0.05 mg L�1 (ETD), 0.01 mg L�1 (MBT) and0.05 mg L�1 (Br�1) [Dressel, 2003]. Cumulative water flowand solute transport measured by each lysimeter are shownin Figure 2.[14] Laboratory batch experiments determined sorption of
the herbicides to the soil followed Freundlich isotherms anddegradation was found to decrease exponentially with time[Brumhard, 1991; Zetler, 1998; Wustemeyer, 2000] (as citedby Dressel [2003]). MBT was approximately 20 times morestrongly sorbing to the soil than ETD [Dressel, 2003].Selected chemical properties are summarized in the auxil-iary material (Table S2). For the Ap horizon, sorptionparameters are similar to reported values in the literaturefor MBT, where Freundlich Kfoc was found to be 633 L3�1/n
kg�1/n and the exponent (n�1) 0.69 [Dressel, 2003; Baez etal., 2001]. For ETD the Freundlich Kfoc increased from27 L3�1/n kg�1/n to 144.8 L3�1/n kg�1/n over several batchequilibrium sorption/desorption experiments, while n�1 wasfound to be 0.86. Measured degradation rates showed thatMBT was 4.5 times more rapidly degraded than ETD, withhalf-lives of 44.6 and 198 days, respectively [Dressel,2003]. MBT degradation rates were also comparable topreviously published values [Rouchaud et al., 1998]. Sorp-tion and degradation values for ETD could not be found inthe literature prior to submission.
2.5. Data Preparation: Leaching Variables
[15] The average leachate behavior of the six lysimeterswas used to generate a ‘‘field’’ averaged value for both sites.As described in more detail in section 3, the drainage ratewas found to be nearly constant over long periods of time.Within the 3 year observation record, five distinct drainageperiods (‘‘regimes’’) were observed, each with a constantdrainage rate that is different from the preceding or subse-quent regime. During each of these regimes solute dissipa-tion was also found to decay exponentially with time (seeFigures 3b, 3c, and 3d). In order to better capture short-termvariations in leaching, the effect of these regimes wasremoved by subtracting the regime average dissipation(drainage) rate from the dissipation (drainage) rate betweensubsequent measurements.[16] The dissipation rate ki [T
�1] due to leaching wascalculated as
ki ¼1
Dtiln
M0 �Mi�1M0 �Mi
� �ð1Þ
where ln denotes the natural logarithm, M0 [M] the appliedmass, Mi [M] the site averaged cumulative mass of solutemeasured in the leachate at time ti = ti�1 + Dti [T], and Dti[T] the time between the consecutive measurements. Fordrainage ki = (Di � Di�1)/Dti where the units of ki are now[LT�1], and Di [L] is the cumulative drainage at time ti. Theaverage dissipation (drainage) rate kj [T
�1] of regime j wascalculated by linear regression (see Table S4 in the auxiliarymaterial). These variables are denoted D, Br, MBT andETD for drainage, Br�, MBT and ETD, respectively. Threedata points were excluded from the linear regressions,however all points were considered in terms of deviationsfrom the linear trends. Those points excluded fromregressions caused significantly poorer linear correlation
when included. They are interpreted here as part of shorttransitional phases between two clearly distinct regimes,and possibly a third which existed at the beginning of theexperiment. These data and the initial point are shown inFigure 3 as open diamonds.[17] The difference between short time scale (ki) and
regime average (kj) rates, including all data, were thennormalized by the maximum difference across all measure-ments, to derive the normalized regime deviation k*i [�],i.e.,
ki* ¼ ki � kj� �
=max8fi;jg
ki � kj� �
ð2Þ
Positive values of k*i indicate a dissipation (drainage) rateabove the regime average rate, k*i < 0 indicate belowregime average fluxes and values near zero indicate the fluxwas close to the average flux in the regime. This variablehelps us to interpret the short-term fluctuations in drainage(D*) and leaching (Br*, MBT* and ETD*), filtering out theeffect of regime behavior on leaching. The followingdescribes the rainfall variables considered for comparison.
2.6. Data Preparation: Climate Variables
[18] Storm properties and a variety of rainfall resolution–dependent statistics were adopted for the multivariate anal-ysis. Storms were identified from the data as rainfall recordsfor which there was a minimum of 7 h of no rain betweentwo rainfall recordings, irrespective of its intensity [Robinsonand Sivapalan, 1997]. Storms are characterized by anaverage intensity Si [L T�1], a depth Sh [L] and a durationSr [T]. The interstorm period Sb [T] is the time betweensuccessive storms. An interstorm or a storm traversing twosampling intervals was truncated at midday of the day ofsampling. We also considered the rainfall intensity at dailyP24 [L T�1], hourly P60 [L T�1] and 10 min P10 [L T�1]resolution. Given our hypothesis of the various rainfallcontrols, described in the Introduction, we chose only themaximum (Si, Sr, Sh, Sb, P24, P60, P10) and the mean (Si, Sr,Sh, Sb, P24, P60, P10) rainfall statistics for each samplinginterval for analysis. Finally, the average rainfall P [L T�1]and potential evaporation Ep [L T�1] during each samplinginterval define the climatic water balance WB = P � Ep[L T�1]. The climate variables extracted for analysis arestatistics derived from the same period during which theleachate sample was collected. Therefore the temporalresolution of sampling matches the variables chosen foranalysis even if the scale of data comprising each statisticvaries.
2.7. Statistical Methods
[19] Classification and regression tree (CART) analysisis a nonparametric statistical method for explaining a howa response variable, either categorical (classification) ornumeric (regression), is related to one or more predictorvariables [Breiman et al., 1984; Venables and Ripley,1994]. CART was used here to identify the dominantrainfall controls on dissipation and drainage rates, thereforeall predictor variables and explanatory variables are numericvalues. A regression tree is generated by hierarchicallysplitting the data based on a simple rule defined by oneexplanatory variable at each split. In this case data arepartitioned into one of two groups depending upon whether
4 of 12
W02513 MCGRATH ET AL.: IDENTIFYING RAPID TRANSPORT RAIN EVENTS W02513

Figure 2. Cumulative amounts of water and solutes in leachate in each of the 12 lysimeters atForschungszentrum Julich (FZJ) and Merzenhausen (MRZ). Plot symbols correspond to differentlysimeters at each site. To make the plots clearer, some data were scaled. For lysimeter 4 the mass wasreduced by 1/6 for ETD and 1/3 for MBT; the MBT mass for lysimeter 9 has been multiplied by 1/5; andfor lysimeter 12 the MBT mass was multiplied by 10.
W02513 MCGRATH ET AL.: IDENTIFYING RAPID TRANSPORT RAIN EVENTS
5 of 12
W02513

a chosen explanatory variable is less than or greater than athreshold value. The choice of split to use at each level inthe tree is determined by an exhaustive search of possiblesplits, which maximizes the improvement in a goodness offit measure [Venables and Ripley, 1994; Nolan et al., 2008].
In our case we use the mean squared difference of theresponse variable from its mean in each split, the so-calleddeviance, as the goodness of fit measure [Breiman et al.,1984; Qian and Anderson, 1999]. A tree can be grown untileach leaf of the tree contains only one data point (and zerodeviance) or a minimum split size (we chose to use aminimum of five data), however leaving the analysis hereresults in a complex tree model which tends to over fit thedata. To overcome this, v-fold cross validation is used toeffectively prune branches in order to find a minimal tree,more robust to noise in the data. This procedure assesseshow well the tree performs on subsamples of the data usedto grow the tree, and is useful when the data set is not verylarge [Breiman et al., 1984]. We used tenfold cross valida-tion which randomly splits the data set into 10, approxi-mately evenly sized groups. One of these groups is thenremoved and the remaining nine groups are passed throughthe tree, allowing the calculation of the sample deviance ateach split. This procedure is repeated giving an averagedeviance at each split. From this the tree size can be selectedautomatically as the smallest hierarchy of splits whose totalaverage deviance is within one standard error of the ofdeviances of the tree size with the minimum averagedeviance [Breiman et al., 1984]. The software SPlus version6.1 was used for the analysis [Venables and Ripley, 1994;Insightful Corporation, 2005]. The auxiliary material showsthe results of the cross validation leading to the choice of thetree sizes for each analysis (Figure S1). Figure 4 illustrateshow to interpret the regression trees presented.
3. Results and Discussion
3.1. Exploratory Data Analysis
[20] Rainfall properties appear to change throughout theyear. For example, summer and spring rainfall events(�days 100–300 and 500–700) are less regular and muchmore intense than autumn and winter rainfall which occursfrequently and at generally lower intensities (Figure 1). Thereis also a clear difference displayed in the rainfall intensitywith a change in temporal scale. The highest intensities areobserved at the 10 min measurement resolution.[21] Br�, MBT, and ETDwere detected in the first leachate
sampling event, 19 days after application (Figure 2). Such arapid breakthrough suggests that preferential flow wasresponsible [Putz et al., 1998; Dressel, 2003]. This issupported by modeling [Kasteel et al., 2006] which identi-fied that as much as 30% of drainage occurred as rapidpreferential flow in this soil. While all solutes were trans-ported equally fast initially, there are clear differences intheir transport behavior. Overall, Br� displays a smootherbreakthrough curve (see Figure 2). The herbicides on theother hand display more episodic leaching.[22] In fact, only four of the largest leaching measure-
ments, on days 47, 108, 208 and 224, accounted for between63.1% (MBT) and 49.2% (ETD), of the total herbicide massleached during the experiment. These same four samplesaccounted for only 9.3% of the total Br� mass leached.These fractions are in the same order as the strength ofadsorption to soil, thus supporting our hypothesis, that thesignificance of rapid transport is greater for more stronglysorbing substances. This is further supported by the break-
Figure 3. Regime behavior of site averaged (a) cumulativedrainage, (b) bromide, (c) MBT, and (d) ETD dissipation atFZJ. Vertical lines separate regimes, denoted by the Romannumerals. Diamonds denote the site average; error barsshow the 95% confidence interval about the mean; solidlines are the linear regressions; and dashed lines are thestandard error of the estimate.
6 of 12
W02513 MCGRATH ET AL.: IDENTIFYING RAPID TRANSPORT RAIN EVENTS W02513

through curves which suggest little additional chemical isexpected to be leached beyond the end of the experiment.[23] The largest herbicide transport event for most lysim-
eters was observed in the sample collected on day 208.Just prior to this the largest hourly (17 mm h�1 at MRZ)and 10 min (85 mm h�1 at MRZ) rainfall intensities for theexperiment were recorded at both sites (see Figure 1). Thisis consistent with observations that the greatest transportoccurs as a result of the most significant rainfall event in theperiod after application [Kladivko et al., 2001].[24] However, 208 days is a significant amount of time
since application, and one would expect most of the Br� tohave moved well below the soil surface by then. So couldthe presence of a subsurface plough layer be responsible forthe large herbicide and bromide transport at this time? Thesignificance of earlier preferential flow events (days 47 and108) and the soil data (see Table S1 in the auxiliary material)do not support this hypothesis. Additionally, modeling byDressel [2003] suggests that, in the absence of preferentialflow, the bromide concentration in outflow was coinciden-tally, expected to increase significantly around day 200.Therefore, significant exchange between mobile and immo-bile regions of the soil as a result of the large input of waterat this time, along with the imminent breakthrough ofbromide that has largely moved slowly through the soilmatrix, can explain the large flux of bromide at this time.[25] Cumulative drainage and bromide transport were
similar both within (p < 0.01) and between (p < 0.01) sites(see also Figure 2). In contrast there was greater within sitevariability for herbicides in comparison to Br� transport.There was also a significant (p < 0.01) difference in themean amount of herbicides leached between sites. Thisfurther emphasizes the limitations of solute flux predictiongiven that the soil from all 12 lysimeters was originallycollected from the same field. Within and between sitedifferences in solute leaching and applications are summa-rized in the auxiliary material (Table S3). The greatervariability of herbicide transport within a site may be dueto heterogeneity of fast transport pathways and soil chem-ical properties [Allaire et al., 2002; Muller et al., 2003].
[26] When considering the site averaged behavior, therewere five distinct periods, regimes, during which the drain-age rate was approximately constant (Figure 3). There werealso rapid transitions between these regimes (Figure 3a).The transitions are expected to result from the episodicpropagation of near surface boundary conditions throughthe wetting profile. For example, most of the variability atthe upper boundary is buffered, leading to only smallvariations in water content at the lower boundary, whichin turn controls the outflow in the lysimeter. Occasionally asufficiently large perturbation propagates to depth to estab-lish a new water content in the unit gradient zone and hencea new flux. While seasonality is clearly a control it isinteresting that the regimes occur for a little as a monthand longer than three months, that the transitions are rela-tively rapid, and the drainage flux is so stable. This regimebehavior was reproduced by an uncalibrated HYDRUS 1D[Simunek et al., 1998] simulation (see Figure S2 in theauxiliary material). It has also been observed previously at alarge 4 m deep, sandy, free draining lysimeter located atColbitz, Germany [Struthers et al., 2003], suggesting it is amore general phenomena than previously recognized.[27] The solutes display a similar pattern, with log linear
regimes matching each of the drainage regimes (Figure 3).The average drainage and dissipation rates for each of thesefive regimes is summarized in the auxiliary material (TableS4). It is also apparent that herbicide transport is signifi-cantly affected by a small number of large leaching eventscausing large deviations from the regime dynamic, and to amuch lesser degree Br� and drainage. It is these deviationsfrom the regimes that we will exploit to derive short-termfluctuations in leaching, so that we can filter out the effectof seasonality and ongoing chemical degradation.[28] While lysimeters provide well defined boundaries for
flux calculation, they do suffer some limitations. Modelingby Abdou and Flury [2004] showed that mobile solutessuch as bromide may actually move slower and disperse lessin lysimeters which developed a significant saturated zonein comparison to their field counterparts. The lower bound-ary in a lysimeter will tend to keep the soil wetter,
Figure 4. An example regression tree to predict the response variable Z from a multivariate data setcomprising the predictor variables W, X, Y, and Z. Variable W was not used to develop the tree or wastrimmed during cross validation. All the data points, A, B, C, D, E, and F enter the tree at the top. Data Aand B which satisfy the condition that X < 3 are partitioned to the left, and those that do not arepartitioned to the right. This partitioning is continued through to the end of the tree. Shown at the end ofeach branch is the predicted value of Z, i.e., the mean of the Z values at that point, the sum of squareddifference from the mean, the deviance, and the number of data points reaching the terminus.
W02513 MCGRATH ET AL.: IDENTIFYING RAPID TRANSPORT RAIN EVENTS
7 of 12
W02513
throughout the profile, thus reducing the potential forexchange between preferential flow pathways and the soilmatrix during rapid transport. Therefore, we expect thatpreferential transport would actually be moderately en-hanced in a lysimeter in comparison to a correspondingfield soil, with a deep water table.[29] Also, in relation to the lower boundary, does signif-
icant mixing occur in the near saturated zone and does thisexplain the transport regimes? First we note that the regimesare evident very early after the experiment commenced, andbefore a ‘‘lower mixing zone’’ would have any significantamount of chemical to mix. One fully mixed inflow-outflowcell, with an initial concentration and no further inputs,would ideally lead to an exponential decay as observed. It iswell established that for pesticides such a mixing zoneoccurs near the soil surface [Ahuja et al., 1981; Steenhuiset al., 1994]. Therefore, if the lower boundary is also actingas a significant mixing zone for the herbicides, we wouldexpect the system to behave like two tanks in series, whichwould not be expected to produce the observed log linearbehavior. We anticipate that solute mass exchange betweenmobile and immobile regions in the unsaturated zone iscorrelated with the bulk water content, which in turn isrelated to the drainage regimes. Further work is required toverify this, but we would like to reiterate that our focus inthis paper is to exploit the regimes in order to evaluateshort-term fluctuations in leaching.
3.2. Regression Tree Analysis
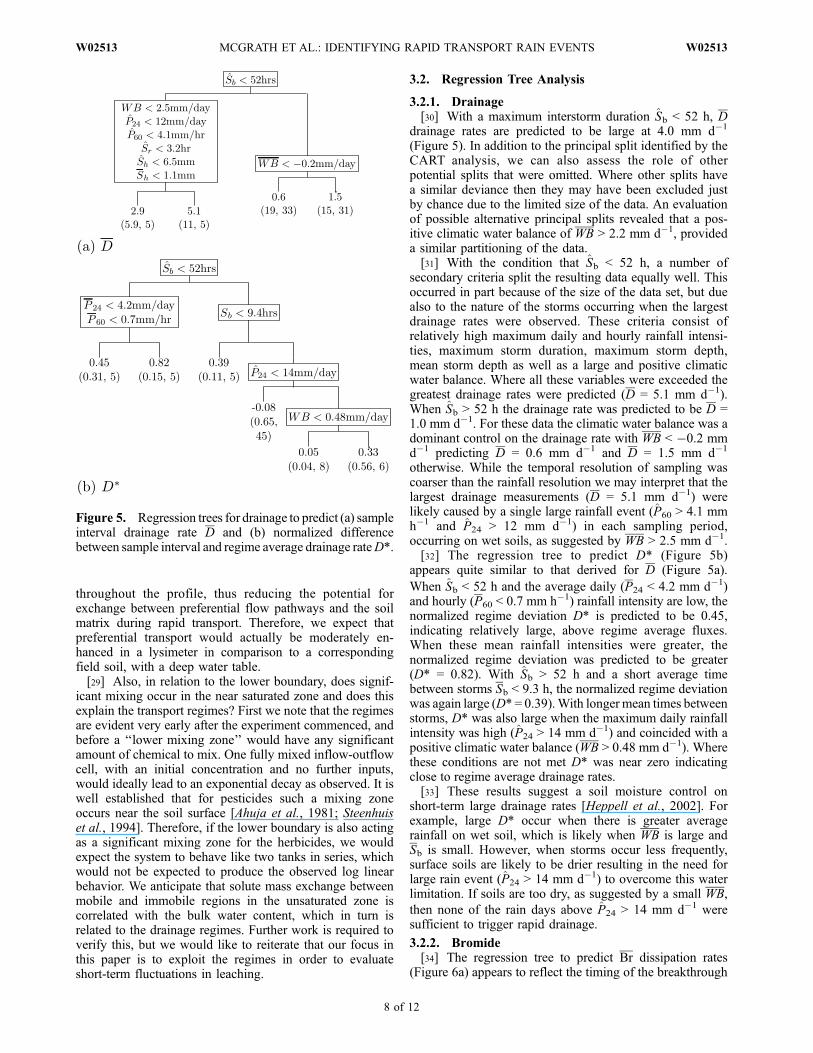
3.2.1. Drainage[30] With a maximum interstorm duration Sb < 52 h, D
drainage rates are predicted to be large at 4.0 mm d�1
(Figure 5). In addition to the principal split identified by theCART analysis, we can also assess the role of otherpotential splits that were omitted. Where other splits havea similar deviance then they may have been excluded justby chance due to the limited size of the data. An evaluationof possible alternative principal splits revealed that a pos-itive climatic water balance of WB > 2.2 mm d�1, provideda similar partitioning of the data.[31] With the condition that Sb < 52 h, a number of
secondary criteria split the resulting data equally well. Thisoccurred in part because of the size of the data set, but duealso to the nature of the storms occurring when the largestdrainage rates were observed. These criteria consist ofrelatively high maximum daily and hourly rainfall intensi-ties, maximum storm duration, maximum storm depth,mean storm depth as well as a large and positive climaticwater balance. Where all these variables were exceeded thegreatest drainage rates were predicted (D = 5.1 mm d�1).When Sb > 52 h the drainage rate was predicted to be D =1.0 mm d�1. For these data the climatic water balance was adominant control on the drainage rate with WB < �0.2 mmd�1 predicting D = 0.6 mm d�1 and D = 1.5 mm d�1
otherwise. While the temporal resolution of sampling wascoarser than the rainfall resolution we may interpret that thelargest drainage measurements (D = 5.1 mm d�1) werelikely caused by a single large rainfall event (P60 > 4.1 mmh�1 and P24 > 12 mm d�1) in each sampling period,occurring on wet soils, as suggested by WB > 2.5 mm d�1.[32] The regression tree to predict D* (Figure 5b)
appears quite similar to that derived for D (Figure 5a).
When Sb < 52 h and the average daily (P24 < 4.2 mm d�1)and hourly (P60 < 0.7 mm h�1) rainfall intensity are low, thenormalized regime deviation D* is predicted to be 0.45,indicating relatively large, above regime average fluxes.When these mean rainfall intensities were greater, thenormalized regime deviation was predicted to be greater(D* = 0.82). With Sb > 52 h and a short average timebetween storms Sb < 9.3 h, the normalized regime deviationwas again large (D* = 0.39).With longer mean times betweenstorms, D* was also large when the maximum daily rainfallintensity was high (P24 > 14 mm d�1) and coincided with apositive climatic water balance (WB > 0.48 mm d�1). Wherethese conditions are not met D* was near zero indicatingclose to regime average drainage rates.[33] These results suggest a soil moisture control on
short-term large drainage rates [Heppell et al., 2002]. Forexample, large D* occur when there is greater averagerainfall on wet soil, which is likely when WB is large andSb is small. However, when storms occur less frequently,surface soils are likely to be drier resulting in the need forlarge rain event (P24 > 14 mm d�1) to overcome this waterlimitation. If soils are too dry, as suggested by a small WB,
then none of the rain days above P24 > 14 mm d�1 weresufficient to trigger rapid drainage.
3.2.2. Bromide[34] The regression tree to predict Br dissipation rates
(Figure 6a) appears to reflect the timing of the breakthrough
Figure 5. Regression trees for drainage to predict (a) sampleinterval drainage rate D and (b) normalized differencebetween sample interval and regime average drainage rateD*.
8 of 12
W02513 MCGRATH ET AL.: IDENTIFYING RAPID TRANSPORT RAIN EVENTS W02513

of the tracer. A single split in the data was identified aftercross validation, and this split corresponds approximately tothe climatic water balance of regime III during which mostof the leaching occurred. Large Br is associated with alarger positive climatic water balance. By consideringinstead the short-term fluctuations, the normalized regimedeviation Br* (Figure 6b), partially removes this effect. Theprincipal split in the data is now given by WB < 0.45 mmd�1 (the majority of data) where Br* are close to zero andhence the bromide leaching is predicted to be near theregime average. When there was large positive climaticwater balance WB > 0.45 mm d�1, Br* was large and Br*was greater still if there was a short mean time betweenstorms Sb < 9.3 h. This is similar to the Sb < 9.4 h criterionwhich occurred in the D* regression tree, also predictinggreater normalized regime deviations.3.2.3. Herbicides[35] The CART analyses of herbicide leachate rates and
normalized regime deviations produced identical trees,therefore for brevity regression trees are presented forMBT* and ETD* only (see Figure 7). This similaritysuggests that the pulsed transport of herbicides is sodominant it is being pickup by both analyses.[36] A maximum storm depth of Sh > 19 mm was found
to be the first split in the trees for both MBT and ETD and
predicted the largest deviations (MBT* = 0.4 and ETD* =0.5). Therefore, a single storm in the two week to twomonth sampling interval dominated the largest herbicideleaching events. It was decided to check if this split mayhave occurred as a result of chance and whether there werealternative splits which could provide similar predictions.An evaluation of these other potential splits (see Table S5 inthe auxiliary material), which were very similar for MBT*and ETD* (not shown), indicated large average and coarsetemporal resolution rainfall statistics lead to similar predic-tions. These larger average rainfalls were also found tooccur along with large maximum storm depths in manysampling periods with greater amounts of herbicide leach-ing. As a result it is considered that both wet soils inconjunction with a large storm event contributed to thelargest leaching events. The same control, i.e., a large
Figure 6. Regression tree analysis of rainfall controls onbromide leaching to predict (a) sample interval bromidedissipation rates Br and (b) normalized difference betweensample interval and regime average bromide dissipationrate Br*.
Figure 7. Regression tree analysis of rainfall controls onherbicide leaching. Regression trees predict the normalizeddifference between sample interval and regime averagedissipation rates for the herbicides (a) MBT* and (b) ETD*.
W02513 MCGRATH ET AL.: IDENTIFYING RAPID TRANSPORT RAIN EVENTS
9 of 12
W02513
rainfall event on wet soils, has also been previously iden-tified for glyphosate leaching [Vereecken, 2005].[37] For the more strongly sorbing chemical, MBT, a
maximum time between storms Sb < 40 h predicts MBT* =0.21 (Figure 7a). In a similar way to drainage, a greatermaximum interstorm time Sb > 40 h, but with more frequentstorms on average Sb < 14 h, predicts above regime averagedissipation rates. When storms occur frequently however, anegative climatic water balance WB < �0.12 mm d�1
predicts higher MBT*. The criteria leading to this suggestthat the negative climatic water balance represents stormysummer rainfall and this is supported by an examination ofthese data. Additionally, they displayed relatively largemaximum 10 min rainfall intensities or in one instance amaximum storm depth of 18 mm.[38] For ETD (see Figure 7b), the second split in the tree
was Sb < 9 h, and in a similar way to the trees for D* andBr*, predicted ETD* to be larger when the mean interstormperiod was short. When Sb > 9 h, as is the case for themajority of data, ETD* was close to the regime average.[39] In a similar fashion to the results for drainage, the
regression trees for herbicide transport suggest a soil mois-ture control on leaching for less frequent lower-intensitystorms. The largest leaching events occur when an extremestorm occurs on wet soils, as suggested by the high averagerainfall of the alternative splits (refer to Table S5 in theauxiliary material) which after inspection comprise largelythe same data. These events were not limited by soilmoisture. When storm events are smaller, more frequentstorms promote herbicide leaching, suggesting event mag-nitude is limiting to transport. Finally when both stormmagnitude and soil moisture are limiting herbicide leachingfollows the regime behavior. This classification is similar tothat derived by Heppell et al. [2002] in the context ofpreferential flow.3.2.4. Evaluating a Rainfall Event Threshold[40] The 19 mm maximum storm depth, as identified in
the regression tree analysis for herbicide leaching, predictsthe timing of between 10% (FZJ) and 17% (MRZ) of aboveregime average leaching events for both MBT and ETD.Despite this however, at the MRZ site the thresholdaccounted for 55% (MBT) and 56% (ETD) of the total
amounts of herbicides leached, while at FZJ the amountswere lower at 40% (MBT) and 38% (ETD). In contrast thisthreshold only accounted for between 1% (FZJ) and 10%(MRZ) of the total bromide leached.[41] On the basis of our results it is reasonable to expect
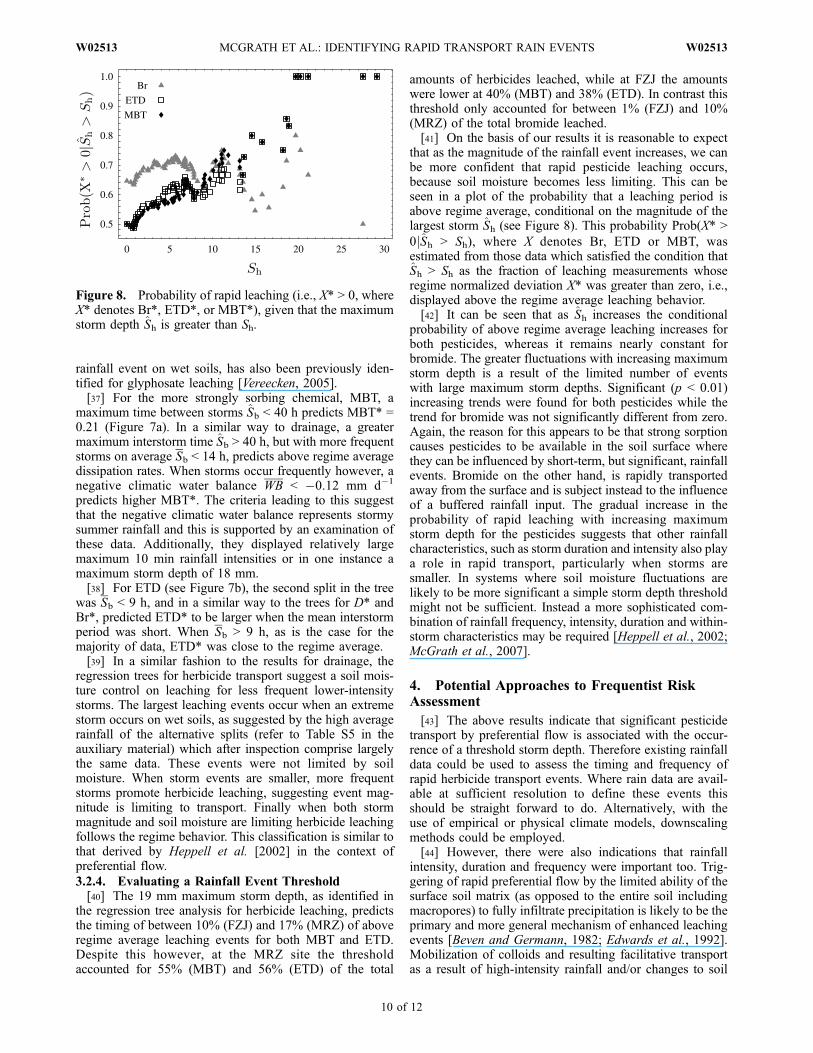
that as the magnitude of the rainfall event increases, we canbe more confident that rapid pesticide leaching occurs,because soil moisture becomes less limiting. This can beseen in a plot of the probability that a leaching period isabove regime average, conditional on the magnitude of thelargest storm Sh (see Figure 8). This probability Prob(X* >
0jSh > Sh), where X denotes Br, ETD or MBT, wasestimated from those data which satisfied the condition thatSh > Sh as the fraction of leaching measurements whoseregime normalized deviation X* was greater than zero, i.e.,displayed above the regime average leaching behavior.[42] It can be seen that as Sh increases the conditional
probability of above regime average leaching increases forboth pesticides, whereas it remains nearly constant forbromide. The greater fluctuations with increasing maximumstorm depth is a result of the limited number of eventswith large maximum storm depths. Significant (p < 0.01)increasing trends were found for both pesticides while thetrend for bromide was not significantly different from zero.Again, the reason for this appears to be that strong sorptioncauses pesticides to be available in the soil surface wherethey can be influenced by short-term, but significant, rainfallevents. Bromide on the other hand, is rapidly transportedaway from the surface and is subject instead to the influenceof a buffered rainfall input. The gradual increase in theprobability of rapid leaching with increasing maximumstorm depth for the pesticides suggests that other rainfallcharacteristics, such as storm duration and intensity also playa role in rapid transport, particularly when storms aresmaller. In systems where soil moisture fluctuations arelikely to be more significant a simple storm depth thresholdmight not be sufficient. Instead a more sophisticated com-bination of rainfall frequency, intensity, duration and within-storm characteristics may be required [Heppell et al., 2002;McGrath et al., 2007].
4. Potential Approaches to Frequentist RiskAssessment
[43] The above results indicate that significant pesticidetransport by preferential flow is associated with the occur-rence of a threshold storm depth. Therefore existing rainfalldata could be used to assess the timing and frequency ofrapid herbicide transport events. Where rain data are avail-able at sufficient resolution to define these events thisshould be straight forward to do. Alternatively, with theuse of empirical or physical climate models, downscalingmethods could be employed.[44] However, there were also indications that rainfall
intensity, duration and frequency were important too. Trig-gering of rapid preferential flow by the limited ability of thesurface soil matrix (as opposed to the entire soil includingmacropores) to fully infiltrate precipitation is likely to be theprimary and more general mechanism of enhanced leachingevents [Beven and Germann, 1982; Edwards et al., 1992].Mobilization of colloids and resulting facilitative transportas a result of high-intensity rainfall and/or changes to soil
Figure 8. Probability of rapid leaching (i.e., X* > 0, whereX* denotes Br*, ETD*, or MBT*), given that the maximumstorm depth Sh is greater than Sh.
10 of 12
W02513 MCGRATH ET AL.: IDENTIFYING RAPID TRANSPORT RAIN EVENTS W02513

chemistry may be another [Flury, 1996; de Jonge et al.,2004].[45] One possible way to tackle the first of these mech-
anisms is to use an infiltration model to simulate theoccurrence and magnitude of macropore flow events[Struthers et al., 2007; McGrath et al., 2007]. This wouldallow quantification of the frequency of rapid leachingevents at sites where leaching data are unavailable. Withsuch a model, macropore flow magnitude-frequency rela-tionships for particular soil-climate systems could be estab-lished. This may be one way to begin to quantify leachingrisk without the added uncertainty of complex simulationsof flow and solute transport of the entire unsaturated zone.
5. Conclusions
[46] A careful analysis of a 3 year lysimeter leachingexperiment has revealed, at a coarse scale, regime behaviorof water flow and solute transport. This is evidence of asoil-climate system which behaves as a linear system withthreshold switching between stable states. The water flowregimes are to be expected based upon unsaturated flowtheory, however a better understanding of the circumstancesrequired for this behavior to be observed requires moreresearch.[47] We exploited these regimes to determine the short-
term fluctuations in transport and to assess what climatevariables are responsible. We found that a threshold stormdepth predicted the occurrence of significant rapid herbicidetransport, whereas a more coarse scale water balancepredicted water flow and bromide transport. The resultsalso suggest greater rain event frequency promotes prefer-ential transport when storms are smaller in magnitude.[48] In this system at least, the historical occurrence of
rain events in excess of 19 mm can be used to assess thetiming and frequency of rapid herbicide transport events.Alternatively, with the use of an infiltration model we maybe able to better quantify when and how often different soil-climate systems are likely to experience rapid pesticideleaching [Struthers et al., 2007; McGrath et al., 2007].
[49] Acknowledgments. The first author would like to acknowledgefinancial support from German Academic Exchange Service (DAAD),Centre for Groundwater Studies, Postgraduate Research School of theUniversity of Western Australia, Water Corporation of Western Australia,and Australian Research Council’s Linkage Projects funding scheme(project LP0211883).
ReferencesAbdou, H. M., and M. Flury (2004), Simulation of water flow and solutetransport in free-drainage lysimeters and field soils with heterogeneousstructures, Eur. J. Soil Sci., 55, 229–241.
Ahuja, L., A. Sharpley, M. Yamamoto, and R. Menzel (1981), The depth ofrainfall-runoff-soil interactions as determined by 32P, Water Resour. Res.,17(4), 969–974, doi:10.1029/WR017i004p00969.
Allaire, S. E., S. C. Gupta, J. Nieber, and J. F. Moncrief (2002), Role ofmacropore continuity and tortuosity on solute transport in soils: 1. Effectsof initial and boundary conditions, J. Contam. Hydrol., 58(3–4), 299–321, doi:10.1016/S0169-7722(02)00035-9.
Baez, M. E., M. Rodriguez, P. Vilches, and E. Romero (2001), Adsorptionof methabenzthiazuron on six allophanic and nonallophanic soils: Effectof organic matter amendment, J. Environ. Sci. Health B, 36(1), 95–105,doi:10.1081/PFC-100000920.
Beven, K., and P. Germann (1982), Macropores and water flow in soils,Water Resour. Res., 18(5), 1311–1325, doi:10.1029/WR018i005p01311.
Breiman, L., J. H. Friedman, R. A. Olshen, and C. J. Stone (1984), Classi-fication and Regression Trees, Wadsworth, Belmont, Calif.
Brumhard, B. (1991), Lysimeterversuche zum Langzeitverhalten der Her-bizide Metamitron (GOLTIX
1
) und Methabenzthiazuron (TRIBUNIL1
)in einer Parabraunerde mit besonderer Berucksisctigung der Transpor-tund Verlagerungsprozesse unter Ein beziehung von Detailuntersuchun-gen, Band 2465, report, Forschungszent. Juelich, Juelich, Germany.
de Jonge, L. W., C. Kjaergaard, and P. Moldrup (2004), Colloids andcolloid-facilitated transport of contaminants in soils: An introduction,Vadose Zone J., 3, 321–325.
Dressel, J. (2003), Transport von Ethidimuron, Methabenzthiazuron undWassertracern in einer Parabraunerde, Ph.D. thesis, Inst. fuer Chem.und Dyn. der Geosphaere IV, Juelich, Germany.
Edwards, W., M. Shipitalo, W. Dick, and L. Owen (1992), Rainfall intensityaffects transport of water and chemicals through macropores in no-tillsoils, Soil Sci. Soc. Am. J., 57, 1560–1567.
Flury, M. (1996), Experimental evidence of transport of pesticides throughfield soils—A review, J. Environ. Qual., 25(1), 25–45.
Giambelluca, T. W., K. Loague, R. E. Green, and M. A. Nullet (1996),Uncertainty in recharge estimation: Impact on groundwater vulnerabilityassessments for the Pearl Harbor basin, O’ahu, Hawai’i, USA, J. Contam.Hydrol., 23(1–2), 85–112, doi:10.1016/0169-7722(95)00084-4.
Hayes, T., K. Haston, M. Tsui, A. Hoang, C. Haeffele, and A. Vonk (2003),Atrazine induced hermaphroditism at 0.1 ppb in American leopard frogs(Rana pipiens): Laboratory and field evidence, Environ. Health Per-spect., 111(4), 568–575.
Heppell, C. M., F. Worrall, T. P. Burt, and R. J. Williams (2002), A classi-fication of drainage and macropore flow in an agricultural catchment,Hydrol. Processes, 16(1), 27–46, doi:10.1002/hyp.282.
Insightful Corporation (2005), S-PLUS Version 7.0 for Windows: Manual,Seattle, Wash.
Kasteel, R., T. Putz, and H. Vereecken (2006), An experimental and numer-ical study on flow and transport in a field soil using zero-tension lysi-meters and suction plates, Eur. J. Soil Sci., 58, 632–645, doi:10.1111/j.1365-2389.2006.00850.x.
Kladivko, E. J., L. C. Brown, and J. L. Baker (2001), Pesticide transport tosubsurface tile drains in humid regions of North America, Crit. Rev.Environ. Sci. Tech., 31(1), 1–62, doi:10.1080/20016491089163.
Leonard, R. (1990), Movement of pesticides into surface waters, in Pesti-cides in the Soil Environment, edited by H. Cheng, pp. 303–349, SoilSci. Soc. Am., Madison, Wis.
Malone, R. W., J. Weatherington-Rice, M. J. Shipitalo, N. R. Fausey, L. Ma,L. R. Ahuja, R. D. Wauchope, and Q. Ma (2004), Herbicide leaching asaffected by macropore flow and within-storm rainfall intensity variation:A RZWQM simulation, Pest Manage. Sci., 60, 277–285.
McCarty, L. S., and C. J. Borgert (2006), Review of the toxicity of chemicalmixtures: Theory, policy, and regulatory practice, Regul. Toxicol. Phar-macol., 45, 119–143, doi:10.1016/j.yrtph.2006.03.004.
McGrath, G. S., C. Hinz, and M. Sivapalan (2007), Temporal dynamics ofhydrological threshold events, Hydrol. Earth Syst. Sci., 11, 923–938.
McGrath, G. S., C. Hinz, and M. Sivapalan (2008a), Modeling the impactof within-storm variability of rainfall on the loading of solutes to pre-ferential flow pathways, Eur. J. Soil Sci., 59, 24–33, doi:10.1111/j.1365-2389.2007.00987.x.
McGrath, G. S., C. Hinz, and M. Sivapalan (2008b), Modeling the effect ofrainfall intermittency on the variability of solute persistence at the soilsurface, Water Resour. Res., 44, W09432, doi:10.1029/2007WR006652.
Muller, K., R. E. Smith, T. K. James, P. T. Holland, and A. Rahman (2003),Spatial variability of atrazine dissipation in an allophanic soil, PestManage. Sci., 59(8), 893–903, doi:10.1002/ps.693.
Nolan, B. T., I. G. Dubus, N. Surdyk, H. J. Fowler, A. Burton, J. M. Hollis,S. Reichenberger, and N. J. Jarvis (2008), Identification of key climaticfactors regulating the transport of pesticides in leaching and to tile drains,Pest Manage. Sci., 64, 933–944, doi:10.1002/ps.1587.
Putz, T. (1993), Lysimeterversuche zum Verlagerungsverhalten von Metha-benzthiazuron und gelostem organischen Kohlenstoff in einer Parabrau-nerde, Aufbau von zwei Klimamestationen und Untersuchungen zurValidierung des Lysimetersystems, Band 2812, report, Forschungszent.Juelich, Juelich, Germany.
Putz, T., W. Mittelstaedt, and F. Fuhr (1998), Seasonal changes of [phenyl-u-’4c]-methabenzthiazuron loads in soil solution under practical farmingconditions, Chemosphere, 31(8), 1531–1545.
Putz, T., H. Vereecken, and B. Brumhard (1999), Water movement andpesticide transport on various scales, in Modeling of Transport Processesin Soils at Various Scales in Time and Space, pp. 536–545, WageningenPress, Wageningen, Netherlands.
Qian, S., and C. Anderson (1999), Exploring factors controlling the varia-bility of pesticide concentrations in the Willamette River basin using tree-
W02513 MCGRATH ET AL.: IDENTIFYING RAPID TRANSPORT RAIN EVENTS
11 of 12
W02513

based models, Environ. Sci. Technol., 33, 3332–3340, doi:10.1021/es9812148.
Robinson, J., and M. Sivapalan (1997), Temporal scales and hydrologicalregimes: Implications for flood frequency scaling, Water Resour. Res.,33(12), 2981–2999, doi:10.1029/97WR01964.
Rouchaud, J., P. Roucourt, M. V. Himme, F. Benoit, N. Ceustermans,J. Gillet, W. Plumier, and G. Vulsteke (1998), Metabolism of metha-benzthiazuron in the soil of pea crops, J. Agric. Food Chem., 36,642–645, doi:10.1021/jf00081a059.
Simunek, J., K. Huang, and M. T. van Genuchten (1998), The HYDRUScode for simulating the one-dimensional movement of water, heat, andmultiple solutes in variably saturated media, version 6.0, Res Rep. 144,164 pp., U.S. Salinity Lab., Agric. Res. Serv., U.S. Dep. of Agric.,Riverside, Calif.
Steenhuis, T. S., J. Boll, G. Shalit, J. S. Selker, and I. A. Merwin (1994), Asimple equation for predicting preferential flow solute concentrations,J. Environ. Qual., 23(5), 1058–1064.
Struthers, I., C. Hinz, M. Sivapalan, G. Deutschmann, F. Beese, andR. Meissner (2003), Modeling the water balance of a free-draining lysi-meter using the downward approach, Hydrol. Processes, 17(11), 2151–2169, doi:10.1002/hyp.1326.
Struthers, I., C. Hinz, and M. Sivapalan (2007), Conceptual examination ofclimate-soil controls upon rainfall partitioning in an open-fractured soil:I. Single storm response, Adv. Water Res., 30(3), 505–517, doi:10.1016/j.advwatres.2006.04.006.
Venables, W., and B. Ripley (1994), Modern Applied Statistics With S-Plus,2nd ed., Springer, New York.
Vereecken, H. (2005), Mobility and leaching of glyphosate: A review, PestManage. Sci., 61, 1139–1151, doi:10.1002/ps.1122.
Wustemeyer, A. (2000), Abbau und Transport von Ethidimuron und Metha-benzthiazuron in einer Parabraunerde, Beitrag zur Validierung des Lysi-meterkonzepts, Ph.D. dissertation, Rheinische Friedrich-Wilhelms-Univ.,Bonn, Germany.
Zetler, F. I. (1998), Ungesto Saulenversuche zum von Sorptionsverhaltenvon [14C]Ethidimuron und Bromid in einer Parabraunerde ausSchwemmlo in Abhangigkeit der Beregnungsintensitat und Batchversuchzur Berechnung von Adsorptionsund Desorptionsisothermen und Vertei-lungskoeffizienten von Ethidimuron, M.S. thesis, Dep. of Chem. Eng.,Univ. of Appl. Sci. Aachen, Aachen, Germany.
����������������������������J. Dressel, BASF SE, Carl-Bosch-Str. 64, D-67117 Limburgerhof,
Germany. ([email protected])C. Hinz and G. S. McGrath, School of Earth and Environment,
University of Western Australia, 35 Stirling Hwy., Crawley, WA 6009,Australia. ([email protected]; [email protected])
T. Putz and H. Vereecken, Agrosphere, ICG-4, Forschungszentrum JulichGmbH, Leo-Brandt-Str., D-52425 Julich, Germany. ([email protected];[email protected])
M. Sivapalan, Department of Geography, University of Illinois atUrbana-Champaign, 220 Davenport Hall, 607 S. Mathews Ave., Urbana, IL61801, USA. ([email protected])
12 of 12
W02513 MCGRATH ET AL.: IDENTIFYING RAPID TRANSPORT RAIN EVENTS W02513
Copyright © 2022 FDOKUMEN