Simulation of Leaching Losses in the Nitrogen Cycle
25
Simulation of Leaching Losses in the Nitrogen Cycle Argyrios Gerakis Department of Organic Farming, TEI of Ionian Islands, Argostoli, Greece Daniel P. Rasse Bioforsk, Norwegian Institute for Environmental and Agricultural Research, A ˚ s, Norway Yasemin Kavdir Department of Soil Science, Canakkale Onsekiz Mart University, Conakkale, Turkey Alvin J. M. Smucker Department of Crop and Soil Sciences, Michigan State University, East Lansing, Michigan, USA Irene Katsalirou Department of Plant and Soil Sciences, Oklahoma State University, Stillwater, Oklahoma, USA Joe T. Ritchie Department of Crop and Soil Sciences, Michigan State University, East Lansing, Michigan, USA Abstract: The CERES (Crop Estimation through Resource and Environment Synthesis) family of crop models predicts cereal growth, development, and yield. CERES simulates nitrogen (N) as a yield-limiting macronutrient. Because N leaching is an economic and environmental concern, this study evaluated if CERES Received 12 April 2005, Accepted 28 October 2005 Address correspondence to Argyrios Gerakis, Department of Organic Farming, TEI of Ionian Islands, P.O. Box 66, 28100 Argostoli, Greece. E-mail: [email protected] Communications in Soil Science and Plant Analysis, 37: 1973–1997, 2006 Copyright # Taylor & Francis Group, LLC ISSN 0010-3624 print/1532-2416 online DOI: 10.1080/00103620600767462 1973
Transcript of Simulation of Leaching Losses in the Nitrogen Cycle

Simulation of Leaching Lossesin the Nitrogen Cycle
Argyrios Gerakis
Department of Organic Farming, TEI of Ionian Islands,
Argostoli, Greece
Daniel P. Rasse
Bioforsk, Norwegian Institute for Environmental and Agricultural
Research, As, Norway
Yasemin Kavdir
Department of Soil Science, Canakkale Onsekiz Mart University,
Conakkale, Turkey
Alvin J. M. Smucker
Department of Crop and Soil Sciences, Michigan State University,
East Lansing, Michigan, USA
Irene Katsalirou
Department of Plant and Soil Sciences, Oklahoma State University,
Stillwater, Oklahoma, USA
Joe T. Ritchie
Department of Crop and Soil Sciences, Michigan State University,
East Lansing, Michigan, USA
Abstract: The CERES (Crop Estimation through Resource and Environment
Synthesis) family of crop models predicts cereal growth, development, and yield.
CERES simulates nitrogen (N) as a yield-limiting macronutrient. Because N
leaching is an economic and environmental concern, this study evaluated if CERES
Received 12 April 2005, Accepted 28 October 2005
Address correspondence to Argyrios Gerakis, Department of Organic Farming, TEI
of Ionian Islands, P.O. Box 66, 28100 Argostoli, Greece. E-mail: [email protected]
Communications in Soil Science and Plant Analysis, 37: 1973–1997, 2006
Copyright # Taylor & Francis Group, LLC
ISSN 0010-3624 print/1532-2416 online
DOI: 10.1080/00103620600767462
1973

can be used to predict N leaching under different N management scenarios: background
leaching in unfertilized corn (Zea mays L.), alfalfa (Medicago sativa L.) residue min-
eralization, and till versus no-till management. Data were collected during a 7-yr field
experiment on tillage practices in a maize–alfalfa–maize succession. Sensitivity
analyses were performed for decomposition rates of the different residue pools and
the relative proportions of carbohydrate, cellulose, and lignin in the residues. During
the last 5 yr, under corn, CERES accurately simulated nitrate leaching from the no-
till lysimeters. Nitrate leaching was underestimated in the tillage treatments,
possibly because CERES does not simulate tillage. The model is not very sensitive
to the decomposition rates and to the composition of the residues.
Keywords: CERES, DSSAT, mineralization, modeling, nitrogen balance, residues,
tillage
Software availability: The CERES models (Crop Estimation through
Resource and Environment Synthesis) are the cereal component of the
software package DSSAT (Decision Support System for Agrotechnology
Transfer). DSSAT is a product of the IBSNAT (International Benchmark
Sites Network for Agrotechnology Transfer) project, sponsored by the U.S.
Agency for International Development during 1982–1992. DSSAT has
since been maintained and developed by a network of volunteers at univer-
sities and research organizations. Currently, DSSAT is available from
ICASA (International Consortium for Agricultural Systems Applications),
2440 Campus Rd., Box 527, Honolulu, HI 96822, USA; phone þ1 808 956
7531; fax þ1 808 956 2711; e-mail [email protected]. An order form is
available on the World Wide Web at http://www.icasa.net/dssat/order.html
(verified 19 March 2005). The modifications to DSSAT that were necessary
for this research are available free of charge from the senior author.
INTRODUCTION
CERES (Crop Estimation through Resource and Environment Synthesis) is a
family of crop–soil–atmosphere models that predict cereal growth, develop-
ment, and yield (Jones and Kiniry 1986). CERES models include components
that simulate nitrogen (N) balances in both soils and plants. Because of the risk
of groundwater contamination by nitrates, N management in the soil–plant
system has become an important component of modern agronomy. Because
of its many successful applications and its relatively long existence, the
CERES family of models is used by numerous scientists and extension
agents. Although CERES has mostly been used for yield prediction, their
use could be expanded if multiple scenarios of N management could be
predicted. Vigil, Kissel, and Smith (1991) tested an early version of CERES
for the amount of mineralized N and N recovered from residues by
sorghum and wheat. The model demonstrated reasonable fit with measured
A. Gerakis et al.1974

data after calibration of critical parameters. Gerakis (1994) tested the N
component of CERES with data from a controlled water table experiment in
lysimeters by reporting reasonable agreement between model predictions
and the cumulative N outflow from lysimeters. Quemada and Cabrera
(1995) and Quemada, Cabreara, and McCraken (1997) reported that CERES
predictions of soil N originating from residue mineralization is sensitive to
the decomposition rates and relative proportions of the carbohydrate,
cellulose, and lignin fractions of the residues.
The first objective of this work was to evaluate how well CERES predicts
N leaching under different N management scenarios: background leaching
from a corn crop without fertilizer, leaching from alfalfa residue mineraliz-
ation, and leaching from a tilled and non-tilled agroecosystem.
The second objective was to evaluate how sensitive the leaching predic-
tion is to N mineralization parameters: decomposition rates of the different
residue fractions and the relative proportion of each fraction in the compo-
sition of residues.
MATERIALS AND METHODS
Model Overview
CERES is a family of functional, deterministic, crop–soil–atmosphere
models. The CERES models are an important component of the Decision
Support System for Agrotechnology Transfer (DSSAT), a product of the Inter-
national Benchmark Sites Network for Agrotechnology Transfer (IBSNAT,
Tsuji, Uehara, and Balas 1994).
The CERES models have been tested worldwide. Entenmann and
Allison (1991) tested CERES for corn leaf area, dry matter, phenology,
and soil water nitrate content and found good agreement, overall. Jintrawet
et al. (1991) successfully simulated yield of nonphotosensitive rice
cultivars and heading and maturity dates of photosensitive ones. Kiniry
and Jones (1986) presented test results for corn phenology, leaf area index,
biomass, grain number, grain yield, total N uptake, grain N concentrations,
and grain N uptake. Correlations between measured and simulated values
were statistically significant. Vigil, Kissel, and Smith (1991) tested the
model for amount of mineralized N and N recovered from residues by
sorghum and wheat. The model showed reasonable fit after calibration of
critical parameters. The CERES models have also been used for 1) risk
analysis and multicriteria optimization of production (Alocilja and Ritchie
1990; Martin 1992); 2) site-specific irrigation management (Ritchie and
Amato 1990); and 3) assessment of global climate change, in conjunction
with climate models (Adams et al. 1990).
The CERES models simulate the effects of cultivar, planting density,
weather, soil water, and N on crop growth, development, and yield. They
Simulation of Leaching Losses in the Nitrogen Cycle 1975
do not simulate the effects of pests, nutrients (except N), catastrophic weather,
or tillage. Yet, users may adapt and extend the model to suit specific needs.
The models simulate multiyear crop rotations (Tsuji, Uehara, and Balas
1994). The generic CERES version includes corn, wheat (Triticum
aestivum, T. durum), sorghum (Sorghum bicolor), pearl millet (Pennisetum
typhoides), and barley (Hordeum vulgare) models.
The CERES models require minimum inputs of soil and weather data,
which are routinely collected in most parts of the world or can be reasonably
estimated (Ritchie and Crum 1989; Ritchie, Godwin, and Singh 1990;
Ritchie 1998). The soil profile is divided into layers; therefore, values for
soil properties must be specified for each layer. Weather inputs are daily
values.
A typical run of CERES includes the following steps: reading of daily
weather data; simulation of soil temperature; and simulation of soil water
balance, N transformations, plant growth and phenology. This sequence is
repeated for every day of the simulation for the duration of a season or
throughout the year.
The Nitrogen Component in CERES
Model simulation of soil N and crop growth interact in a feed forward and
feedback relationship. If there is a soil deficit relative to plant demand,
CERES calculates N stress coefficients that impact plant growth and develop-
ment. In turn, plant growth and development affect the demand for N. A set of
options allows crop simulation with unlimited N supply, which suppresses the
simulation of the N budget. The N budget is also suppressed when the water
balance is suppressed, because simulation of the N cycle requires knowledge
of water fluxes and soil water content. Figure 1 is a flowchart of the N-related
modules (subroutines) in CERES, in the approximate calling sequence.
Module names are in uppercase. The N component of CERES is explained
fully by Godwin and Jones (1991).
Modifications to CERES, Version 3.5
Several subroutines of CERES, version 3.5, had to be modified to meet the
objectives of this study. Some routines responded erratically in preliminary
runs because of the very low soil N concentrations in the test data. Other
subroutines were modified so that model output files could be easily
imported and evaluated in a spreadsheet or graphing package. The lack
of an adequate graphing utility in DSSAT necessitates the use of a
separate software package for plotting results. The modifications of the
CERES source code and of the input and output files are described in
the appendix.
A. Gerakis et al.1976

Field Testing
Nitrogen-conserving agricultural systems are increasingly sought by agricul-
tural environmentalists. The leaching of nitrates through the soil profiles in
corn production is responsive to tillage systems and N fertilizer inputs.
Corn N fertilization tends to augment NO3 leaching when applications are
Figure 1. Flowchart of the N balance in the CERES models. Module (subroutine)
names are in uppercase. The full description is in Godwin and Jones (1991).
Simulation of Leaching Losses in the Nitrogen Cycle 1977

in excess of plant uptake (Gast, Nelson, and Randall 1978; Angle et al. 1993).
Total NO3 losses by deep leaching appear to be slightly higher for conven-
tional tillage than no-tillage soils, through soil profiles under corn production
(Randall and Ivaragarapu 1995; Weed and Kanwar 1996).
On the other hand, Rasse and Smucker (1999) suggest that tillage man-
agement is not the only decisive factor controlling NO3 leaching from the
fields. Alfalfa stands may increase N availability to the subsequent crop
through mineralization of alfalfa residues. Alfalfa absorbs considerable quan-
tities of N and fixes N (Lamb et al. 1995). Rasse and Smucker (1999) found
that 2 years after planting, alfalfa crowns and roots stored at least 97 to
133 kg ha21 of total N. However, a mineralization burst from spray-killed or
plowed-under alfalfa, during its rapid decomposition, leads to high levels of
NO3 leached to the groundwater if its decomposition is not timed to match
crop consumption (Campbell et al. 1994; Philipps and Stopes 1995; Rasse
and Smucker 1999).
Baseline leaching of nitrate nitrogen (NO3-N) through profiles of
medium-textured loam soils under unfertilized corn can also be significant.
Rasse and Smucker (1999) report that 21 to 25 kg ha21 of NO3-N was
leached annually from unfertilized corn. Knowledge and prediction of this
baseline leaching is important in managing N fertilizer.
Based on this information, we decided to simulate an experiment
where three potential factors in fertilizer management could be observed:
background leaching of zero N fertilization, alfalfa mineralization, and
tillage.
MATERIALS AND METHODS
A corn–alfalfa–corn sequence was studied from 1991 to 1998 as part of a
long-term field experiment investigating N supply and tillage effects on
soil–plant interactions. Field plots, 40 by 27m each, were established in
1986 in a randomized complete block design in a Kalamazoo loam soil
(fine loamy, mixed, mesic Typic Hapludalf) at the Long-Term Ecological
Research (LTER, http://www.lter.kbs.msu.edu) site of the Kellogg Biological
Station (KBS, http://www.kbs.msu.edu) in southwestern Michigan. Soil
horizons are a loamy Ap from 0 to 0.30m, which overlays a clay loam Bt1
from approximately 0.30 to 0.55m, then a Bt2 enriched in coarse material
from approximately 0.55 to 0.75m, underlaid by a coarse sandy glacial
outwash parent material. Treatments, replicated four times, consisted of 1)
conventional tillage and no fertilization (CT-NF), 2) no tillage and no fertiliza-
tion (NT-NF), 3) conventional tillage and fertilization (CT-F), and 4) no
tillage and fertilization (NT-F). Undisturbed monolith stainless steel lysi-
meters, 1.2 by 1.8m on surface area and 2.1m deep, were installed in two
NT-NF and two CT-NF plots in 1990. Figure 2 shows a cross section of a
lysimeter.
A. Gerakis et al.1978

The lysimeters, which were identically managed to the field plots, were
manually tilled (where applicable), planted, and harvested. Crops were
planted at high density in the lysimeters and later thinned to guarantee a
uniform plant density matching field conditions. Total biomass per
lysimeter was recorded and, as for field plots, subsamples were taken for
moisture content and total N analyses. Table 1 lists the rotation species,
cultivar, and planting and harvesting dates.
Table 2 lists the soil properties. Figure 3 is initial soil N for the 1991 and
1996 growing seasons. The lysimeters were not fertilized prior to September
1990, at which time approximately 10 times the normal application rate of
nitrate ammonia fertilizer was unintentionally applied. Because of the uncer-
tainty in the applied fertilization in 1990 (Aiken 1992), measurements of N
leaching in the period from 2 May 1991 to 1 May 1993 were not compared
with the simulations. Further details of the experiment are in Ostrom et al.
(1998) and Rasse and Smucker (1999).
Figure 2. Diagrammatic representation of a natural soil profile lysimeter with a sur-
face area of 2.79m2 and a total volume of 5.67m3, encased in stainless steel and lined
at the base with Teflonw screen, 120-micron openings, located above a layer of pea-
sized gravel that facilitates natural drainage through the port at the bottom of the
lysimeter. The natural soil profile is located above the Teflon screen. Minirhizotrons,
suction soil solution samplers, time domain reflectometry wave guides, Teflon gas
sampling tubes, 0.03mm ID, are located 2 cm above and 2 cm below each interface
of the natural soil horizons.
Simulation of Leaching Losses in the Nitrogen Cycle 1979

Statistical Measures
Agreement between measured and simulated cumulative N leaching was
compared graphically and with the normalized RMSE (root mean square
error). The RMSE estimates the variation, expressed in the same units as
data, between simulated and measured values (Loague and Green 1991;
Xevi, Gilley, and Feyen 1996). The RMSE tests the accuracy of the model,
which is how much simulated values approach a corresponding set of
measured values (Loague and Green 1991). The RMSE can also be
expressed as a coefficient of variation, by dividing it by the mean of the
measured values. This normalized RMSE (NMRSE) is defined as:
NRMSE ¼ 1001
�y
1
n
Xni¼1
ðyi � yiÞ2
" #1=2
ð1Þ
where yi is the ith observed value, yi is the ith simulated value, n is the number
of comparisons, and y is the mean of observations.
For the sensitivity analysis, decomposition rates for the carbohydrate,
cellulose, and lignin fractions were varied 50% more than and 50% less
than the default rates (Table 3). These ranges are similar to the adjustments
that Quemada, Cabrera, and McCraken (1997) proposed to the default rates
of CERES. The NRMSE and total NO3-N leaching were compared. To
calculate the effect of the composition of residues, the carbohydrate content
was varied 50% more than and 50% less than the default content (Table 3).
These ranges are similar or exceed the range of the carbohydrate content
encountered in various plant residues (Quemada, Cabrera, and McCracken
1997). We chose to vary the carbohydrate because it is the most dynamic
fraction of fresh organic matter.
Table 1. Rotation species, cultivar, and start and end date of
cultivation
Rotation species and
cultivar Start date End date
Corn (Pioneer 3704) 16 May 1991 30 Sep. 1991
Corn (Pioneer 3704) 8 May 1992 30 Oct. 1992
Corn (Great Lakes 450) 8 May 1993 22 Oct. 1993
Corn (Pioneer 3573) 6 May 1994 22 Aug. 1994
Alfalfa (Pioneer 5246) 1 Sep. 1994 2 May 1996
Corn (Pioneer 3573) 13 May 1996 4 Sep. 1996
Corn (Pioneer 3573) 10 June 1997 18 Nov. 1997
A. Gerakis et al.1980
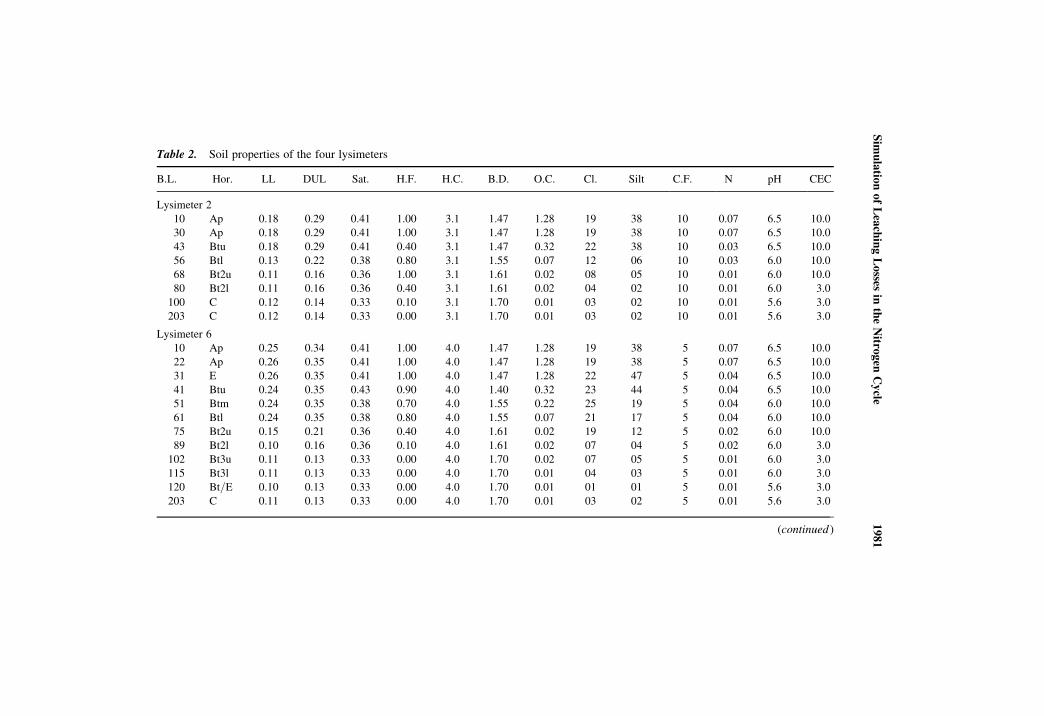
Table 2. Soil properties of the four lysimeters
B.L. Hor. LL DUL Sat. H.F. H.C. B.D. O.C. Cl. Silt C.F. N pH CEC
Lysimeter 2
10 Ap 0.18 0.29 0.41 1.00 3.1 1.47 1.28 19 38 10 0.07 6.5 10.0
30 Ap 0.18 0.29 0.41 1.00 3.1 1.47 1.28 19 38 10 0.07 6.5 10.0
43 Btu 0.18 0.29 0.41 0.40 3.1 1.47 0.32 22 38 10 0.03 6.5 10.0
56 Btl 0.13 0.22 0.38 0.80 3.1 1.55 0.07 12 06 10 0.03 6.0 10.0
68 Bt2u 0.11 0.16 0.36 1.00 3.1 1.61 0.02 08 05 10 0.01 6.0 10.0
80 Bt2l 0.11 0.16 0.36 0.40 3.1 1.61 0.02 04 02 10 0.01 6.0 3.0
100 C 0.12 0.14 0.33 0.10 3.1 1.70 0.01 03 02 10 0.01 5.6 3.0
203 C 0.12 0.14 0.33 0.00 3.1 1.70 0.01 03 02 10 0.01 5.6 3.0
Lysimeter 6
10 Ap 0.25 0.34 0.41 1.00 4.0 1.47 1.28 19 38 5 0.07 6.5 10.0
22 Ap 0.26 0.35 0.41 1.00 4.0 1.47 1.28 19 38 5 0.07 6.5 10.0
31 E 0.26 0.35 0.41 1.00 4.0 1.47 1.28 22 47 5 0.04 6.5 10.0
41 Btu 0.24 0.35 0.43 0.90 4.0 1.40 0.32 23 44 5 0.04 6.5 10.0
51 Btm 0.24 0.35 0.38 0.70 4.0 1.55 0.22 25 19 5 0.04 6.0 10.0
61 Btl 0.24 0.35 0.38 0.80 4.0 1.55 0.07 21 17 5 0.04 6.0 10.0
75 Bt2u 0.15 0.21 0.36 0.40 4.0 1.61 0.02 19 12 5 0.02 6.0 10.0
89 Bt2l 0.10 0.16 0.36 0.10 4.0 1.61 0.02 07 04 5 0.02 6.0 3.0
102 Bt3u 0.11 0.13 0.33 0.00 4.0 1.70 0.02 07 05 5 0.01 6.0 3.0
115 Bt3l 0.11 0.13 0.33 0.00 4.0 1.70 0.01 04 03 5 0.01 6.0 3.0
120 Bt/E 0.10 0.13 0.33 0.00 4.0 1.70 0.01 01 01 5 0.01 5.6 3.0
203 C 0.11 0.13 0.33 0.00 4.0 1.70 0.01 03 02 5 0.01 5.6 3.0
(continued )
Sim
ulatio
nofLeachingLosses
intheNitro
gen
Cycle
1981
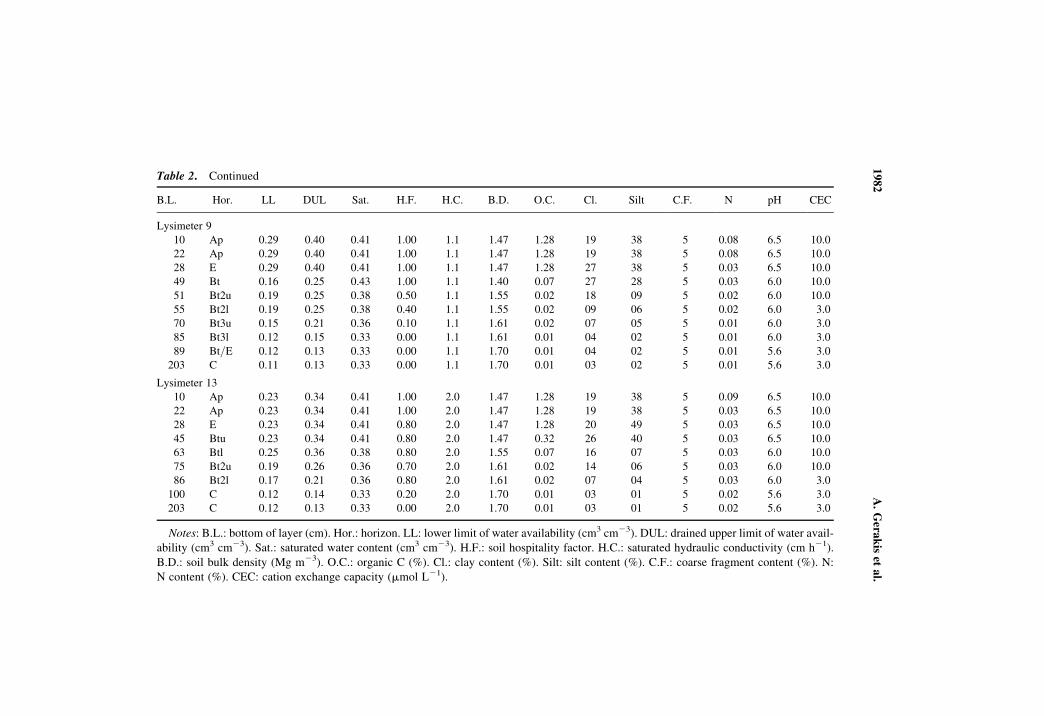
Table 2. Continued
B.L. Hor. LL DUL Sat. H.F. H.C. B.D. O.C. Cl. Silt C.F. N pH CEC
Lysimeter 9
10 Ap 0.29 0.40 0.41 1.00 1.1 1.47 1.28 19 38 5 0.08 6.5 10.0
22 Ap 0.29 0.40 0.41 1.00 1.1 1.47 1.28 19 38 5 0.08 6.5 10.0
28 E 0.29 0.40 0.41 1.00 1.1 1.47 1.28 27 38 5 0.03 6.5 10.0
49 Bt 0.16 0.25 0.43 1.00 1.1 1.40 0.07 27 28 5 0.03 6.0 10.0
51 Bt2u 0.19 0.25 0.38 0.50 1.1 1.55 0.02 18 09 5 0.02 6.0 10.0
55 Bt2l 0.19 0.25 0.38 0.40 1.1 1.55 0.02 09 06 5 0.02 6.0 3.0
70 Bt3u 0.15 0.21 0.36 0.10 1.1 1.61 0.02 07 05 5 0.01 6.0 3.0
85 Bt3l 0.12 0.15 0.33 0.00 1.1 1.61 0.01 04 02 5 0.01 6.0 3.0
89 Bt/E 0.12 0.13 0.33 0.00 1.1 1.70 0.01 04 02 5 0.01 5.6 3.0
203 C 0.11 0.13 0.33 0.00 1.1 1.70 0.01 03 02 5 0.01 5.6 3.0
Lysimeter 13
10 Ap 0.23 0.34 0.41 1.00 2.0 1.47 1.28 19 38 5 0.09 6.5 10.0
22 Ap 0.23 0.34 0.41 1.00 2.0 1.47 1.28 19 38 5 0.03 6.5 10.0
28 E 0.23 0.34 0.41 0.80 2.0 1.47 1.28 20 49 5 0.03 6.5 10.0
45 Btu 0.23 0.34 0.41 0.80 2.0 1.47 0.32 26 40 5 0.03 6.5 10.0
63 Btl 0.25 0.36 0.38 0.80 2.0 1.55 0.07 16 07 5 0.03 6.0 10.0
75 Bt2u 0.19 0.26 0.36 0.70 2.0 1.61 0.02 14 06 5 0.03 6.0 10.0
86 Bt2l 0.17 0.21 0.36 0.80 2.0 1.61 0.02 07 04 5 0.03 6.0 3.0
100 C 0.12 0.14 0.33 0.20 2.0 1.70 0.01 03 01 5 0.02 5.6 3.0
203 C 0.12 0.13 0.33 0.00 2.0 1.70 0.01 03 01 5 0.02 5.6 3.0
Notes: B.L.: bottom of layer (cm). Hor.: horizon. LL: lower limit of water availability (cm3 cm23). DUL: drained upper limit of water avail-
ability (cm3 cm23). Sat.: saturated water content (cm3 cm23). H.F.: soil hospitality factor. H.C.: saturated hydraulic conductivity (cm h21).
B.D.: soil bulk density (Mg m23). O.C.: organic C (%). Cl.: clay content (%). Silt: silt content (%). C.F.: coarse fragment content (%). N:
N content (%). CEC: cation exchange capacity (mmol L21).
A.Gera
kiset
al.
1982

Data Utilization
The drainage and leaching data from the LTER lysimeters had been collected
and stored over the years by different investigators in various formats. The first
task was to locate and combine all the data into a few uniform digital files.
Same-type measurements were converted to common units, matching the
observation depths among the four lysimeters, outlier data were removed,
and data gaps were filled. The criteria for removing outlier observations and
filling in missing values were as follows:
For some dates, there were drainage volume measurements, but no NO3-N
concentration measurements. Missing effluent NO3-N concentrations were
interpolated. Interpolation was simply the averaging of the NO3-N concen-
trations before and after the missing date.
For some dates, there were NO3-N concentration measurements but no
drainage volume measurements. Because the missing drainage measurement
could not be guessed, those NO3-N concentrations were averaged with the
next date that had both NO3-N concentration and drainage volume
measurement.
Occasionally, there was a note in the data records that the container that
collected the effluent overflowed. In these cases, it was assumed that the
drainage volume for that date was equal to the container capacity (0.058m3
for 1991–94, 0.056m3 for 1996–98).
Figure 3. Initial cumulative soil N with depth on 2 May 1991 and 2 May 1996. The
1991 plot shows the high N pulse caused by the unintended fertilization in Sep. 1990.
Simulation of Leaching Losses in the Nitrogen Cycle 1983
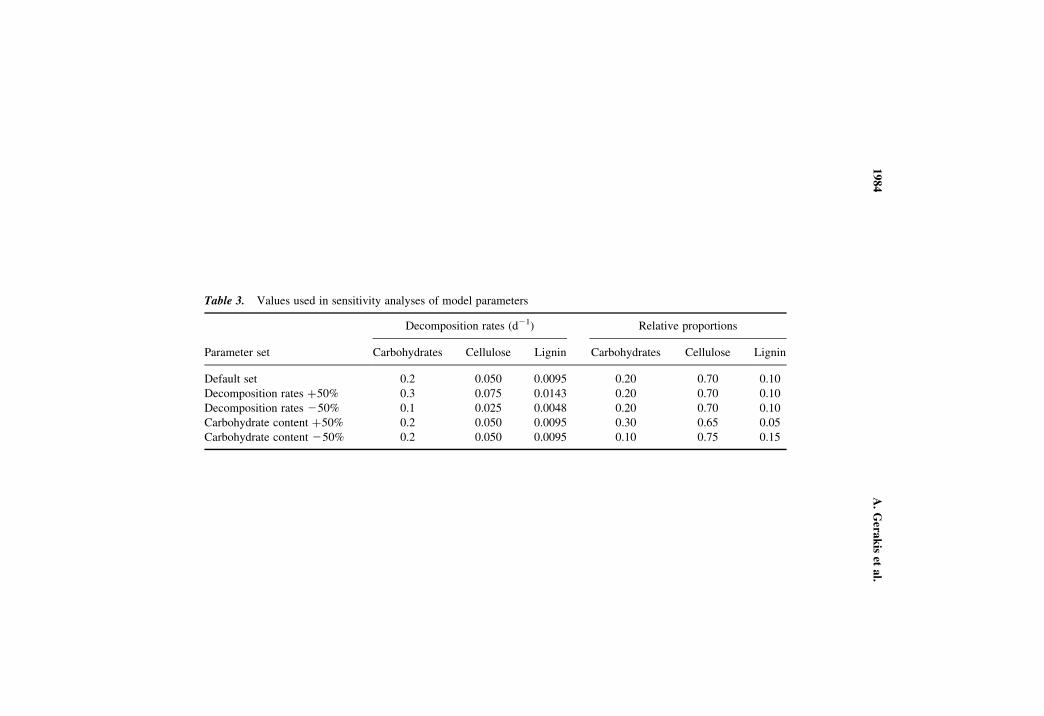
Table 3. Values used in sensitivity analyses of model parameters
Parameter set
Decomposition rates (d21) Relative proportions
Carbohydrates Cellulose Lignin Carbohydrates Cellulose Lignin
Default set 0.2 0.050 0.0095 0.20 0.70 0.10
Decomposition rates þ50% 0.3 0.075 0.0143 0.20 0.70 0.10
Decomposition rates 250% 0.1 0.025 0.0048 0.20 0.70 0.10
Carbohydrate content þ50% 0.2 0.050 0.0095 0.30 0.65 0.05
Carbohydrate content 250% 0.2 0.050 0.0095 0.10 0.75 0.15
A.Gera
kiset
al.
1984
Sometimes, instead of two concentrations, one for each replicate
lysimeter, only the mean was recorded. In these cases, we used the mean con-
centration to represent each replicate.
Soil water content measurements from 27 June 1997 to 10 February 1998
were discarded because they were higher than the calculated total soil
porosity. Total soil porosity was calculated from measured bulk density:
e ¼ 1�rb
rdð2Þ
where e is total soil porosity, rb is soil bulk density, and rd is soil particle
density equal to 2.65Mgm23, the mineral density of quartz.
Weather data from the Kalamazoo airport, about 25 km from the exper-
iment site, was used. These precipitation data were consistent with drainage
records. Temperature for 2 days had to be corrected because minimum temp-
erature was recorded higher than maximum temperature.
Measured drainage was sometimes erratic. Drainage volume for all lysi-
meters should be approximately the same over a long period of time, because
the same amount of rain falls on all lysimeters. However, the large error bars
in the later period of drainage measurements (Figure 4) suggest problems. A
known problem is missing drainage measurements between 4 March and 28
May 1997.
Therefore, measured concentrations times simulated drainage volume to
calculate total NO3-N leaching were used. Using the conservative approach
of a water balance model in which every item of the water balance is
accounted for, the error possibly is relatively small. With lysimeters, we
have nonrepresentative lower boundary conditions but conservative measure-
ments most of the time. With direct measurements or estimates of the
hydraulic gradient and conductivity, the possible errors are high considering
spatial variability and the disturbance of the system with the instruments. If
one uses estimates of the hydraulic dynamics, that is only a model also.
Once the soil water limits were calibrated (as described in the next section),
we believe that simulated drainage more accurately represents actual
drainage in our experiment. For that, indirect and direct evidence is
provided. The indirect evidence is the soil water contents, a series of
“snapshots” in time of the soil water status (Figures 5–7). The direct
evidence is that for two periods (2 May 1993 to 30 April 1994 and 1 May
to 31 August 1994), simulated drainage is in good agreement with the
measured data (Figure 4).
Calibration of Soil Water Limits
Approximately 1 year of TDRmeasurements of soil water content (2May 1993
to 30 April 1994) was used to calibrate the soil water limits. The soil water
Simulation of Leaching Losses in the Nitrogen Cycle 1985

limits are basic soil properties that the model uses to simulate the soil
water balance. The drained upper limit (ud) is the highest, field-measured,
water content of a soil after thorough wetting and draining until drainage
becomes practically negligible. The ud corresponds closely to water content
at “field capacity” and to matric suction in the range of 10 to 33 kPa. The
lower limit, ul, is the lowest, field-measured, volumetric water content of a
soil after plants stop extracting water because of premature death or
dormancy as a result of water deficit. The lower limit corresponds closely to
the water content at the “permanent wilting point” and to matric suction of
1.5MPa (Ritchie, Gerakis, and Suleiman 1999). The potentially plant-extrac-
table water (up) is the difference between the ud and the ul.
From the rapid drop in soil water content after rainfall events, it was
estimated that most of the gravitational water was drained in 1 day. We set
ud equal to the measured water content on 22 March 1994, 1 day after a
major precipitation event (21.3mm). It is possible that the gravitational
Figure 4. Simulated cumulative drainage (lines), measured cumulative drainage
(circles), and cumulative precipitation (triangles). For clarity, cumulative precipitation
is plotted every 10 d. For measured cumulative drainage, every other measurement is
plotted. Vertical error bars are +1 SD for n ¼ 2. Large error bars during the third
period in the no-till treatment indicate problems with drainage measurements. Also,
there is a lack of drainage data between 4 Mar. and 28 May 1997.
A. Gerakis et al.1986

water was not all drained in 1 day. In the same soil, Huang (1995) observed a
decline in water content for as long as 4 days after a major precipitation event.
However, the soil was not covered, and the lysimeters were planted with
crops. We cannot rule out significant soil and plant evaporation losses, in
addition to deep drainage.
We fine-tuned ud to closely match measured to simulated soil water
contents (Figures 5 and 6). The criterion to minimize was the NRMSE at
three depths: 25, 57, and 81 cm, but mostly the NRMSE of the total profile
water to the 81-cm depth. The minimum NRMSE that we achieved for the
individual depths was 22%, and for the total profile water to the 81-cm
depth was 10%. This means that predictions for individual depths are more
erratic than for the whole profile. Apparently the errors caused by the discre-
tization of the soil profile into layers are smoothed out during integration of the
water content over the whole profile (Figure 7).
Part of the NRMSE for the whole profile can be explained because the
measured soil water content at 25 cm was used to represent the 0–25 cm
depth. This overestimated soil water content. Surface soil is more likely to
be drier than at the 25-cm depth because of evaporation.
The potentially plant-extractable water was estimated according to
Ritchie, Gerakis, and Suleiman (1999). We set the lower limit to the difference
between the measured ud and the estimated up. This was in part because of the
difficulty in accurately measuring the lower limit of soil water availability in
Michigan, where it often rains during the summer.
Figure 5. Calibration of soil water content for the till treatment, by layer. Markers are
observed; lines are simulated values.
Simulation of Leaching Losses in the Nitrogen Cycle 1987

Also, it is not possible to optimize the soil water limit inputs for both till
and no-till treatments. This is because the model does not simulate the effect
of tillage. Experimental results using the same soil show that soil water
content in the no-till treatments is maintained at higher levels throughout
the growing season (Huang 1995; Rasse and Smucker 1999). This may be
because the no-till treatment has less crusting of the soil surface and facilitates
infiltration.
RESULTS AND DISCUSSION
Figure 8 shows observed versus simulated NO3-N leaching with time for the
two treatments, till and no till.
Background leaching in the unfertilized corn for two periods (2 May 1993
to 30 April 1994 and 1 May to 31 August 1994) was fairly well simulated,
although the end values are somewhat overestimated. Unless a mass
balance is performed on N, it is difficult to say which model component is
responsible for the small discrepancy. Between 9 and 11 kg ha21 of
measured NO3-N escaped through drainage during the 12-month period of
2 May 1993 to 30 April 1994, a useful quantity to consider when calculating
fertilizer recommendations to farmers. This is the annual baseline NO3-N loss
Figure 6. Calibration of soil water content for the no-till treatment, by layer. Markers
are observed; lines are simulated values.
A. Gerakis et al.1988

that cannot be further reduced, unless there is a cover crop during the winter.
This loss results from the continuous mineralization of plant residues and soil
organic matter.
Background leaching for the 1994 growing season was only simulated
until 31 August 1994. On 1 September 1994, alfalfa was planted. It is
expected that the alfalfa cover crop reduces the N leaching losses after the
corn crop, because it absorbs some of the N released through the mineraliz-
ation of corn roots and residues. Therefore, it was expected that the back-
ground leaching for the 12-month period of 1 May 1994 to 30 April 1995
would be less than for the previous 12-month period, 2 May 1993 to 30
April 1994. Because the CERES models do not simulate alfalfa, the
possible reduction in background leaching effected by the alfalfa cover crop
cannot be simulated.
During alfalfa mineralization (2 May 1996 to 27 March 1998) the mean,
cumulative NO3-N leached from the no-till treatment was accurately
simulated (Figure 8). In the till treatment, leaching was underestimated,
probably because CERES does not simulate tillage. The difference in N
leaching between till and no-till treatments began approximately at the
tillage date (8 May 1996) to the 22-cm depth. These results strongly suggest
that simulation of tillage may improve the predictive capabilities of CERES
with respect to N leaching by adjusting the water content for each
Figure 7. Calibration of soil water content for the till and no-till treatments, for the
soil profile 0 to 81 cm. Markers are observed; lines are simulated values. Some of the
errors caused by the discretization of the soil profile in the model are reduced when soil
water is integrated with depth. Integrated soil water content may be overestimated
because the 25-cm-depth measurement also represents the drier soil surface.
Simulation of Leaching Losses in the Nitrogen Cycle 1989

lysimeter. Huang (1995) has shown that no-till systems maintain more and
better connected macropores. Tillage disrupts macropore continuity. The
implications are twofold: First, water drains faster through a well-connected
macropore network. Second, in no-till systems, the residence time of water
in the soil is less. Nitrate that already is in the interaggregate solution has
less time to come in contact with the fast-moving drainage water. As a
result, we expect less NO3 leaching from no-till systems.
Sensitivity analysis results (Table 4) suggest that varying the decompo-
sition rates of the residues or the carbohydrate content by 50% does not sub-
stantially affect the prediction of N leaching. CERES does not respond much
to changes in decomposition rates with respect to leaching. This seemingly
negates the high importance that Quemada and Cabrera (1995) and
Quemada, Cabrera, and McCracken (1997) place on the accuracy of these par-
ameters, although we think that there is no real disagreement. Quemada,
Cabrera, and McCraken (1997) and Quemada and Cabrera (1995) simulated
N mineralization. If mineralized N is taken up at a sufficiently high rate by
the plants, the effect on leaching should be insignificant, unless N is
released too fast and finds its way to the groundwater before it can be taken
up. The decomposition rate and carbohydrate content in fresh organic
matter does not affect how much total N will be available but rather how
soon it will be available. This is because the C:N ratio in all three fresh
Figure 8. Comparison of observed versus simulated cumulative NO3-N (nitrate nitro-
gen) leaching for the till and no-till treatments. Vertical error bars are+1 SD for n ¼ 2.
Comparison during the third period suggests that simulation of tillage may improve the
predictive capabilities of CERES with respect to NO3-N leaching.
A. Gerakis et al.1990

organic matter pools in CERES is the assumed to be the same. Consequently,
it is concluded that the user can work with default generic values for crop
residue and does not need cultivar-specific soil organic matter mineralization
parameters to accurately estimate potential N leaching losses over long
periods of time.
Also, the version of CERES evaluated by Quemada, Cabrera, and
McCracken (1997) and Quemada and Cabrera (1995) used a higher decompo-
sition rate for carbohydrates. The decay rate, 0.8 d21, originally reported by
Seligman and van Keulen (1981), has since been revised. The current
version of CERES has a default rate of 0.2 d21. This is closer to the first-
order rate constants reported in the literature for easily decomposable
materials (Paul and Van Veen 1978; Verberne et al. 1990; Bowen et al.
1993; Vanotti, Bundy, and Peterson 1997).
There is a caveat in such sensitivity analysis; the default mineralization
rates used in CERES are for nonlimiting conditions of mineralization.
Seldom are field conditions nonlimiting. The actual rate that the model uses
is potentially reduced by temperature, soil water content, and C:N ratio
factors. Therefore, different calibration studies are not necessarily compar-
able. Some may adjust the default rate constant to a higher value simply to
compensate for an environmental deficit factor. Ideally, calibration studies
should use the same data sets, or report the effective rate constants, after
accounting for the environmental modifications. The latter is impractical
because the effective rate constants vary daily.
Experience from this study reveals the following advantages of applying
CERES to simulate the N balance.
Speed of Execution
Because of the daily time step, simulation of a growing season lasts only
seconds on a modern computer. The relatively large soil-depth increments
Table 4. Results from sensitivity analyses of model parameters
Parameter set
NRMSE
(%)
Total NO3-N
leached
(kg ha21)
Difference in total NO3-N
leached compared to
default parameter set (%)
Default set 138 349 0
Decomposition rates þ50% 137 362 þ4
Decomposition rates 250% 139 330 25
Carbohydrate content þ50% 138 356 þ2
Carbohydrate content 250% 138 343 22
Notes: Period simulated is 1 Jan. 1993 to 31Aug. 1994 and 2May1996 to 27Mar. 1998.
NO3-N: nitrate nitrogen.
NRMSE: normalized root mean square error.
Simulation of Leaching Losses in the Nitrogen Cycle 1991

(a few centimeters each) contribute to the speedy simulation of the soil water
and N processes, arguably at the expense of some precision in the results.
Because measurements are also prone to error at small scale, due to soil
spatial variability, we do not consider this a serious drawback.
Simplicity
A model is an abstract representation of reality, and so it includes only the
components that are thought to be relevant for the purposes of the model.
The CERES models are simple enough so that they can be realistically
modified by others. The addition of a tillage component would strengthen
the model for the purpose of studying the water and N balance, without
seriously detracting from its simplicity.
Data Requirements
CERES are typical “functional” models that are founded on capacity concepts
(e.g., the water-storage capacity of the soil) rather than dynamic rate concepts.
Capacity variables often are less spatially variable than rate variables
(Addiscott and Wagenet 1985). Where possible, functional models use
rational empiricisms to integrate almost minute-by-minute variations in
variables such as solar radiation, air temperature, and rainfall into daily
values. Thus, functional models demand less data and computing power
than mechanistic models, without seriously compromising accuracy (Ritchie
and Johnson 1990). Because of its modest input requirements, CERES is
easier to independently test by others. A detailed protocol developed for
data collection ensures that all modelers use data of the same quality and
format (Tsuji, Uehara, and Balas 1994).
The main drawback in using the current version of CERES is the
somewhat old-fashioned interface and lack of a built-in, user-friendly
plotting capability. The output files had to be manipulated extensively to
import them into a spreadsheet (for quick evaluation of the results) and into
the plotting software (to generate publication-quality figures).
CONCLUSIONS
CERES can be a useful aid to agronomists to predict the N budget of the crop–
soil system and manage fertilizer. Fertilizer recommendations can be more
accurate when the baseline leaching potential and residue contributions
from previous crops can be predicted. CERES cannot evaluate the effect of
tillage management; the addition of a tillage component in CERES will
further increase its usefulness. Sensitivity analyses showed that to predict
long-term N leaching, CERES does not require an exact knowledge of miner-
alization parameters of either surface or incorporated alfalfa residues.
A. Gerakis et al.1992

APPENDIX: MODIFICATIONS TO CERES VERSION 3.5
CERES Routines
The following routines are part of the CERES program, that is, the science
core of the DSSAT cereal models.
IPIBS
The unit of variable ROWSP (row spacing) was changed from centimeters to
meters so that the light interception is calculated correctly.
OPNIT
We increased the width of the inorganic N output column to print larger
numbers.
OPDAY
We suppressed the printing of headers in the N, water, and plant growth output
files so that files are more rapidly imported to a spreadsheet and increased the
accuracy of the TLCH (total N leaching) variable to display four significant
digits in the output. The model was forced to print a zero LAI (leaf area
index) when the crop is not growing. We replaced PESW (potentially extrac-
table soil water) with TSW (total soil water) in the water output file.
OPDONE
We suppressed the printing of a blank line at the end of the output files for
water, N, and plant growth. The blank line was confusing to the spreadsheet
programs that were importing the output files.
NTRANS
We placed a zero lower boundary to variable B2 (ammonium nitrified in a
given layer) because it could become negative if ammonium dropped below
0.5mg kg21.
NUPTAK
We placed a zero lower boundary to variable RNH4U (potential ammonium
uptake) because it could become negative if ammonium dropped below
0.5mg kg21. We placed a zero lower boundary to UNO3 and UNH4 (plant
uptake of nitrate and ammonium) to avoid negative values.
Simulation of Leaching Losses in the Nitrogen Cycle 1993
PHASEI
In CERES, transpiration continued even after physiological maturity. We reset
LAI to zero at maturity so that transpiration stops.
Input Program Routines
The following modifications are in the input program, that is, the ancillary
program in DSSAT that handles the input data.
IPSLIN
We set minimum initial N to 0.5mg kg21 in all soil layers. We increased
minimum allowable soil NO3 from 100 to 200mg kg21 to avoid an error
message. These limits are rather high. We have measured NO3 as low as
40–60mg kg21 in the soils that we used to test the model. However, the
daily time step of the model is rather large. Simulated removals of soil NO3
can exceed 100mg kg21 in 1 day, due mostly to leaching and plant uptake.
A more permanent and scientifically appropriate solution would be to limit
the large daily fluctuations of soil N at the process level.
IPFILX
We deleted unused variable ECONO from the list of the arguments of the
subroutine.
OPIBS3
We suppressed the printing of headers in the N, water, and plant growth output
files so that they could be more rapidly imported to a spreadsheet.
OPHEAD
We increased the width of the output file headers for total initial soil nitrate
because we increased the accuracy of total initial soil nitrate by one
decimal place.
Input Files
The following modifications concern the DSSAT input files:
A. Gerakis et al.1994
Soils Description File
We set variable SLRO (runoff curve number) to zero to prevent runoff because
the test lysimeters were built with raised edges that prevented runoff.
Residue Parameter File
If residue is applied on the first day of simulation, it becomes part of the initial
conditions’ residue amount. The problem is that CERES (subroutine
NTRANS) always uses the default residue decomposition parameters,
which are those of the first residue type, RE001, in parameter file
SOILN980.SOL. The way around this problem is to temporarily modify the
residue decomposition parameters of residue type RE001 so that the model
uses them as default parameters.
Output Files
The initial condition values (left column) in the N balance summary file
(NBAL.OUT) are true only for the first crop in the rotation. This is because
CERES reads initial conditions information only once, on the first day of
simulation. The initial conditions for subsequent crops must be ignored.
ACKNOWLEDGMENTS
The authors thank all the scientists and field technicians who contributed to the
continuous water and nitrogen sampling from the lysimeters during the 7-yr
period of this project. Special recognition is due to Rob Aiken, Bihu Huang,
and Jeff Hamelink for their substantial contribution to data collection.
REFERENCES
Adams, R.M., Rosenzweig, C., Peart, R.M., Ritchie, J.T., McCarl, B.A., Glyer, J.D.,Curry, R.B., Jones, J.W., Boote, K.J., and Allen, L.H., Jr. (1990) Global climatechange and US agriculture. Nature, 345: 219–224.
Addiscott, T.M. and Wagenet, R.J. (1985) Concepts of solute leaching in soils: Areview of modeling approaches. Journal of Soil Science, 36: 411–424.
Aiken, R.M. (1992) Functional relations of root distributions with the flux and uptake ofwater and nitrate. PhD dissertation.Michigan State University: East Lansing,Michigan.
Alocilja, E.C. and Ritchie, J.T. (1990) The application of SIMOPT2:RICE to evaluateprofit and yield-risk in upland-rice production. Agricultural Systems, 33: 315–326.
Angle, J.S., Gross, C.M., Hill, R.L., and McIntosh, M.S. (1993) Soil nitrate concen-trations under corn as affected by tillage, manure, and fertilizer applications.Journal of Environmental Quality, 22: 141–147.
Simulation of Leaching Losses in the Nitrogen Cycle 1995

Bowen, W.T., Jones, J.W., Carsky, R.J., and Quintana, J.O. (1993) Evaluation of the
nitrogen submodel of CERES–Maize following legume green manure incorpor-
ation. Agronomy Journal, 85: 153–159.
Campbell, C.A., Lafond, G.P., Zentner, R.P., and Jame, Y.W. (1994) Nitrate leaching
in a Udic Haploborol as influenced by fertilization and legumes. Journal of Environ-
mental Quality, 23: 195–201.
Entenmann, T. and Allison, B.E. (1991) The use of CERES–Maize in southwest
Germany for prediction of yield and nitrate leaching. In Agronomy Abstracts 16;
American Society of Agronomy-Crop Science Society of America-Soil Science
Society of America: Madison, Wisconsin.
Gast, R.G., Nelson, W.W., and Randall, G.W. (1978) Nitrate accumulation in soils and
loss in tile drainage following nitrogen applications to continuous corn. Journal of
Environmental Quality, 7: 258–261.
Gerakis, A. (1994) Simulation and measurement of atrazine and nitrate losses as influ-
enced by water table management. PhD dissertation. Michigan State University:
East Lansing, Michigan.
Godwin, D.C. and Jones, C.A. (1991) Nitrogen dynamics in soil–plant systems. In
Modeling Plant and Soil Systems; Hanks, J. and Ritchie, J.T. (eds.); American
Society of Agronomy-Crop Science Society of America-Soil Science Society of
America: Madison, Wisconsin, 287–321, Agronomy Monograph 31.
Huang, B. (1995) Tillage modifications of root and shoot growth responses to soil water
content and nitrogen concentration altered by seasons. PhD dissertation. Michigan
State University: East Lansing, Michigan.
Jintrawet, A., Nammuang, C., Uehara, G., and Tsuji, G.Y. (1991) Validation and appli-
cation of the IBSNAT/CERES rice model in Thailand. In Agronomy Abstracts, 19;
American Society of Agronomy-Crop Science Society of America-Soil Science
Society of America: Madison, Wisconsin.
Jones, C.A. and Kiniry, J.R. (eds.). (1986) CERES–Maize: A Simulation Model of
Maize Growth and Development; Texas A&M Press: College Station, Texas.
Kiniry, J.R. and Jones, C.A. (1986) Model evaluation. In CERES–Maize: A Simulation
Model of Maize Growth and Development; Jones, C.A. and Kiniry, J.R. (eds.); Texas
A&M Press: College Station, Texas, 113–144.
Lamb, J.F.S., Barnes, D.K., Russelle, M.P., Vance, C.P., Heichel, G.H., and
Henjum, K.I. (1995) Ineffectively and effectively nodulated alfalfas demonstrate
biological nitrogen fixation continues with high nitrogen fertilization. Crop
Science, 35: 153–157.
Loague, K.M. and Green, R.E. (1991) Statistical and graphical methods for evaluating
solute transport models. Journal of Contaminant Hydrology, 7: 51–73.
Martin, E.C. (1992) Management strategies to minimize nitrate leaching in seed corn
production. PhD dissertation. Michigan State University: East Lansing, Michigan.
Ostrom, N.E., Knoke, K.E., Hedin, L.O., Robertson, G.P., and Smucker, A.J.M. (1998)
Temporal trends in nitrogen isotope values of nitrate leaching from an agricultural
soil. Chemical Geology, 146: 219–227.
Paul, E.A. and Van Veen, J.A. (1978) The use of tracers to determine the dynamic
nature of organic matter. In Transactions of the 11th International Congress of
Soil Science; University of Alberta: Edmonton, Alberta; Vol. 3, 61–102.
Philipps, L. and Stopes, C. (1995) The impact of rotational practice on nitrate leaching
losses in organic farming systems in the United Kingdom. Biological Agriculture
and Horticulture: An International Journal, 11: 123–134.
A. Gerakis et al.1996

Quemada, M. and Cabrera, M.L. (1995) CERES–N model predictions of nitrogenmineralized from cover crop residues. Soil Science Society of America Journal,59: 1059–1065.
Quemada, M., Cabrera, M.L., and McCracken, D.V. (1997) Nitrogen release fromsurface-applied cover crop residues: Evaluating the CERES–N submodel.Agronomy Journal, 89: 723–729.
Randall, G.W. and Iragavarapu, T.K. (1995) Impact of long-term tillage systems forcontinuous corn on nitrate leaching to tile drainage. Journal of EnvironmentalQuality, 24: 360–366.
Rasse, D.P. and Smucker, A.J.M. (1999) Tillage effects on soil nitrogen and plantbiomass in a corn–alfalfa rotation. Journal of Environmental Quality, 28: 873–880.
Ritchie, J.T. (1998) Soil water balance and plant water stress. InUnderstanding Optionsfor Agricultural Production; Tsuji, G.Y., Hoogenboom, G., and Thornton, P.K.(eds.); Kluwer Academic Publishers: Dordrecht, The Netherlands, 45–58.
Ritchie, J.T. and Amato, M. (1990) Field evaluation of plant extractable soil water forirrigation scheduling. Acta Horticulturae, 278: 595–615.
Ritchie, J.T. and Crum, J. (1989) Converting soil survey characterization data intoIBSNAT crop model input. In Land Qualities in Space and Time; Bouma, J. andBregt, A.K. (eds.); Pudoc: Wageningen The Netherlands, 155–167.
Ritchie, J.T., Gerakis, A., and Suleiman, A. (1999) Simple model to estimate field-measured soil water limits. Transactions of ASAE, 42: 1609–1614.
Ritchie, J.T., Godwin, D.C., and Singh, U. (1990) Soil and weather inputs for theIBSNAT crop models. Proceedings of the IBSNAT symposium: Decision SupportSystem for Agrotechnology Transfer, part I: Symposium proceedings, Departmentof Agronomy and Soil Science, College of Tropical Agriculture and HumanResources, University of Hawaii: Honolulu, Hawaii, 31–45.
Ritchie, J.T. and Johnson, B.S. (1990) Soil and plant factors affecting evaporation. InIrrigation of Agricultural Crops; Stewart, B.A. and Nielsen, D.R. (eds.); AgronomyMonograph 30, ASA, CSSA, and SSSA: Madison, Wisconsin, 363–390.
Seligman, N.C. and van Keulen, H. (1981) PAPRAN: A simulation model of annualpasture production limited by rainfall and nitrogen. In Simulation of NitrogenBehaviour of Soil–Plant Systems; Frissel, M.J. and van Veen, J.A. (eds.); Pudoc:Wageningen, The Netherlands, 192–221.
Tsuji, G.Y., Uehara, G., and Balas, S. (eds.). (1994) DSSAT v3; University of Hawaii:Honolulu, Hawaii.
Vanotti, M.B., Bundy, L.G., and Peterson, A.E. (1997) Nitrogen fertilizer and legume–cereal rotation effects on soil productivity and organic matter dynamics inWisconsin. In Soil Organic Matter in Temperate Agroecosystems: Long-term Exper-iments in North America; Paul, E.A., Paustian, K., Elliott, E.T., and Cole, C.V.(eds.); CRC Press: Boca Raton, Florida, 105–119.
Verberne, E.L.J., Hassink, J., De Willigen, P., Groot, J.J.R., and Van Veen, J.A. (1990)Modeling Organic Matter Dynamics in different soils. Netherlands Journal of Agri-cultural Science, 38: 221–238.
Vigil, M.F., Kissel, D.E., and Smith, S.J. (1991) Field crop recovery and modelling ofnitrogen mineralized from labelled sorghum residues. Soil Science Society ofAmerica Journal, 55: 1031–1037.
Weed, D.A.J. and Kanwar, K.S. (1996) Nitrate and water present in and flowing fromroot-zone soil. Journal of Environmental Quality, 25: 709–719.
Xevi, E., Gilley, J., and Feyen, J. (1996) Comparative study of two crop yield simu-lation models. Agricultural Water Management, 30: 155–173.
Simulation of Leaching Losses in the Nitrogen Cycle 1997