Role of prefrontal cortex and the midbrain dopamine system in working memory updating
Upload
independentCategory
view
1download
0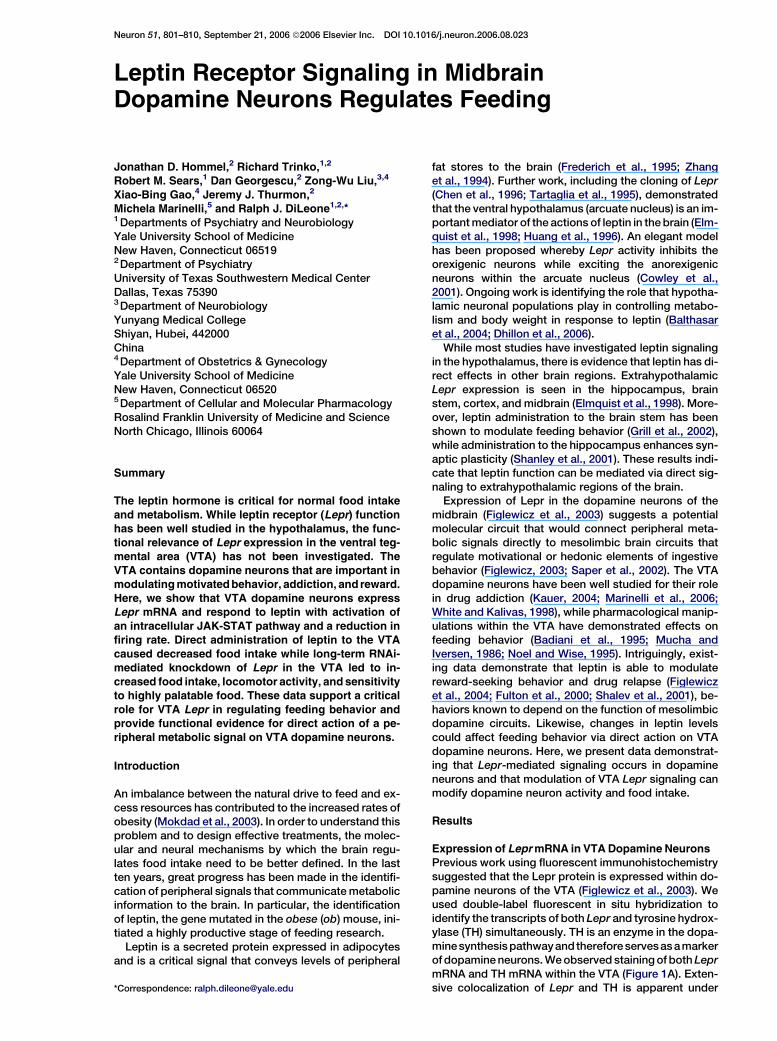
Neuron 51, 801–810, September 21, 2006 ª2006 Elsevier Inc. DOI 10.1016/j.neuron.2006.08.023
Leptin Receptor Signaling in MidbrainDopamine Neurons Regulates Feeding
Jonathan D. Hommel,2 Richard Trinko,1,2
Robert M. Sears,1 Dan Georgescu,2 Zong-Wu Liu,3,4
Xiao-Bing Gao,4 Jeremy J. Thurmon,2
Michela Marinelli,5 and Ralph J. DiLeone1,2,*1Departments of Psychiatry and NeurobiologyYale University School of MedicineNew Haven, Connecticut 065192Department of PsychiatryUniversity of Texas Southwestern Medical CenterDallas, Texas 753903Department of NeurobiologyYunyang Medical CollegeShiyan, Hubei, 442000China4Department of Obstetrics & GynecologyYale University School of MedicineNew Haven, Connecticut 065205Department of Cellular and Molecular PharmacologyRosalind Franklin University of Medicine and ScienceNorth Chicago, Illinois 60064
Summary
The leptin hormone is critical for normal food intake
and metabolism. While leptin receptor (Lepr) functionhas been well studied in the hypothalamus, the func-
tional relevance of Lepr expression in the ventral teg-mental area (VTA) has not been investigated. The
VTA contains dopamine neurons that are important inmodulating motivated behavior, addiction, and reward.
Here, we show that VTA dopamine neurons expressLepr mRNA and respond to leptin with activation of
an intracellular JAK-STAT pathway and a reduction infiring rate. Direct administration of leptin to the VTA
caused decreased food intake while long-term RNAi-mediated knockdown of Lepr in the VTA led to in-
creased food intake, locomotor activity, and sensitivityto highly palatable food. These data support a critical
role for VTA Lepr in regulating feeding behavior andprovide functional evidence for direct action of a pe-
ripheral metabolic signal on VTA dopamine neurons.
Introduction
An imbalance between the natural drive to feed and ex-cess resources has contributed to the increased rates ofobesity (Mokdad et al., 2003). In order to understand thisproblem and to design effective treatments, the molec-ular and neural mechanisms by which the brain regu-lates food intake need to be better defined. In the lastten years, great progress has been made in the identifi-cation of peripheral signals that communicate metabolicinformation to the brain. In particular, the identificationof leptin, the gene mutated in the obese (ob) mouse, ini-tiated a highly productive stage of feeding research.
Leptin is a secreted protein expressed in adipocytesand is a critical signal that conveys levels of peripheral
*Correspondence: [email protected]
fat stores to the brain (Frederich et al., 1995; Zhanget al., 1994). Further work, including the cloning of Lepr(Chen et al., 1996; Tartaglia et al., 1995), demonstratedthat the ventral hypothalamus (arcuate nucleus) is an im-portant mediator of the actions of leptin in the brain (Elm-quist et al., 1998; Huang et al., 1996). An elegant modelhas been proposed whereby Lepr activity inhibits theorexigenic neurons while exciting the anorexigenicneurons within the arcuate nucleus (Cowley et al.,2001). Ongoing work is identifying the role that hypotha-lamic neuronal populations play in controlling metabo-lism and body weight in response to leptin (Balthasaret al., 2004; Dhillon et al., 2006).
While most studies have investigated leptin signalingin the hypothalamus, there is evidence that leptin has di-rect effects in other brain regions. ExtrahypothalamicLepr expression is seen in the hippocampus, brainstem, cortex, and midbrain (Elmquist et al., 1998). More-over, leptin administration to the brain stem has beenshown to modulate feeding behavior (Grill et al., 2002),while administration to the hippocampus enhances syn-aptic plasticity (Shanley et al., 2001). These results indi-cate that leptin function can be mediated via direct sig-naling to extrahypothalamic regions of the brain.
Expression of Lepr in the dopamine neurons of themidbrain (Figlewicz et al., 2003) suggests a potentialmolecular circuit that would connect peripheral meta-bolic signals directly to mesolimbic brain circuits thatregulate motivational or hedonic elements of ingestivebehavior (Figlewicz, 2003; Saper et al., 2002). The VTAdopamine neurons have been well studied for their rolein drug addiction (Kauer, 2004; Marinelli et al., 2006;White and Kalivas, 1998), while pharmacological manip-ulations within the VTA have demonstrated effects onfeeding behavior (Badiani et al., 1995; Mucha andIversen, 1986; Noel and Wise, 1995). Intriguingly, exist-ing data demonstrate that leptin is able to modulatereward-seeking behavior and drug relapse (Figlewiczet al., 2004; Fulton et al., 2000; Shalev et al., 2001), be-haviors known to depend on the function of mesolimbicdopamine circuits. Likewise, changes in leptin levelscould affect feeding behavior via direct action on VTAdopamine neurons. Here, we present data demonstrat-ing that Lepr-mediated signaling occurs in dopamineneurons and that modulation of VTA Lepr signaling canmodify dopamine neuron activity and food intake.
Results
Expression of Lepr mRNA in VTA Dopamine NeuronsPrevious work using fluorescent immunohistochemistrysuggested that the Lepr protein is expressed within do-pamine neurons of the VTA (Figlewicz et al., 2003). Weused double-label fluorescent in situ hybridization toidentify the transcripts of both Lepr and tyrosine hydrox-ylase (TH) simultaneously. TH is an enzyme in the dopa-minesynthesis pathwayandtherefore servesasamarkerof dopamine neurons. We observed staining of both LeprmRNA and TH mRNA within the VTA (Figure 1A). Exten-sive colocalization of Lepr and TH is apparent under

Neuron802
high magnification (Figure 1B), suggesting that LeprmRNA is expressed in dopamine neurons. While it re-mains possible that some nondopaminergic neurons(e.g., GABAergic interneurons) in the VTA express Lepr,>90% of neurons with Lepr mRNA are dopamine neurons(Figure 1B). In addition, w60% of the dopamine neuronsexpress detectable Lepr mRNA (Figure 1). These LeprmRNA localization results, together with previous pro-tein localization data (Figlewicz et al., 2003), suggestthat leptin could have a major impact on overall VTAfunction.
Lepr Signaling in the VTA Increases
Phosphorylation of STAT3In order to assess whether VTA Lepr is functional, theJAK-STAT signaling pathway was evaluated with phos-phoprotein analysis. This signaling cascade is activatedupon leptin binding to Lepr in the hypothalamus (Ghi-lardi et al., 1996; Vaisse et al., 1996), resulting in thephosphorylation of STAT3. Mice with point mutationsin Lepr that block the binding and phosphorylation ofSTAT3 become severely hyperphagic and obese, a phe-notype that closely resembles mice with a Lepr null mu-tation (Bates et al., 2003).
To determine if leptin causes phosphorylation ofSTAT3 (pSTAT3) in the VTA, animals were injected withleptin (3 mg/kg intraperitoneal, within dose-responserange for phosphorylation of hypothalamic STAT3, seeVaisse et al., [1996]). Western blot analysis on VTA tissuecollected 2 hr after leptin administration revealed in-creased phosphorylation of pSTAT3 at tyrosine residue705 (Figure 2A). Although this phosphorylation data sug-gest that circulating leptin can activate part of the JAK-STAT pathway in the VTA, we could not rule out indirectactivation of JAK-STAT as a result of primary leptin ac-tion on the hypothalamus. To asses whether leptin candirectly increase phosphorylation of VTA STAT3, leptinwas delivered directly to the VTA of rats via surgically
Figure 1. Lepr mRNA Is Expressed in Dopamine Neurons of the Rat
VTA
(A) Low-power image of double label fluorescent in situ hybridization
showing expression of TH mRNA (green) and Lepr mRNA (red) in the
VTA.
(B) High-power image showing expression of TH and Lepr mRNA.
Colocalization of the two mRNAs is seen in the merged panel.
implanted bilateral cannulae. Robust pSTAT3 labelingwas observed within the VTA 45 min after infusion of lep-tin (Figure 2B; see Figure S1 in the Supplemental Dataavailable with this article online). Moreover, the pSTAT3staining was found in TH-positive neurons, indicatingthat the dopamine neurons are the primary populationof neurons responding to the administered leptin, inagreement with the localization of Lepr on TH-positiveneurons.
These data indicate that leptin can directly activatethe JAK-STAT pathway within VTA dopamine neurons.In order to more effectively quantify the cell populationsresponding to the leptin, we assessed pSTAT3/TH co-localization throughout the rostrocaudal extent of theVTA following intracerebroventricular (ICV) leptin infu-sions (Figure 2C). A survey indicated that most, but notall, of the VTA neurons responding were dopaminergic:at 25.2 bregma, 82% (73/89) were TH positive; at 25.6bregma, 80% (80/100) were TH positive; at 26.0bregma, 95% (95/100) were TH positive.
Leptin Infusion Directly into the VTA SuppressesFood Intake
To evaluate the role of Lepr signaling in the VTA, a seriesof doses of leptin (100 ng, 330 ng, or 1 mg, based on datafrom Grill et al., [2002] and Satoh et al., [1997]) was ad-ministered to the VTA, and food consumption was
Figure 2. Leptin Induces JAK-STAT Signaling in Midbrain Dopamine
Neurons
(A) Western blot analysis showing pSTAT3 (lower band in upper
panel) and total STAT3 (lower panel) in the VTA of mice injected
with either vehicle or leptin (3 mg/kg i.p.)
(B) Double-label fluorescent immunostaining of TH and pSTAT3
from tissue taken 45 min after infusion of vehicle or leptin (1 mg) to
the VTA of awake, free-moving rats. TH immunoreactivity (green) is
colocalized with pSTAT3 immunoreactivity (red, nuclear) only in an-
imals that received leptin (lower right panel).
(C) Double-label fluorescent immunostaining of TH and pSTAT3
from tissue taken 1 hr after intracerebroventricular infusion of vehi-
cle or leptin (5 mg) in awake, free-moving rats.
Leptin Regulation of Dopamine Neurons and Feeding803
Figure 3. Direct Leptin Administration to the VTA Results in a Reduction in Food Intake
(A) Food intake expressed as a percentage of control over 24 hr following infusion of leptin directly into the VTA of awake, free-moving rats. An-
imals received infusions of vehicle (white bars, n = 36), 100 ng (light gray bars, n = 10), 330 ng (dark gray bars, n = 10), or 1000 ng of leptin (black
bars, n = 16). Food intake measurements began 30 min after completion of infusions and total intake was measured at 2 hr, 4 hr, and 24 hr.
(B) No significant difference in locomotor activity was observed over 3 hr when comparing infusion of either vehicle (open squares, n = 6) or leptin
(closed triangles, n = 6) at a dose of 500 ng/side. (*p < 0.05; **p < 0.01 by ANOVA followed by post hoc tests).
Error bars represent the standard error of the mean (SEM).
monitored over a 24 hr period beginning at the onset ofthe dark cycle. A summary of cannula placements usedin this analysis is shown in Figure S2. All doses of leptincaused a significant decrease in food intake over the first4 hr (treatment main effect, F(3,71) = 15.18, p < 0.001; treat-ment x time interaction, F(6,194) = 2.3, p < 0.05; Figure 3A),and the suppression of feeding was maintained over 24hr of cumulative food intake. Infusion of 330 ng (165 ng/side) of leptin inhibited food intake by approximately30% over the first 2 hr of feeding. Doses higher than330 ng did not further inhibit feeding, suggesting a maxi-mal leptin effect at this dose range. The observeddecrease in food intake is consistent with the anorecticeffects of systemic or ICV leptin (Halaas et al., 1995;Seeley et al., 1996).
The VTA also has a role in controlling locomotor andexploratory behavior (Badiani et al., 1995; Mogensonand Yang, 1991) raising the possibility that Lepr signal-ing to midbrain dopamine neurons could effect generalactivity. To address this question, ambulation was mea-sured following delivery of leptin to the VTA. At the onsetof the dark cycle, rats received either vehicle alone or1 mg (500 ng/side) of leptin directly to the VTA, and theiractivity was assessed. No significant differences in thenumber of beam breaks were observed over a 3 hrperiod following the infusions (Figure 3B), suggestingthat the changes in feeding were not the result of alter-ations in general locomotor activity.
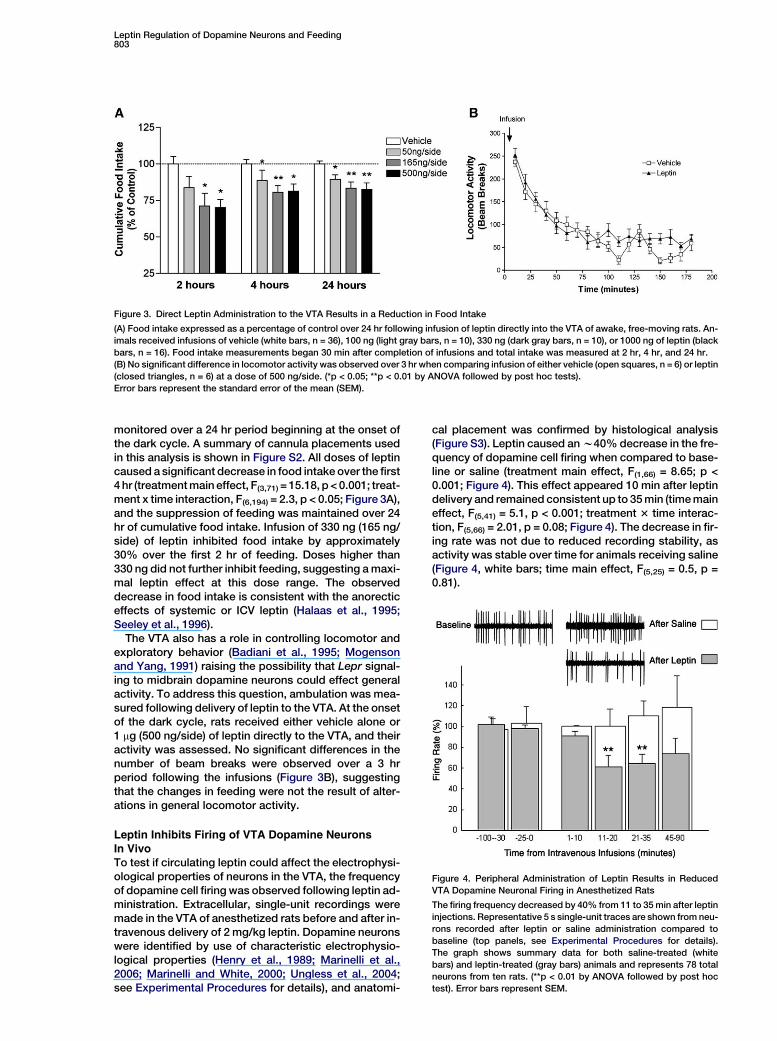
Leptin Inhibits Firing of VTA Dopamine Neurons
In VivoTo test if circulating leptin could affect the electrophysi-ological properties of neurons in the VTA, the frequencyof dopamine cell firing was observed following leptin ad-ministration. Extracellular, single-unit recordings weremade in the VTA of anesthetized rats before and after in-travenous delivery of 2 mg/kg leptin. Dopamine neuronswere identified by use of characteristic electrophysio-logical properties (Henry et al., 1989; Marinelli et al.,2006; Marinelli and White, 2000; Ungless et al., 2004;see Experimental Procedures for details), and anatomi-
cal placement was confirmed by histological analysis(Figure S3). Leptin caused an w40% decrease in the fre-quency of dopamine cell firing when compared to base-line or saline (treatment main effect, F(1,66) = 8.65; p <0.001; Figure 4). This effect appeared 10 min after leptindelivery and remained consistent up to 35 min (time maineffect, F(5,41) = 5.1, p < 0.001; treatment 3 time interac-tion, F(5,66) = 2.01, p = 0.08; Figure 4). The decrease in fir-ing rate was not due to reduced recording stability, asactivity was stable over time for animals receiving saline(Figure 4, white bars; time main effect, F(5,25) = 0.5, p =0.81).
Figure 4. Peripheral Administration of Leptin Results in Reduced
VTA Dopamine Neuronal Firing in Anesthetized Rats
The firing frequency decreased by 40% from 11 to 35 min after leptin
injections. Representative 5 s single-unit traces are shown from neu-
rons recorded after leptin or saline administration compared to
baseline (top panels, see Experimental Procedures for details).
The graph shows summary data for both saline-treated (white
bars) and leptin-treated (gray bars) animals and represents 78 total
neurons from ten rats. (**p < 0.01 by ANOVA followed by post hoc
test). Error bars represent SEM.

Neuron804
Leptin Inhibits Firing of Dopamine Neurons in VTASlices
While the animal studies are consistent with leptin ac-tion in VTA neurons, it is possible that the changes in ac-tivity are secondary to direct action in the hypothala-mus. Experiments were performed to examine if leptindirectly influences the electrophysiological responsesof dopamine neurons by whole-cell patch-clamp re-cordings in the VTA of brain slices (Figure 5). Dopamineneurons under electrophysiological analysis were withinthe boundaries of the VTA and were identified based ontheir characteristic hyperpolarization-activated (Ih) cur-rent (Johnson and North, 1992; Liu et al., 2005). Sponta-neous action potentials were recorded in dopamineneurons under current clamp after their identities were
Figure 5. Leptin Decreases the Frequency of Action Potentials in
Dopamine Neurons in the VTA
(A) Sample traces recorded before, during, and after application of
leptin (100 nM) from a dopamine neuron under current clamp
(M.P. = 244.8 mV). The inset demonstrates the Ih current used to
identify dopamine neurons; dopamine neurons exhibit the presence
of a large Ih current, which is distinctive from nondopamine neurons
nearby. The Ih currents (lower traces) were induced by a series of
voltage steps from 260 mV to 2100 mV (upper traces) in neurons
under voltage clamp held at 250 mV. Inset scale bar: 200 pA, 0.5 s.
(B) A time course of the effect of leptin on the frequency of action po-
tentials. The effect of leptin was fast and reversible; the bars above
the trace indicate the multiple applications of leptin.
(C) Pooled data showing a reduction in action potentials (n = 9;
*p < 0.05 by ANOVA).
Error bars represent SEM.
confirmed. The average frequency of action potentialsin all tested dopamine neurons was 2.8 6 0.8 Hz (n =9). After at least 10 min of stable recording of action po-tentials, leptin (100 nM, as used by Cowley et al., [2001])was applied to the recorded dopamine neurons via bathapplication. Leptin induced a fast and reversible reduc-tion of the frequency of action potentials in dopamineneurons (Figure 5B). The frequency of action potentialwas reduced to 79.7% 6 6.6% of control in the presenceof leptin and 103.8% 6 7.5% of control after the with-drawal of leptin (Figure 5C). The reduction of the fre-quency of action potentials was significant (F(1,25) =5.43, p < 0.05). The presence of leptin caused a modest,but not significant, hyperpolarization in membrane po-tential (control, 243.8 6 1.3 mV; 100 nM leptin, 244.76 1.2 mV; n = 9; p > 0.05 by t test). This responsesuggests that leptin can modify VTA dopamine neuronexcitability via direct action that is independent of thehypothalamus.
Conditional Lepr Knockdown in the VTA Resultsin Increased Food Intake and Locomotor Activity
To complement the leptin administration studies, a ratgenetic model with reduced Lepr expression was devel-oped. Viral-mediated RNA interference (RNAi) was usedto generate rats with conditional gene knockdown ofLepr specifically in the VTA. Adenoassociated virus(AAV) vectors were engineered to express either ashort hairpin RNA (shRNA) targeting Lepr mRNA (AAV-shLEPR), or a shRNA that does not have an endogenousmRNA target to serve as a negative control (AAV-shCTRL). This strategy offers both spatial and temporalcontrol of gene knockdown and has been shown to beeffective in mouse VTA dopamine neurons (Hommelet al., 2003). Incorporation of an EGFP marker into the vi-ral construct allowed the regions of infection to be accu-rately identified. Fluorescent microscopy analysis dem-onstrated that the AAV efficiently infects rat VTA and thata high population of dopamine neurons are infected(Figure 6A). Animals with infection limited to the VTAwere chosen for the final data analysis (see Figure S4).
AAV-shLEPR or AAV-shCTRL was administered di-rectly into the VTA of rats, resulting in Lepr conditionalknockdown (LEPRVTA) and control (CTRLVTA) animals,respectively. A reduction in Lepr mRNA levels inLEPRVTA, but not CTRLVTA, rats was demonstrated byin situ hybridization analysis of the VTA (Figure 6B). Toevaluate changes in behavior, a set of rats was infusedbilaterally with either AAV-shLEPR or AAV-shCTRL. Fol-lowing infusion, food intake and body weight measure-ments over a 30 day period revealed that LEPRVTA ani-mals increased their food intake compared to CTRLVTA
animals (AAV-shLEPR treatment main effect, F(1,20) =4.26, p < 0.05; Figure 6C). The LEPRVTA animals beganto show increased feeding between the second andthird week following viral delivery, consistent with thetime of peak AAV expression and RNAi-mediatedknockdown within VTA neurons (Hommel et al., 2003).Despite the increase in food intake, no change was ob-served in the average body weight of LEPRVTA animals(Figure 6D). In addition, LEPRVTA rats had a 3- to 5-foldincrease in ambulatory beam breaks when comparedto CTRLVTA rats, with the differences apparent duringthe dark (active) cycle (Figure 6E) .

Leptin Regulation of Dopamine Neurons and Feeding805
Figure 6. RNAi-Mediated Knockdown of
Lepr in the VTA Results in Increased Food
Intake and Locomotor Activity
(A) Immunofluorescent analysis showing the
extent of AAV spread and dopamine neuron
infection in the VTA. The left panel shows
EGFP expression marking infected neurons,
while the middle shows tyrosine hydroxylase
(TH). The right panel (merge) demonstrates
extensive infection of VTA dopamine neu-
rons.
(B) Representative in situ hybridization of
EGFP mRNA in the VTA showing infection
and expression from both AAV-shLEPR and
AAV-shCTRL viruses (upper panels). In situ
hybridization from midbrain tissue showing
a reduction in Lepr mRNA in LEPRVTA (lower
right panel) verses CTRLVTA rats (lower left
panel).
(C) Food intake measurements of CTRLVTA
(open squares, n = 11) or LEPRVTA rats
(closed triangles, n = 11; *p < 0.05; **p <
0.01 by ANOVA followed by post hoc tests).
Total body weight (D), and home-cage ambu-
latory activity (E), is plotted over time for
CTRLVTA (open squares) or LEPRVTA (closed
triangles) rats. Home-cage locomotor activity
is expressed as number of ambulatory beam
breaks and covers 24 hr beginning at the on-
set of the dark cycle (*p < 0.05 by repeated
measures ANOVA during dark cycle).
Error bars represent SEM.
Conditional Lepr Knockdown Rats Have Altered
Responses to Highly Palatable FoodFollowing the food intake measurements of the CTRLVTA
and LEPRVTA rats, we tested the same animals for re-sponses to a sucrose solution and high-fat food. In thesucrose-sensitivity test, animals were maintained intheir home cage and given a choice between two bot-tles: one bottle contained water and the other bottlea low concentration of sucrose (0.2% w/v) which is nothigh enough to produce a significant preference inCTRLVTA animals. However, the LEPRVTA rats exhibitedincreased sensitivity to sucrose, as they consumed50% more of the 0.2% sucrose solution than water alone(Figure 7A). To assess feeding responses to fat,LEPRVTA and CTRLVTA rats were switched from standardrodent chow to a high-fat rodent chow (45% caloriesfrom fat). LEPRVTA rats significantly increased theirfood intake over the first three days of being presentedwith a high-fat diet, while CTRLVTA rats did not alter theirfood intake (in grams) when switched to a high-fat diet.LEPRVTA rats returned to their baseline intake duringdays 4–7 of the high-fat diet treatment (Figure 7B). Thisincrease in caloric intake over the first 3 days did notresult in a significant increase in body weight in theLEPRVTA rats compared to CTRLVTA rats (Figure S5).
Discussion
Based on the expression of Lepr in the VTA, we hypoth-esized that leptin signals directly to midbrain dopamine
neurons to regulate energy homeostasis. We tested thishypothesis by administering leptin directly to the VTA orby knocking down Lepr in the VTA followed by measur-ing food intake, body weight, and locomotor activity.Four principal findings emerged: (1) administration ofleptin either peripherally or directly to the VTA causesphosphorylation of STAT3 primarily in dopamine neu-rons; (2) leptin decreases the firing rate of VTA dopamineneurons in vivo and in vitro; (3) delivery of leptin to theVTA decreases food intake but does not alter general lo-comotor activity; (4) long-term genetic knockdown ofLepr in the VTA causes an increase in food intake anddark-cycle locomotor activity but does not alter bodyweight. Together, the biochemical, cellular, and behav-ioral data presented indicate that leptin can regulatefood intake and locomotion by directly modulating do-pamine neuron function in the VTA.
The present data, together with evidence that leptindecreases nucleus accumbens dopamine levels (Krugelet al., 2003), suggest that leptin inhibits the firing of VTAdopamine neurons leading to a decrease in both dopa-mine release and food intake. This is consistent withthe changes in mesolimbic and mesocortical dopaminecircuits and feeding behavior following GABA or opioidmodulation of the VTA (Badiani et al., 1995; Echo et al.,2002; Mucha and Iversen, 1986; Noel and Gratton,1995) and work demonstrating that dopamine is criticalfor the development of obesity in leptin-deficient mice(Szczypka et al., 2000). Previous studies have shownthat leptin crosses the blood-brain barrier in most brain

Neuron806
Figure 7. RNAi-Mediated Knockdown of Lepr in the VTA Results in Increased Sensitivity to Sucrose and Highly Palatable Food
(A) Preference expressed as percentage of total intake of a 0.2% sucrose solution for both LEPRVTA (n = 8) and CTRLVTA (n = 7) rats in a two-bottle
choice paradigm.
(B) Average intake of standard chow and high-fat chow. LEPRVTA rats increased their food intake over the first 3 days when switched to a high-fat
chow but returned to baseline intake during the next 4 days.
Error bars represent SEM.
regions, including the midbrain (Banks et al., 2000). Inaddition, evidence is building for direct action of otherperipheral factors, such as insulin and glucose, on do-pamine neurons of the midbrain (Figlewicz, 2003; Levin,2000). Interestingly, recent work suggests that ghrelincan also signal to the VTA to stimulate food intake(Naleid et al., 2005). Therefore, the VTA may representan additional central detector of peripheral metabolicsignals, which responds by appropriately increasing ordecreasing food intake via modulation of mesolimbicand mesocortical circuits.
It is striking that LEPRVTA animals, despite increasedfeeding, maintained normal body weight. Leptin isknown to regulate both feeding and metabolism (Fried-man and Halaas, 1998; Kamohara et al., 1997), and re-cent work describes the potential segregation of leptineffects via alternate sites of melanocortin receptor func-tion (Balthasar et al., 2005). In addition, our data supporta model whereby leptin effects are segregated by actionon different neuroanatomical regions; the VTA may rep-resent a leptin target that modulates motivated behaviorand food intake. It has previously been suggested thatleptin modulation of conditioned place preference forsucrose and high-fat diets may be mediated by an extra-hypothalamic target (Figlewicz et al., 2004; Figlewiczet al., 2001). Our data demonstrate a direct effect of lep-tin on VTA dopamine neurons and support the previousproposal that leptin modulation of expression of condi-tioned behavior might occur via dopamine circuits (Fig-lewicz et al., 2004). Interestingly, a high-fat diet has beenshown to decrease conditioned preference for nicotinewhile also leading to decreased Lepr mRNA in the VTA(Blendy et al., 2005).
It is possible that the VTA-specific knockdown ani-mals maintain normal body weight due to homeostaticmetabolic compensation driven by either normal Leprfunction in the hypothalamus or a separate system com-pensating for increased caloric intake. The increase inlocomotor activity seen in the LEPRVTA animals may it-self represent a compensatory response to increasedcaloric intake. Alternatively, the established role of theVTA in locomotor activity makes it possible that de-creases in Lepr signaling in the dopamine neurons couldlead to an initial increase in locomotor behavior followedby an increase in food intake. However, leptin adminis-
tration to the VTA resulted in a reduction in feeding with-out any changes in general locomotor activity, suggest-ing that a specific effect on feeding is the primaryresponse to increased Lepr signaling.
In addition to the increase in consumption of standardrodent chow, the LEPRVTA conditional knockdown ratsalso showed heightened sensitivity to sucrose and in-creased consumption of a high-fat diet. This indicatesthat leptin action on the VTA can also modulate behav-ioral responses to rewarding or novel food, consistentwith proposed roles of the VTA dopamine neurons(Schultz and Dickinson, 2000) and observations of dopa-mine release in the NAc in response to novel food (Bas-sareo and Di Chiara, 1999). While our work has focusedon a natural behavior (feeding), hormonal regulationof VTA neuronal activity may have consequences fora number of other behavioral responses that are knownto be sensitive to the function of dopamine circuits. Inparticular, metabolic sensing by the VTA neurons mayprovide a mechanism for the well-described increasesin drug sensitivity seen during states of food restrictionand the effects of leptin on reversing this sensitivity(Carr, 2002; Shalev et al., 2001). Interestingly, chroniccocaine administration has been shown to alter JAK-STAT signaling in the VTA (Berhow et al., 1996), suggest-ing that common molecular components mediate meta-bolic sensing and adaptations to drugs of abuse in VTAdopamine neurons.
As with Lepr function in the hypothalamus, a numberof questions remain regarding leptin action within theVTA. First, the limited effect of leptin on membrane po-tential is in contrast to previous reports on hypothalamicneurons (Cowley et al., 2001; Spanswick et al., 1997) andmay suggest a distinct mechanism for leptin modulationof excitability within the VTA. Second, it is not clear if thecritical Lepr-mediated signals are short term, long term,or both. The kinetics of the electrophysiological re-sponse following leptin administration indicate thatrapid signaling (timescale of minutes) downstream ofLepr may be important. However, leptin induced JAK-STAT activation, and the known role for STAT activationin food intake (Bates et al., 2003) supports the premisethat long-term transcriptional changes may also playa role. Likewise, recent observations of hypothalamicsynaptic rearrangement within 6 hr following leptin and
Leptin Regulation of Dopamine Neurons and Feeding807
ghrelin treatment (Pinto et al., 2004) would suggest a po-tential mode of regulation that may be relevant withinmesolimbic and mesocortical circuits.
In summary, the data presented in this paper supporta distributed model whereby leptin signals directly to in-dependent brain circuits to generate an overall behav-ioral response. While previous work has establishedthe hypothalamus as a critical brain region in responseto leptin, the inclusion of the VTA as a site of leptin actionsuggests that peripheral metabolic states are communi-cated to mesolimbic regions that are integral to the con-trol of motivated behavior. Leptin-mediated modulationof central dopamine circuits provides a novel neuralpathway by which changes in leptin levels would leadto adaptive feeding responses. These results also havepotential implications for other behaviors, such asdrug addiction, where mesolimbic dopamine functionis important.
Experimental Procedures
Subjects
Sprague-Dawley rats (Charles River, Kingston, North Carolina), and
C57BL/6J mice (Jackson Labs, Bar Harbor, Maine), were used for
experiments. Rats were single-housed, whereas mice were housed
4–5 per cage in a colony maintained at constant temperature (23�C)
with 12 hr light/dark cycle (lights on from 7:00 AM to 7:00 PM) and ad
libitum food and water. Rats weighed between 350 and 400 g at the
beginning of the experiments, and mice were 10 weeks of age. All
animal protocols were approved by the animal care committees at
the University of Texas Southwestern Medical Center and Yale Uni-
versity School of Medicine.
In Situ Hybridization
For the in situ analysis, fresh-frozen rat brains were cryosectioned at
14 mm thickness and mounted onto slides. The sections were then
fixed in ice-cold 4% paraformaldehyde for 20 min, dehydrated in
an ethanol series, and allowed to air dry. The sections were rehy-
drated, acetylated for 5 min, dehydrated, and air-dried again. Tissue
was then treated differently for fluorescent or radioactive in situ hy-
bridizations.
For fluorescent in situ hybridization, probes were prepared using
an in vitro transcription kit with digoxigenin-labeled for Lepr (Roche,
Basel, Switzerland) and fluorescein-labeled UTP (Molecular Probes,
Eugene, Oregon) for TH probes. The hybridization solution (50%
formamide, 53 SSC, 53 Denhardts, 250 mg/ml yeast RNA, 0.5 mg/ml
salmon testes DNA, 200–300 ng/ml RNA probe) was then added to
the slides followed by incubation in humidified chambers at 60�C
overnight. After washing and blocking with 5% normal rabbit IgG
and 1% blocking reagent (Roche), the Lepr probe was first detected
by use of a 1:200 anti-digoxigenin antibody coupled to horseradish
peroxidase (HRP) (DAKO, Carpinteria, California). The digoxigenin
signal was amplified and detected using TSA-direct coupled to
Cy3 (Perkin-Elmer, Wellesley, Massachusetts). Hydrogen peroxide
treatment (3%, 15 min) was used to eliminate horseradish peroxi-
dase activity. The TH fluorescein-labeled probe was detected with
1:500 rabbit anti-fluorescein HRP (Molecular Probes) followed by
amplification with TSA-direct coupled to fluorescein (Perkin-Elmer).
The sections were then dehydrated and mounted in DPX (Fluka,
Germany).
Radioactive in situ hybridization was performed as previously de-
scribed (Gold et al., 2002). Hybridization solution (deionized form-
amide 50%, polyvinyl pyrrolidone 0.7%, ficoll 0.7%, bovine serum al-
bumin 7 mg/ml, denatured salmon sperm DNA 0.33 mg/ml, yeast
tRNA 0.15 mg/ml, dithiothreitol 40 mm, and cRNA probe at 1 3 107
cpm/ml) was applied to the slide (120 ml/slide) and covered with Hy-
brislips (Molecular Probes). Slides were then hybridized overnight at
60�C. Following hybridization, the Hybrislips were removed, and
slides were washed twice in 43 saline sodium citrate buffer (SSC)
at 60�C for 30 min each. Slides were then RNase treated for 30 min
at 45�C followed by two washes in 23 SSC for 10 min, two washes
in 0.53 SSC for 10 min, and one wash in 0.13 SSC for 30 min all at
60�C. Slides were then exposed to Biomax MR film (Kodak, Roches-
ter, New York) for 1–2 weeks and developed.
Western Blot Analysis
Mice were food restricted overnight followed by intraperitoneal in-
jections of leptin (3 mg/kg) or vehicle (13 PBS). Leptin was obtained
from R&D Systems (Torrance, California) and dissolved according to
the manufacturer’s protocol. Two hours after injection, brains were
rapidly dissected, and the VTA was microdissected using a micro-
scope and a 15 gauge blunt needle. Frozen tissue samples were
sonicated in 1% SDS plus 50 mM NaF followed by addition of 2-mer-
captoethanol and boiling for 10 min. Small aliquots of the homoge-
nate were retained for protein determination by the DC protein assay
method (Bio-Rad, Hercules, California) using bovine serum albumin
as a standard. Equal amounts of protein (40 mg) were separated by
SDS-polyacrylamide (10%) gel electrophoresis and transferred to
PVDF membranes (0.2 mm; Bio-Rad). Membranes were blocked for
60 min in TBST (25 mM Tris-HCl [pH 8.0], 150 mM NaCl, 0.1% Tween
20) containing 5% nonfat dry milk and immunoblotted using a 1:1500
dilution of rabbit anti-phospho-STAT3 antibody (Cell Signaling
#9131). After washing four times for 20 min in TBST, antibody
binding was revealed by incubation with a 1:5000 dilution of goat
anti-rabbit HRP-linked IgG (Pierce, Rockford, Illinois) and the
SuperSignal West Dura immunoblotting detection system (Pierce).
Chemiluminescence was detected by autoradiography using Kodak
autoradiography film.
Immunohistochemistry
After cannulation and recovery, rats were infused with 500 ng/side of
leptin or vehicle (see below). After 45 min, animals were injected with
an overdose of pentobarbital and perfused transcardially with ice-
cold 13 PBS for 1 min followed by 4% paraformaldehyde in 13
PBS for 20 min. The brains were postfixed overnight in 4% parafor-
maldehyde with 13 PBS and then cryoprotected in 13 PBS with
20% glycerol for a minimum of 24 hr. Brains were frozen on dry ice
and sectioned at 35 mm intervals and collected in 13 PBS plus
0.05% sodium azide. Sections were pretreated as previously de-
scribed (Hosoi et al., 2002) and blocked with 3% normal donkey se-
rum in 13 PBS with 0.3% Triton X-100 for 1 hr. The blocking solution
was removed and the rabbit anti-phospho-STAT3 (1:500, Cell Sig-
naling Technology #9131, Beverly, Massachusetts) and mouse
anti-TH, (1:10,000, Sigma-Aldrich, St. Louis, Missouri) antibodies
were diluted in blocking solution and applied to sections. Following
overnight incubation, the sections were rinsed three times for 5 min
in 13 PBS followed by incubation with fluorescent coupled second-
ary antibodies (Jackson ImmunoResearch, West Grove, Pennsylva-
nia) in 13 PBS for 2–4 hr. Sections were mounted on slides and dried
overnight. Slides were rehydrated for 30 min and washed in 13 PBS
three times for 5 min followed by ethanol dehydration and mounting
in DPX.
Cannulation Surgery
Rats were allowed to acclimate for 1–2 weeks after arrival before
guide cannulae (Plastics One, Roanoke, Virginia) were implanted in
the VTA bilaterally. Coordinates for placement of the guide cannula
to end 0.8 mm above the injection point in the VTA were 5.7 mm pos-
terior to bregma, 0.75 mm lateral from the midline, 7.8 mm ventral
from the surface of the skull (Paxinos and Watson, 2005). Small holes
were drilled into the skull and self-tapping stainless steel screws
placed to secure the cranioplastic cement (Plastics One) to the skull.
Sites for the cannula guides were marked and holes drilled through
the skull for the bilateral placement of the 26 gauge stainless steel
guides. Once in place, the guides were attached to the skull using
cranioplastic cement. When the cement was dry, the animal was re-
moved from the stereotaxic instrument, and sterile obturators (33
gauge; 0.8 mm longer than the guide cannula) were inserted into
the guides to prevent them from clogging and to reduce the potential
for brain infection. The obturators were checked daily and cleaned
as needed.
Microinjection Procedure
After surgery, the rats were allowed to recover for an additional week
followed by daily manipulation and habituation to the injection

Neuron808
procedure for 4 days. The injectors were 0.8 mm longer than the
guide cannulae. Once the injectors were inserted, the rats were
placed into an open cage and allowed to move freely during the in-
fusion. The infusion pumps were operated for 1 min, delivering 0.5 ml
of drug or vehicle per side. Leptin was obtained from R&D Systems
(Torrance, California) and dissolved according to manufacturer’s
protocol. The injectors were left in the brain for an additional minute
after the end of the injection before being removed and the sterile
obturators replaced.
Feeding Behavior
On the day of the test, the food was removed at 6:30 PM, and the rats
were allowed to remain in their home cage until the infusion of either
vehicle (13 PBS) or leptin. Following injection, the rats were returned
to their home cage and were allowed full access to regular chow with
feeding measurements beginning 30 min later. For long-term stud-
ies, food intake and body weight were measured between 4:00 PM
and 5:00 PM daily. Standard rodent chow (Harlan Teklad, Indianap-
olis, Indiana, #7001) containing 12% (by kcal) fat was used. For high-
fat diet studies, rodent diet with 45% (by kcal) fat was used
(#D12451, Research Diets, New Brunswick, New Jersey).
Locomotor Assay
Rats implanted with bilateral cannulae in the VTA were habituated to
the microinjection procedure as they had been previously infused for
feeding studies. On the test day, leptin or vehicle (13 PBS) was de-
livered 30 min after onset of the dark cycle. Animals were placed in
circular locomotor chambers (MED Associates, St. Albans, Vermont)
and locomotor activity measured over 2 hr. For the long-term stud-
ies, AAV-shCTRL- and AAV-shLEPR-injected animals were habitu-
ated to the locomotor room for 4 hr. Home-cage locomotor activity
(San Diego Instruments, San Diego, California) was measured by
beam breaks over a 24 hr period.
Determination of Cannula Placements
At the completion of the infusion experiments, animals were sacri-
ficed via transcardial infusion of 4% paraformaldehyde. Brain sec-
tions were then analyzed by histology via cresyl violet Nissl stain
as well as more detailed immunofluorescent analysis to evaluate
the exact placement relative to tyrosine hydroxylase staining. Please
see Figure S2 for summary analysis and pictures.
Extracellular Single-Unit Recording
Impulse activity of VTA dopamine cells was determined using previ-
ously described methods (Henry et al., 1989; Marinelli et al., 2006;
Marinelli and White, 2000; Ungless et al., 2004). Briefly, recordings
were made from naı̈ve rats, which were anesthetized with chloral hy-
drate (400 mg/kg, i.p.), and mounted in a stereotaxic apparatus (Da-
vid Kopf Instruments, Tujunga, California). A lateral tail vein was
catheterized to administer additional anesthetic or drugs. Body tem-
perature was monitored by a rectal thermometer (Poly Medica
Healthcare Inc., Golden, Colorado) and maintained at 37.0�C
(60.5�C) with a thermostatically controlled heating pad (Fintronics
Inc., Orange, Connecticut). A burr hole was drilled in the skull, and
the dura mater was retracted from the area overlying the VTA. A
glass electrode with a tip diameter of 1–2 mm and filled with a 2 M
NaCl solution saturated with 1% fast green dye (Fisher Scientific
Co., St Louis, Missouri) was slowly advanced with a hydraulic micro-
drive (David Kopf Instruments) to the dopamine cell region. The co-
ordinates for the VTA were as follows: 2.8–3.6 mm anterior to
lambda, 0.3–0.7 mm lateral from the midline, and 7.8–8.6 mm ventral
from the cortical surface (Paxinos and Watson, 2005).
Dopamine cells were identified by anatomical location in the VTA
and according to standard physiological criteria (White, 1996).
These neurons had (1) a characteristic triphasic (+/2/+) waveform
with a wide duration action potential of 2.5–3.5 ms, (2) low spontane-
ous firing rates of 0.5–10 Hz, and (3) either a slow irregular firing pat-
tern or a slow bursting pattern with decreasing spike amplitude and
increasing interspike interval within the burst. During extracellular
recording, electrical signals were detected by a high-impedance
amplifier (Fintronics Inc.) and monitored by an oscilloscope (Tek-
tronic R5110, Chicago, Illinois) using a window discriminator and
an audio-amplifier to detect single-unit events (Grass AM8, Quincy,
Massachusetts). An analog-to-digital interface digitized the signal
(Digidata 1200 series, Axon Instruments Inc., Foster City, California)
to a PC running AxoScope software (Axon Instruments Inc.) that
measured impulse activity on-line and stored all data for future anal-
ysis. Stored data were then analyzed with a custom-made program
from our laboratory (BURST, M.M.) that calculated firing rates (num-
ber of spikes/sec: Hz). Neuronal activity of VTA dopamine neurons
was determined on 3–4 cells per rat to establish a preleptin baseline
activity. Then, saline or leptin (2 mg/kg IV) was administered over
4 min (0.5 mg/kg/min). Dopamine cell activity, during and after saline
or leptin administration, was recorded as long as possible in the
same cell (15–40 min). When the cell was lost, additional cells were
recorded at different time points after the administration of the
drug (postsaline or postleptin activity). Each pre- or postleptin cell
was recorded for at least 3 min and needed to exhibit stable activity
(<5% variation) over at least 2 min to be included in the study. Basal
firing rates were 4.61 6 0.71 for the saline group and 4.77 6 0.40 for
the leptin group. A total of 78 neurons was recorded from 10 rats with
the number of neurons for each time bin are as follows: for leptin (47
total neurons from five rats), 2100–230, five neurons; 225–0, 13
neurons; 1–10, nine neurons; 11–20, six neurons; 21–35, seven neu-
rons; 45–90, seven neurons; for saline (31 total neurons from 5 rats),
2100–230, eight neurons; 225–0, seven neurons; 1–10, five neu-
rons; 11–20, three neurons; 21–35, two neurons; 45–90, six neurons.
Data are presented as values recorded at different times before
(baseline activity) or after saline or leptin administration. All elec-
trode placements were confirmed by passing a 28 mA cathodal cur-
rent through the electrode. The exact location of the tip of the elec-
trode could then be located via histological analysis of the fast green
dye deposition site (see Figure S3 for an example).
In Vitro Recordings in Brain Slices
Brain slices (300 mm) containing the VTA were prepared from 2- to 3-
week-old male mice. Animals were anesthetized with Nembutal
(80 mg/kg) and then decapitated. The brains were then rapidly
removed and immersed in a cold (4�C) oxygenated bath solution
(containing 220 mM sucrose, 2.5 mM KCl, 1 mM CaCl2, 6 mM
MgCl2, 1.25 mM NaH2PO4, 26 mM NaHCO3, and 10 mM glucose
[pH 7.3] with NaOH). After being cut on a vibratome and trimmed
to contain only the VTA, slices were transferred to a storage cham-
ber where they were constantly perfused with bath solution at
2 ml/min at room temperature. Before recording slices were main-
tained in a recording chamber at 33�C and perfused continuously
with ASCF (bubbled with 5% CO2 and 95% O2) containing 124 mM
NaCl, 3 mM KCl, 2 mM CaCl2, 2 mM MgCl2, 1.23 mM NaH2PO4,
26 mM NaHCO3, 10 mM glucose (pH 7.4) with NaOH, for at least
1 hr. Whole-cell current clamp was used to observe spontaneous ac-
tion potentials in dopamine neurons in the VTA. The pipette solution
contained 135 mM K-gluconate, 2 mM MgCl2, 10 mM HEPES,
1.1 mM EGTA, 2 mM Mg-ATP, 10 mM Na2-phosphocreatine, and
0.3 mM Na2-GTP (pH 7.3) with KOH. Dopamine neurons in the VTA
were identified by presence of a large Ih current (>100 pA) evoked
by hyperpolarizing voltage steps from 250 to 2120 mV for 2 s (John-
son and North, 1992; Liu et al., 2005). More than 90% of dopamine
neurons in the VTA can be identified with accuracy with this ap-
proach (Johnson and North, 1992; Liu et al., 2005). Leptin was
applied to the recording chamber via bath application after a stable
recording of action potentials was obtained. All data were sampled
at 3–10 kHz and filtered at 1–3 kHz with an Apple Macintosh com-
puter using Axograph 4.9 (Axon Instruments). Electrophysiological
data were analyzed with Axograph 4.9 (Axon Instruments) and
plotted with Igor Pro software (WaveMetrics, Lake Oswego,
Oregon).
Design and Construction of shRNA
Hairpin RNA was designed to target specific regions of Lepr mRNA.
We identified a 24 nucleotide sequence within the coding region of
Lepr using published criteria (Reynolds et al., 2004). The hairpins
were designed such that the antisense strand came before the
sense strand during transcription. We synthesized two sets of oligo-
nucleotides (Qiagen) for cloning: shLEPR (top, 50-TTTGAAATCTTTA
AATTACCATCATCTTTCGAGATGATGGTAATTTAAAGATTTATTTTT-
30; bottom, 50-CTAGAAAAATAAATCTTTAAATTACCATCATCTCGAA
AGATGATGGTAATTTAAAGATTT-30), and shCTRL (top, 50-TTTGTG
GAGCCGAGTTTCTAAATTCCGCACCGGAATTTAGAAACCCGGCT
Leptin Regulation of Dopamine Neurons and Feeding809
CCACTTTTT-30; bottom, 50-CTAGAAAAAGTGGAGCCGGGTTTCTA
AATTCCGGTGCGGAATTTAGAAACTCGGCTCCA-30). The oligonu-
cleotides had BbsI and XbaI overhangs to allow for ligation into
the mU6pro plasmid, and all final clones were verified by sequenc-
ing. The mU6 promoter, hairpin sequence, and terminator se-
quences were cut out using ApaI and KpnI sites and ligated into
an AAV plasmid designed to coexpress EGFP under the control
of an independent RNA polymerase II promoter and terminator
(Hommel et al., 2003).
Viral Production and Purification
Viral production was accomplished using a triple-transfection,
helper-free method and purified as previously described (Hommel
et al., 2003). Briefly, HEK293 cells were cultured in ten 150 3 25
mm cell culture dishes and transfected with pAAV-shRNA, pHelper,
and pAAV-RC plasmids (Stratagene) using a standard calcium phos-
phate method. Cells were collected, pelleted, and resuspended in
freezing buffer (0.15 M NaCl and 50 mM Tris [pH 8.0]) 66–70 hr after
transfection. After two freeze-thaw cycles to lyse the cells, Ben-
zoase was added (Calbiochem, 50 U/ml, final), and the mixture
was incubated at 37�C for 30 min. The lysate was added to a centri-
fuge tube containing a 15%, 25%, 40%, and 60% iodixanol step gra-
dient. The gradient was spun at 350,000 3 g for 60 min at 18�C, the
40% fraction was collected and exchanged with 13 PBS using Ami-
con BioMax 100K NMWL concentrators. The final purified virus was
stored at 280�C. The virus was visualized for purity by silver stain
and titered by infection of sodium butyrate-treated HT1080 cells.
Viral Delivery
Rats were anesthetized using pentobarbital and mounted into a ste-
reotaxic apparatus (Kopf). For VTA targeting, Hamilton syringe nee-
dles (at 10� angle) were targeted to 5.6 mm posterior from bregma,
2.2 mm lateral from the midline, and 8.6 mm ventral from the surface
of the skull. A total of 2.0 ml of purified virus (1–2 3 1011 infectious
particles/ml) was delivered per side over a 5 min period.
Sucrose Preference
The sucrose preference experiments were done as previously de-
scribed (Bolanos et al., 2003). Briefly, at the conclusion of the feed-
ing experiments (1 month after the delivery of the virus), animals
were habituated to drink from two water bottles for 4 days in their
home cages. At approximately 3:00 PM daily, water consumption
from each bottle was measured to ensure that there were no base-
line differences in bottle preference. Then, the animals were given
a 0.2% sucrose solution in one of the bottles. The liquid consump-
tion in each bottle was measured every 24 hr over a period of
2 days, and the position of the bottles was alternated between the
2 days to compensate for bottle-position preference. The percent-
age of sucrose water consumption over total fluid intake was calcu-
lated and expressed as percent sucrose preference. Water stoppers
with two bearings were used to prevent leakage.
Data Analysis
Statistical significance was assessed using one-way and factorial
design analysis of variance (ANOVA) followed by post-hoc tests.
Statistical significance was defined as p value < 0.05.
Supplemental Data
The Supplemental Data for this article can be found online at http://
www.neuron.org.cgi/content/full/51/6/801/DC1/.
Acknowledgments
We thank Dr. Carlos Bolanos and Dr. Thomas Green for advice on
data analysis and Drs. Amy MacQueen, Douglas Guarnieri, and
Maysa Sarhan for comments on the manuscript. This research
was supported by a National Institutes of Health grant (DK071205)
to R.J.D.
Received: April 12, 2006
Revised: August 7, 2006
Accepted: August 25, 2006
Published: September 20, 2006
References
Badiani, A., Leone, P., and Stewart, J. (1995). Intra-VTA injections of
the mu-opioid antagonist CTOP enhance locomotor activity. Brain
Res. 690, 112–116.
Balthasar, N., Coppari, R., McMinn, J., Liu, S.M., Lee, C.E., Tang, V.,
Kenny, C.D., McGovern, R.A., Chua, S.C., Jr., Elmquist, J.K., and
Lowell, B.B. (2004). Leptin receptor signaling in POMC neurons is re-
quired for normal body weight homeostasis. Neuron 42, 983–991.
Balthasar, N., Dalgaard, L.T., Lee, C.E., Yu, J., Funahashi, H., Wil-
liams, T., Ferreira, M., Tang, V., McGovern, R.A., Kenny, C.D., et al.
(2005). Divergence of melanocortin pathways in the control of food
intake and energy expenditure. Cell 123, 493–505.
Banks, W.A., Clever, C.M., and Farrell, C.L. (2000). Partial saturation
and regional variation in the blood-to-brain transport of leptin in nor-
mal weight mice. Am. J. Physiol. Endocrinol. Metab. 278, E1158–
E1165.
Bassareo, V., and Di Chiara, G. (1999). Differential responsiveness of
dopamine transmission to food-stimuli in nucleus accumbens shell/
core compartments. Neuroscience 89, 637–641.
Bates, S.H., Stearns, W.H., Dundon, T.A., Schubert, M., Tso, A.W.,
Wang, Y., Banks, A.S., Lavery, H.J., Haq, A.K., Maratos-Flier, E.,
et al. (2003). STAT3 signalling is required for leptin regulation of en-
ergy balance but not reproduction. Nature 421, 856–859.
Berhow, M.T., Hiroi, N., Kobierski, L.A., Hyman, S.E., and Nestler,
E.J. (1996). Influence of cocaine on the JAK-STAT pathway in the
mesolimbic dopamine system. J. Neurosci. 16, 8019–8026.
Blendy, J.A., Strasser, A., Walters, C.L., Perkins, K.A., Patterson, F.,
Berkowitz, R., and Lerman, C. (2005). Reduced nicotine reward in
obesity: cross-comparison in human and mouse. Psychopharma-
cology (Berl.) 180, 306–315.
Bolanos, C.A., Barrot, M., Berton, O., Wallace-Black, D., and Nestler,
E.J. (2003). Methylphenidate treatment during pre- and periadoles-
cence alters behavioral responses to emotional stimuli at adulthood.
Biol. Psychiatry 54, 1317–1329.
Carr, K.D. (2002). Augmentation of drug reward by chronic food re-
striction: behavioral evidence and underlying mechanisms. Physiol.
Behav. 76, 353–364.
Chen, H., Charlat, O., Tartaglia, L.A., Woolf, E.A., Weng, X., Ellis, S.J.,
Lakey, N.D., Culpepper, J., Moore, K.J., Breitbart, R.E., et al. (1996).
Evidence that the diabetes gene encodes the leptin receptor: Iden-
tification of a mutation in the leptin receptor gene in db/db mice.
Cell 84, 491–495.
Cowley, M.A., Smart, J.L., Rubinstein, M., Cerdan, M.G., Diano, S.,
Horvath, T.L., Cone, R.D., and Low, M.J. (2001). Leptin activates an-
orexigenic POMC neurons through a neural network in the arcuate
nucleus. Nature 411, 480–484.
Dhillon, H., Zigman, J.M., Ye, C., Lee, C.E., McGovern, R.A., Tang, V.,
Kenny, C.D., Christiansen, L.M., White, R.D., Edelstein, E.A., et al.
(2006). Leptin directly activates SF1 neurons in the VMH, and this
action by leptin is required for normal body-weight homeostasis.
Neuron 49, 191–203.
Echo, J.A., Lamonte, N., Ackerman, T.F., and Bodnar, R.J. (2002).
Alterations in food intake elicited by GABA and opioid agonists
and antagonists administered into the ventral tegmental area region
of rats. Physiol. Behav. 76, 107–116.
Elmquist, J.K., Bjorbaek, C., Ahima, R.S., Flier, J.S., and Saper, C.B.
(1998). Distributions of leptin receptor mRNA isoforms in the rat
brain. J. Comp. Neurol. 395, 535–547.
Figlewicz, D.P. (2003). Adiposity signals and food reward: expanding
the CNS roles of insulin and leptin. Am. J. Physiol. Regul. Integr.
Comp. Physiol. 284, R882–R892.
Figlewicz, D.P., Higgins, M.S., Ng-Evans, S.B., and Havel, P.J.
(2001). Leptin reverses sucrose-conditioned place preference in
food-restricted rats. Physiol. Behav. 73, 229–234.
Figlewicz, D.P., Evans, S.B., Murphy, J., Hoen, M., and Baskin, D.G.
(2003). Expression of receptors for insulin and leptin in the ventral
tegmental area/substantia nigra (VTA/SN) of the rat. Brain Res.
964, 107–115.
Neuron810
Figlewicz, D.P., Bennett, J., Evans, S.B., Kaiyala, K., Sipols, A.J., and
Benoit, S.C. (2004). Intraventricular insulin and leptin reverse place
preference conditioned with high-fat diet in rats. Behav. Neurosci.
118, 479–487.
Frederich, R.C., Lollmann, B., Hamann, A., Napolitano-Rosen, A.,
Kahn, B.B., Lowell, B.B., and Flier, J.S. (1995). Expression of ob
mRNA and its encoded protein in rodents. Impact of nutrition and
obesity. J. Clin. Invest. 96, 1658–1663.
Friedman, J.M., and Halaas, J.L. (1998). Leptin and the regulation of
body weight in mammals. Nature 395, 763–770.
Fulton, S., Woodside, B., and Shizgal, P. (2000). Modulation of brain
reward circuitry by leptin. Science 287, 125–128.
Ghilardi, N., Ziegler, S., Wiestner, A., Stoffel, R., Heim, M.H., and
Skoda, R.C. (1996). Defective STAT signaling by the leptin receptor
in diabetic mice. Proc. Natl. Acad. Sci. USA 93, 6231–6235.
Gold, S.J., Heifets, B.D., Pudiak, C.M., Potts, B.W., and Nestler, E.J.
(2002). Regulation of regulators of G protein signaling mRNA expres-
sion in rat brain by acute and chronic electroconvulsive seizures. J.
Neurochem. 82, 828–838.
Grill, H.J., Schwartz, M.W., Kaplan, J.M., Foxhall, J.S., Breininger, J.,
and Baskin, D.G. (2002). Evidence that the caudal brainstem is a tar-
get for the inhibitory effect of leptin on food intake. Endocrinology
143, 239–246.
Halaas, J.L., Gajiwala, K.S., Maffei, M., Cohen, S.L., Chait, B.T., Ra-
binowitz, D., Lallone, R.L., Burley, S.K., and Friedman, J.M. (1995).
Weight-reducing effects of the plasma protein encoded by the
obese gene. Science 269, 543–546.
Henry, D.J., Greene, M.A., and White, F.J. (1989). Electrophysiolog-
ical effects of cocaine in the mesoaccumbens dopamine system:
repeated administration. J. Pharmacol. Exp. Ther. 251, 833–839.
Hommel, J.D., Sears, R.M., Georgescu, D., Simmons, D.L., and
DiLeone, R.J. (2003). Local gene knockdown in the brain using
viral-mediated RNA interference. Nat. Med. 9, 1539–1544.
Hosoi, T., Kawagishi, T., Okuma, Y., Tanaka, J., and Nomura, Y.
(2002). Brain stem is a direct target for leptin’s action in the central
nervous system. Endocrinology 143, 3498–3504.
Huang, X.F., Koutcherov, I., Lin, S., Wang, H.Q., and Storlien, L.
(1996). Localization of leptin receptor mRNA expression in mouse
brain. Neuroreport 7, 2635–2638.
Johnson, S.W., and North, R.A. (1992). Opioids excite dopamine
neurons by hyperpolarization of local interneurons. J. Neurosci.
12, 483–488.
Kamohara, S., Burcelin, R., Halaas, J.L., Friedman, J.M., and Char-
ron, M.J. (1997). Acute stimulation of glucose metabolism in mice
by leptin treatment. Nature 389, 374–377.
Kauer, J.A. (2004). Learning mechanisms in addiction: synaptic plas-
ticity in the ventral tegmental area as a result of exposure to drugs of
abuse. Annu. Rev. Physiol. 66, 447–475.
Krugel, U., Schraft, T., Kittner, H., Kiess, W., and Illes, P. (2003).
Basal and feeding-evoked dopamine release in the rat nucleus ac-
cumbens is depressed by leptin. Eur. J. Pharmacol. 482, 185–187.
Levin, B.E. (2000). Glucose-regulated dopamine release from sub-
stantia nigra neurons. Brain Res. 874, 158–164.
Liu, Q.S., Pu, L., and Poo, M.M. (2005). Repeated cocaine exposure
in vivo facilitates LTP induction in midbrain dopamine neurons.
Nature 437, 1027–1031.
Marinelli, M., and White, F.J. (2000). Enhanced vulnerability to co-
caine self-administration is associated with elevated impulse activ-
ity of midbrain dopamine neurons. J. Neurosci. 20, 8876–8885.
Marinelli, M., Rudick, C.N., Hu, X.T., and White, F.J. (2006). Excitabil-
ity of dopamine neurons: modulation and physiological conse-
quences. CNS Neurol. Disord. Drug Targets 5, 79–97.
Mogenson, G.J., and Yang, C.R. (1991). The contribution of basal
forebrain to limbic-motor integration and the mediation of motiva-
tion to action. Adv. Exp. Med. Biol. 295, 267–290.
Mokdad, A.H., Ford, E.S., Bowman, B.A., Dietz, W.H., Vinicor, F.,
Bales, V.S., and Marks, J.S. (2003). Prevalence of obesity, diabetes,
and obesity-related health risk factors, 2001. JAMA 289, 76–79.
Mucha, R.F., and Iversen, S.D. (1986). Increased food intake after
opioid microinjections into nucleus accumbens and ventral tegmen-
tal area of rat. Brain Res. 397, 214–224.
Naleid, A.M., Grace, M.K., Cummings, D.E., and Levine, A.S. (2005).
Ghrelin induces feeding in the mesolimbic reward pathway between
the ventral tegmental area and the nucleus accumbens. Peptides 26,
2274–2279.
Noel, M.B., and Gratton, A. (1995). Electrochemical evidence of
increased dopamine transmission in prefrontal cortex and nucleus
accumbens elicited by ventral tegmental mu-opioid receptor activa-
tion in freely behaving rats. Synapse 21, 110–122.
Noel, M.B., and Wise, R.A. (1995). Ventral tegmental injections of
a selective mu or delta opioid enhance feeding in food-deprived
rats. Brain Res. 673, 304–312.
Paxinos, G., and Watson, C. (2005). The Rat Brain in Stereotaxic Co-
ordinates, Fifth Edition (Amsterdam: Elsevier Academic Press).
Pinto, S., Roseberry, A.G., Liu, H., Diano, S., Shanabrough, M., Cai,
X., Friedman, J.M., and Horvath, T.L. (2004). Rapid rewiring of arcu-
ate nucleus feeding circuits by leptin. Science 304, 110–115.
Reynolds, A., Leake, D., Boese, Q., Scaringe, S., Marshall, W.S., and
Khvorova, A. (2004). Rational siRNA design for RNA interference.
Nat. Biotechnol. 22, 326–330.
Saper, C.B., Chou, T.C., and Elmquist, J.K. (2002). The need to feed:
Homeostatic and hedonic control of eating. Neuron 36, 199–211.
Satoh, N., Ogawa, Y., Katsuura, G., Hayase, M., Tsuji, T., Imagawa,
K., Yoshimasa, Y., Nishi, S., Hosoda, K., and Nakao, K. (1997). The
arcuate nucleus as a primary site of satiety effect of leptin in rats.
Neurosci. Lett. 224, 149–152.
Schultz, W., and Dickinson, A. (2000). Neuronal coding of prediction
errors. Annu. Rev. Neurosci. 23, 473–500.
Seeley, R.J., van Dijk, G., Campfield, L.A., Smith, F.J., Burn, P., Nel-
ligan, J.A., Bell, S.M., Baskin, D.G., Woods, S.C., and Schwartz,
M.W. (1996). Intraventricular leptin reduces food intake and body
weight of lean rats but not obese Zucker rats. Horm. Metab. Res.
28, 664–668.
Shalev, U., Yap, J., and Shaham, Y. (2001). Leptin attenuates acute
food deprivation-induced relapse to heroin seeking. J. Neurosci.
21, RC129.
Shanley, L.J., Irving, A.J., and Harvey, J. (2001). Leptin enhances
NMDA receptor function and modulates hippocampal synaptic plas-
ticity. J. Neurosci. 21, RC186.
Spanswick, D., Smith, M.A., Groppi, V.E., Logan, S.D., and Ashford,
M.L. (1997). Leptin inhibits hypothalamic neurons by activation of
ATP-sensitive potassium channels. Nature 390, 521–525.
Szczypka, M.S., Rainey, M.A., and Palmiter, R.D. (2000). Dopamine
is required for hyperphagia in Lep(ob/ob) mice. Nat. Genet. 25,
102–104.
Tartaglia, L.A., Dembski, M., Weng, X., Deng, N., Culpepper, J.,
Devos, R., Richards, G.J., Campfield, L.A., Clark, F.T., Deeds, J.,
et al. (1995). Identification and expression cloning of a leptin recep-
tor, OB-R. Cell 83, 1263–1271.
Ungless, M.A., Magill, P.J., and Bolam, J.P. (2004). Uniform inhibition
of dopamine neurons in the ventral tegmental area by aversive stim-
uli. Science 303, 2040–2042.
Vaisse, C., Halaas, J.L., Horvath, C.M., Darnell, J.E., Jr., Stoffel, M.,
and Friedman, J.M. (1996). Leptin activation of Stat3 in the hypothal-
amus of wild-type and ob/ob mice but not db/db mice. Nat. Genet.
14, 95–97.
White, F.J. (1996). Synaptic regulation of mesocorticolimbic dopa-
mine neurons. Annu. Rev. Neurosci. 19, 405–436.
White, F.J., and Kalivas, P.W. (1998). Neuroadaptations involved in
amphetamine and cocaine addiction. Drug Alcohol Depend. 51,
141–153.
Zhang, Y., Proenca, R., Maffei, M., Barone, M., Leopold, L., and
Friedman, J.M. (1994). Positional cloning of the mouse obese gene
and its human homologue. Nature 372, 425–432.
Copyright © 2022 FDOKUMEN


![Non-amine dopamine transporter probe [3H]tropoxene distributes to dopamine-rich regions of monkey brain](https://static.fdokumen.com/doc/165x107/63224d2f050768990e0fcb6c/non-amine-dopamine-transporter-probe-3htropoxene-distributes-to-dopamine-rich.jpg)