Effects of long-term restricted feeding on plasma leptin, hepatic leptin expression and leptin...
8
Effects of long-term restricted feeding on plasma leptin, hepatic leptin expression and leptin receptor expression in juvenile Atlantic salmon (Salmo salar L.) Susanne Trombley a , Gersende Maugars b , Peter Kling c , Björn Thrandur Björnsson c , Monika Schmitz a,⇑ a Evolutionary Biology Centre, Department of Organismal Biology/Comparative Physiology, Uppsala University, SE-752 36 Uppsala, Sweden b Laboratory of Biology of Aquatic Organisms and Ecosystems (BOREA), UMR CNRS 7208-IRD207-UPMC, Muséum National d’Histoire Naturelle, 7 rue Cuvier, CP32, 75231 Paris Cedex 05, France c Department of Zoology/Zoophysiology, University of Gothenburg, Box 463, SE-405 30 Gothenburg, Sweden article info Article history: Received 27 July 2011 Revised 26 September 2011 Accepted 3 October 2011 Available online 12 October 2011 Keywords: Leptin Leptin receptor Restricted feeding Atlantic salmon Teleost abstract Leptin is a pleiotropic hormone and plays a key role in body weight regulation, energy homeostasis and lipid store utilization in mammals. In this study, we investigated the effect of feed-restriction on leptin genes (lepa1 and lepa2), leptin receptor (lepr) gene expression and plasma leptin levels in juvenile Atlantic salmon parr. Feed restriction was performed from late April to mid-June, in order to gain insight into the role of the leptin system in energy balance regulation and adiposity in juvenile salmon. A significant increase in lepa1 expression as well as higher levels of plasma leptin was found in feed-restricted fish in June compared to fully fed controls, while lepa2 gene expression decreased in both groups during the treatment period. Lepa2 was, however significantly higher in the feed-restricted group in June. Leptin receptor expression was up regulated during the period of enhanced growth and lipid deposition in the fully fed control, indicating a seasonal effect on the receptor expression in the brain. Both lepa1 and lepa2 genes very mainly expressed in the liver in juvenile salmon, while lepr was expressed in the brain but showed also considerable expression in various peripheral tissues. The study provides evidence that the leptin system is sensitive to the metabolic status of the fish as both season and restricted feeding affect lepa1 and lepa2 gene expression in the liver and brain leptin receptor expression, however, for lepa1 expression and leptin plasma level in an opposite way as that observed in the mammalian system. Ó 2011 Elsevier Inc. All rights reserved. 1. Introduction Leptin is a 167 amino acid peptide hormone belonging to the class-1 helical cytokine family of proteins, first identified in 1994 in mice as the product of the ob gene [48]. In mammals, leptin is primarily produced by adipocytes of white adipose tissue [48] and is secreted in proportion to body fat stores, thereby acting as a peripheral factor that signals nutritional status to the CNS [31]. Since its discovery, leptin has been studied extensively in a number of mammalian species and has been shown to play a key role in appetite, body weight regulation and energy homeostasis [15,23,32], but has also been implicated in diverse physiological processes such as reproductive ability, immune function, bone for- mation and capillary growth (for review see [14]). In mammals, leptin exerts a central anorectic effect via a nega- tive feedback loop to the appetite center in the hypothalamus and the effects are both long and short term. High leptin levels due to excess fat stores or after a meal inhibit food intake and regulate body weight in the long term as well as promoting postprandial satiety [42]. Low plasma leptin levels, on the other hand, associ- ated with low fat stores and fasting, signals energy insufficiency and stimulate appetite, feeding behavior and promote energy stor- ing [1,2]. In adult rats, restricted feeding for one month reduces plasma leptin levels by 40% [13] and short-term fasting substan- tially decreases leptin both at the gene expression level and at the protein level [1,42,46]. This is believed to be a mechanism of starvation adaptation in mammals, where low circulating leptin levels promote energy conservation, increased appetite, sup- pressed thyroid thermogenesis and reproductive function as a re- sponse to food shortage [2]. Leptin does, however, not regulate body weight solely by its central anorectic and energy deficiency signaling effects, but also by regulating lipid metabolism [7,11,17]. Leptin regulates the utilization of lipid stores by influ- encing specific enzymes to increase fatty acid oxidization and re- duce fatty acid synthesis [7,8]. The physiological function of leptin in fish is still unclear. Leptin was first identified in pufferfish, Takifugu rubripes in 2005 [26] and the leptin gene has since been identified and characterized in a number of other teleosts. Duplicated leptin genes, leptin-a (lepa) and leptin-b (lepb), have been characterized in Japanese medaka, Oryzias latipes [24] and zebrafish, Danio rerio [20]. These two 0016-6480/$ - see front matter Ó 2011 Elsevier Inc. All rights reserved. doi:10.1016/j.ygcen.2011.10.001 ⇑ Corresponding author. Address: Evolutionary Biology Centre, Department of Organismal Biology/Comparative Physiology, Uppsala University, 20 Norbyvägen 18A, SE-752 36 Uppsala, Sweden. Fax: +46 0 18 471 6425. E-mail address: [email protected] (M. Schmitz). General and Comparative Endocrinology 175 (2012) 92–99 Contents lists available at SciVerse ScienceDirect General and Comparative Endocrinology journal homepage: www.elsevier.com/locate/ygcen
-
Upload
independent -
Category
Documents
-
view
3 -
download
0
Transcript of Effects of long-term restricted feeding on plasma leptin, hepatic leptin expression and leptin...

General and Comparative Endocrinology 175 (2012) 92–99
Contents lists available at SciVerse ScienceDirect
General and Comparative Endocrinology
journal homepage: www.elsevier .com/locate /ygcen
Effects of long-term restricted feeding on plasma leptin, hepatic leptinexpression and leptin receptor expression in juvenile Atlantic salmon (Salmo salar L.)
Susanne Trombley a, Gersende Maugars b, Peter Kling c, Björn Thrandur Björnsson c, Monika Schmitz a,⇑a Evolutionary Biology Centre, Department of Organismal Biology/Comparative Physiology, Uppsala University, SE-752 36 Uppsala, Swedenb Laboratory of Biology of Aquatic Organisms and Ecosystems (BOREA), UMR CNRS 7208-IRD207-UPMC, Muséum National d’Histoire Naturelle,7 rue Cuvier, CP32, 75231 Paris Cedex 05, Francec Department of Zoology/Zoophysiology, University of Gothenburg, Box 463, SE-405 30 Gothenburg, Sweden
a r t i c l e i n f o a b s t r a c t
Article history:Received 27 July 2011Revised 26 September 2011Accepted 3 October 2011Available online 12 October 2011
Keywords:LeptinLeptin receptorRestricted feedingAtlantic salmonTeleost
0016-6480/$ - see front matter � 2011 Elsevier Inc. Adoi:10.1016/j.ygcen.2011.10.001
⇑ Corresponding author. Address: Evolutionary BiOrganismal Biology/Comparative Physiology, Uppsal18A, SE-752 36 Uppsala, Sweden. Fax: +46 0 18 471 6
E-mail address: [email protected] (M. Sc
Leptin is a pleiotropic hormone and plays a key role in body weight regulation, energy homeostasis andlipid store utilization in mammals. In this study, we investigated the effect of feed-restriction on leptingenes (lepa1 and lepa2), leptin receptor (lepr) gene expression and plasma leptin levels in juvenile Atlanticsalmon parr. Feed restriction was performed from late April to mid-June, in order to gain insight into therole of the leptin system in energy balance regulation and adiposity in juvenile salmon. A significantincrease in lepa1 expression as well as higher levels of plasma leptin was found in feed-restricted fishin June compared to fully fed controls, while lepa2 gene expression decreased in both groups duringthe treatment period. Lepa2 was, however significantly higher in the feed-restricted group in June. Leptinreceptor expression was up regulated during the period of enhanced growth and lipid deposition in thefully fed control, indicating a seasonal effect on the receptor expression in the brain. Both lepa1 and lepa2genes very mainly expressed in the liver in juvenile salmon, while lepr was expressed in the brain butshowed also considerable expression in various peripheral tissues. The study provides evidence thatthe leptin system is sensitive to the metabolic status of the fish as both season and restricted feedingaffect lepa1 and lepa2 gene expression in the liver and brain leptin receptor expression, however, for lepa1expression and leptin plasma level in an opposite way as that observed in the mammalian system.
� 2011 Elsevier Inc. All rights reserved.
1. Introduction body weight in the long term as well as promoting postprandial
Leptin is a 167 amino acid peptide hormone belonging to theclass-1 helical cytokine family of proteins, first identified in 1994in mice as the product of the ob gene [48]. In mammals, leptin isprimarily produced by adipocytes of white adipose tissue [48]and is secreted in proportion to body fat stores, thereby acting asa peripheral factor that signals nutritional status to the CNS [31].Since its discovery, leptin has been studied extensively in a numberof mammalian species and has been shown to play a key role inappetite, body weight regulation and energy homeostasis[15,23,32], but has also been implicated in diverse physiologicalprocesses such as reproductive ability, immune function, bone for-mation and capillary growth (for review see [14]).
In mammals, leptin exerts a central anorectic effect via a nega-tive feedback loop to the appetite center in the hypothalamus andthe effects are both long and short term. High leptin levels due toexcess fat stores or after a meal inhibit food intake and regulate
ll rights reserved.
ology Centre, Department ofa University, 20 Norbyvägen425.
hmitz).
satiety [42]. Low plasma leptin levels, on the other hand, associ-ated with low fat stores and fasting, signals energy insufficiencyand stimulate appetite, feeding behavior and promote energy stor-ing [1,2]. In adult rats, restricted feeding for one month reducesplasma leptin levels by 40% [13] and short-term fasting substan-tially decreases leptin both at the gene expression level and atthe protein level [1,42,46]. This is believed to be a mechanism ofstarvation adaptation in mammals, where low circulating leptinlevels promote energy conservation, increased appetite, sup-pressed thyroid thermogenesis and reproductive function as a re-sponse to food shortage [2]. Leptin does, however, not regulatebody weight solely by its central anorectic and energy deficiencysignaling effects, but also by regulating lipid metabolism[7,11,17]. Leptin regulates the utilization of lipid stores by influ-encing specific enzymes to increase fatty acid oxidization and re-duce fatty acid synthesis [7,8].
The physiological function of leptin in fish is still unclear. Leptinwas first identified in pufferfish, Takifugu rubripes in 2005 [26] andthe leptin gene has since been identified and characterized in anumber of other teleosts. Duplicated leptin genes, leptin-a (lepa)and leptin-b (lepb), have been characterized in Japanese medaka,Oryzias latipes [24] and zebrafish, Danio rerio [20]. These two

S. Trombley et al. / General and Comparative Endocrinology 175 (2012) 92–99 93
duplicated genes are highly divergent (24% amino acid identity inzebrafish) and might result from the fish genome duplication eventwhich occurred early on in the teleost evolution [20]. To date, onlythe gene encoding lepa has been found in the salmonids, rainbowtrout, Oncorhynchus mykiss [37] and Arctic charr, Salvelinus alpinus[16]. In Atlantic salmon, Salmo salar, two closely related paraloguesof the leptin gene lepa (lepa1 and lepa2) have been identified (71.6%amino acid identity to each other) [41], whereas there are no dataavailable on a potential lepb in salmonids. The homology of theamino acid sequence of the mature region of the peptides is lowbetween teleosts and mammals as well as between species withinthe teleost lineage [26,41]. The four-helix tertiary structure is,however, predicted to be a strongly conserved feature of the differ-ent leptin orthologues [20,21,24,26,41] and genomic synteny anal-ysis of the medaka and zebrafish lep paralogues and the human obgene has revealed conserved gene chromosomal arrangements[20,24]. Unlike in mammals, the main site of leptin expression infish appears to be the liver [21,24,26,41]. The biological importanceof the different leptin genes is still unknown, but some recent datapoint to different tissue distribution patterns, differential regula-tion and hence putative separate physiological functions[20,24,41].
Leptin elicits its biological effects by binding to the membrane-bound leptin receptor (lepr). In mammals, one gene has been char-acterized encoding for lepr and at least six isoforms of the genehave been identified, but only the long isoform has the intracellulardomain necessary to elicit intracellular signaling upon ligand bind-ing (for review see [44]). The long isoform of lepr is highly ex-pressed by specific populations of neurons located in thehypothalamus [5] and the anorexigenic effects of leptin are medi-ated mainly through the interaction of lepr expressing neuronswith the food intake/appetite centers in the hypothalamus, affect-ing gene expression, production and secretion of orexigenic andanorexigenic factors [39]. Only few studies on the expression pat-tern and regulation of the leptin receptor in fish have been carriedout so far. Lepr has been identified in marine medaka, Oryzias mel-astigma [47], Japanese medaka [24], pufferfish [25], zebrafish [29],crussian carp, Carassius carassius (Genbank number ADZ75460.1)and Atlantic salmon [41]. In Atlantic salmon, the leptin receptorgene encodes, in addition to the long form, four other splicing vari-ants which do not possess any transmembrane domain.
A number of recent studies indicate a role of leptin in food in-take regulation and energy homeostasis in teleosts. Available data,however, do not provide a clear picture of the regulation and func-tion of leptin and conflicting evidence exist. In zebrafish fasted forone week, lepb gene expression levels in the liver declined whereaslepa expression did not change significantly [20]. In contrast, juve-nile rainbow trout fasted for three weeks showed a persistent in-crease in leptin plasma levels from week one onwards [22]. Inadult male Atlantic salmon given a restricted diet for 10 months,hepatic lepa2 gene expression levels were higher compared to fullyfed animals, while no effect of diet restriction was seen for lepa1 orplasma leptin levels [41]. In the common carp, neither long norshort-term fasting or re-feeding had an effect on hepatic carp lepa1and lepa2 mRNA expression, while an acute postprandial increasein gene expression was observed for both genes [21]. Treatmentwith recombinant mammalian leptin has yielded conflicting re-sults and either decreased food intake and reduced body weightgain has been observed [10,45] or the treatment has had no effect[4,30,43]. In studies using species-specific recombinant leptininjections, anorexigenic effects, similar to that of mammals, havebeen observed. Short-term leptin treatment decreased food intakein rainbow trout [37] and grass carp [28], whereas long-term leptintreatment did not have an effect [28]. In a recent study by Murashitaand colleagues [36], treatment with recombinant salmon lepa1reduced specific growth rate and increased pomc-a1 gene expression
in the brain of juvenile Atlantic salmon, suggesting that leptinreduces growth through the central POMC pathway. Taken together,there are pieces of evidence supporting the hypothesis that leptinregulates body weight, metabolism and food intake in a similarway as seen in mammals, while other studies indicate novelfunctions of leptin in the teleostean group and perhaps even thatspecies-specific differences exist.
To further elucidate the role of leptin in regulation of adiposityand energy balance, we investigated in the present study the ef-fects of long-term restricted feeding on leptin gene expression(lepa1 and lepa2) in the liver, leptin receptor gene expression inthe brain as well as plasma leptin levels in one-year old maleAtlantic salmon parr. The effect of food restriction was tested dur-ing spring to early summer when juvenile salmon experience en-hanced metabolic rate, appetite and growth due to rising watertemperature and increasing day length [9]. In addition, the tissuedistribution of the mRNA expression of the leptin genes (lepa1and lepa2) and the lepr gene was characterized.
2. Materials and methods
2.1. Fish and rearing conditions
Experiments were carried out on one-year-old Atlantic salmon(S. salar L.) parr, which were the offspring of cross bred wild andhatchery reared salmon. The fish were provided by the NorrforsHatchery in Sweden (63�N, 19�E). They were kept in 4 m2 tanks un-der standard hatchery conditions with through-flowing river waterat ambient temperature and natural photoperiod. Starting in April,the fish were divided randomly into two tanks and given twodifferent feeding regimes for seven weeks. Both groups were feda commercial salmon feed (BioMar Ecostart 17, BioMar A/SDenmark). Feed level for the control group was calculated foroptimal growth at a given temperature and number and size ofthe fish [3]. The restricted feeding diet was calculated as 40% ofthe amount of feed given to the control group (100%) and adjustedfor differences in fish number and size between the tanks. Fishdensity at the start of the experiment was 400 fish/4 m2tank.Amount of feed was regularly adjusted throughout the experimentto correct for changes in fish number and fish size. One-year oldmale salmon parr from Älvkarleby hatchery, Sweden (60�N,17�E), reared under natural photoperiod and ambient watertemperature, fed a commercial feed to satiation and sampled insummer of 2010, were used for the tissue distribution analysis.Fish used in these experiments were sub-samples from largerexperiments and included only mature males. All animal experi-mentation was approved by the local ethics committee of theSwedish National Board for Laboratory Animals.
2.2. Sampling procedures
Sampling took place at the start of experiment on the 28th ofApril, the 25th of May and on the 15th of June. Fish were anesthe-tized using metomidate hydrochloride (Aquacalm, Syndel Co.,Vancouver, Canada). At each sampling, the fish was weighed andmeasured, the sex of the fish was determined. Blood was collectedvia the caudal vein using heparinized capillary tubes. Blood sam-ples were kept on ice until centrifugation at 3000g for 5–10 minafter which plasma was stored at �80 �C until analysis. Livers werecollected in RNAlater� solution (Ambion, Austin, TX, USA), incu-bated at 4 �C overnight and stored at �80 �C. Brains were collectedand flash frozen in liquid nitrogen and stored at �80 �C until RNAextraction. Whole, decapitated bodies were collected and frozen at�80 �C for body lipid content analysis. For the tissue distributionstudy, liver, brain, pituitary, stomach, pyloric caeca, intestine,

94 S. Trombley et al. / General and Comparative Endocrinology 175 (2012) 92–99
heart, muscle, visceral adipose tissue, kidney, gills and testis from 3to 4 individuals were collected in RNAlater� solution, incubated at4 �C and frozen at �20 �C until RNA extraction.
2.3. Gene expression quantification
Total RNA was isolated from tissue samples using TRIzol� RNAisolation reagent (Invitrogen, Carlsbad, CA, USA) according to themanufacturer’s instructions. Samples were DNase treated usingTURBO DNase-free™ kit (Ambion) to remove any genomic contam-ination. Total RNA concentrations were measured using Nanodrop(Thermo Fisher Scientific, Delaware, USA). One lg of total RNA wasreverse transcribed using random primers and SuperScript™ III Re-verse Transcriptase (Invitrogen). The reverse transcription was ini-tiated at 25 �C for 10 min; reaction carried out at 50 �C for 60 minand terminated by heating the samples at 70 �C for 15 min.
Relative mRNA levels were measured by qPCR using either aniCycler PCR detection system and a Sybr green I dye kit (Bio-Rad,Hercules, USA) or the Mx3000P� real-time PCR machine (Strata-gene, La Jolla, CA, USA) and the Brilliant II Fast SYBR� Green QPCRMaster Mix (Agilient technologies, Stratagene) according to themanufacturer’s instructions. Relative mRNA levels were normal-ized using 18s rRNA as a reference gene. Gene specific primersfor lepa1 (GenBank Accession No. FJ830677), lepa2 (GenBankAccession No. GU584004) and lepr (GenBank Accession No.NM_001164765) genes (Table 1) were designed using Primer3.Primers were designed to be intron spanning [40] and for lepr,primers were designed to detect only the long form of the leptinreceptor since this is the only isoform that contains the intracellu-lar segment capable of eliciting intracellular signaling [44]. The as-say concentration for both forward and reverse primers was200 nM for all genes. Samples were run in duplicates. 1 ll of di-luted cDNA template (1:5–1:500 depending on the gene studied)was used for each reaction in a total reaction volume of 15 ll.Real-time PCR amplification settings for the iCycler were: 50 �Cfor 2 min and 95 �C for 10 min, followed by 35–50 cycles at 95 �Cfor 15 s, 60 �C for 30 s and 72 �C for 40 s depending on the targetgene. For the Mx3000P� real-time PCR machine, settings were:95 �C for 2 min, followed by 35–50 cycles, depending on the targetgene, at 95 �C for 5 s, 60 �C for 20 s. The specificity of the productwas verified by running a melting curve. Relative target gene levelswere calculated using a standard curve prepared from cDNA con-sisting of a mix of several samples obtained from the RT-reactionStandard curves were run in duplicates and covered at least a con-centration span of three orders of magnitude. Relative expressionlevels were obtained using either the iCycler software (Bio-Rad,Hercules, USA) or the MxPro software v4.10 (�2007 Stratagene).The slope of the standard curve varied between �3.24 and �3.48and the r2 values were >0.98. The lowest Ct-difference for the notemplate control and the highest recorded Ct sample value forany assay was >10 Cts and hence genomic contamination and pri-mer dimer formation was considered negligible.
Table 1Nucleotide sequences for primers used in qPCR.
Primers Direction Nucleotide sequences (50 ? 30)
18s FW CTC AAC ACG GGA AAC CTC ACRV AGA CAA ATC GCT CCA CCA AC
Lepr FW GGG AAG GCT GAC ACT ATG GARV CTT GTC TGG GAC TGA CGT AGG
Lepa1 FW GGT GAT TAG GAT CAA TAA GCT GGARV GAA GAG CAT TAG GTC CTG GTA GAA
Lepa2 FW GGA ATC AAA AAG CTC CCT TCCRV TGG TAG AAC CCC ATG GTC TC
2.4. Body lipid content
Total body lipid content was measured using infrared transmis-sion (MIT) spectroscopy technique [12], with Miris DMA instru-ment (Miris AB, Uppsala, Sweden) calibrated for fish tissueaccording to the manufacturer’s instructions. Whole decapitatedfish, including viscera, were finely minced using a commercialblender and diluted 10 times with LOSsolver (Miris AB, Uppsala,Sweden) at 45 �C. The fish blend was homogenized using theLosMixer (Miris AB, Uppsala, Sweden) followed by a filtering step,to remove any large particles. The filtered homogenate was thenheated to approximately 45 �C and subsequently measured usingthe Miris DMA instrument according to the manufacturer’s instruc-tions. Measurements were carried out in duplicates and total bodylipid content is expressed as percentage body wet weight.
2.5. Radioimmunoassays
Plasma leptin levels were measured according to a homologoussalmonid radioimmunoassay protocol established by Kling et al.[22]. Briefly, the assay is based on a 14 amino acid long sequence,identical between Atlantic salmon LepA1 (sLepA1) and rainbowtrout leptin and polyclonal antibodies raised in rabbit against theleptin peptide fragment. The assay exhibits measuring parallelismfor a range of fish species apart from rainbow trout and Atlanticsalmon including Arctic charr, Atlantic cod and turbot. The RIAselectively measures leptin, as no reactivity between the sLep anti-body and other antigens including GH, IGF-I, CCK8, ghrelin and GRPhas been detected. Due to the limited amount of blood obtainedfrom the fish in April and May, plasma samples were pooled from2 to 3 individuals. In June, all plasma samples were analyzed fromindividual fish. The sample volume of plasma used for the Lep as-say was around 25–50 ll and is well within the measuring range ofthe sLep RIA [22].
2.6. Statistical analysis
All data are presented as means ± standard error of the mean(SEM). The statistical analysis was carried out using IBM� SPSS�
software 18.0.2. Differences in gene expression and body parame-ters between different sampling dates were tested using one-wayANOVA and Tukey HSD post hoc test. Differences between treat-ment and control group were tested by two-tailed independentStudent’s t-test. Results were considered significant if p < 0.05.When necessary, data were log-transformed to fit test assump-tions. Condition factor as well as total body lipid content was arc-sine transformed prior to statistical analysis in order to meet testcriteria. Correlations were analyzed using Pearson correlation anal-ysis. Condition factor was calculated as CF = 100 �W/FL3, whereW = body weight (g) and FL = fork length (cm).
3. Results
3.1. Effect of treatment on growth and adiposity
No significant changes in weight, length, condition factor or to-tal body lipid content occurred in either group during the first fourweeks of the experiment from April through May (Table 2). Duringthis period, water temperature was low and increased successivelyfrom 1.5 to 9.6 �C, after which it continued to increase to reach13.3 �C at the end of the experiment (Fig. 1). Both groups increasedin body weight, length and CF during the last three weeks of treat-ment. The feed-restricted fish had, however, grown less and hadsignificantly lower body weights, lengths and CF compared withthe control fish by the end of the experiment. Total body lipid
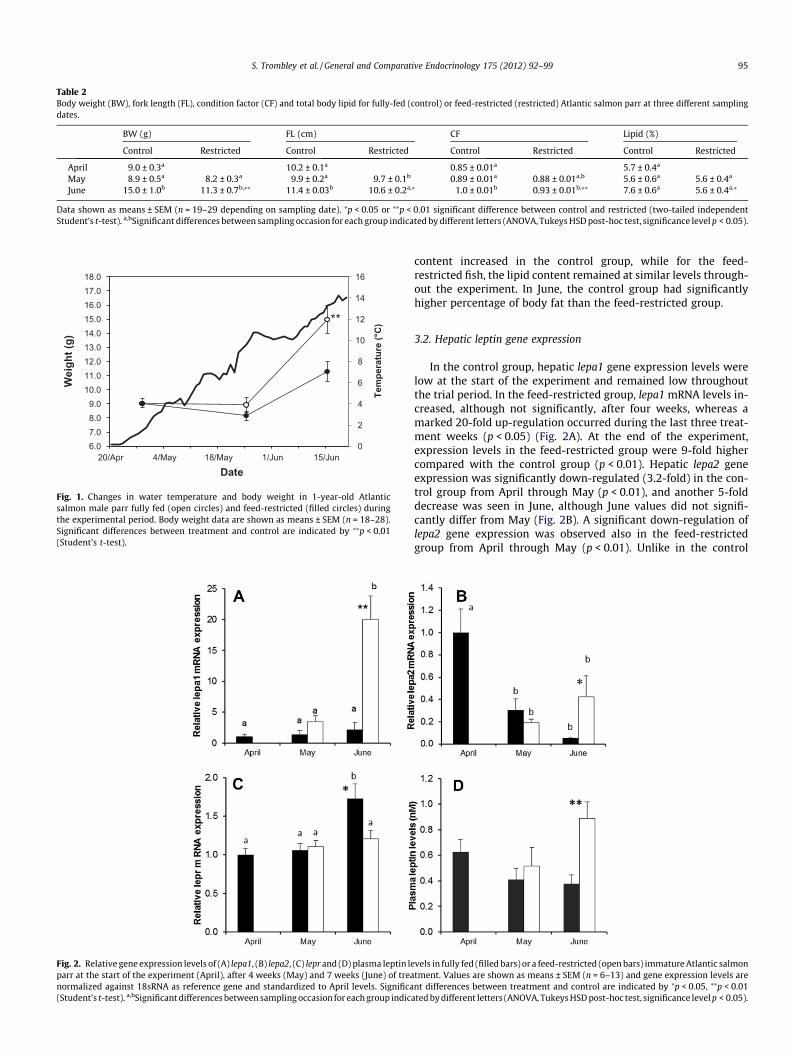
Table 2Body weight (BW), fork length (FL), condition factor (CF) and total body lipid for fully-fed (control) or feed-restricted (restricted) Atlantic salmon parr at three different samplingdates.
BW (g) FL (cm) CF Lipid (%)
Control Restricted Control Restricted Control Restricted Control Restricted
April 9.0 ± 0.3a 10.2 ± 0.1a 0.85 ± 0.01a 5.7 ± 0.4a
May 8.9 ± 0.5a 8.2 ± 0.3a 9.9 ± 0.2a 9.7 ± 0.1b 0.89 ± 0.01a 0.88 ± 0.01a,b 5.6 ± 0.6a 5.6 ± 0.4a
June 15.0 ± 1.0b 11.3 ± 0.7b,⁄⁄ 11.4 ± 0.03b 10.6 ± 0.2a,⁄ 1.0 ± 0.01b 0.93 ± 0.01b,⁄⁄ 7.6 ± 0.6a 5.6 ± 0.4a,⁄
Data shown as means ± SEM (n = 19–29 depending on sampling date). ⁄p < 0.05 or ⁄⁄p < 0.01 significant difference between control and restricted (two-tailed independentStudent’s t-test). a,bSignificant differences between sampling occasion for each group indicated by different letters (ANOVA, Tukeys HSD post-hoc test, significance level p < 0.05).
0
2
4
6
8
10
12
14
16
6.07.08.09.010.011.012.013.014.015.016.017.018.0
20/Apr 4/May 18/May 1/Jun 15/Jun
Wei
ght (
g)
Tem
pera
ture
(°C
)
Date
**
Fig. 1. Changes in water temperature and body weight in 1-year-old Atlanticsalmon male parr fully fed (open circles) and feed-restricted (filled circles) duringthe experimental period. Body weight data are shown as means ± SEM (n = 18–28).Significant differences between treatment and control are indicated by ⁄⁄p < 0.01(Student’s t-test).
Fig. 2. Relative gene expression levels of (A) lepa1, (B) lepa2, (C) lepr and (D) plasma leptin leparr at the start of the experiment (April), after 4 weeks (May) and 7 weeks (June) of treanormalized against 18sRNA as reference gene and standardized to April levels. Significa(Student’s t-test). a,bSignificant differences between sampling occasion for each group indica
S. Trombley et al. / General and Comparative Endocrinology 175 (2012) 92–99 95
content increased in the control group, while for the feed-restricted fish, the lipid content remained at similar levels through-out the experiment. In June, the control group had significantlyhigher percentage of body fat than the feed-restricted group.
3.2. Hepatic leptin gene expression
In the control group, hepatic lepa1 gene expression levels werelow at the start of the experiment and remained low throughoutthe trial period. In the feed-restricted group, lepa1 mRNA levels in-creased, although not significantly, after four weeks, whereas amarked 20-fold up-regulation occurred during the last three treat-ment weeks (p < 0.05) (Fig. 2A). At the end of the experiment,expression levels in the feed-restricted group were 9-fold highercompared with the control group (p < 0.01). Hepatic lepa2 geneexpression was significantly down-regulated (3.2-fold) in the con-trol group from April through May (p < 0.01), and another 5-folddecrease was seen in June, although June values did not signifi-cantly differ from May (Fig. 2B). A significant down-regulation oflepa2 gene expression was observed also in the feed-restrictedgroup from April through May (p < 0.01). Unlike in the control
vels in fully fed (filled bars) or a feed-restricted (open bars) immature Atlantic salmontment. Values are shown as means ± SEM (n = 6–13) and gene expression levels arent differences between treatment and control are indicated by ⁄p < 0.05, ⁄⁄p < 0.01ted by different letters (ANOVA, Tukeys HSD post-hoc test, significance level p < 0.05).

96 S. Trombley et al. / General and Comparative Endocrinology 175 (2012) 92–99
group, lepa2 transcript levels did not decrease further after May.Instead, even though being significantly lower than in April(p < 0.05), a trend towards increasing lepa2 levels could be seenby the June sampling. Lepa2 gene expression levels were at thistime 3.9 times higher in the feed-restricted group compared withthe control group (p < 0.05).
3.3. Leptin receptor gene expression
There was no change in the gene expression levels of lepr in thebrain from April through May in either group (Fig. 2C). There was,however, a significant increase in brain expression levels of lepr atthe last sampling occasion in the control group (p = 0.001); theJune values being significantly higher compared to both April andMay (p < 0.05). No such increase in lepr expression was observed inthe feed-restricted group. Lepr gene expression levels were signif-icantly higher in the control group compared to the feed-restrictedgroup in June (p < 0.05).
0.0
0.2
0.4
0.6
0.8
1.0
1.2
1.4
1.6
Br Pit St Py In Li He Mu Ad Ki Gi Te
Rel
ativ
e le
pa1
mR
NA
ex
pres
sion
A
0.0
0.2
0.4
0.6
0.8
1.0
1.2
1.4
1.6
Br Pi St Py In Li He Mu Ad Ki Gi Te
Rel
ativ
e le
pa2
mR
NA
ex
pres
sion
B
0.0
0.5
1.0
1.5
2.0
2.5
3.0
Br Pi St Py In Li He Mu Ad Ki Gi Te
Rel
ativ
e le
pr m
RN
A
expr
essi
on
C
Fig. 3. Tissue distribution of (A) lepa1, (B) lepa2 and (C) lepr in immature maleAtlantic salmon parr using qPCR normalized against 18sRNA as reference gene.Results are relative gene expression levels standardized to liver for lepa1 and lepa2and brain for lepr. Values are presented as means ± SEM (n = 2–4). Br, brain; Pi,pituitary; St, stomach; Py, pyloric ceaca; In, intestine; Li, liver; He, heart; Mu,muscle; Ad, adipose tissue; Ki, kidney; Gi, gills; Te, testis (immature).
3.4. Plasma leptin levels
Plasma leptin levels in the control group decreased, but not sig-nificantly, from 0.63 nM in April to 0.41 nM in May and continuedto decrease slightly to 0.38 nM in June (Fig. 2D). In the feed-re-stricted group, on the other hand, leptin levels decreased slightlyfrom April through May, and an important, but not significant in-crease to 0.89 nM by June. Thus, in June, the feed-restricted grouphad 2.3 times higher plasma leptin levels compared with the con-trol group (p < 0.05).
3.5. Correlation analysis
Correlation analysis for the plasma leptin levels could only beperformed for the June sampling date due to plasma samples forthe other two sampling occasions being pooled. In June, plasmaleptin levels were significantly correlated with lepa1 mRNA expres-sion for the restricted feed group (r2 = 0.77, p < 0.01), but not forthe control group. Lepa2 was not correlated with plasma leptin lev-els. Neither lepa1 nor lepa2 was correlated to total body lipid con-tent, while CF was negatively correlated with lepa2 in the controlgroup (r = �0.58, p < 0.001), but not in the feed-restricted group(r2 = 0.12). Plasma leptin levels were negatively correlated withbody lipid content in the control group in June (r2 = �0.57,p < 0.05), but not in the feed-restricted group.
3.6. Tissue expression of lepa1, lepa2 and lepr
The major site of lepa1 mRNA expression was the liver (Fig. 3A).Gene expression of lepa1 was found in the pituitary, gills, brain,heart and muscle as well. Lepa2 was expressed almost exclusivelyin the liver, but were also detected at low levels in muscle andheart (Fig. 3B). Lepr had a wide tissue distribution, with the highestexpression levels in kidney, testis, heart and brain (Fig. 3C).
4. Discussion
In the present study, the effect of restricted feeding on changesin the leptin system was investigated; both at the leptin geneexpression and the protein level, in order to gain insight into therole of this system in energy balance regulation and adiposity injuvenile Atlantic salmon parr at the start of the early summergrowth phase. No growth or energy accumulation took place dur-ing the first four weeks of the experiment in either group whichcan be explained by water temperature, even though increasing,still being too low for rapid growth [27]. The experiment was ini-tiated during a time when the fish are coming out of winter condi-tions with low water temperature, poor appetite and hence a sortof natural starvation period and a state of low metabolism [34]. Atthe northern latitude at which the experiment was conductedother studies have shown, that significant growth does not neces-sarily start until the beginning of June despite rising temperaturesalready during May [6].
One of the major findings of this study was that a seven-weekrestricted feeding regime led to a significant increase in lepa1expression as well as higher levels of plasma leptin compared tofully fed fish. The observed increase occurred during the last threeweeks of the treatment when the effects of restricted feeding couldbe seen. Control fish had at this time started growing, and had in-creased CF and fat stores, while the feed-restricted fish showedstunted growth and no fat deposition. The observed increase in he-patic lepa1 gene expression and plasma leptin levels as a responseto feed-restriction is in agreement with studies on rainbow trout[22], where significantly higher plasma leptin levels were detectedafter only one week of food deprivation, an effect that persisted

S. Trombley et al. / General and Comparative Endocrinology 175 (2012) 92–99 97
throughout the three weeks of the experiment. The results fromboth these studies are in contrary to the mammalian model, wherefeed-restriction/fasting lead to reduced leptin gene expression andplasma leptin levels [42,46], indicating a different, perhaps evenopposing, physiological function of leptin in fish to that seen inmammals, as proposed by Kling and colleagues [22]. However, ina recent study on zebrafish, food deprivation for one week resultedin lower hepatic lepb transcript levels compared with fed fish,while lepa was unaffected by treatment, indicating a conservedfunction for the lepb gene and mammalian leptin, whereas the lepamay have diverged [20].
The expression of the two leptin genes differed noticeably inresponse to treatment and season, indicating different regulation.Feed-restriction up-regulated lepa1 mRNA expression, while lepa2gene expression was instead down-regulated in both feed-restricted and fully fed animals. However, in the feed-restrictedgroup, lepa2 levels were significantly higher than the fully-fedgroup in June. In a long term (10 month) rationed feeding experi-ment using adult Atlantic salmon, hepatic expression of lepa2,but not lepa1, was significantly higher in the rationed feedinggroup, while plasma leptin levels did not differ between the groups[41]. An important difference between the present study and theone by Rønnestad and colleagues [41] is that the experiments arecarried out on salmon at different life history stages; adult post-smolt versus juvenile parr. In both studies, the two leptin genesseem to be differentially regulated, but the tissue distribution pat-terns for the two leptin genes differ and it is likely that regulationof the leptin system is modulated by developmental stage. In juve-nile parr, as seen in the present study, liver was found to be thepredominant source of leptin expression and no expression ofeither lepa1 or lepa2 was found in the visceral adipose tissue. It ap-pears that adult salmon have several important sources of circulat-ing leptin, other than liver, such as visceral adipose tissue, bellyflap and white muscle [41]. Even though liver has been found tobe the main organ of leptin expression in a number of other teleostspecies, significant expression has also been detected in other tis-sues [21,24,26]. This does pose an interesting question of thesource of circulating leptin during different life stages in fish. Injuvenile sea bass, Dicentrarchus labrax, leptin-like immune-reactiv-ity was found in muscle, and it was proposed, that at this develop-mental stage, which lacks adipose tissue, muscle may be animportant source of leptin synthesis [18]. It can, however, be as-sumed that in the present study, liver-derived leptin reflects plas-ma levels while the low expression levels found in other tissues,such as the brain and muscle, may have a local autocrine/paracrineeffect as suggested by Rønnestad and colleagues [41]. Lepa1expression and plasma leptin levels were indeed found to bestrongly correlated for the feed-restricted fish in June, but not inthe control group. An explanation for the lack of correlation couldbe that the radioimmunoassay used to measure plasma leptin lev-els in the present study, even though designed to detect a 14-aalong sequence of the mature lepa1, may also detect the proteinproduct of the lepa2 gene and thus reflect the combined levels ofboth gene products. However, based on the relatively low numberof samples available used for the correlation analysis, further stud-ies are needed to be able to draw reliable conclusions regarding therelationship between the gene expression level and the plasmaprotein level.
Leptin receptor mRNA expression was detected in a variety oftissues in juvenile parr, including the brain. This wide gene expres-sion distribution pattern of lepr has also been observed in post-smolt Atlantic salmon [41] as well as other fish species[24,25,29], which points to diverse functions of leptin in fish. Forthe fully-fed fish, expression levels of lepr in the brain were un-changed during the first four weeks of the experiment, but by June,when growth had commenced and the fish had increased their
body fat reserves, lepr expression was significantly up-regulated.In contrast, in the feed-restricted group lepr gene expression didnot change over time. Brain lepr expression was not affected by10-month feed restriction in Atlantic salmon [41]; it is possiblethat changes in brain lepr expression occur in response to rapidrather than chronic changes in growth physiology. There are sofar limited data available on the regulation of the leptin receptorin fish and the reason for the observed up-regulation of the leptinreceptor in control, but not feed-restricted fish, is not clear. Thereis, however, evidence from mammalian models that leptin exertsnegative feedback on its receptor in the brain. In the mouse brain,lepr mRNA expression is stimulated by reduced leptin signaling [5].Increasing leptin levels, after being low, as a response to re-feedingin fasted mice were observed to cause a depression in the expres-sion and abundance of the leptin receptor in the hypothalamus[35]. This is suggested to be due to a negative feedback mechanismby the ligand, but other factors regulating receptor expression inthe brain independently of leptin may also be involved [35]. Simi-larly, Mercer et al. [33] found that increasing leptin levels in thebrain of mice after central injections led to a reduction in leprexpression in the hypothalamus. In pregnant rats, having elevatedplasma leptin levels, lepr in the brain is down-regulated; a mecha-nism suggested as desensitizing the brain to high leptin levels [19].While no down-regulation of the receptor was observed in the re-stricted feeding group that had high circulating leptin levels, theydid however not display the increase seen in the control group,possibly indicating a negative feedback of the ligand on the recep-tor. In contrast, leptin plasma levels decreased in the control groupas the season progressed and by June they were almost halvedcompared to April. It is interesting to speculate that, like in mam-mals, this could stimulate receptor expression in the brain by a de-creased negative feedback. Further studies are needed to elucidatethe significance of seasonal changes in leptin receptor expression.
In mammals, leptin signals nutritional status and high plasmalevels are associated with positive energy status [1,2]. The presentstudy further substantiated that this is not the case in teleosts andmay reflect the fundamental differences in energy homeostasisregulation in endothermic versus poikilothermic animals. No cor-relation between plasma leptin levels and condition factor wasfound, although a negative correlation between plasma leptin lev-els and body fat content was observed in the fully-fed fish in June.Similar results have been found in rainbow trout where no corre-lation between leptin levels and condition factor was observed[22] and a lack of correlation between nutritional status and hepa-tic leptin gene expression has also been seen in a short- and long-term fasting study in carp [21].
The physiological significance of increasing lepa1 expression aswell as higher leptin plasma levels in feed-restricted salmon is notclear. One of the physiological mechanisms of leptin in mammals isto mobilize and deplete stored lipids, especially in the liver, as seenin the leptin treated ob/ob mouse models [7]. This action of leptinon lipid metabolism has been also observed in goldfish treatedwith recombinant human leptin [10]. Leptin has been localizedto the parenchyma cells and bilary system in the liver of rainbowtrout using immunohistochemistry and has therefore been pro-posed to be involved in lipid metabolism in this species as wellas in other salmonids [38]. Salmonids, however, do not store largeamounts of fat in the liver, but it is the major organ for lipogenesis.Leptin may serve a function in mobilizing available muscle lipids asspeculated by Liu and colleagues [29] in their study on changes inlepr expression during early development in the zebrafish. In thisstudy, lepr in the muscle increased during the developmentalphase of exogenous feeding initiation and free swimming. An earlyfunctional study of the effects of leptin showed that peripheral re-combinant mouse leptin injection in green sunfish (Lepomis cyanellus)tends to enhance the lipid metabolism fatty acid oxidation pathway

98 S. Trombley et al. / General and Comparative Endocrinology 175 (2012) 92–99
by increasing expression of fatty acid binding proteins and enzymesinvolved in the b-oxidation pathway [30]. This could explain whyhigher leptin levels are observed in the food restricted salmon.During a period of increasing water temperature and consequentlyhigher metabolic rate, limited food availability increases the needto use dietary as well as stored lipids as energy and for mainte-nance of vital body functions, leaving little metabolic room for lipidstorage. However, a depletion of body lipids in the feed-restrictedfish could not be observed, rather a lack of fat deposition. A possibleexplanation could be that although feed was restricted there wasstill enough energy available to prevent lipid depletion.
In conclusion, the present study demonstrates that feed restric-tion causes an up-regulation of the lepa1 gene expression as wellas an increase of plasma leptin levels. The results also indicate andthat the two leptin genes are likely to be differentially regulated.The study presents for the first time evidence for a seasonal responseof the leptin receptor expression in the brain which may be due tochanges in energy balance caused by rising water temperature andincreasing metabolic rates associated with this. Further, this studyshows that in juvenile Atlantic salmon, both leptin genes are almostexclusively expressed in the liver, while the leptin receptor is widelyexpressed in peripheral tissues as well as in the brain.
Acknowledgments
The authors thank Helena Königsson (SLU, Umeå) for her techni-cal assistance. The work was supported by grants from the SwedishResearch Council for Environment, Agricultural Sciences and SpatialPlanning (221-2006-1534 to MS) and (217-2008-1258 to BThB).
References
[1] R.S. Ahima, Leptin and the neuroendocrinology of fasting, Neuroendocrinologyof Leptin 1 (2000) 42–56.
[2] R.S. Ahima, S.Y. Osei, Leptin signaling, Physiol. Behav. 81 (2004) 223–241.[3] E. Austreng, T. Storebakken, T Åsgård, Growth rate estimates for cultured
Atlantic salmon and rainbow trout, Aquaculture 60 (1987) 157–160.[4] D.M. Baker, D.A. Larsen, P. Swanson, W.W. Dickhoff, Long-term peripheral
treatment of immature Coho salmon (Oncorhynchus kisutch) with humanleptin has no clear physiologic effect, Gen. Comp. Endocrinol. 18 (2000) 134–138.
[5] D.G. Baskin, R.J. Seeley, J.L. Kuijper, S. Lok, D.S. Weigle, J.C. Erickson, R.D.Palmiter, M.W. Schwartz, Increased expression of mRNA for the long form ofthe leptin receptor in the hypothalamus is associated with leptinhypersensitivity and fasting, Diabetes 47 (1998) 538–543.
[6] I. Berglund, Growth and early sexual maturation in Baltic salmon (Salmo salar)parr, Can. J. Zool. 70 (1992) 205–211.
[7] P. Cohen, J.M. Friedman, Leptin and the control of metabolism: role forstearoyl-CoA desaturase-1 (SCD-1), J. Nutr. 134 (2004) 2455–2463.
[8] P. Cohen, M. Miyazaki, N.D. Socci, A. Hagge-Greenberg, W. Liedtke, A.A. Soukas,R. Sharma, L.C. Hudgins, J.M. Ntambi, J.M. Friedman, Role for stearoyl-CoAdesaturase-1 in leptin-mediated weight loss, Science 297 (2002) 240–243.
[9] R.A. Cunjak, T.D. Prowse, D.L. Parrish, Atlantic salmon (Salmo salar) in winter:‘‘the season of parr discontent’’?, Can J. Fish. Aquat. Sci. 55 (1998) 161–180.
[10] N. de Pedro, R. Martinez-Alvarez, M.J. Delgado, Acute and chronic leptinreduces food intake and body weight in goldfish (Carassius auratus), J.Endocrinol. 188 (2006) 513–520.
[11] W.T. Donahoo, N.R. Stob, S. Ammon, N. Levin, R.H. Eckel, Leptin increasesskeletal muscle lipoprotein lipase and postprandial lipid metabolism in mice,Metabolism 60 (2011) 438–443.
[12] P. Elvingson, L.O. Sjaunja, Determination of fat, protein and dry matter contentof fish by mid-infrared transmission spectroscopy, Aquacult. Fish. Manage. 23(1992) 453–460.
[13] C. Fernandez-Galaz, T. Fernandez-Agullo, C. Perez, S. Peralta, C. Arribas, A.Andres, J.M. Carrascosa, M. Ros, Long-term food restriction prevents ageing-associated central leptin resistance in wistar rats, Diabetologia 45 (2002) 997–1003.
[14] J.M. Friedman, Leptin at 14 y of age: an ongoing story, Am. J. Clin. Nutr. 89(2009) 973S–979S.
[15] J.M. Friedman, J.L. Halaas, Leptin and the regulation of body weight inmammals, Nature 395 (1998) 763–770.
[16] E. Frøiland, K. Murashita, E.H. Jørgensen, T. Kurokawa, Leptin and ghrelin inanadromous Arctic charr: cloning and change in expressions during a seasonalfeeding cycle, Gen. Comp. Endocrinol. 165 (2010) 136–143.
[17] N. Gallardo, E. Bonzon-Kulichenko, T. Fernandez-Agullo, E. Molto, S. Gomez-Alonso, P. Blanco, J.M. Carrascosa, M. Ros, A. Andres, Tissue-specific effects of
central leptin on the expression of genes involved in lipid metabolism in liverand white adipose tissue, Endocrinology 148 (2007) 5604–5610.
[18] C. Gambardella, S. Ferrando, L. Gallus, S. Ravera, P. Bianchini, P. Ramoino, S.Fasulo, G. Tagliafierro, Leptin-like immunoreactivity in the muscle of juvenilesea bass (Dicentrarchus labrax), Microsc. Res. Tech. 73 (2010) 797–802.
[19] M.D. Garcia, F.F. Casanueva, C. Dieguez, R.M. Senaris, Gestational profile ofleptin messenger ribonucleic acid (mRNA) content in the placenta and adiposetissue in the rat and regulation of the mRNA levels of the leptin receptorsubtypes in the hypothalamus during pregnancy and lactation, Biol. Reprod.62 (2000) 698–703.
[20] M. Gorissen, N.J. Bernier, S.B. Nabuurs, G. Flik, M.O. Huising, Two divergentleptin paralogues in zebrafish (Danio rerio) that originate early in teleosteanevolution, J. Endocrinol. 201 (2009) 329–339.
[21] M.O. Huising, E.J.W. Geven, C.P. Kruiswijk, S.B. Nabuurs, E.H. Stolte, F.A.T.Spanings, B.M.L. Verburg-Van Kemenade, G. Flik, Increased leptin expressionin common carp (Cyprinus carpio) after food intake but not after fasting orfeeding to satiation, Endocrinology 147 (2006) 5786–5797.
[22] P. Kling, I. Rønnestad, S.O. Stefansson, K. Murashita, T. Kurokawa, B.Th.Björnsson, A homologous salmonid leptin radioimmunoassay indicateselevated plasma leptin levels during fasting of rainbow trout, Gen. Comp.Endocrinol. 162 (2009) 307–312.
[23] M.D. Klok, S. Jakobsdottir, M.L. Drent, The role of leptin and ghrelin in theregulation of food intake and body weight in humans: a review, Obes. Rev 8(2007) 21–34.
[24] T. Kurokawa, K. Murashita, Genomic characterization of multiple leptin genesand a leptin receptor gene in the Japanese medaka, Oryzias latipes, Gen. Comp.Endocrinol. 161 (2009) 229–237.
[25] T. Kurokawa, K. Murashita, T. Suzuki, S. Uji, Genomic characterization andtissue distribution of leptin receptor and leptin receptor overlapping transcriptgenes in the pufferfish, Takifugu rubripes, Gen. Comp. Endocrinol. 158 (2008)108–114.
[26] T. Kurokawa, S. Uji, T. Suzuki, Identification of cDNA coding for a homologue tomammalian leptin from pufferfish, Takifugu rubripes, Peptides 26 (2005) 745–750.
[27] S. Larsson, I. Berglund, Thermal performance of juvenile Atlantic salmon(Salmo salar L.) of Baltic Sea origin, J. Therm. Biol. 31 (2006) 243–246.
[28] G.G. Li, X.F. Liang, Q.L. Xie, G.Z. Li, Y. Yu, K.S. Lai, Gene structure, recombinantexpression and functional characterization of grass carp leptin, Gen. Comp.Endocrinol. 166 (2010) 117–127.
[29] Q. Liu, Y. Chen, D. Copeland, H. Ball, R.J. Duff, B. Rockich, R.L. Londraville,Expression of leptin receptor gene in developing and adult zebrafish, Gen.Comp. Endocrinol. 166 (2010) 346–355.
[30] R.L. Londraville, C.S. Duvall, Murine leptin injections increase intracellularfatty acid-binding protein in green sunfish (Lepomis cyanellus), Gen. Comp.Endocrinol. 129 (2002) 56–62.
[31] M. Maffei, J. Halaas, E. Ravussin, R.E. Pratley, G.H. Lee, Y. Zhang, H. Fei, S. Kim, R.Lallone, S. Ranganathan, P.A. Kern, J.M. Friedman, Leptin levels in human androdent - measurement of plasma leptin and ob RNA in obese and weightreduced subjects, Nature Medicine 1 (1995) 1155–1161.
[32] S. Margetic, C. Gazzola, G.G. Pegg, R.A. Hill, Leptin: a review of its peripheralactions and interactions, Int. J. Obes. 26 (2002) 1407–1433.
[33] J.G. Mercer, K.M. Moar, D.V. Rayner, P. Trayhurn, N. Hoggard, Regulation ofleptin receptor and NPY gene expression in hypothalamus of leptin-treatedobese (ob/ob) and cold-exposed lean mice, FEBS Lett. 402 (1997) 185–188.
[34] N.B. Metcalfe, J.E. Thorpe, Anorexia and defended energy levels in over-wintering juvenile salmon, J. Anim. Ecol. 61 (1992) 175–181.
[35] S.E. Mitchell, R. Nogueiras, A. Morris, S. Tovar, C. Grant, M. Cruickshank, D.V.Rayner, C. Dieguez, L.M. Williams, Leptin receptor gene expression andnumber in the brain are regulated by leptin level and nutritional status, J.Physiol. 587 (2009) 3573–3585.
[36] K. Murashita, A.E.O. Jordal, T.O. Nilsen, S.O. Stefansson, T. Kurokawa, B.Th.Björnsson, A.G.G. Moen, I. Rønnestad, Leptin reduces Atlantic salmon growththrough the central pro-opiomelanocortin pathway, Comp. Biochem. Physiol.,Part A: Mol. Integr. Physiol. 158 (2011) 79–86.
[37] K. Murashita, S. Uji, T. Yamamoto, I. Rønnestad, T. Kurokawa, Production ofrecombinant leptin and its effects on food intake in rainbow trout(Oncorhynchus mykiss), Comp. Biochem. Physiol., Part B: Biochem. Mol. Biol.150 (2008) 377–384.
[38] B. Pfundt, H. Sauerwein, M. Mielenz, Leptin mRNA and proteinimmunoreactivity in adipose tissue and liver of rainbow trout (Oncorhynchusmykiss) and immunohistochemical localization in liver, Anat. Histol. Embryol.38 (2009) 406–410.
[39] S.A. Robertson, G.M. Leinninger, M.G. Myers, Molecular and neural mediatorsof leptin action, Physiol. Behav. 94 (2008) 637–642.
[40] S. Rosen, H.J. Skaletsky, Primer2 on the WWW for general users and forbiologist programmers, Bioinformatics, Methods and Protocols: Methods inMolecular Biology, Humana Press, Totowa, New Jersey, 2000. pp. 365–386.
[41] I. Rønnestad, T.O. Nilsen, K. Murashita, A.R. Angotzi, A.G.G. Moen, S.O.Stefansson, P. Kling, B.Th. Björnsson, T. Kurokawa, Leptin and leptin receptorgenes in Atlantic salmon: cloning, phylogeny, tissue distribution andexpression correlated to long-term feeding status, Gen. Comp. Endocrinol.168 (2010) 55–70.
[42] R. Saladin, P. Devos, M. Guerremillo, A. Leturque, J. Girard, B. Staels, J. Auwerx,Transient increase in obese gene expression after food intake or insulinadministration, Nature 377 (1995) 527–529.
[43] T. Silverstein, E.M. Plisetskaya, The effects of NPY and insulin on food intakeregulation in fish, Amer. Zool. 40 (2000) 296–308.

S. Trombley et al. / General and Comparative Endocrinology 175 (2012) 92–99 99
[44] L.A. Tartaglia, The leptin receptor, J. Biol. Chem. 272 (1997) 6093–6096.[45] H. Volkoff, A.J. Eykelbosh, R.E. Peter, Role of leptin in the control of feeding of
goldfish Carassius auratus: interactions with cholecystokinin, neuropeptide Yand orexin A, and modulation by fasting, Brain Res. 972 (2003) 90–109.
[46] D.S. Weigle, P.B. Duell, W.E. Connor, R.A. Steiner, M.R. Soules, J.L. Kuijper, Effectof fasting, refeeding, and dietary fat restriction on plasma leptin levels, J. Clin.Endocrinol. Metab. 82 (1997) 561–565.
[47] M.M.L. Wong, R.M.K. Yu, P.K.S. Ng, S.H.W. Law, A.K.C. Tsang, R.Y.C. Kong,Characterization of a hypoxia-responsive leptin receptor (omLepR(L)) cDNAfrom the marine medaka (Oryzias melastigma), Mar. Pollut. Bull. 54 (2007)797–803.
[48] Y.Y. Zhang, R. Proenca, M. Maffei, M. Barone, L. Leopold, J.M. Friedman,Positional cloning of the mouse obese gene and its human homolog, Nature372 (1994) 425–432.