Heat stress downregulates FLIP and sensitizes cells to Fas receptor-mediated apoptosis
Upload
independentCategory
view
3download
0
Hindawi Publishing CorporationMediators of InflammationVolume 2010, Article ID 784343, 15 pagesdoi:10.1155/2010/784343
Research Article
Leptin Administration Downregulates the Increased ExpressionLevels of Genes Related to Oxidative Stress and Inflammation inthe Skeletal Muscle of ob/ob Mice
Neira Sainz,1, 2 Amaia Rodrıguez,1, 2 Victoria Catalan,1, 2 Sara Becerril,1, 2 Beatriz Ramırez,1, 2
Javier Gomez-Ambrosi,1, 2 and Gema Fruhbeck1, 2, 3
1 Metabolic Research Laboratory, Clınica Universidad de Navarra 3, 31008 Pamplona, Spain2 CIBER Fisiopatologıa de la Obesidad y Nutricion (CIBEROBN), Instituto de Salud Carlos III, Spain3 Department of Endocrinology, Clınica Universidad de Navarra, Pıo XII 36, 31008 Pamplona, Spain
Correspondence should be addressed to Gema Fruhbeck, [email protected]
Received 21 January 2010; Revised 31 March 2010; Accepted 24 April 2010
Academic Editor: Giamila Fantuzzi
Copyright © 2010 Neira Sainz et al. This is an open access article distributed under the Creative Commons Attribution License,which permits unrestricted use, distribution, and reproduction in any medium, provided the original work is properly cited.
Obese leptin-deficient ob/ob mice exhibit a low-grade chronic inflammation together with a low muscle mass. Our aim was toanalyze the changes in muscle expression levels of genes related to oxidative stress and inflammatory responses in leptin deficiencyand to identify the effect of in vivo leptin administration. Ob/ob mice were divided in three groups as follows: control ob/ob, leptin-treated ob/ob (1 mg/kg/d) and leptin pair-fed ob/ob mice. Gastrocnemius weight was lower in control ob/ob than in wild type mice(P < .01) exhibiting an increase after leptin treatment compared to control and pair-fed (P < .01) ob/ob animals. Thiobarbituricacid reactive substances, markers of oxidative stress, were higher in serum (P < .01) and gastrocnemius (P = .05) of control ob/obthan in wild type mice and were significantly decreased (P < .01) by leptin treatment. Leptin deficiency altered the expressionof 1,546 genes, while leptin treatment modified the regulation of 1,127 genes with 86 of them being involved in oxidative stress,immune defense and inflammatory response. Leptin administration decreased the high expression of Crybb1, Hspb3, Hspb7, Mt4,Cat, Rbm9, Serpinc1 and Serpinb1a observed in control ob/ob mice, indicating that it improves inflammation and muscle loss.
1. Introduction
Obesity is associated with a low-grade proinflammatory stateresulting in an increase of circulating cytokines and inflam-matory markers [1]. Inflammatory cytokines have beeninvolved in the impairment of insulin signaling, thus provid-ing molecular links between inflammation and insulin resis-tance [2]. Inflammation reportedly produces metabolic alter-ations in skeletal muscle with both inflammatory responseand insulin resistance being associated with loss of musclemass by decreased protein synthesis and increased proteolysis[3–5]. Recently, our group has shown that leptin reversesmuscle loss of ob/ob mice by inhibiting the activity of thetranscriptional factor forkhead box class O3a (FoxO3a) [6].
Leptin is an adipocyte-derived peptidic hormone [7] thatinhibits food intake and increases thermogenesis by actingthrough its hypothalamic receptors [8, 9]. Leptin-deficientob/ob mice are obese, hyperphagic, exhibit type 2 diabetes,
decreased body temperature and hypogonadotropic hypog-onadism [10]. Leptin is a member of the long-chain helicalcytokine family and its receptors, which belong to the class Icytokine receptors, are present in bone marrow and spleen aswell as on peripheral monocytes and lymphocytes [1]. Leptinincreases in response to acute infection and sepsis and it hasbeen reported to exert a profound influence on the functionand proliferation of T lymphocytes and natural killer cells[11], on the phagocytosis of macrophages/monocytes [12],and to have a direct effect on the secretion of anti- andproinflammatory cytokines [13]. In this regard, impairedcellular and humoral immunity have been shown in leptin-deficient ob/ob mice as well as in leptin receptor-deficientdb/db mice [14, 15]. These studies reflect the molecularnature of leptin as a cytokine and are consistent with leptinsignaling playing a pivotal role in the pathogenesis of obesity-associated inflammation and muscle loss.
2 Mediators of Inflammation
In the present paper, gastrocnemius muscle samplesfrom wild type and ob/ob mice were analyzed for mRNApresence of over 41,000 transcripts by microarray analysisto identify genes involved in inflammation and oxidativestress that are affected by leptin deficiency and leptinadministration in ob/ob mice. It was shown that leptinincreases the gastrocnemius weight and reduces the highexpression levels of genes related to the obesity-associatedlow-grade inflammation in skeletal muscle of ob/ob mice.
2. Material and Methods
2.1. Animals and Treatments. Ten-week-old male geneticallyobese ob/ob mice (C57BL/6J) (n = 15) and their leancontrol littermates wild type (n = 5) supplied by Harlan(Barcelona, Spain) were housed in a room with controlledtemperature (22±2◦C) and a 12:12 light-dark cycle (lights onat 08:00 am). Body weight of ob/ob mice was measured beforerandomization into control, leptin-treated (1 mg/kg/d) andpair-fed groups (n = 5 per group). The control and pair-fedgroups received vehicle (PBS), while leptin-treated mice wereintraperitoneally administered with leptin (Bachem, Buben-dorf, Switzerland) twice daily at 08:00 am and 08:00 pm for28 days. Control and leptin-treated groups were providedwith water and food ad libitum with a standard rodent chow(2014S Teklad, Harlan), while daily food intake of the pair-fed group was matched to the amount consumed by theleptin-treated group the day before in order to discriminatethe inhibitory effect of leptin on appetite. Animals weresacrificed on the 28th day of treatment by CO2 inhalation20 hours after the last PBS or leptin administration (in orderto avoid picking up effects reflecting an acute response) andafter 8 hours of fasting. Serum samples and gastrocnemiusmuscles were obtained and stored at−80◦C. All experimentalprocedures conformed to the European Guidelines for theCare and Use of Laboratory Animals (directive 86/609)and were approved by the Ethical Committee for AnimalExperimentation of the University of Navarra (080/05).
2.2. Blood Analysis. Serum glucose was analyzed using asensitive-automatic glucose sensor (Ascensia Elite, Bayer,Barcelona, Spain). Free fatty acid (FFA) concentrations weremeasured by a colorimetric determination using the NEFAC kit (WAKO Chemicals, Neuss, Germany). Serum glycerolconcentrations were evaluated by enzymatic methods aspreviously described [6]. Serum triglycerides (TG) con-centrations were spectrophotometrically determined usinga commercial kit (Infinity, Thermo Electron, Melbourne,Australia). Insulin and leptin were determined using spe-cific mouse ELISA kits (Crystal Chem Inc., Chicago, IL,USA). Intra- and interassay coefficients of variation formeasurements of insulin and leptin were 3.5% and 6.3%,respectively, for the former, and 2.8% and 5.8%, for thelatter. Adiponectin concentrations were also assessed usinga mouse ELISA kit (BioVendor Laboratory Medicine, Inc.,Modrice, Czech Republic). Intra- and interassay coefficientsof variation for adiponectin were 2.6% and 5.3%, respec-tively. Insulin resistance was calculated using the homeostasis
model assessment score (HOMA; fasting insulin (μU/mL)× fasting glucose (mmol/L)/22.5) [16]. An indirect measureof insulin sensitivity was calculated by using the quantita-tive insulin sensitivity check index (QUICKI; 1/[log(fastinginsulin mU/mL) + log(fasting glucose mg/dL)] [17].
Lipid peroxidation was analyzed by the measurement ofthiobarbituric acid reactive substances (TBARS) in serumand gastrocnemius as previously described by Conti etal. [18] with some modifications. Since the best-knownspecific TBARS is malondialdehyde (MDA), we used serumMDA levels, a secondary product of lipid peroxidation,as an indicator of lipid peroxidation and oxidative stress.Gastrocnemius samples (20–30 mg) were homogenized in20 volumes of phosphate buffer pH 7.4. Serum, musclehomogenates (5 μL) or standard (MDA) were mixed with120 μL of diethyl thiobarbituric acid (DETBA) 10 mM andvortexed for 5 seconds. The reaction mixture was thenincubated at 95◦C for 60 minutes. After cooling to roomtemperature DETBA-MDA adducts were extracted in 360 μLn-butanol vortexing for 1 minute and centrifuged at 1,600 gfor 10 minutes at room temperature. Then, the chromophoreof the DETBA-MDA adduct was quantified in 200 μL of theupper butanol phase by fluorescence emission at 535 nmwith an excitation at 590 nm. MDA equivalents (TBARS)were quantified using a calibration curve prepared usingMDA standard working solutions and expressed as serumMDA μM and gastrocnemius MDA μM/mg protein. Proteinconcentrations were determined using a Bradford proteinassay kit (BioRad, Hercules, CA, USA).
2.3. Microarray Experiments and Analysis. Total RNA wasextracted from 20–30 mg of gastrocnemius muscle samplesby homogenization with an ULTRA-TURRAX T 25 basic(IKA Werke GmbH, Staufen, Germany) using TRIzol reagent(Invitrogen, Barcelona, Spain). RNA was purified using theRNeasy Mini kit (Qiagen, Barcelona, Spain) and treated withDNase I (RNase-free DNase Set, Qiagen) in order to removeany trace of genomic DNA.
Gene expression analyses were conducted using theAgilent Whole Mouse Genome array (G4121B, AgilentTechnologies, Santa Clara, CA, USA) containing ∼41, 000mouse genes and transcripts. Fluorescence-labeled cDNAprobes were prepared from 1 μg of total RNA from eachsample (5 animals per group) to be subsequently amino-allyl labeled and amplified using the Amino Allyl Mes-sageAmp II aRNA Amplification Kit (Ambion, Austin, TX,USA). Aliquots (1.2 μg) of amplified aRNA were fluo-rescently labeled using Cy3/Cy5 (Amersham Biosciences,Buckinghamshire, UK) and then appropriately combinedand hybridized to Agilent microarrays. Hybridizations wereperformed following a reference design, where controlsamples were pools of RNA from all individual samples.Two hybridizations with fluor reversal (Dye-swap) wereperformed for each sample. After washing, microarray slideswere scanned using a Gene Pix 4100A scanner (AxonInstruments, Union City, CA, USA) and image quantizationwas performed using the software GenePiX Pro 6.0. Geneexpression data for all replicate experiments were analyzedusing the GeneSpring GX software version 7.3.1 (Agilent
Mediators of Inflammation 3
Table 1: Sequences of the primers and Taqman probes used in the Real-Time PCR.
Gene Gene Symbol GenBank Oligonucleotide sequence (5′-3′)
accesion number
Peroxisomeproliferator-activatedreceptor-γ coactivator-1α
Pgc1a NM 008904 Forward: GTCTGAAAGGGCCAAACAGAGA
Reverse: TCAATTCTGTCCGCGTTGTG
Probe: FAM-AGCAGAAAGCAATTGAAGAGCGCCGT-TAMRA
Forkhead box O1 Foxo1 NM 019739 Forward: GCGGGCTGGAAGAATTCAAT
Reverse: TCCTTCATTCTGCACTCGAATAAACT
Probe: FAM-CGCCACAATCTGTCCCTTCACA-TAMRA
Muscle atrophy F box MAFbx NM 026346 Forward: CCATCCTGGATTCCAGAAGATTC
Reverse: TCAGGGATGTGAGCTGTGACTTT
Probe: FAM-CTACGTAGTAAGGCTGTTGGAGCTGAT-TAMRA
Muscle RING finger 1 MuRF1 NM 001039048 Forward: CGCCATGAAGTGATCATGGA
Reverse: TCCTTGGAAGATGCTTTGCA
Probe: FAM-TGTACGGCCTGCAGAGGAACCTGAAA-TAMRA
Technologies). Clustering was accomplished with the Geneand Condition Tree algorithms. In addition, Gene Ontologydatabase (http://babelomics.bioinfo.cipf.es) and the KEGGwebsite (http://www.genome.ad.jp/kegg/pathway) were usedin conjunction with GeneSpring (http://www.agilent.com/ch-em/genespring) to identify pathways and functional groupsof genes. All microarray data reported are described in ac-cordance with MIAME guidelines (http://www.mged.org/Workgroups/MIAME/miame.html). More information rega-rding the microarray experiments can be found at theEMBL-European Bioinformatics Institute (http://www.ebi.ac.uk/aerep/login. ArrayExpress accession number: E-MEXP-1831). To validate the microarray data, a number of repre-sentative differentially expressed genes were selected to beindividually studied by Real-Time PCR (7300 Real TimePCR System, Applied Biosystems, Foster City, CA, USA)(n = 5 per group) as previously described [19]. Primers andprobes were designed using the software Primer Express 2.0(Applied Biosystems) and purchased from Genosys (Sigma,Madrid, Spain) (Table 1).
2.4. Statistical Analysis. Data are expressed as mean ±standard error of the mean (SEM). Differences betweengroups were assessed by Kruskal-Wallis followed by MannWhitney’s U test. As previously outlined, Gene Ontologygroupings were used to identify pathways significantlyaffected by leptin deficiency as opposed to its administration.Furthermore, statistical comparisons for microarray data toidentify differentially expressed genes across different groupswere performed using one-way ANOVA and Student’s t-testsas appropriate. Spearman’s correlations were used to evaluatethe relations among different variables. All statistical analyseswere performed by using the SPSS statistical program version
15.0 for Windows (SPSS, Chicago, IL, USA) and statisticalsignificance was defined as P < .05.
3. Results
3.1. Leptin Treatment Improves the Metabolic Profile of ob/obMice. The morphological and biochemical characteristicsof wild type and ob/ob mice are reported in Table 2. Asexpected, leptin treatment corrected the obese and diabeticphenotype of ob/ob mice. Body weight was significantlyhigher (P < .01) in the control ob/ob group as comparedto wild type mice. Leptin-treated mice exhibited a decreasedbody weight (P < .01) as compared to control and pair-fed ob/ob animals. Importantly, leptin treatment normalizedbody weight of ob/ob mice as compared to wild type (P =.690). In addition, the gastrocnemius of control ob/ob miceexhibited a lower (P < .01) muscle weight than that ofwild type mice and it was increased (P < .01) by leptinadministration in comparison with that of control and pair-fed ob/ob rodents. As depicted in Table 2, higher fastingglucose (P < .05) and insulin (P < .01) concentrationswere observed in the control ob/ob mice compared to wildtypes. Although no differences in glucose concentrationswere observed in pair-fed as compared to leptin-treated ob/obmice, higher serum insulin concentrations (P < .05) weredetected in the pair-fed animals than in the leptin-treatedob/ob group. Furthermore, leptin administration normalizedboth the glucose and insulin levels in ob/ob mice compared towild types. These data suggest that leptin increases the insulinsensitivity in peripheral tissues, as evidenced by the lowerHOMA and higher QUICKI indices (P < .01) in the leptin-treated in comparison with the control ob/ob animals. Serumglycerol was markedly increased (P < .05) in the controlob/ob mice, while FFA and TG levels remained unchanged

4 Mediators of Inflammation
Table 2: Total body and skeletal muscle weights and biochemical characteristics of wild type and ob/ob mice.
wild type control ob/ob pair-fed ob/ob leptin-treated ob/ob
Body weight (g) 25.6± 0.3 47.8± 4.9b 35.7± 0.7 24.7± 1.2d,f
Gastrocnemius (mg) 142.9± 3.4 90.7± 10.0b 68.5± 1.6 104.9± 2.6b,f
Gastrocnemius (mg/g) 5.59± 0.12 1.91± 0.11b 1.92± 0.07 4.28± 0.15b,d,f
Glucose (mg/dL) 149± 42 430± 59a 160± 24d 178± 29d
FFA (mmol/L) 1.62± 0.49 1.61± 0.30 1.65± 0.12 0.78± 0.13c,f
Glycerol (mmol/L) 42.8± 6.7 81.6± 19.6a 39.6± 4.9c 12.3± 4.7a,d,f
TG (mg/dL) 122± 18 169± 32 151± 10 86± 17e
Insulin (ng/mL) 0.42± 0.09 8.60± 1.51b 2.40± 0.68c 0.47± 0.09d,e
Adiponectin (μg/mL) 30.2± 3.0 28.3± 5.4 39.1± 1.8 40.2± 3.0
Leptin (ng/mL) 1.36± 0.42 UD UD 3.48± 1.02
HOMA 4.3± 1.8 202.4± 33.8b 25.8± 10.4d 5.12± 1.1d
QUICKI 0.333± 0.023 0.205± 0.003b 0.263± 0.015d 0.311± 0.016d
Data are mean±SEM (n = 5 per group). Differences between groups were analyzed by Kruskal-Wallis followed by Mann Whitney’s U test. aP < .05 and bP <.01versus wild type. cP < .05 and dP < .01 versus ob/ob. eP < .05 and fP < .01 versus pair-fed ob/ob. FFA: free fatty acids. TG: triglycerides. UD: undetectable.HOMA: homeostasis model assessment. QUICKI: quantitative insulin sensitivity check index.
0
1
2
3
4
5
TB
AR
S(M
DAμ
M) 6
7
8
∗∗ ∗∗∗∗
∗
Wild typeControl ob/ob
Pair-fed ob/obLeptin-treated ob/ob
(a)
0
10
20
30
40
TB
AR
S(M
DAμ
M/m
gpr
ot)
50
∗∗∗
Wild typeControl ob/ob
Pair-fed ob/obLeptin-treated ob/ob
(b)
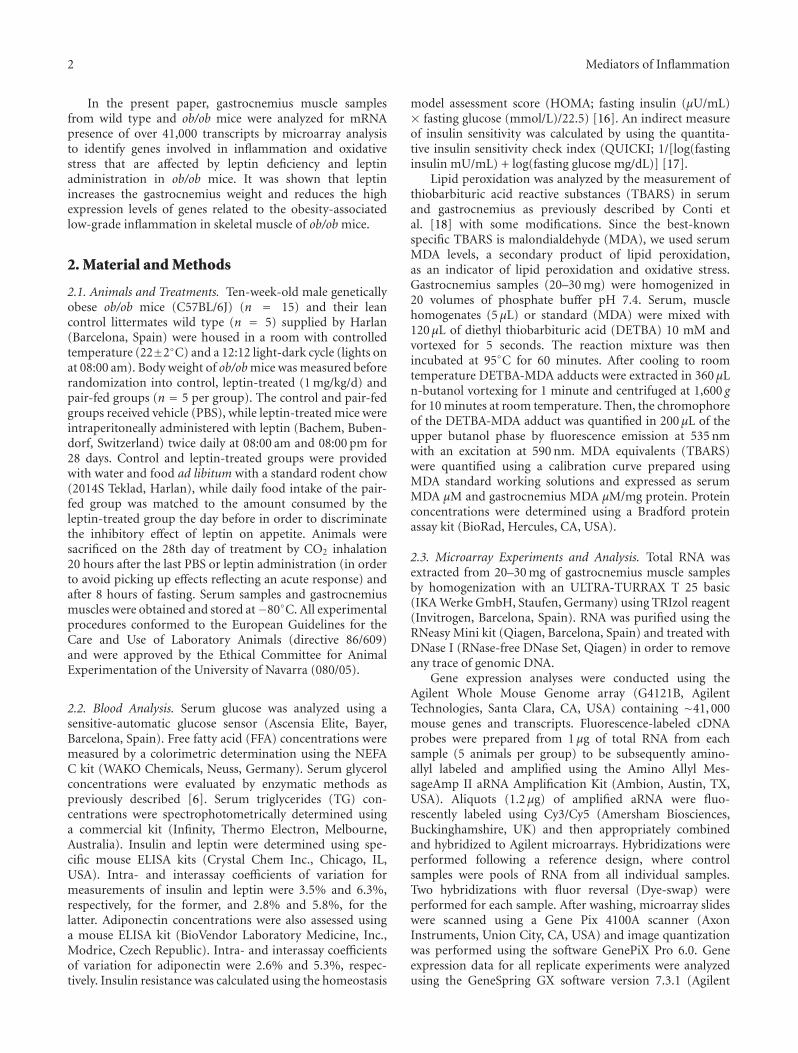
Figure 1: Leptin reduces TBARS concentrations in ob/ob mice. Thiobarbituric acid reactive substances (TBARS) presented as concentrationsof malondialdehyde (MDA μM) in serum (a) and gastrocnemius muscle (MDA μM/mg prot) (b) of wild type (open), control ob/ob (closed),pair-fed ob/ob (gray) and leptin-treated ob/ob (striped) mice (n = 5 per group). Data are expressed as mean± SEM. ∗P < .05 and ∗∗P < .01by Kruskal-Wallis followed by Mann Whitney’s U test.
as compared to wild type mice. Interestingly, leptin notonly decreased circulating concentrations of FFA (P < .05)and glycerol (P < .01) levels as compared to control ob/obmice, but also FFA (P < .01), glycerol (P < .01) and TG(P < .05) concentrations as compared to pair-fed mice.Leptin administration to ob/ob mice reduced serum glycerolconcentrations (P = .032) and tended to decrease FFA(P = .095) as compared to wild types. Furthermore, leptintreatment increased the low concentrations of adiponectinof ob/ob mice, but the differences fell out of statisticalsignificance (P = .095).
Control ob/ob mice exhibited significantly higherserum TBARS than wild type littermates (P < .01), whichwere significantly reduced after leptin administration ascompared to the control (P < .01) and pair-fed (P < .05)ob/ob groups (Figure 1(a)). In addition, leptin decreased
(P < .01) the high concentrations of MDA measured inthe gastrocnemius muscle of control ob/ob mice, while thiseffect was not observed in the pair-fed group (Figure 1(b)).Serum and gastrocnemius TBARS levels were positivelyassociated with body weight, FFA, insulin, and the HOMAindex. Oppositely, TBARS levels were negatively associatedwith adiponectin and the QUICKI index both in serum andmuscle. Importantly, a high positive relation were foundbetween serum and gastrocnemius concentrations of TBARS(ρ = 0.63, P = .003) (Table 3).
3.2. Leptin Induces Changes in Gene Expression—Effect ofLeptin on Genes Invoved in Oxidative Stress and Inflammation.Differential gene expression profiles in gastrocnemius muscleof wild type and ob/ob groups were compared by microarrayanalysis. Only genes whose mRNA levels were changed

Mediators of Inflammation 5
Table 3: Bivariate analysis of the correlations between TBARSconcentrations in serum and the gastrocnemius muscle withanthropometric and biochemical variables in wild type and ob/obmice.
Serum TBARS Gastrocnemius TBARS
ρ P ρ P
Body weight 0.57 .009 0.46 .040
Glucose 0.44 .055 0.38 .103
FFA 0.54 .015 0.59 .007
Glycerol 0.49 <.001 0.44 .053
TG 0.44 .054 0.44 .050
Insulin 0.49 .027 0.52 .020
Adiponectin −0.51 .022 −0.53 .016
QUICKI −0.48 .031 −0.48 .033
HOMA 0.53 .019 0.51 .025
Values are Spearman’s correlation coefficients (ρ) and associated P values.TBARS: thiobarbituric acid reactive substances. FFA: free fatty acids. TG:triglycerides. HOMA: homeostasis model assessment. QUICKI: quantita-tive insulin sensitivity check index.
1.5-fold or higher and identified as significantly changed bystatistical analysis were designated as differentially expressedgenes. Applying these criteria, microarray data showed that7,582 genes were differentially expressed by leptin deficiencyand leptin administration in ob/ob mice. In particular, leptindeficiency altered the expression of 1,127 genes between wildtype and control ob/ob mice. Of these, 580 were upregulatedand 547 were downregulated in ob/ob mice. Leptin treatmentmodified the expression of 1,546 genes in ob/ob mice,upregulating 512 and repressing 1,034. In addition, leptinrepressed 736 genes that were upregulated in gastrocnemiusmuscle of control ob/ob and increased the transcript levelsof 846 downregulated genes. Functional enrichment analysisusing GeneOntology and KEGG databases revealed that theset of genes with altered expression levels induced by leptindeficiency and administration represents a broad spectrumof biological processes. However, for the purpose of thepresent paper we focused on the effects of leptin on the setof genes encoding proteins involved in oxidative stress andinflammation. Table 4 shows that leptin deficiency and leptinadministration altered the expression of a large numberof genes involved in oxidative stress and inflammation.The biological processes mainly affected between controlob/ob mice and wild types included “response to oxidativestress” (P = .0006), “response to stress” (P = .0031)and “acute-phase response” (P = .023). Furthermore,several processes regulating proliferation, differentiation,and activity of lymphocytes were also significantly affected byleptin deficiency. Importantly, comparison of leptin-treatedand control ob/ob groups showed that leptin administrationaltered the expression of genes implicated in the “positiveregulation of lymphocyte activation” (P = .0003), “positiveregulation of immune response” (P = .0032) and “responseto stress” (P = .0187), as well as genes involved in the“chaperone cofactor dependent protein folding” (P = .0023).
Noteworthy, leptin reduced the expression of severalgenes related to inflammatory conditions. DNA microarray
analysis showed that 86 genes encoding proteins related todefense, stress, and inflammatory responses were alteredin the gastrocnemius muscle of control ob/ob mice andmodified by leptin administration. Leptin reduced themRNA levels of various isoforms of the family of heat shockproteins (HSPs) (Dnajc16, Dnaja4, Dnajb4, Hspa2, Hspa4,and Hspb7), metallothioneins (Mt2, Mt4), crystallins (Cryab,Crybb1) and RNA binding proteins (RBMs) (Rbm9, Rbm22)in ob/ob mice (Table 5). In addition, histocompatibility 2,complement component factor B H2-Bf and several genesof the acute-phase response or inflammatory processes, suchas kallikrein 5 (Klk5), and serine (or cysteine) proteinaseinhibitor clade C member 1 (Serpinc1) and clade B member1a (Serpinb1a), displayed an increased expression in ob/obmice that was reduced by leptin administration. On thecontrary, gene expression of Cryl1, Hsp105, Rbm5, andH2-Aa were enhanced in ob/ob mice after treated withleptin. Pair-feeding, which accounts for the decrease in foodintake that is independent of the direct action of leptin,altered the expression of 1,960 genes, upregulating 984 whiledownregulating 976 genes. In the context of a food intakereduction as compared to the simple effect due to the caloricrestriction, leptin administration further significantly alteredthe expression of genes involved in processes encompassing“immune response” (P = 5.53e−8) “defense response” (P =3.83e−6), “response to oxidative stress” (P = 2.99e−5),“positive regulation of T cell activation” (P = .0003) and“positive regulation of immune cell mediated cytotoxicity”(P = .0004) (Table 4). In particular, the gene array analysisprovided evidence for elevated Hspa4, Mt4, Crybb1, and Ser-pinb8 mRNA levels in the pair-fed group as compared to theleptin-treated ob/ob mice (Table 6). On the contrary, leptinincreased the gene expression of H2-Ab1 and H2-Eb1 in ob/obmice. To confirm the microarray data, the mRNA expressionof several representative transcripts was analyzed by Real-Time PCR (Figure 2). In this sense, leptin administrationreduced the mRNA levels of the muscle atrophy-relatedtranscription factor forkhead box O1 (Foxo1) and of the E3ubiquitin-ligases muscle atrophy F-box (MAFbx) and muscleRING finger 1 (MuRF1) in leptin-treated ob/ob mice, whileno effect of leptin was evidenced on the mRNA levels of thetranscriptional coactivator peroxisome proliferator-activatedreceptor-γ coactivator-1α (Pgc1 α). The expression of theselected genes was concordant with that of the microarray.
4. Discussion
Obesity is accompanied by a chronic proinflammatory stateassociated not only with insulin resistance, but also withmuscular atrophy [4, 5]. Our study provides evidence thatleptin constitutes a negative regulator of oxidative stress andinflammation in the gastrocnemius, which is a representativeskeletal muscle of the whole skeletal musculature. Thisstatement is supported by findings reported herein: (a) leptindeficiency is accompanied by systemic and skeletal muscleoxidative stress, muscle inflammation, and reduced musclemass; (b) systemic and skeletal muscle oxidative stress,muscle atrophy and inflammation of ob/ob mice are reversed

6 Mediators of Inflammation
Table 4: Biological processes according to Gene Ontology (GO) and number of genes altered by leptin deficiency, leptin administration, andpair-feeding in the gastrocnemius muscle of wild type and ob/ob mice.
Category Genes in Categorywild type vs ob/ob ob/ob vs leptin leptin vs pair-fed
Altered genes P value Altered genes P value Altered genes P value
GO:6950: response to stress 1156 61 .00314 69 .0187 22 .0757
GO:6952: defense response 1010 43 .182 47 .510 33 3.83e−6
GO:6955: immune response 835 36 .186 45 .165 33 5.53e−8
GO:45321: immune cellactivation
230 9 .475 13 .270 6 .0974
GO:46649: lymphocyteactivation
208 9 .359 13 .170 6 .0673
GO:6954: inflammatoryresponse
199 4 .938 4 .984 2 .7590
GO:50776: regulation ofimmune response
148 9 .097 12 .0426 8 .00102
GO:6959: humoral immuneresponse
123 7 .169 8 .211 4 .0891
GO:42110: T cell activation 112 5 .396 7 .263 5 .0191
GO:30098: lymphocytedifferentiation
107 8 .0441 8 .123 4 .0597
GO:42113: B cell activation 101 3 .724 7 .188 3 .1610
GO:6800: oxygen and reactiveoxygen species metabolism
92 11 .00056 7 .135 7 .00027
GO:50778: positive regulationof immune response
91 7 .0508 11 .0032 8 3.6e−5
GO:51249: regulation oflymphocyte activation
89 7 .046 10 .00808 5 .0076
GO:19882: antigenpresentation
81 9 .0029 9 .0125 8 1.53e−5
GO:31098: stress-activatedprotein kinase signalingpathway
80 8 .00921 5 .313 1 .6690
GO:30333: antigen processing 78 11 .00013 13 5.65e−5 8 1.16e−5
GO:7254: JNK cascade 75 8 .00629 4 .461 1 .6450
GO:46651: lymphocyteproliferation
67 2 .712 5 .199 2 .2340
GO:6979: response tooxidative stress
65 9 .0006 7 .0303 7 2.99e−5
GO:50863: regulation of T cellactivation
62 5 .0779 6 .0667 5 .0016
GO:7249: I-kappaBkinase/NF-kappaB cascade
61 2 .663 3 .542 3 .0512
GO:51251: positive regulationof lymphocyte activation
58 6 .0196 10 .0003 5 .00118
GO:30217: T celldifferentiation
54 5 .0481 6 .0380 4 .00638
GO:9266: response totemperature stimulus
54 12 4.78e−7 13 7.96e−7 1 .5260
GO:30183: B celldifferentiation
50 2 .554 3 .410 2 .1500
GO:50670: regulation oflymphocyte proliferation
46 2 .509 3 .360 1 .4700
GO:50864: regulation of B cellactivation
46 2 .509 5 .0606 2 .1310
GO:42087: cell-mediatedimmune response
44 1 .809 1 .876 2 .1220

Mediators of Inflammation 7
Table 4: Continued.
Category Genes in Categorywild type vs ob/ob ob/ob vs leptin leptin vs pair-fed
Altered genes P value Altered genes P value Altered genes P value
GO:50777: negative regulationof immune response
43 3 .210 2 .599 1 .4480
GO:50870: positive regulationof T cell activation
43 5 .0203 6 .0137 5 .000294
GO:42088: T-helper 1 typeimmune response
41 1 .786 1 .857 2 .1080
GO:9408: response to heat 40 9 1.17e−5 12 1.54e−7 1 .4240
GO:45619: regulation oflymphocyte differentiation
36 6 .00186 5 .0242 4 .00144
GO:42100: B cell proliferation 32 1 .699 5 .0150 2 .0709
GO:19884: antigenpresentation, exogenousantigen
31 9 1.17e−6 9 7.62e−6 8 6.81e−9
GO:50851: antigenreceptor-mediated signalingpathway
30 1 .676 3 .160 1 .3390
GO:50871: positive regulationof B cell activation
30 1 .676 5 .0115 2 .0633
GO:51250: negative regulationof lymphocyte activation
30 2 .304 1 .759 1 .3390
GO:50671: positive regulationof lymphocyte proliferation
29 2 .290 3 .149 1 .3300
GO:1909: immune cellmediated cytotoxicity
27 2 .262 2 .358 3 .00584
GO:45580: regulation of T celldifferentiation
26 5 .00232 5 .00617 4 .00041
GO:30888: regulation of B cellproliferation
24 1 .594 3 .0975 1 .2820
GO:45621: positive regulationof lymphocyte differentiation
22 4 .00788 5 .00288 3 .00323
GO:19886: antigen processing,exogenous antigen via MHCclass II
21 9 2.37e−8 8 2.45e−6 8 1.98e−10
GO:45058: T cell selection 20 2 .167 1 .613 3 .00244
GO:50868: negative regulationof T cell activation
20 1 .528 1 .613 1 .2410
G O:42591: antigenpresentation, exogenousantigen via MHC class II
19 6 4.42e−5 6 .000157 6 1.47e−7
GO:45582: positive regulationof T cell differentiation
19 4 .00456 5 .00143 3 .0021
GO:1910: regulation ofimmune cell mediatedcytotoxicity
18 2 .141 2 .202 3 .00178
GO:19724: B cell mediatedimmunity
18 1 .491 1 .574 1 .2200
GO:45577: regulation of B celldifferentiation
16 1 .452 1 .532 2 .0198
GO:46328: regulation of JNKcascade
16 1 .452 2 .168 1 .1980
GO:30890: positive regulationof B cell proliferation
14 1 .409 3 .0246 1 .1760
GO:45060: negative thymic Tcell selection
14 1 .409 1 .485 1 .1760
GO:51085: chaperone cofactordependent protein folding
13 2 .0809 4 .00234 3 .00066

8 Mediators of Inflammation
Table 4: Continued.
Category Genes in Categorywild type vs ob/ob ob/ob vs leptin leptin vs pair-fed
Altered genes P value Altered genes P value Altered genes P value
GO:1912: positive regulationof immune cell mediatedcytotoxicity
11 1 .338 1 .407 3 .00039
GO:48002: antigenpresentation, peptide antigen
10 5 1.45e−5 5 4.39e−5 4 6.8e−6
GO:48005: antigenpresentation, exogenouspeptide antigen
7 5 1.33e−6 5 4.11e−6 4 1.17e−6
GO:45620: negative regulationof lymphocyte differentiation
6 2 .0184 1 .248 1 .0794
GO:46330: positive regulationof JNK cascade
4 1 .139 1 .173 1 .0537
GO:45581: negative regulationof T cell differentiation
2 1 .0723 1 .0905 1 .0272
P values reflect the significance of change in prevalence of genes in each category under the leptin deficiency (ob/ob), leptin administration (leptin) and pair-feeding (pair-fed) conditions in ob/ob mice to the expected prevalence of genes in each category. Statistically significant P values are highlighted in bold.
by leptin administration independently of the effects of foodintake inhibition. Therefore, leptin is able to prevent themuscle atrophy associated with obese and inflammatorystates.
Skeletal muscle constitutes an important target for leptinplaying a key role on the regulation of lipid and glucosemetabolism [20]. Since obese ob/ob mice exhibit an increasedoxidative stress and impaired immune response [14, 15] anda reduced skeletal muscle mass [21] compared with theirlean littermates, we aimed to identify the genes related toinflammatory processes differentially altered by leptin in thegastrocnemius muscle of obese ob/ob mice. In particular,86 transcripts encoding inflammation-related proteins wereshown to be modified by exogenous leptin administration.However, it has to be taken into account that many ofthese genes are multifunctional and may have importantfunctions in other biological processes. Among them, leptinrepressed the high expression levels of acute-phase reactantsand several members of the HSP and RBM families. Inaddition, confirming a previous study of our group [6],leptin treatment increased the reduced muscle weight ofgastrocnemius muscle of ob/ob mice. Taken together, thesedata suggest that leptin may prevent the obesity-associatedinflammatory state and the muscle mass loss related toinflammatory states in leptin-deficient ob/ob mice.
Leptin-deficient ob/ob and leptin receptor-deficientdb/db mice display many abnormalities in the immuneresponse similar to those observed in starved animalsand malnourished humans [14, 15, 22]. In this respect,exogenous leptin replacement to ob/ob mice modulatesT cell responses in mice and prevents starvation-inducedimmunosuppression, suggesting that lack of leptin is directlyinvolved in these immune system abnormalities [23, 24].In agreement with these studies, our findings show thatleptin deficiency and administration differentially regulatebiological processes related to the immune response as
well as the T and B cell differentiation and activation ingastrocnemius muscle of ob/ob mice.
Oxidative stress is defined as the imbalanced redox statein which prooxidants overwhelm the antioxidant capacity,resulting in an increased production of reactive oxygenspecies (ROS), ultimately leading to oxidative damage ofcellular macromolecules. The major ROS is the superoxideanion (•O2
−). Dismutation of •O2− by superoxide dismu-
tase (SOD) produces hydrogen peroxide (H2O2), a morestable ROS, which, in turn, is converted to water by catalaseand glutathione peroxidase (GPx) [25]. Oxidative stress isincreased in diabetes [26, 27] with leptin administrationreportedly improving insulin sensitivity in normal anddiabetic rodents [28–30]. However, the relationship betweenleptin and oxidative stress has not been clearly exhibited.Leptin stimulates in vitro ROS production by inflammatorycells [31] and endothelial cells [32] and the level of systemicoxidative stress in nonobese animals [33, 34], suggestinga “prooxidative” role of leptin. However, administrationof recombinant leptin reduces the oxidative stress inducedby a high-fat diet in mice [35]. In this sense, findings ofour study show a high oxidative stress in diabetic ob/obmice, as reflected by increased TBARS concentrations inserum and the gastrocemius muscle. These observations arein agreement with a large number of studies related toincreased plasma TBARS or MDA in diabetic rats [36] andhumans [37]. Lipid peroxidation is a common index of freeradical mediated injury and induction of antioxidant enzymeis a common cellular response [38]. More importantly,leptin administration decreased serum and gastrocnemiusTBARS concentrations as compared to control ob/ob mice,with TBARS levels in gastrocnemius muscle from pair-fedob/ob animals remaining very similar to those of controlob/ob mice. In this sense, from a molecular perspective, ourresults further show that transcript levels of Sod1, Gpx3and glutathione S-transferase π 1 Gstp1 are downregulated

Mediators of Inflammation 9
Table 5: Genes involved in oxidative stress and inflammatory responses altered by leptin in the gastrocnemius muscle of ob/ob mice.
GeneBank Number Gene Symbol Gene NameFold change
Ratioob/ob leptin
Genes downregulated by leptin
NM 009804 Cat Catalase 1.47 1.13 0.77
NM 007705 Cirbp Cold inducible RNA binding protein 1.68 1.14 0.68
NM 009964 Cryab Crystallin, α B 1.32 1.15 0.87
NM 023695 Crybb1 Crystallin, β B1 2.21 1.39 0.63
NM 023646 Dnaja3 DnaJ (Hsp40) homolog, subfamily A, member 3 0.95 0.64 0.67
NM 021422 Dnaja4 Heat shock protein, DNAJ-like 4 0.88 0.30 0.34
NM 018808 Dnajb1 DnaJ (Hsp40) homolog, subfamily B, member 1 0.44 0.33 0.74
NM 026400 Dnajb11 DnaJ (Hsp40) homolog, subfamily B, member 11 1.11 0.93 0.84
NM 027287 Dnajb4 DnaJ (Hsp40) homolog, subfamily B, member 4 1.09 0.60 0.55
NM 019874 Dnajb5 DnaJ (Hsp40) homolog, subfamily B, member 5 1.03 0.73 0.72
NM 011847 Dnajb6 DnaJ (Hsp40) homolog, subfamily B, member 6 isoform c 0.70 0.47 0.67
NM 013760 Dnajb9 DnaJ (Hsp40) homolog, subfamily B, member 9 0.62 0.39 0.63
NM 007869 Dnajc1 DnaJ (Hsp40) homolog, subfamily C, member 1 0.82 0.52 0.63
NM 028873 Dnajc14 DnaJ (Hsp40) homolog, subfamily C, member 14 1.12 0.87 0.77
NM 172338 Dnajc16 DnaJ (Hsp40) homolog, subfamily C, member 16 1.15 0.66 0.57
NM 009584 Dnajc2 DnaJ (Hsp40) homolog, subfamily C, member 2 1.01 0.82 0.81
NM 008929 Dnajc3 DnaJ (Hsp40) homolog, subfamily C, member 3B 1.02 0.83 0.82
NM 016775 Dnajc5 DnaJ (Hsp40) homolog, subfamily C, member 5 0.74 0.50 0.67
NM 010344 Gsr Glutathione reductase 1 1.17 0.71 0.61
NM 008180 Gss Glutathione synthetase 1.13 0.88 0.78
NM 010357 Gsta4 Glutathione S-transferase, α 4 1.50 1.46 0.97
NM 010362 Gsto1 Glutathione S-transferase o 1 1.42 1.15 0.81
NM 008198 H2-Bf Histocompatibility 2, complement component factor B 2.00 1.44 0.72
NM 013558 Hspa1l Heat shock 70kDa protein 1-like 1.60 1.04 0.65
NM 008301 Hspa2 Heat shock protein 2 1.49 0.98 0.65
NM 008300 Hspa4 Heat shock protein 4 0.92 0.30 0.32
NM 031165 Hspa8 Heat shock protein 8 0.91 0.57 0.62
NM 010481 Hspa9a Heat shock protein 9 1.03 0.88 0.86
NM 024441 Hspb2 Heat shock protein 2 1.45 1.21 0.83
NM 019960 Hspb3 Heat shock protein 3 1.66 1.27 0.77
NM 013868 Hspb7 Heat shock protein family, member 7 1.83 0.35 0.19
NM 008302 Hspcb Heat shock protein 1, β 0.86 0.69 0.80
NM 008416 Junb Jun-B oncogene 0.59 0.36 0.61
NM 010592 Jund1 Jun D proto-oncogene 1.49 0.94 0.63
NM 008456 Klk5 Kallikrein 5 2.23 1.43 0.64
NM 026346 MAFbx Muscle atrophy F box 0.65 0.43 0.67
NM 008209 Mr1 Histocompatibility-2 complex class 1-like 1.19 0.98 0.82
NM 008630 Mt2 Metallothionein 2 1.11 0.50 0.46
NM 008631 Mt4 Metallothionein 4 1.27 1.03 0.81
NM 008872 Plat Plasminogen activator, tissue 1.56 1.12 0.72
NM 029397 Rbm12 RNA binding motif protein 12 1.40 1.03 0.74
NM 026453 Rbm13 RNA binding motif protein 13 1.01 0.87 0.86
NM 026434 Rbm18 RNA binding motif protein 18 0.94 0.59 0.63
BC080205 Rbm22 RNA binding motif protein 22 1.14 0.75 0.66
BC040811 Rbm28 Rbm28 protein 0.69 0.49 0.71
NM 172762 Rbm34 RNA binding motif protein 34 1.01 0.67 0.66
NM 009032 Rbm4 RNA binding motif protein 4 1.04 0.81 0.78
NM 148930 Rbm5 RNA binding motif protein 5 0.69 0.63 0.91
NM 144948 Rbm7 RNA binding motif protein 7 0.81 0.74 0.91
NM 025875 Rbm8a RNA binding motif protein 8a 0.91 0.69 0.76

10 Mediators of Inflammation
Table 5: Continued.
GeneBank Number Gene Symbol Gene NameFold change
Ratioob/ob leptin
NM 175387 Rbm9 RNA binding motif protein 9 isoform 2 1.96 0.46 0.23
NM 025429 Serpinb1a Serine (or cysteine) proteinase inhibitor, clade B, member 1a 2.73 2.09 0.77
NM 080844 Serpinc1 Serine (or cysteine) proteinase inhibitor, clade C (antithrombin), member 1 4.98 1.93 0.39
NM 008871 Serpine1 Serine (or cysteine) proteinase inhibitor, clade E, member 1 2.12 0.97 0.46
NM 011340 Serpinf1 Serine (or cysteine) proteinase inhibitor, clade F, member 1 2.43 1.50 0.62
NM 009776 Serping1 Serine (or cysteine) proteinase inhibitor, clade G, member 1 1.41 1.15 0.81
NM 009776 Serping1 Serine (or cysteine) proteinase inhibitor, clade G, member 1 1.41 1.15 0.81
NM 013749 Tnfrsf12a Tumor necrosis factor receptor superfamily, member 12a 0.78 0.29 0.37
Genes upregulated by leptin
NM 030004 Cryl1 Crystallin λ 1 1.25 1.72 1.38
NM 016669 Crym Crystallin μ 1.37 1.64 1.19
NM 133679 Cryzl1 Crystallin, ζ (quinone reductase)-like 1 1.10 1.28 1.16
NM 008161 Gpx3 Glutathione peroxidase 3 isoform 2 0.47 0.54 1.15
NM 024198 Gpx7 Glutathione peroxidase 7 1.00 1.34 1.33
NM 010359 Gstm3 Glutathione S-transferase, μ 3 1.06 1.23 1.17
NM 010360 Gstm5 Glutathione S-transferase, μ 5 1.09 1.39 1.27
NM 013541 Gstp1 Glutathione S-transferase, π 1 0.87 1.04 1.20
NM 010361 Gstt2 Glutathione S-transferase, θ 2 1.21 1.70 1.40
NM 133994 Gstt3 Glutathione S-transferase, θ 3 1.53 1.69 1.11
NM 010363 Gstz1 Glutathione transferase zeta 1 (maleylacetoacetate isomerase) 1.13 1.24 1.10
NM 010378 H2-Aa Histocompatibility 2, class II antigen A, α 0.46 1.26 2.76
NM 010379 H2-Ab1 Histocompatibility 2, class II antigen A, β1 0.37 1.04 2.84
NM 010382 H2-Eb1 Histocompatibility 2, class II antigen E β 0.43 1.03 2.40
NM 010395 H2-T10 Histocompatibility 2, T region locus 10 1.11 1.41 1.27
NM 013559 Hsp105 Heat shock protein 105 0.41 0.73 1.79
NM 008303 Hspe1 Heat shock protein 1 (chaperonin 10) 0.67 0.98 1.48
AK 052911 MuRF1 M muscle RING finger 1 0.20 0.28 1.43
XM 131139 Rbm15 RNA binding motif protein 15 0.81 1.34 1.66
NM 197993 Rbm21 RNA binding motif protein 21 0.67 0.73 1.08
BC029079 Rbm26 Rbm26 protein 0.75 1.19 1.59
AK087759 Rbm27 RNA binding motif protein 27 0.88 1.19 1.36
NM 148930 Rbm5 RNA binding motif protein 5 0.77 1.18 1.55
NM 011251 Rbm6 RNA binding motif protein 6 isoform a 0.80 0.97 1.21
NM 207105 Rmcs1 histocompatibility 2, class II antigen A, β1 0.38 0.89 2.37
NM 011454 Serpinb6b Serine (or cysteine) proteinase inhibitor, clade B, member 6b 1.06 1.23 1.16
NM 009825 Serpinh1 Serine (or cysteine) proteinase inhibitor, clade H, member 1 0.65 0.99 1.53
NM 145533 Smox Spermine oxidase 0.41 1.23 3.00
AK080908 Sod1 Superoxide dismutase 0.58 0.62 1.07
NM 011723 Xdh Xanthine dehydrogenase 0.68 1.01 1.47
Differential expression of genes is indicated as fold changes with respect to the wild type group presenting only the genes which were significantly different(P < .05) between the leptin-treated and the ob/ob groups. Ratio: fold change value for leptin-treated between the ob/ob groups.
in control ob/ob mice as compared to wild type controlsbeing upregulated after leptin treatment. Furthermore, lep-tin administration also upregulated Gpx7, glutathione S-transferase μ 5 (Gstm5) and glutathione S-transferase θ 2(Gstt2). On the contrary, the high expression of catalase(Cat) was repressed by the exogenous injection of leptin toob/ob mice. These findings are in line with previous obser-vations showing the restoration of the defective antioxidant
enzyme activity in plasma of ob/ob mice [39] and humanswith a leptin gene mutation [40].
Acute-phase reactants have been suggested to contributeto the maintenance of the chronic low-grade inflammationstate involved in the progression of obesity and relateddiseases [41]. Interestingly, our study provides evidence thatgenes of the acute-phase response were altered in gastroc-nemius muscle of ob/ob mice, which were counteracted by

Mediators of Inflammation 11
Table 6: Genes involved in oxidative stress and inflammatory responses altered by leptin in gastrocnemius muscle of ob/ob miceindependently of food intake restriction.
GeneBank Number Gene symbol Gene name Fold change
Genes downregulated by leptin
NM 023695 Crybb1 Crystallin, β B1 0.51
NM 021422 Dnaja4 Heat shock protein, DNAJ-like 4 0.63
NM 019739 Foxo1 Forkhead box O1 0.34
NM 008300 Hspa4 Heat shock protein 4 0.64
NM 013868 Hspb7 Heat shock protein family, member 7 0.34
NM 010592 Jund1 Jun D proto-oncogene 0.50
NM 008456 Klk5 Kallikrein 5 0.46
NM 008491 Lcn2 Lipocalin 2 0.34
NM 008631 Mt4 Metallothionein 4 0.63
NM 026346 MAFbx Muscle atrophy F box 0.37
AK 052911 MuRF1 M muscle RING finger 1 0.29
NM 011459 Serpinb8 Serine (or cysteine) proteinase inhibitor, clade B, member 8 0.38
NM 011459 Serpinb8 Serine (or cysteine) proteinase inhibitor, clade B, member 8 0.59
NM 008871 Serpine1 Serine (or cysteine) proteinase inhibitor, clade E, member 1 0.42
Genes upregulated by leptin
NM 009735 B2m β-2-microglobulin 1.92
NM 010361 Gstt2 Glutathione S-transferase, θ 2 1.94
NM 010379 H2-Ab1 Histocompatibility 2, class II antigen A, β 1 4.72
NM 010379 H2-Ab1 Histocompatibility 2, class II antigen A, β 1 3.66
NM 010386 H2-DMa Histocompatibility 2, class II, locus Dma 2.35
NM 010387 H2-DMb1 Histocompatibility 2, class II, locus Mb1 3.31
NM 010382 H2-Eb1 Histocompatibility 2, class II antigen E β 4.65
NM 013559 Hsp105 Heat shock protein 105 1,79
AK220167 Hspa4 MKIAA4025 protein 1,59
NM 207105 Rmcs1 Histocompatibility 2, class II antigen A, β 1 4.24
NM 207105 Rmcs1 Histocompatibility 2, class II antigen A, β 1 4.17
NM 009255 Serpine2 Serine (or cysteine) proteinase inhibitor, clade E, member 2 1.53
NM 009825 Serpinh1 Serine (or cysteine) proteinase inhibitor, clade H, member 1 2.21
NM 145533 Smox Spermine oxidase 4.67
Differential expression of genes is indicated as fold changes presenting only the genes which were significantly different (P < .05) between the leptin-treatedand the pair-fed ob/ob groups.
exogenous leptin administration. Leptin reduced the elevatedgene expression of tissue-type plasminogen activator (Plat)and lipocalin-2 (Lcn2), which are upregulated in manyinflammatory conditions [42, 43], including human obesity[44]. In addition, a pivotal role for oxidative stress in thepathogenesis of muscle wasting in disuse and in a varietyof pathological conditions is now being widely recognized[45]. A potential link between oxidative stress and muscleatrophy involves the redox regulation of the proteolyticsystem [46]. Moreover, various inflammatory cytokinesinduce oxidative stress [47] and muscle atrophy throughthe activation of the lysosomal [48, 49] and the ubiquitin-proteolysis system [50]. In this context, biological processesrelated to oxidative stress and inflammatory responses werealtered in the gastrocnemius muscle of ob/ob mice andimproved following leptin treatment. In spite of the usualupregulation of the E3 ubiquitin-ligases MAFbx and MuRF1
in most conditions associated with atrophy, their geneexpression levels in ob/ob were lower as compared to wildtype animals, although no statistically significant differenceswere observed. Contrarily to what would be expected, leptinadministration prevented the increase of both MAFbx andMuRF1 mRNA expression levels induced by pair-feedingin ob/ob mice. A plausible explanation for this surprisingfinding may relate to the fact that in extreme conditionsthe energy homeostasis system is overriden whereby leptinis able to inhibit muscular protein degradation associatedto food intake reduction. These data are in accordancewith a previous study of our group evidencing that leptinreplacement inhibits the ubiquitin proteolysis system activityin leptin-deficient mice [6]. Muscle atrophy is associatedwith increased expression of genes coding for RBM proteinswhich facilitate the translation, protection, and restorationof native RNA conformations during oxidative stress. It has

12 Mediators of Inflammation
0
20
40
60
80
Rel
ativ
eu
nit
s 100
120
140 ∗∗Pgcla
Wild typeControl ob/ob
Pair-fed ob/obLeptin-treated ob/ob
(a)
0
20
40
60
80
Rel
ativ
eu
nit
s
100
120
160
140∗
Foxo1
Wild typeControl ob/ob
Pair-fed ob/obLeptin-treated ob/ob
(b)
0
20
40
60
80
Rel
ativ
eu
nit
s
100
120
160
140
∗∗MAFbx
Wild typeControl ob/ob
Pair-fed ob/obLeptin-treated ob/ob
(c)
0
20
40
60
80
Rel
ativ
eu
nit
s 100
120
140
∗
MuRF1
Wild typeControl ob/ob
Pair-fed ob/obLeptin-treated ob/ob
(d)
Figure 2: Real-Time PCR analysis of peroxisome proliferator-activated receptor coactivator 1α (Pgc1a), forkhead box class O1 (Foxo1),muscle atrophy F box (MAFbx) and muscle RING finger 1 (MuRF1) in gastrocnemius muscle of wild type (open), control ob/ob (closed),pair-fed ob/ob (gray) and leptin-treated ob/ob (striped) mice (n = 5 per group). Data are presented as mean±SEM of the ratio between geneexpression and 18S rRNA. ∗P < .05 and ∗∗P < .01 by Kruskal-Wallis followed by Mann Whitney’s U test.
been suggested that the gene expression of RBM proteins mayincrease as a compensatory mechanism in response to loss ofmuscle proteins [51, 52]. Other proteins involved in oxidativestress are metallothioneins, endogenous antioxidants [53]that have been shown to be overexpressed in muscle atrophyin rodents [54–56]. In the present work, we have observedthat administration of leptin inhibits the gene expression ofseveral members of the RBM (Rbm9, Rbm22) and metalloth-ioneins (Mt2, Mt4) families in the gastrocnemius of ob/obmice, suggesting that leptin may modulate the inflammatoryand oxidative stress responses and consequently, the muscleloss related to inflammatory states.
Genes involved in the chaperone system were also differ-entially expressed in ob/ob mice as compared to wild typesand modified by leptin treatment. HSPs represent a familyof molecular chaperones induced in response to cellularstress, responsible for maintaining the structure of proteinsand contributing to the repair of damaged or malformed
proteins in highly oxidative and lipotoxic conditions. As aresult, HSPs are considered antiproteolytic proteins [57].Muscle atrophy is also associated with an increased geneexpression of HSPs [58]. In fact, HSPs are repressed inmany rat models of skeletal muscle atrophy [54, 59, 60].HSP70 is constitutively expressed in skeletal muscle, but itslevels are increased in response to oxidative stress [61] withthe induction of HSP70 expression by hyperthermia andduring inactivity attenuating muscle atrophy [62, 63]. In thisregard, a recent study has shown that HSP70 prevents muscleatrophy induced by physical inactivity through inhibitionof the muscle atrophy-related transcription factor FoxO3aand the expression of MAFbx and MuRF1 [64]. Among theHSPs, HSP70 and αB-crystallin in particular, are considerednegative regulators of muscle cell apoptosis [65, 66] and mayinhibit the loss of nuclei taking place during muscle atrophy.In addition, ROS induce the activity of FoxO [67] and geneexpression of members of the ubiquitin-proteolysis system

Mediators of Inflammation 13
in myotubes [68]. In this sense, our results provide evidencethat leptin inhibits the increased gene expression of differentmembers of the HSPs (Hspb7, Dnajc16, Hspa4, Cryab, andCrybb1) in the gastrocnemius muscle of ob/ob mice. Takentogether, the elevated expression of HSPs in the control andpair-fed ob/ob groups suggests a high defense and stressresponse in these mice. Moreover, induction of HSPs mayconfer broader health benefits to patients who are insulinresistant or diabetic [69]. In mammals, caloric restrictionhas been shown to upregulate HSP induction [70, 71], whileexpression of HSP72 has been found to be low in skeletalmuscle of patients with insulin resistance or type 2 diabetes[72, 73]. Figueiredo et al. [74] have recently shown that leptindownregulates HSP70 gene expression in chicken liver andhypothalamus but not in muscle, which was independent offood intake restriction. On the contrary, Bonior et al. [75]reported an increase in HSP60 gene expression in pancreaticcells by leptin.
Obesity is accompanied by a chronic proinflammatorystate resulting in an increase in circulating cytokines andinflammatory markers. In this regard, inflammation pro-duces metabolic alterations in skeletal muscle with bothinflammatory response and insulin resistance being associ-ated with muscle mass loss. Findings of our study provideevidence that systemic and skeletal muscle oxidative stress,muscle atrophy and the elevated expression of genes involvedin oxidative stress and inflammation of ob/ob mice arereversed by leptin administration. Taken together, these datathereby support that leptin is able to prevent the muscleatrophy associated with obese and inflammatory states inob/ob mice. Most obese people develop muscle atrophy inspite of exhibiting high leptin circulating concentrations,which may be explained by the leptin resistance presentin these patients. Our paper sheds light on the relationbetween obesity and the loss of muscle mass associated toinflammatory states suggesting that leptin treatment may bean attractive therapeutic approach to prevent muscle lossassociated with inflammatory diseases.
Acknowledgments
The authors would like to thank all the staff of the animalhousing facilities for their technical expertise in animalcare and handling and, in particular, to Javier Guillen andJuan Percaz. This paper was supported by grants from theFundacion Mutua Madrilena to GF; from the Instituto deSalud Carlos III, Fondo de Investigacion Sanitaria (FIS) delMinisterio de Sanidad y Consumo to GF and JG-A; andfrom the Department of Health of the Gobierno de Navarraof Spain to GF and JG-A. CIBER de Fisiopatologıa de laObesidad y Nutricion (CIBEROBN) is an initiative of theInstituto de Salud Carlos III, Spain. The funding bodies hadno role in study design, data collection and analysis, decisionto publish, or preparation of the paper.
References
[1] G. Fantuzzi and R. Faggioni, “Leptin in the regulationof immunity, inflammation, and hematopoiesis,” Journal ofLeukocyte Biology, vol. 68, no. 4, pp. 437–446, 2000.
[2] C. X. Andersson, B. Gustafson, A. Hammarstedt, S. Hedjazifar,and U. Smith, “Inflamed adipose tissue, insulin resistance andvascular injury,” Diabetes/Metabolism Research and Reviews,vol. 24, no. 8, pp. 595–603, 2008.
[3] X. Wang, Z. Hu, J. Hu, J. Du, and W. E. Mitch, “Insulinresistance accelerates muscle protein degradation: activationof the ubiquitin-proteasome pathway by defects in muscle cellsignaling,” Endocrinology, vol. 147, no. 9, pp. 4160–4168, 2006.
[4] L. A. Schaap, S. M. F. Pluijm, D. J. H. Deeg, and M. Visser,“Inflammatory markers and loss of muscle mass (Sarcopenia)and strength,” American Journal of Medicine, vol. 119, no. 6,pp. 526–529, 2006.
[5] S. K. Powers, A. N. Kavazis, and J. M. McClung, “Oxidativestress and disuse muscle atrophy,” Journal of Applied Physiol-ogy, vol. 102, no. 6, pp. 2389–2397, 2007.
[6] N. Sainz, A. Rodrıguez, V. Catalan et al., “Leptin administra-tion favors muscle mass accretion by decreasing FoxO3a andincreasing PGC-1α in ob/ob mice,” PLoS ONE, vol. 4, no. 9,article e6808, 2009.
[7] Y. Zhang, R. Proenca, M. Maffei, M. Barone, L. Leopold, and J.M. Friedman, “Positional cloning of the mouse obese gene andits human homologue,” Nature, vol. 372, no. 6505, pp. 425–432, 1994.
[8] J. M. Friedman and J. L. Halaas, “Leptin and the regulationof body weight in mammals,” Nature, vol. 395, no. 6704, pp.763–770, 1998.
[9] G. Fruhbeck and J. Gomez-Ambrosi, “Rationale for theexistence of additional adipostatic hormones,” FASEB Journal,vol. 15, no. 11, pp. 1996–2006, 2001.
[10] M. A. Pelleymounter, M. J. Cullen, M. B. Baker et al., “Effectsof the obese gene product on body weight regulation in ob/obmice,” Science, vol. 269, no. 5223, pp. 540–543, 1995.
[11] M. Otero, R. Lago, F. Lago et al., “Leptin, from fat toinflammation: old questions and new insights,” FEBS Letters,vol. 579, no. 2, pp. 295–301, 2005.
[12] P. Mancuso, A. Gottschalk, S. M. Phare, M. Peters-Golden, N.W. Lukacs, and G. B. Huffnagle, “Leptin-deficient mice exhibitimpaired host defense in Gram-negative pneumonia,” Journalof Immunology, vol. 168, no. 8, pp. 4018–4024, 2002.
[13] S. Loffreda, S. Q. Yang, H. Z. Lin et al., “Leptin regulatesproinflammatory immune responses,” FASEB Journal, vol. 12,no. 1, pp. 57–65, 1998.
[14] M. A. Mandel and A. A. F. Mahmoud, “Impairment ofcell-mediated immunity in mutation diabetic mice (db/db),”Journal of Immunology, vol. 120, no. 4, pp. 1375–1377, 1978.
[15] R. K. Chandra, “Cell-mediated immunity in genetically obese(C57BL/6J ob/ob) mice,” American Journal of Clinical Nutri-tion, vol. 33, no. 1, pp. 13–16, 1980.
[16] D. R. Matthews, J. P. Hosker, and A. S. Rudenski, “Homeostasismodel assessment: insulin resistance and β-cell function fromfasting plasma glucose and insulin concentrations in man,”Diabetologia, vol. 28, no. 7, pp. 412–419, 1985.
[17] A. Katz, S. S. Nambi, K. Mather et al., “Quantitativeinsulin sensitivity check index: a simple, accurate method forassessing insulin sensitivity in humans,” Journal of ClinicalEndocrinology and Metabolism, vol. 85, no. 7, pp. 2402–2410,2000.
[18] M. Conti, P. C. Morand, P. Levillain, and A. Lemonnier,“Improved fluorometric determination of malonaldehyde,”Clinical Chemistry, vol. 37, no. 7, pp. 1273–1275, 1991.
[19] V. Catalan, J. Gomez-Ambrosi, F. Rotellar et al., “Validation ofendogenous control genes in human adipose tissue: relevanceto obesity and obesity-associated type 2 diabetes mellitus,”

14 Mediators of Inflammation
Hormone and Metabolic Research, vol. 39, no. 7, pp. 495–500,2007.
[20] R. B. Ceddia, “Direct metabolic regulation in skeletal muscleand fat tissue by leptin: implications for glucose and fatty acidshomeostasis,” International Journal of Obesity, vol. 29, no. 10,pp. 1175–1183, 2005.
[21] N. Trostler, D. R. Romsos, W. G. Bergen, and G. A. Leveille,“Skeletal muscle accretion and turnover in lean and obese(ob/ob) mice,” Metabolism, vol. 28, no. 9, pp. 928–933, 1979.
[22] G. Matarese, “Leptin and the immune system: how nutritionalstatus influences the immune response,” European CytokineNetwork, vol. 11, no. 1, pp. 7–14, 2000.
[23] G. M. Lord, G. Matarese, J. K. Howard, R. J. Baker, S. R. Bloom,and R. I. Lechler, “Leptin modulates the T-cell immuneresponse and reverses starvation—induced immunosuppres-sion,” Nature, vol. 394, no. 6696, pp. 897–901, 1998.
[24] J. K. Howard, G. M. Lord, G. Matarese et al., “Leptinprotects mice from starvation-induced lymphoid atrophy andincreases thymic cellularity in ob/ob mice,” Journal of ClinicalInvestigation, vol. 104, no. 8, pp. 1051–1059, 1999.
[25] A. Fortuno, G. San Jose, M. U. Moreno, J. Dıez, and G. Zalba,“Oxidative stress and vascular remodelling,” ExperimentalPhysiology, vol. 90, no. 4, pp. 457–462, 2005.
[26] J. V. Hunt, C. C. T. Smith, and S. P. Wolff, “Autoxidativeglycosylation and possible involvement of peroxides and freeradicals in LDL modification by glucose,” Diabetes, vol. 39, no.11, pp. 1420–1424, 1990.
[27] C. Feillet-Coudray, E. Rock, C. Coudray et al., “Lipid per-oxidation and antioxidant status in experimental diabetes,”Clinica Chimica Acta, vol. 284, no. 1, pp. 31–43, 1999.
[28] P. Muzzin, R. C. Eisensmith, K. C. Copeland, and S. L. C. Woo,“Correction of obesity and diabetes in genetically obese miceby leptin gene therapy,” Proceedings of the National Academyof Sciences of the United States of America, vol. 93, no. 25, pp.14804–14808, 1996.
[29] W. I. Sivitz, S. A. Walsh, D. A. Morgan, M. J. Thomas, and W.G. Haynes, “Effects of leptin on insulin sensitivity in normalrats,” Endocrinology, vol. 138, no. 8, pp. 3395–3401, 1997.
[30] N. Chinookoswong, J.-L. Wang, and Z.-Q. Shi, “Leptinrestores euglycemia and normalizes glucose turnover ininsulin- deficient diabetes in the rat,” Diabetes, vol. 48, no. 7,pp. 1487–1492, 1999.
[31] F. Maingrette and G. Renier, “Leptin increases lipoproteinlipase secretion by macrophages: involvement of oxidativestress and protein kinase C,” Diabetes, vol. 52, no. 8, pp. 2121–2128, 2003.
[32] A. Bouloumie, T. Marumo, M. Lafontan, and R. Busse, “Leptininduces oxidative stress in human endothelial cells,” FASEBJournal, vol. 13, no. 10, pp. 1231–1238, 1999.
[33] J. Beltowski, G. Wojcicka, A. Marciniak, and A. Jamroz,“Oxidative stress, nitric oxide production, and renal sodiumhandling in leptin-induced hypertension,” Life Sciences, vol.74, no. 24, pp. 2987–3000, 2004.
[34] V. Balasubramaniyan and N. Nalini, “Effect of leptin on perox-idation and antioxidant defense in ethanol-supplemented Musmusculus heart,” Fundamental and Clinical Pharmacology, vol.21, no. 3, pp. 245–253, 2007.
[35] J. B. K. Sailaja, V. Balasubramaniyan, and N. Nalini, “Effectof exogenous leptin administration on high fat diet inducedoxidative stress,” Pharmazie, vol. 59, no. 6, pp. 475–479, 2004.
[36] S. Gulen and S. Dincer, “Effects of leptin on oxidative stress inhealthy and Streptozotocin-induced diabetic rats,” Molecularand Cellular Biochemistry, vol. 302, no. 1-2, pp. 59–65, 2007.
[37] R. D. Hoeldtke, K. D. Bryner, D. R. McNeill, S. S. Warehime,K. Van Dyke, and G. Hobbs, “Oxidative stress and insulinrequirements in patients with recent-onset type I diabetes,”Journal of Clinical Endocrinology and Metabolism, vol. 88, no.4, pp. 1624–1628, 2003.
[38] E. D. Harris, “Regulation of antioxidant enzymes,” FASEBJournal, vol. 6, no. 9, pp. 2675–2683, 1992.
[39] A. M. Watson, S. M. Poloyac, G. Howard, and R. A. Blouin,“Effect of leptin on cytochrome P-450, conjugation, andantioxidant enzymes in the ob/ob mouse,” Drug Metabolismand Disposition, vol. 27, no. 6, pp. 695–700, 1999.
[40] M. Ozata, G. Uckaya, A. Aydin, A. Isimer, and I. C.Ozdemir, “Defective antioxidant defense system in patientswith a human leptin gene mutation,” Hormone and MetabolicResearch, vol. 32, no. 7, pp. 269–272, 2000.
[41] J. C. Pickup and M. B. Mattock, “Activation of the innateimmune system as a predictor of cardiovascular mortality inType 2 diabetes mellitus,” Diabetic Medicine, vol. 20, no. 9, pp.723–726, 2003.
[42] L. Kjeldsen, J. B. Cowland, and N. Borregaard, “Humanneutrophil gelatinase-associated lipocalin and homologousproteins in rat and mouse,” Biochimica et Biophysica Acta, vol.1482, no. 1-2, pp. 272–283, 2000.
[43] C. Gabay and I. Kushner, “Acute-phase proteins and other sys-temic responses to inflammation,” The New England Journal ofMedicine, vol. 340, no. 6, pp. 448–454, 1999.
[44] V. Catalan, J. Gomez-Ambrosi, A. Rodrıguez et al., “Increasedadipose tissue expression of lipocalin-2 in obesity isrelated to inflammation and matrix metalloproteinase-2 andmetalloproteinase-9 activities in humans,” Journal of Molecu-lar Medicine, vol. 87, no. 8, pp. 803–813, 2009.
[45] J. S. Moylan and M. B. Reid, “Oxidative stress, chronic disease,and muscle wasting,” Muscle and Nerve, vol. 35, no. 4, pp. 411–429, 2007.
[46] Y.-P. Li, Y. Chen, A. S. Li, and M. B. Reid, “Hydrogen peroxidestimulates ubiquitin-conjugating activity and expression ofgenes for specific E2 and E3 proteins in skeletal musclemyotubes,” American Journal of Physiology, vol. 285, no. 4, pp.C806–C812, 2003.
[47] P. Matthys and A. Billiau, “Cytokines and cachexia,” Nutrition,vol. 13, no. 9, pp. 763–770, 1997.
[48] C. Ebisui, T. Tsujinaka, T. Morimoto et al., “Interleukin-6 induces proteolysis by activating intracellular proteases(cathepsins B and L, proteasome) in C2C12 myotubes,” ClinicalScience, vol. 89, no. 4, pp. 431–439, 1995.
[49] C. Deval, S. Mordier, C. Obled et al., “Identification ofcathepsin L as a differentially expressed message associatedwith skeletal muscle wasting,” Biochemical Journal, vol. 360,no. 1, pp. 143–150, 2001.
[50] Y.-P. Li, Y. Chen, J. John et al., “TNF-α acts via p38 MAPK tostimulate expression of the ubiquitin ligase atrogin1/MAFbxin skeletal muscle,” FASEB Journal, vol. 19, no. 3, pp. 362–370,2005.
[51] J. St-Amand, K. Okamura, K. Matsumoto, S. Shimizu, andY. Sogawa, “Characterization of control and immobilizedskeletal muscle: an overview from genetic engineering,” FASEBJournal, vol. 15, no. 3, pp. 684–692, 2001.
[52] M. Wittwer, M. Fluck, H. Hoppeler, S. Muller, D. Desplanches,and R. Billeter, “Prolonged unloading of rat soleus musclecauses distinct adaptations of the gene profile,” FASEB Journal,vol. 16, no. 8, pp. 884–886, 2002.
[53] R. Nath, D. Kumar, T. Li, and P. K. Singal, “Metallothioneins,oxidative stress and the cardiovascular system,” Toxicology, vol.155, no. 1–3, pp. 17–26, 2000.

Mediators of Inflammation 15
[54] E. J. Stevenson, P. G. Giresi, A. Koncarevic, and S. C. Kandar-ian, “Global analysis of gene expression patterns during disuseatrophy in rat skeletal muscle,” Journal of Physiology, vol. 551,no. 1, pp. 33–48, 2003.
[55] S. H. Lecker, R. T. Jagoe, A. Gilbert et al., “Multiple types ofskeletal muscle atrophy involve a common program of changesin gene expression,” FASEB Journal, vol. 18, no. 1, pp. 39–51,2004.
[56] M. L. Urso, P. M. Clarkson, and T. B. Price, “Immobilizationeffects in young and older adults,” European Journal of AppliedPhysiology, vol. 96, no. 5, pp. 564–571, 2006.
[57] R. I. Morimoto, “Cells in stress: transcriptional activation ofheat shock genes,” Science, vol. 259, no. 5100, pp. 1409–1410,1993.
[58] C.-K. Lee, R. G. Klopp, R. Weindruch, and T. A. Prolla,“Gene expression profile of aging and its retardation by caloricrestriction,” Science, vol. 285, no. 5432, pp. 1390–1393, 1999.
[59] J. M. Lawler, W. Song, and H.-B. Kwak, “Differential responseof heat shock proteins to hindlimb unloading and reloadingin the soleus,” Muscle and Nerve, vol. 33, no. 2, pp. 200–207,2006.
[60] J. T. Selsby, S. Rother, S. Tsuda, O. Pracash, J. Quindry,and S. L. Dodd, “Intermittent hyperthermia enhances skeletalmuscle regrowth and attenuates oxidative damage followingreloading,” Journal of Applied Physiology, vol. 102, no. 4, pp.1702–1707, 2007.
[61] Y. Liu, L. Gampert, K. Nething, and J. M. Steinacker,“Response and function of skeletal muscle heat shock protein70,” Frontiers in Bioscience, vol. 11, no. 3, pp. 2802–2827, 2006.
[62] H. Naito, S. K. Powers, H. A. Demirel, T. Sugiura, S. L. Dodd,and J. Aoki, “Heat stress attenuates skeletal muscle atrophy inhindlimb-unweighted rats,” Journal of Applied Physiology, vol.88, no. 1, pp. 359–363, 2000.
[63] J. T. Selsby and S. L. Dodd, “Heat treatment reduces oxidativestress and protects muscle mass during immobilization,”American Journal of Physiology, vol. 289, no. 1, pp. R134–R139,2005.
[64] S. M. Senf, S. L. Dodd, J. M. McClung, and A. R. Judge,“Hsp70 overexpression inhibits NF-κB and Foxo3a transcrip-tional activities and prevents skeletal muscle atrophy,” FASEBJournal, vol. 22, no. 11, pp. 3836–3845, 2008.
[65] C. Garrido, S. Gurbuxani, L. Ravagnan, and G. Kroemer,“Heat shock proteins: endogenous modulators of apoptoticcell death,” Biochemical and Biophysical Research Communica-tions, vol. 286, no. 3, pp. 433–442, 2001.
[66] M. C. Kamradt, F. Chen, S. Sam, and V. L. Cryns, “The smallheat shock protein αB-crystallin negatively regulates apoptosisduring myogenic differentiation by inhibiting caspase-3 acti-vation,” The Journal of Biological Chemistry, vol. 277, no. 41,pp. 38731–38736, 2002.
[67] T. Nakamura and K. Sakamoto, “Forkhead transcriptionfactor FOXO subfamily is essential for reactive oxygen species-induced apoptosis,” Molecular and Cellular Endocrinology, vol.281, no. 1-2, pp. 47–55, 2008.
[68] M. C. C. Gomes-Marcondes and M. J. Tisdale, “Induction ofprotein catabolism and the ubiquitin-proteasome pathway bymild oxidative stress,” Cancer Letters, vol. 180, no. 1, pp. 69–74,2002.
[69] M. F. McCarty, “Induction of heat shock proteins may combatinsulin resistance,” Medical Hypotheses, vol. 66, no. 3, pp. 527–534, 2006.
[70] K. B. Aly, J. L. Pipkin, W. G. Hinson et al., “Chronic caloricrestriction induces stress proteins in the hypothalamus of
rats,” Mechanisms of Ageing and Development, vol. 76, no. 1,pp. 11–23, 1994.
[71] A. R. Heydari, S. You, R. Takahashi, A. Gutsmann, K. D.Sarge, and A. Richardson, “Effect of caloric restriction on theexpression of heat shock protein 70 and the activation of heatshock transcription factor,” Developmental Genetics, vol. 18,no. 2, pp. 114–124, 1996.
[72] I. Kurucz, A. Morva, A. Vaag et al., “Decreased expression ofheat shock protein 72 in skeletal muscle of patients with type2 diabetes correlates with insulin resistance,” Diabetes, vol. 51,no. 4, pp. 1102–1109, 2002.
[73] C. R. Bruce, A. L. Carey, J. A. Hawley, and M. A. Febbraio,“Intramuscular heat shock protein 72 and heme oxygenase-1 mRNA are reduced in patients with type 2 diabetes:evidence that insulin resistance is associated with a disturbedantioxidant defense mechanism,” Diabetes, vol. 52, no. 9, pp.2338–2345, 2003.
[74] D. Figueiredo, A. Gertler, G. Cabello, E. Decuypere, J. Buyse,and S. Dridi, “Leptin downregulates heat shock protein-70(HSP-70) gene expression in chicken liver and hypothalamus,”Cell and Tissue Research, vol. 329, no. 1, pp. 91–101, 2007.
[75] J. Bonior, J. Jaworek, S. J. Konturek, and W. W. Pawlik, “Leptinis the modulator of HSP60 gene expression in AR42J cells,”Journal of Physiology and Pharmacology, vol. 57, no. 7, pp. 135–143, 2006.
Copyright © 2022 FDOKUMEN


![Peripherally administered [Nle4, D-Phe7]-MSH increases resting metabolic rate, while peripheral AgRP has no effect, in wild type C57BL/6 and ob/ob mice.](https://static.fdokumen.com/doc/165x107/631268023ed465f0570a36fc/peripherally-administered-nle4-d-phe7-msh-increases-resting-metabolic-rate-while.jpg)