High glucose downregulates endothelial progenitor cell number via SIRT1
10
High glucose downregulates endothelial progenitor cell number via SIRT1 ☆ Maria Luisa Balestrieri a, ⁎, Monica Rienzo b, 1 , Francesca Felice a, 1 , Raffaele Rossiello a, 1 , Vincenzo Grimaldi b , Lara Milone a , Amelia Casamassimi b , Luigi Servillo a , Bartolomeo Farzati b , Alfonso Giovane a , Claudio Napoli b, ⁎ a Department of Biochemistry and Biophysics, II University of Naples, Naples, Italy b Department of General Pathology and Excellence Research Center of Cardiovascular Diseases, School of Medicine, II University of Naples, Naples, Italy Article history: Received 27 December 2007 Received in revised form 21 February 2008 Accepted 5 March 2008 Available online 20 March 2008 Keywords: Endothelial progenitor cells SIRT1 Glucose Increasing evidence indicates that mammalian SIRT1 mediates calorie restriction and influences lifespan regulating a number of biological molecules such as FoxO1. SIRT1 controls the angiogenic activity of endothelial cells via deacetylation of FoxO1. Endothelial dysfunction and reduced new blood vessel growth in diabetes involve a decreased bioactivity of endothelial progenitor cells (EPCs) via repression of FoxO1 transcriptional activity. The relative contribution of SIRT1 with respect to the direct effects of high glucose on EPC number is poorly understood. We report that treatment of EPCs with high glucose for 3 days determined a consistent downregulation of EPC positive to DiLDL/lectin staining and, interestingly, this was associated with reduced SIRT1 expression levels and enzyme activity, and increased acetyl-FoxO1 expression levels. Moreover, EPCs responded to high glucose with major changes in the expression levels of cell metabolism-, cell cycle-, and oxidative stress-related genes or proteins. Proteomic analysis shows increased expression of nicotinamide phosphorybosyl transferase and mitochondrial superoxide dismutase whereas a glucose- related heat shock protein is reduced. These findings show that SIRT1 is a critical modulator of EPCs dysfunction during alteration of glucose metabolism. © 2008 Elsevier B.V. All rights reserved. 1. Introduction Sir2 (silent information regulator-2), a NAD+-dependent histone deacetylase, is evolutionary conserved in organisms ranging from archaea to humans [1,2]. Mammalian SIRT1 NAD+-dependent protein deacetylase, the closest homolog of Sir2, mediates many of the effects of calorie restriction (CR) on organism lifespan and metabolic path- ways [3,4] as it regulates cell cycle, premature senescence, apoptosis and metabolism by interacting with a number of molecules, including, forkhead transcription factor (FoxO) [5,6]. SIRT1 have been shown to play a critical role in the regulation of several essential physiological processes [7] and recent reports highlight its role in vascular function [8–10]. Indeed, SIRT1 has been shown to exert protective effects against endothelial dysfunction by preventing stress-induced senescence [8] and, at vascular levels, to promote endothelium-dependent vasodilation by deacetylating endothelial nitric oxide synthase (eNOS) and increasing nitric oxide (NO) bioavailability [9]. Moreover, SIRT1 is highly expressed in the vasculature during blood vessel growth, where it controls the angiogenic activity of endothelial cells via deacetylation of the FoxO1 [10]. Disruption of SIRT1 gene expression results in defective blood vessel formation and blunts ischemia-induced neovascularization [10]. Glucose homeostasis is under tight control of SIRT1 which inter- acts and deacetylates nuclear FoxO1 and promotes FoxO1-dependent transcription of hepatic gluconeogenesis upon stress [4,7]. Hypergly- cemia, associated with endothelial dysfunction and reduced new blood vessel growth, is a primary cause of vascular complications in diabetes [11,12]. Reduced levels of endothelial progenitor cells (EPCs) are likely to be involved in the pathogenesis of vascular complications both in type 1 and type 2 diabetes [13–16]. Number and migratory activity of this population of progenitor cells, which circulates in the blood and homes to the site of injured endothelium or extravascular tissue [17–19], inversely correlate with risk factors for coronary heart diseases (CHD), such as diabetes, hypertension, or smoking [20–23]. Studies in animal models and in vitro studies using EPCs from type 1 diabetic patients revealed a potential role for glucotoxicity in impairing EPC function [13–15]. The molecular mechanisms underlying the reduced numbers of EPCs and function in diabetes are poorly understood. It has Biochimica et Biophysica Acta 1784 (2008) 936–945 ☆ This work was funded by a grant from Ministry of University and Research P.R.I.N./ MIUR 2006 2006063183_002 (L.S.); by a grant from Regione Campania legge 5 2006 code BRC1498BLSMLS68L44F839P (M.L.B. and C.N.); by a grant P.R.I.N./MIUR 2006 0622153_002 (C.N), and by Fondation Jerome Lejeune (C.N.). ⁎ Corresponding authors. M.L. Balestrieri is to be contacted at Department of Biochemistry and Biophysics II University of Naples, Complesso S. Andrea delle Dame, Via L. de Crecchio 7, Naples, 80138, Italy. Tel.: +39 081 5667587; fax: +39 081 5665863. C. Napoli, Department of General Pathology and Excellence Research Center of Cardiovascular Diseases, Division of Clinical Pathology, II University of Naples, Complesso S. Andrea delle Dame. Via L. de Crecchio 7, Naples, 80138, Italy. Tel.: +39 081 5667567. E-mail addresses: [email protected] (M.L. Balestrieri), [email protected] (C. Napoli). 1 These authors contributed equally to this study. 1570-9639/$ – see front matter © 2008 Elsevier B.V. All rights reserved. doi:10.1016/j.bbapap.2008.03.004 Contents lists available at ScienceDirect Biochimica et Biophysica Acta journal homepage: www.elsevier.com/locate/bbapap article info abstract
-
Upload
independent -
Category
Documents
-
view
1 -
download
0
Transcript of High glucose downregulates endothelial progenitor cell number via SIRT1
Biochimica et Biophysica Acta 1784 (2008) 936–945
Contents lists available at ScienceDirect
Biochimica et Biophysica Acta
j ourna l homepage: www.e lsev ie r.com/ locate /bbapap
High glucose downregulates endothelial progenitor cell number via SIRT1☆
Maria Luisa Balestrieri a,⁎, Monica Rienzo b,1, Francesca Felice a,1, Raffaele Rossiello a,1, Vincenzo Grimaldi b,LaraMilone a, Amelia Casamassimi b, Luigi Servillo a, Bartolomeo Farzati b, AlfonsoGiovane a, ClaudioNapoli b,⁎a Department of Biochemistry and Biophysics, II University of Naples, Naples, Italyb Department of General Pathology and Excellence Research Center of Cardiovascular Diseases, School of Medicine, II University of Naples, Naples, Italy
☆ This work was funded by a grant from Ministry of UMIUR 2006 2006063183_002 (L.S.); by a grant from Recode BRC1498BLSMLS68L44F839P (M.L.B. and C.N.); b0622153_002 (C.N), and by Fondation Jerome Lejeune (C⁎ Corresponding authors. M.L. Balestrieri is to be
Biochemistry and Biophysics II University of Naples, ComVia L. de Crecchio 7, Naples, 80138, Italy. Tel.: +39 081 56C. Napoli, Department of General Pathology and ExCardiovascular Diseases, Division of Clinical PatholoComplesso S. Andrea delle Dame. Via L. de Crecchio 7,081 5667567.
E-mail addresses: [email protected] ([email protected] (C. Napoli).
1 These authors contributed equally to this study.
1570-9639/$ – see front matter © 2008 Elsevier B.V. Aldoi:10.1016/j.bbapap.2008.03.004
a b s t r a c t
a r t i c l e i n f oArticle history:
Increasing evidence indicat Received 27 December 2007Received in revised form 21 February 2008Accepted 5 March 2008Available online 20 March 2008Keywords:Endothelial progenitor cellsSIRT1Glucose
es that mammalian SIRT1 mediates calorie restriction and influences lifespanregulating a number of biological molecules such as FoxO1. SIRT1 controls the angiogenic activity ofendothelial cells via deacetylation of FoxO1. Endothelial dysfunction and reduced new blood vessel growth indiabetes involve a decreased bioactivity of endothelial progenitor cells (EPCs) via repression of FoxO1transcriptional activity. The relative contribution of SIRT1 with respect to the direct effects of high glucose onEPC number is poorly understood. We report that treatment of EPCs with high glucose for 3 days determineda consistent downregulation of EPC positive to DiLDL/lectin staining and, interestingly, this was associatedwith reduced SIRT1 expression levels and enzyme activity, and increased acetyl-FoxO1 expression levels.Moreover, EPCs responded to high glucose with major changes in the expression levels of cell metabolism-,cell cycle-, and oxidative stress-related genes or proteins. Proteomic analysis shows increased expression ofnicotinamide phosphorybosyl transferase and mitochondrial superoxide dismutase whereas a glucose-related heat shock protein is reduced. These findings show that SIRT1 is a critical modulator of EPCsdysfunction during alteration of glucose metabolism.
© 2008 Elsevier B.V. All rights reserved.
1. Introduction
Sir2 (silent information regulator-2), a NAD+-dependent histonedeacetylase, is evolutionary conserved in organisms ranging fromarchaea to humans [1,2]. Mammalian SIRT1 NAD+-dependent proteindeacetylase, the closest homolog of Sir2, mediates many of the effectsof calorie restriction (CR) on organism lifespan and metabolic path-ways [3,4] as it regulates cell cycle, premature senescence, apoptosisandmetabolism by interacting with a number of molecules, including,forkhead transcription factor (FoxO) [5,6]. SIRT1 have been shown toplay a critical role in the regulation of several essential physiological
niversity and Research P.R.I.N./gione Campania legge 5 2006y a grant P.R.I.N./MIUR 2006.N.).contacted at Department ofplesso S. Andrea delle Dame,67587; fax: +39 081 5665863.cellence Research Center ofgy, II University of Naples,Naples, 80138, Italy. Tel.: +39
.L. Balestrieri),
l rights reserved.
processes [7] and recent reports highlight its role in vascular function[8–10]. Indeed, SIRT1 has been shown to exert protective effects againstendothelial dysfunction by preventing stress-induced senescence [8]and, at vascular levels, to promote endothelium-dependent vasodilationbydeacetylatingendothelial nitric oxide synthase (eNOS) and increasingnitric oxide (NO) bioavailability [9]. Moreover, SIRT1 is highly expressedin the vasculature during blood vessel growth, where it controls theangiogenic activity of endothelial cells via deacetylation of the FoxO1[10]. Disruption of SIRT1 gene expression results in defective bloodvessel formation and blunts ischemia-induced neovascularization [10].
Glucose homeostasis is under tight control of SIRT1 which inter-acts and deacetylates nuclear FoxO1 and promotes FoxO1-dependenttranscription of hepatic gluconeogenesis upon stress [4,7]. Hypergly-cemia, associated with endothelial dysfunction and reduced newblood vessel growth, is a primary cause of vascular complications indiabetes [11,12]. Reduced levels of endothelial progenitor cells (EPCs)are likely to be involved in the pathogenesis of vascular complicationsboth in type 1 and type 2 diabetes [13–16]. Number and migratoryactivity of this population of progenitor cells, which circulates in theblood and homes to the site of injured endothelium or extravasculartissue [17–19], inversely correlate with risk factors for coronary heartdiseases (CHD), such as diabetes, hypertension, or smoking [20–23].Studies in animal models and in vitro studies using EPCs from type 1diabetic patients revealed a potential role for glucotoxicity in impairingEPC function [13–15]. Themolecularmechanismsunderlying the reducednumbers of EPCs and function in diabetes are poorly understood. It has

937M.L. Balestrieri et al. / Biochimica et Biophysica Acta 1784 (2008) 936–945
been suggested that hyperglycemia-induced overproduction of ROS andthe onset acceleration of EPC senescence can explain EPC impairmentsobserved in diabetes [24]. Analysis of the signaling pathway indicatedthat glucose toxicity acts to dampen the activity of PI3-kinase/Aktpathway and inhibits the transcriptional activity of FoxO1 [25]. However,potential role of SIRT1with respect to thedirect effects of high glucose onaltered EPC number and transcriptional activity of FoxO1 has not beenelucidated. Identification of novel potential targets in EPCs during alteredglucose homeostasis might be of clinical relevance in the modulation oflevels and functional activities of EPCs seriously compromised in variouscardiovascular disorders. Preclinical and clinical studies indicate potentialtherapeutic application of EPC-based therapy for patients with CHDwhich showa functional impairment of EPCs, both in the bonemarrowaswell as when these cells are mobilized into the blood as circulatingprogenitors [26–28]. In light of the strict relationship between SIRT1 andFoxO1 in glucose homeostasis [4], the goal of the present study was toexplore possible involvement of SIRT1 signaling pathway in the modu-lation of EPC levels during in vitro exposure to high glucose concentra-tions and to evaluate changes in the proteome and transcriptome profile,critical for a better comprehension of the pathways involved in theresponse of EPCs to altered glucose levels.
2. Materials and methods
2.1. Isolation and culture of circulating human EPCs
EPCs were isolated from total peripheral blood mononuclear cells (PBMCs) aspreviously described [29]. Briefly, PBMCs of healthy humandonorwere isolated by densitygradient centrifugation on Histopaque-10771 (1.077 g/ml, Sigma) (400 ×g for 40 min at4 °C) according to the manufacturer's protocol. Isolated PBMCs (5×10⁶ cells/ml medium)were plated on culture dishes coated with human fibronectin and maintained in endo-thelial basal medium (EBM; Cell Systems) supplemented with 1 μg/ml hydrocortisone,12 μg/ml bovine brain extract, 50 μg/ml gentamycin, 50 ng/ml amphotericin B, 10 ng/mlepidermal growth factor, and 20% FCS [29]. Cells were cultured at 37 °C with 5% CO2 in ahumidified atmosphere. After 3 days of culture, nonadherent cells were removed bythrough washing with PBS and adherent cells were used for further analysis.
2.2. Human EPC treatments
EPCs from total PBMCs were incubated with glucose (15 mmol/l) for 3 days. Whentreated with SIRT1 modulators, EPCs were pre-treated with resveratrol (29 nM),nicotinamide (500 μM), or suramine (50 μM) for 60 min and then glucose (15 mmol/l)was added to the media and incubated for 3 days.
2.3. Flow cytometry analysis
Flow cytometry analysis (FACS) was performed on freshly isolated cells at day 0 andat day 3 of culture after Dil-Ac-LDL/Lectin staining as previously described [29]. Briefly,cells grown on microscope fibronectin coated glasses were incubated with 2 μg/ml 1,1′-dioctadecyl-3,3,3′,3′-tetramethylindocarbocyanine-labeled acetylated LDL (Dil-Ac-LDL)(Biomedical Technologies Inc.) for 3 h at 37 °C. Cells were fixed in 4% paraformaldehydeand counterstained with 50 μg/ml FITC-labeled lectin from Ulex europaeus (Sigma) for1 h at 37 °C in the dark. Quantitative fluorescence analysis was performed with a FACS-CANTO instrument (BD Biosciences).
2.4. Determination of EPC number
EPC number was evaluated after Dil-Ac-LDL/Lectin staining as described above. Cellcounting was performed as recently described by Casamassimi et al. [29]. EPC numberwas evaluated by either microscope counting and FACS computed counting. For micro-scope counting, microscope (Leica FW4000) field image was divided in 120 sub-fieldsand total number of double positive Dil LDL/Lectin cells was calculated by counting cellsin each sub-field. EPC number was expressed as percentage of cells positive for DilLDL/Lectin dual staining.
2.5. Western blot analysis
For Western blot analysis nuclear and cytosolic extracts were made as follows:1×10⁷ cells were washed once in ice-cold phosphate-buffered saline and harvested in0.5 ml of hypotonic buffer 10 mM HEPES pH 7.9, 1.5 mM magnesium chloride, 10 mMpotassium chloride, 0.5 mM phenylmethylsulfonyl fluoride (PMSF), 0.1 mM EDTA, 1 μg/ml protease inhibitors, 1% Nonidet P-40) and placed on ice for 10 min. The mixture wascentrifuged for 5 min at 10,000 ×g. The supernatant was removed and retained as thecytosolic fraction. The remaining pellet was incubated with 60 μl of high-salt buffer20 mMHEPES pH 7.9, 400 mMNaCl, 1.5 mMMgCl2, 25% glycerol, 0.5 mM PMSF,1 μg/mlprotease inhibitors. This mixture was incubated on ice for 15 min and centrifuged for
5 min at 10,000 × g. The supernatant was retained as the nuclear fraction and storedat −80 °C until further use. An aliquot of the nuclear and cytosolic supernatant wasused for total protein determination by the Lowrymethod. Total and nuclear cells extracts(50–100 μg/lane) were loaded onto SDS-polyacrylamide gels and blotted onto PVDFmembrane. Western blots were performed by use of antibodies directed against SIRT1(1:1000; Upstate), Acetyl-FOXO1 (1:1000; Santa Cruz Biotechnology), FOXO1 (1:1000;Santa Cruz Biotechnology), p14ARF (1:200; Santa Cruz Biotechnology), p16INK4A (1:500;Lab Vision Corporation), and tubulin (GTU-88) (1:10,000; Sigma). Secondary antibodieswere anti-rabbit (1:5000; Santa Cruz Biotechnology), anti-mouse (1:5000; Santa CruzBiotechnology), and anti-goat (1:5000; Santa Cruz Biotechnology). Enhanced chemilumi-nescence was performed according to the instructions of the manufacturer (Amersham).
2.6. SIRT1 activity assay
Deacetylation activity of SIRT1wasmeasuredwith Fluor de Lys kit (AK-555; Biomol)using a fluorogenic peptide encompassing residues 379 to 382 of p53, acetylated onlysine 382 (KI-177; Biomol). The acetylated lysine residue was coupled to anaminomethylcoumarin moiety. The peptide was deacetylated by SIRT1, followed bythe addition of a proteolytic developer (KI-176; Biomol) that released the fluorescentaminomethylcoumarin. Briefly, nuclear extract of EPCwere incubatedwith 170 μMNAD+
and 100 μM p53 fluorogenic peptide for 30 min at 37 °C followed by incubation indeveloper for 15 min at 37 °C. HeLA cell lysate were used as positive control in the SIRT1enzyme assay. Moreover, following Fluor de Lys kit standard SIRT1 assay procedure,specific SIRT1 inhibitor (nicotinamide 500 μM) and activator (resveratrol 29 μM) wereincubated for 60 and 30min at 37 °Cwith untreated EPC lysate as a negative and positivecontrols, respectively. Fluorescencewasmeasured by excitation at 360 nm and emissionat 460 nm and enzymatic activity was expressed as relative fluorescence units.
2.7. 2-DIGE and mass spectrometer analysis
2-D DIGE andMALDI-ToF/ToF mass spectrometer analysis were performed with theservice offered by Applied Biomics. The protocol for sample preparationwas carried outaccording to the standard Applied Biomics protocol (Applied Biomics). Briefly, cellmonolayers were washed twice with PBS or cell washing buffer (10 mM Tris–HCl, 5 mMmagnesium acetate, pH 8.0). After the second wash, a small volume of cell washingbuffer was added to the plates (1 ml for each 100-mm plate), and cells were scrapedfrom the plates. The scraped cells were transferred to eppendorf tubes, and cells arepelleted by a 1-minute spin at low speed. Cell lysates were prepared with a lysis buffer50 mM HEPES pH7.4, 0.1%, CHAPS, 0.1 mM EDTA, 0.1% NP-40, 1 μg/ml leupeptin, 1 μg/mlaprotinin, 1 μg/ml pepstatin, and 1 mM PMSF. Samples were simultaneously separatedon a single 2-D gel, using isoelectric focusing (IEF) in the first dimension (pH gradient 3–10L) and SDS-polyacrylamide gel electrophoresis (10.5% acrylamide) in the seconddimension. After electrophoresis, the gel was scanned using Typhoon scanner to obtaina comparative analysis and accurate measurement of differential protein expression.Proteins of interest were automatically picked out from the 2-D gel with Ettan SpotPicker and transferred for protein identification. The protein spots were then subjectedto in-gel digestion to enable identification by MALDI-ToF/ToF Mass Spectrometer.Analysis were doubled checked by 2-dimensional (2-D) gel electrophoresis and massspectrometry performed in our laboratories following Applied Biomics protocol forsample preparation and 2D-gel electrophoresis. Mass spectrometry analysis of spots ofinterest was performed as described by Lionetti et al. [30].
2.8. RNA extraction, microarrays analysis, and RT-PCR
Total RNAs were extracted from cultured cells using Trizol™ solution (Invitrogen),according to the manufacturer's instructions. The integrity of the RNA was assessed bydenaturing agarose gel electrophoresis (virtual presence of sharp 28S and 18S bands) andspectrophotometry [31,32]. 5 μg total RNA was used as starting material for the cDNApreparation. The first and second strand cDNA synthesis was performed using theGeneChip One-Cycle cDNA Synthesis Kit (Affymetrix). Labeled cRNA was prepared usingthe GeneChip IVT Labeling Kit (Affymetrix) according to the manufacturer's instructions.Following the IVT reaction, the unincorporated nucleotides were removed using RNeasycolumns (Qiagen) [31,32]. 15 μg of cRNA was used for hybridization onto the AffymetrixHuman Genome U133 2.0 probe array cartridge. The washing and staining procedure wasperformed in theAffymetrix Fluidics Station450.Theprobearrayswere scannedat560nmusing a confocal laser-scanningmicroscope (GeneChip® Scanner 3000). The readings fromthe quantitative scanning were analyzed by the Affymetrix Gene Expression AnalysisSoftware [32]. RNAwas reverse transcribedwith Superscript III (Invitrogen) using1 μg totalRNA and 100 ng randomprimers. Primer sequences and corresponding PCR conditions areshown in the online supplementary data (Table A, supplementary data). The intensity ofthe amplified bands was quantified by densitometry (Quantity One, Bio-Rad) and referredto that obtained through normalization with an amplified fragment specific for thehousekeeping gene glyceraldehydes-3-phophate deydrogenase (GAPDH).
2.9. Ontology assessment
We subjected the list of differentially expressed transcripts to gene ontology usingDAVID (Database for Annotation, Visualization and Integrated Discovery), Web-basedapplications (http://david.abcc.ncifcrf.gov) that allows access to a relational database offunctional annotation [33].

938 M.L. Balestrieri et al. / Biochimica et Biophysica Acta 1784 (2008) 936–945
2.10. Statistical analysis
Data are given as mean±SE. Differences were assessed by T-test and a P value lessthan 0.05 was considered to be significant.
3. Results
3.1. High glucose impairment of human EPC number
High glucose levels accelerate EPC senescence and impair numberand the functional activities [24,29,34] starting at glucose concentrationof 15 mmol/l [34]. Accordingly, FACS computed counting (Fig. 1) andmicroscope counting (Fig. 1B) of EPC positive for DiLDL/lectin dualstaining revealed that short-term incubation for 3 dayswithhigh glucose(15mmol/l) determined a consistent decrease of EPC number comparedto control cells (Pb0.05 vs. untreated control cells). Differently from long-term culture of EPCs with high glucose [25], results showed impairmentonly in the number and not in the morphology of EPCs (Fig. 1B).
3.2. Effect of glucose on Sirt1 expression levels and activity in human EPCs
To examine the role of SIRT1 in the high glucose-induced impair-ment of EPC levels, we first assessed the basal expression levels duringshort-term culture under basal conditions. Our observations were notextended to long-term culture where EPCs show different morphol-ogy and phenotypic features. EPCs express SIRT1 with a significantincrease at day 3 of culture (Pb0.05 vs. control cells) (Fig. 2A). How-ever, expression levels were reduced by treatment with high glucose(Pb0.05 vs. control cells) (Fig. 2B) and this was reflected also in aconsistent reduction of SIRT1 activity (Pb0.05 vs. control cells)(Fig. 2C). Indeed, results indicated that the enzyme activity decreasedfrom 1105±150 (AFU/μg protein) in control cells to 711±141 (AFU/μgprotein) in glucose-treated cells (Pb0.05). HeLa cells were used aspositive control in the in vitro enzyme assay. Moreover, nicotinamideand resveratrol, which are specific SIRT1 inhibitor and activator, re-spectively, were used as additional controls during the in vitro enzymeassay. Results indicated that SIRT1 activity of control untreated EPC(1105±150 AFU/μg protein) was inhibited by in vitro incubation withnicotinamide (415±71 AFU/μg protein) (Pb0.05 vs. control cells) and
Fig. 1. Effect of glucose on human EPC number. DiLDL uptake and lectin binding staining of isodetermined by FACS-computed counting (A) and fluorescencemicroscopy (B) Microscope fielcells was calculated by counting cells in each sub-field. EPC number was expressed as percentdouble positive for DiLDL and lectin staining (arrows) are representative 3 different experim
activated by resveratrol (1715±180 AFU/μg protein) (Pb0.05 vs.control cells) (Fig. 2D).
3.3. Modulation of FoxO1 expression in EPC treated with glucose
Differentiation of EPCs occurs through the modulation of FoxO1transcription factors [25]. Indeed, SIRT1, which is highly expressed in thevasculature duringblood vessel growth, controls the angiogenic activityofendothelial cells via deacetylation of the FoxO1 [10,35]. The post-trans-lational modification controlling FoxO1 activity is the acetylation\deacetylation on K242 and K262 residues, known to be regulated byCBP (acetylase) and SIRT1 (deacetylase) [36]. To investigate whetherexposure of EPCs to high glucose concentrations affects SIRT1-mediateddeacetylation of FoxO1,wedetermined the expression levels of FoxO1andacetyl-FoxO1 in EPCs. Results showed that the total FoxO1 expressionlevels remain constant during EPC culture under these conditions (Fig. 3).However, acetylation of FoxO1 on K262 residue was significantlyincreased following high glucose treatment (Pb0.05 vs. untreated controlcells) (Fig. 3B), and this was consistent with the reduction of SIRT1expression levels and activity observed (Fig. 2B and C).
To further substantiate a role of SIRT1-mediated deacetylation ofFoxO1 in high glucose-treated EPCs, we employed modulators of SIRT1activity during cell treatment and measured the expression levels ofacetyl-FoxO1. Results indicated that activation of SIRT1 by resveratrolwas reflected in a significant decrease of acetyl-FoxO1 expression levels(Pb0.05 vs. untreated control cells and Pb0.05 vs. glucose) (Fig. 3C),whether in the presence of SIRT1 inhibitors such as, nicotinamide andsuramine, was observed an increase of acetyl-FoxO1 expression levels(Fig. 3C). Consistent with previous reports [10], incubation of cells withSIRT1 inhibitors led to a marked increase in FoxO1 acetylation, sug-gesting that both SIRT1 and some unidentified class I/II HDAC regulatethe acetylation levels of FoxO1 in EPCs.
3.4. p14ARF and p16INK4A expression in EPCs
SIRT1 exerts protective effects against endothelial dysfunction bypreventing stress-induced premature senescence [8]. In addition,incubation of EPCs with high glucose for 4 days has been reported to
lated EPCs from PBMCs untreated and treated with glucose (15 mmol/l) for 3 days wered imagewas divided in 120 sub-fields and total number of double positive Dil LDL/Lectinage of cells positive for DilLDL/Lectin dual staining. Micrographs in panel B showing EPCsents in duplicate. Data are expressed as mean±SE. ⁎Pb0.05 vs. untreated control.

Fig. 2. SIRT1 expression levels and activity in human EPCs exposed to high glucose. (A) SIRT1 expression levels determined by Western blot analysis of cell lysates from PBMCscultured for 3 days under basal conditions. SIRT1 basal levels were determined at day 0 and day 3, as described under Materials and methods. (B) SIRT1 expression levels afterculturing EPCs for 3 days with media alone (control) or glucose (15 mmol/l). γ-tubulin served as loading control. (C) SIRT1 enzyme assay of EPCs treated with or without glucose(15mmol/l) for 3 days. HeLa cells were used as positive control. (D); nicotinamide (500 μM) and resveratrol (29 μM)were used as specific inhibitor and activator of SIRT1 in cell lysatesfrom untreated EPCs. Data are expressed as mean±SE (n=4), ⁎Pb0.05 vs. untreated control; §Pb0.01 vs. untreated control.
939M.L. Balestrieri et al. / Biochimica et Biophysica Acta 1784 (2008) 936–945
significantly enhance the percentage of senescence-associated β-galactosidase-positive EPCs [37]. A gene implicated in the senescenceprogram, p19ARF (p14ARF in human cells), requires SIRT1 during repli-cative senescence in response to chronic genotoxic stress in mouseembryonic fibroblast [38]. This protein is encoded by a partiallyoverlapping alternative reading frame at the p16INK4A locus encodingfor p16INK4A tumor suppressor protein, known to transduce senes-
Fig. 3. Detection of FoxO1 and acetyl FoxO1 expression levels. (A) total FoxO1 and (B) ace(C) acetyl FoxO1 expression in EPCs cultured for 3 days with media alone (control), with gluc29 μM), nicotinamide (Nam, 500 μM), or suramine (Sur, 50 μM). Total FoxO1 and γ-tubulin secontrol; ⁎Pb0.05 vs. glucose.
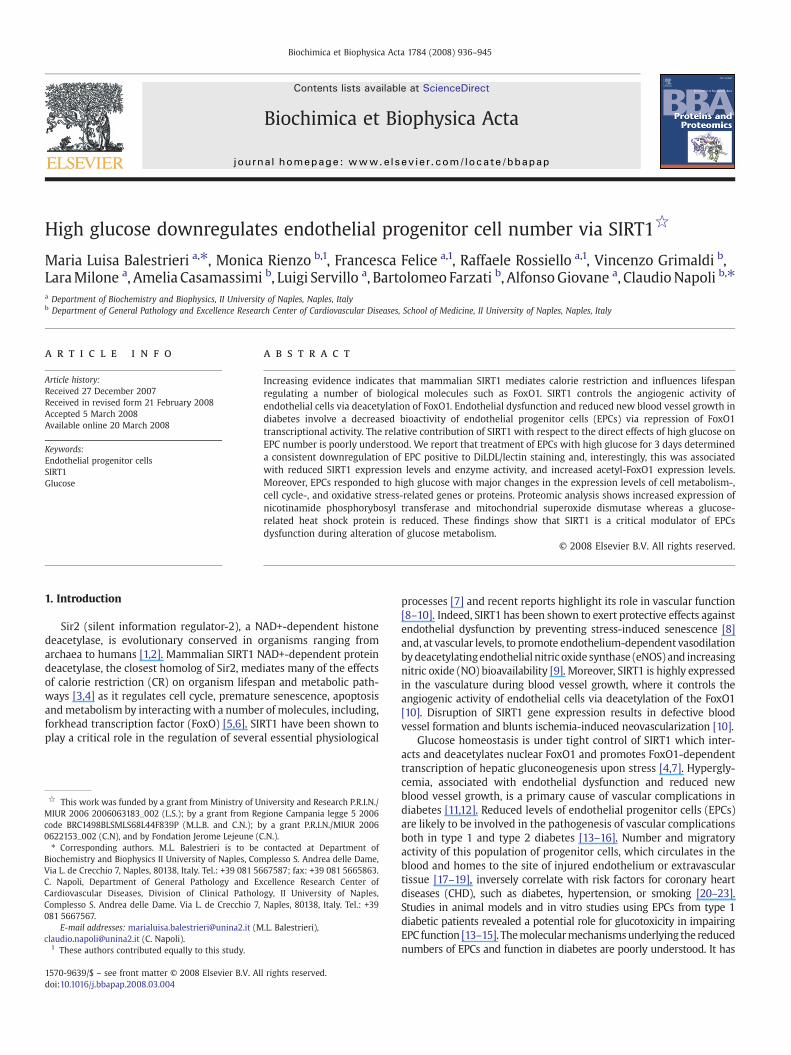
cence-signals or mediate entrance of cell into senescence [39]. Whenwe tested possible involvement of mediators of replicative senes-cence, p14ARF and p16INK4A, during the high-glucose treatment ofEPCs, results revealed that the expression levels of p14ARF andp16INK4A did not significantly change either during short-term cultureunder basal conditions (Fig. 4A, C) and in the presence of high-glucoseconcentrations (Fig. 4B, D).
tyl FoxO1 expression in EPCs treated with or without glucose (15 mmol/l) for 3 days;ose (15 mmol/l) in the presence or absence of 1 h pre-treatment with resveratrol (Resv,rved as loading controls. Data are expressed as mean±SE (n=6). §Pb0.05 vs. untreated
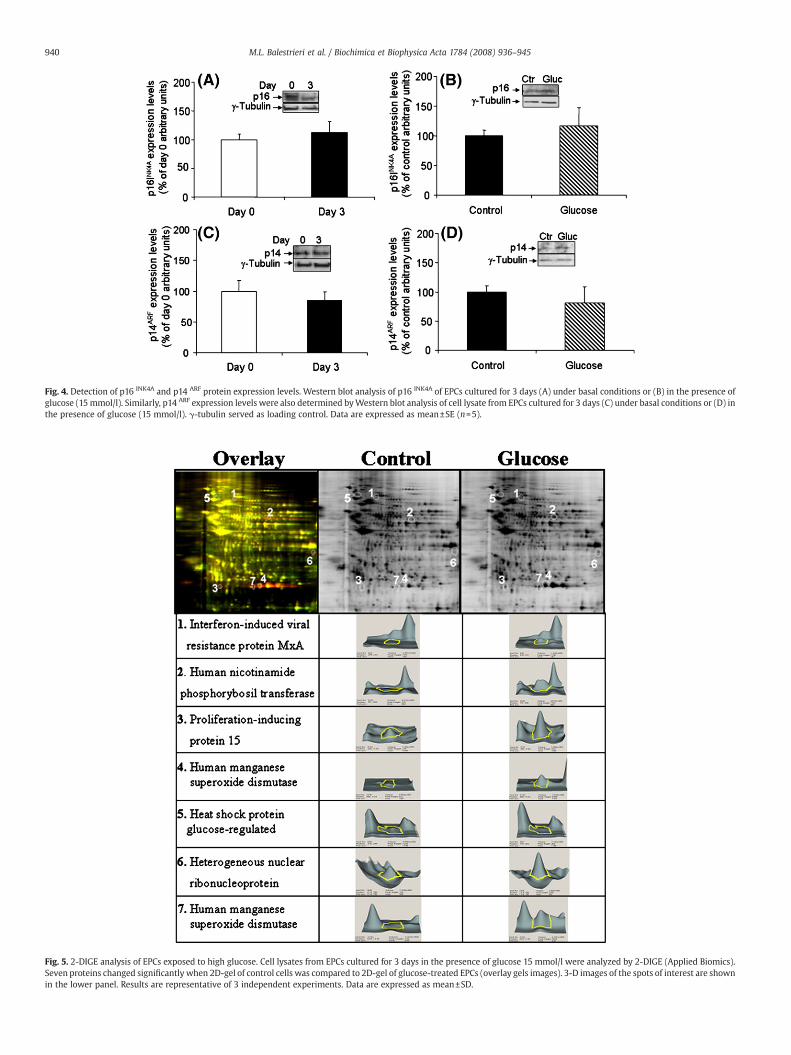
Fig. 4. Detection of p16 INK4A and p14 ARF protein expression levels. Western blot analysis of p16 INK4A of EPCs cultured for 3 days (A) under basal conditions or (B) in the presence ofglucose (15 mmol/l). Similarly, p14 ARF expression levels were also determined byWestern blot analysis of cell lysate from EPCs cultured for 3 days (C) under basal conditions or (D) inthe presence of glucose (15 mmol/l). γ-tubulin served as loading control. Data are expressed as mean±SE (n=5).
Fig. 5. 2-DIGE analysis of EPCs exposed to high glucose. Cell lysates from EPCs cultured for 3 days in the presence of glucose 15 mmol/l were analyzed by 2-DIGE (Applied Biomics).Seven proteins changed significantly when 2D-gel of control cells was compared to 2D-gel of glucose-treated EPCs (overlay gels images). 3-D images of the spots of interest are shownin the lower panel. Results are representative of 3 independent experiments. Data are expressed as mean±SD.
940 M.L. Balestrieri et al. / Biochimica et Biophysica Acta 1784 (2008) 936–945
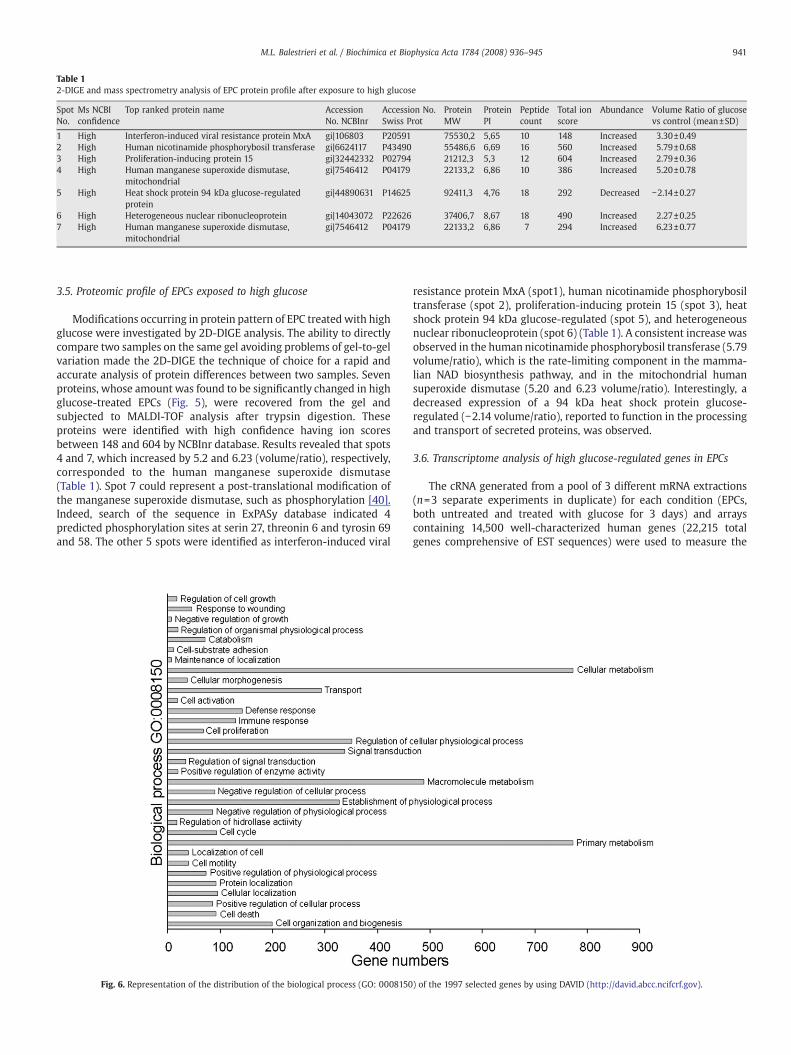
Table 12-DIGE and mass spectrometry analysis of EPC protein profile after exposure to high glucose
SpotNo.
Ms NCBIconfidence
Top ranked protein name AccessionNo. NCBInr
Accession No.Swiss Prot
ProteinMW
ProteinPI
Peptidecount
Total ionscore
Abundance Volume Ratio of glucosevs control (mean±SD)
1 High Interferon-induced viral resistance protein MxA gi|106803 P20591 75530,2 5,65 10 148 Increased 3.30±0.492 High Human nicotinamide phosphorybosil transferase gi|6624117 P43490 55486,6 6,69 16 560 Increased 5.79±0.683 High Proliferation-inducing protein 15 gi|32442332 P02794 21212,3 5,3 12 604 Increased 2.79±0.364 High Human manganese superoxide dismutase,
mitochondrialgi|7546412 P04179 22133,2 6,86 10 386 Increased 5.20±0.78
5 High Heat shock protein 94 kDa glucose-regulatedprotein
gi|44890631 P14625 92411,3 4,76 18 292 Decreased −2.14±0.27
6 High Heterogeneous nuclear ribonucleoprotein gi|14043072 P22626 37406,7 8,67 18 490 Increased 2.27±0.257 High Human manganese superoxide dismutase,
mitochondrialgi|7546412 P04179 22133,2 6,86 7 294 Increased 6.23±0.77
941M.L. Balestrieri et al. / Biochimica et Biophysica Acta 1784 (2008) 936–945
3.5. Proteomic profile of EPCs exposed to high glucose
Modifications occurring in protein pattern of EPC treated with highglucose were investigated by 2D-DIGE analysis. The ability to directlycompare two samples on the same gel avoiding problems of gel-to-gelvariation made the 2D-DIGE the technique of choice for a rapid andaccurate analysis of protein differences between two samples. Sevenproteins, whose amount was found to be significantly changed in highglucose-treated EPCs (Fig. 5), were recovered from the gel andsubjected to MALDI-TOF analysis after trypsin digestion. Theseproteins were identified with high confidence having ion scoresbetween 148 and 604 by NCBInr database. Results revealed that spots4 and 7, which increased by 5.2 and 6.23 (volume/ratio), respectively,corresponded to the human manganese superoxide dismutase(Table 1). Spot 7 could represent a post-translational modification ofthe manganese superoxide dismutase, such as phosphorylation [40].Indeed, search of the sequence in ExPASy database indicated 4predicted phosphorylation sites at serin 27, threonin 6 and tyrosin 69and 58. The other 5 spots were identified as interferon-induced viral
Fig. 6. Representation of the distribution of the biological process (GO: 0008150
resistance protein MxA (spot1), human nicotinamide phosphorybosiltransferase (spot 2), proliferation-inducing protein 15 (spot 3), heatshock protein 94 kDa glucose-regulated (spot 5), and heterogeneousnuclear ribonucleoprotein (spot 6) (Table 1). A consistent increase wasobserved in the human nicotinamide phosphorybosil transferase (5.79volume/ratio), which is the rate-limiting component in the mamma-lian NAD biosynthesis pathway, and in the mitochondrial humansuperoxide dismutase (5.20 and 6.23 volume/ratio). Interestingly, adecreased expression of a 94 kDa heat shock protein glucose-regulated (−2.14 volume/ratio), reported to function in the processingand transport of secreted proteins, was observed.
3.6. Transcriptome analysis of high glucose-regulated genes in EPCs
The cRNA generated from a pool of 3 different mRNA extractions(n=3 separate experiments in duplicate) for each condition (EPCs,both untreated and treated with glucose for 3 days) and arrayscontaining 14,500 well-characterized human genes (22,215 totalgenes comprehensive of EST sequences) were used to measure the
) of the 1997 selected genes by using DAVID (http://david.abcc.ncifcrf.gov).

942 M.L. Balestrieri et al. / Biochimica et Biophysica Acta 1784 (2008) 936–945
effects of high glucose treatment on EPCs transcriptome. Genesregulated significantly (i.e., which have a threshold of 50 arbitrarydetection unit and absolute fold change (FC) value greater than 1) havebeen included in thewhole list of genes. The FC value can be calculatedas FC=2[Signal Log Ratio (SLR)] in a gene expression analysis. The SLRalgorithm measures the magnitude and direction of change betweentranscription level of the experimental and baseline chips. The use oflogs in the analysis between the probe sets eliminates difficultiescaused by very high data point in the set (masking information fromlower valued data points). Base 2 is used as the log scale, therefore aSLR of 1 represents a two-fold increase in abundance of an mRNA anda value of –1 represents a two-fold reduction in transcription ex-pression value (see supplementary data whole list of genes). Overall,high glucose treatment decreased transcription of 1772 genes andincreased transcription of 455 genes. The 2227 genes were used foranalysis of biological processes. The differentially expressed genesrelated to high glucose treatmentwere assigned to functional profiles byusing DAVID. Sufficient information was available for 1997 of the 2227genes. The 1997 annotated genes exhibited a wide range of functions(Fig. 6). Genes involved in “cell organization”, “biogenesis”, “cell death”,“primary metabolism”, “signal transduction”, “cell cycle”, “immune re-sponse”, and “transport”were targeted. Some genes are listed inTable 2.
Table 2Genes regulated by high glucose in EPC treated with glucose versus control
RefSeq_mRNA Gene title Gene ontology (
NM_002127 HLA-G histocompatibility antigen, class I, G Antigen processclass I
NM_000041 Apolipoprotein E Response to reaNM_007355 Heat shock protein 90 kDa alpha (cytosolic), class B
member 1Protein folding
NM_005803 Flotillin 1 UnknownNM_001953 Endothelial cell growth factor 1 (platelet-derived) Mitochondrial gNM_001031696 Phospholipase D family, member 3 MetabolismNM_001428 Enolase 1, (alpha) GlycolysisNM_000391 Tripeptidyl peptidase I ProteolysisNM_001025234 Tetraspanin 4 Protein complexNM_001375 Deoxyribonuclease II, lysosomal DNA metabolicNM_005761 Plexin C1 Cell adhesionNM_013392 Nuclear receptor binding protein 1 Protein amino aNM_015675 Growth arrest and DNA-damage-inducible, beta Regulation of prNM_021975 RelA/p65 Regulation of trNM_005507 Cofilin 1 (non-muscle) Anti-apoptosisNM_001803 CD52 molecule GPI anchor bindNM_000546 Tumor protein p53 Regulation of prNM_005273 Guanine nucleotide binding protein (G protein), beta
polypeptide 2Signal transduct
NM_002939 Ribonuclease/angiogenin inhibitor 1 RNA catabolismNM_001012479 Granulin Signal transductNM_002015 Forkhead box O1A (rhabdomyosarcoma) TranscriptionNM_020451 Seelenoprotein N, 1 UnknownNM_001040118 Centaurin, delta 2 Signal transductNM_006197 Pericentriolar material 1 Electron transpoNM_001024646 CDC-like kinase 1 Regulation of prNM_001304 Carboxypeptidase D ProteolysisNM_002994 Chemokine (C-X-C motif) ligand 5 ChemotaxisNM_004049 BCL2-related protein A1 ApoptosisNM_019555 Rho guanine nucleotide exchange factor (GEF) 3 Regulation of RhNM_000245 Met proto-oncogene (hepatocyte growth factor receptor) Activation of MANM_003855 Interleukin 18 receptor 1 Immune responNM_181782 Nuclear receptor coactivator 7 Cell wall cataboNM_022168 Interferon induced with helicase C domain 1 Immune responNM_002214 Integrin, beta 8 Cell adhesionNM_016323 Hect domain and RLD 5 Regulation of cyNM_006417 Interferon-induced protein 44 Immune responNM_007115 Tumor necrosis factor, alpha-induced protein 6 Inflammatory reNM_052942 Guanylate binding protein 5 Immune respon
The results are expressed as both the signal log ratio (SLR) and the direction of the change, i.list of genes (see supplementary Data) which includes only genes that have the threshold ovalue in a gene expression can be calculated as FC=2[Signal Log Ratio (SLR)]. The SLR algorithexperimental and baseline chips.
Importantly, several genes involved in insulin signaling pathway werealso differentially expressed (Fig. 7). Among these, downregulation wasobserved in several cell metabolism- and response to reactive oxygenspecies-relate genes, whereas genes related to cell cycle, apoptosis, andinflammation were upregulated by high glucose exposure. To validatedata obtainedbymicroarrayanalysis,weperformedsemiquantitativeRT-PCR on differentially expressed genes. As shown in Fig. 7 and Table 2 theexpression levels of gene selected andanalysedbyRT-PCRwere similar tothose observed on the microarray panels. Table B (supplementary data)shows representative gene expression levels confirmed by RT-PCR.
4. Discussion
The results of the present study reveal the novel role of SIRT1 in thedownregulation of EPC levels during short-term exposure to highglucose.We show that SIRT1 is expressed in EPCs during culture underbasal conditions and that the presence of high glucose reduces SIRT1expression levels and enzyme activity. In addition, a parallel increasein acetyl-FoxO1 expression levels relates to SIRT1 dowregulation byhigh glucose in EPCs. Indeed, changes in the acetyl-FoxO1 levelsrespond to treatment of EPCs with SIRT1 inhibitor, nicotinamide, oractivator, resveratrol.
Biological process) Glucose vsControl (SLR)
Chromosomallocation
ing and presentation of peptide antigen via MHC 3,0 D chr6p21.3
ctive oxygen species 2,8 D chr19q13.22,7 D chr6p12
2,6 D chr6p21.3enome maintenance 2,4 D chr22q13|22q13.33
2,3 D chr19q13.22,3 D chr1p36.3-p36.22,2 D chr11p15
assembly 2,1 D chr11p15.5process 2,0 D chr19p13.2
1,9 D chr12q23.3cid phosphorylation 1,8 D chr2p23ogression through cell cycle 1,7 D chr19p13.3anscription, DNA-dependent 1,7 D chr11q13
1,6 D chr11q13ing 1,5 D chr1p36ogression through cell cycle 1,5 D chr17p13.1ion 1,4 D chr7q21.3-q22.1|
7q221,3 D chr11p15.5
ion 1,2 D chr17q21.321,1 D chr13q14.11,1 D chr1p36.13
ion 1,0 D chr11q13.4rt 1,0 I chr8p22-p21.3ogression through cell cycle 1,0 I chr2q33
1,1 I chr17q11.21,3 I chr4q12-q131,2 I chr15q24.3
o protein signal transduction 1,3 I chr3p21-p13PK activity 1,4 I chr7q31se 1,5 I chr2q12lism 1,6 I chr6q22.31-q22.32se 1,7 I chr2q24
1,9 I chr7p15.3clin-dependent protein kinase activity 2,0 I chr4q22.1se 2,2 I chr1p31.1sponse 2,4 I chr2q23.3se 2,5 I chr1p22.2
e. an increase (I), a decrease (D). These genes are representative of the significant wholef 50 arbitrary detection unit and absolute fold change (FC) value greater than 1. The FCm measures the magnitude and direction of change between transcript levels of the

Fig. 7. Diagram of insulin signaling pathway showing (DAVID/KEGG database) genes regulated by high glucose in EPCs. Red marked genes are those reported in the complete list ofgenes (see supplementary data). Abbreviations; D, decrease; I, increase.
943M.L. Balestrieri et al. / Biochimica et Biophysica Acta 1784 (2008) 936–945
SIRT1 is the closest mammalian homolog of the yeast protein Sir2known to be involved in aging. While it is not clear whether SIRT1similarly regulates ageing and longevity inmammals, it has been showntoplaya central role in regulating cellulardifferentiation and senescenceand to controlmetabolic pathways in response to nutrient availability ina wide variety of tissues [7]. Indeed, SIRT1, which is highly expressed inthe vasculature during blood vessel growth, controls the angiogenicactivity of endothelial cells via deacetylation of FoxO1 [10,35]. Theresults of the present study expand observations of SIRT1 involvementin the angiogenic activity of endothelial cells to circulating EPCs,suggesting that modulation of SIRT1 signaling pathway could take partin the reduction of number of EPCs during the short-term presence ofhigh glucose.
Endothelial dysfunction and reduced new blood vessel growthduring vascular complications in either type 1 or type 2 diabetes[11,13,14] is strictly related to altered number and function ofcirculating EPCs [23]. In the present study, as previously described[34,37], a high glucose (15–25 mmol/l) cell culture model was used tosimulate clinical hyperglycemia for the in vitro evaluation of EPCnumber. The glucose concentration used (15–25 mmol/l) correspondsto about 350mg/dl of serumglucose levels (5–5.5mmol/l, correspondsto 100 mg/dl and 20–24 mmol/l corresponds to 434 mg/dl).Amelioration of EPC levels and functional activities can be achievedwith drug therapy (statin, vardenafil puerarin, and Ginkgo biloba) [41]andwith physical exercise [42], and, as recently suggested, by redwineantioxidants and pure resveratrol [43,44]. More in details, improve-ment of EPC functional activity during autologous bone marrow cellintervention in combination with metabolic treatment containing L-arginine has been shown to occur via decreased cellular senescenceand improved CXCR4 expression levels in hypertensive rats [45].
Our results, revealing that downregulation of SIRT1 expression andactivity occurs during exposure of EPCs to high glucose and that thiscorrelates to increased acetyl-FoxO1 levels, complete the picturedescribing the mechanism involved in the impairment of EPC number.Indeed, high glucose downregulates EPC levels via inhibition of thetranscriptional activity of FoxO1 [25]. FoxO1 is highly expressed in thevascular endothelium and has been shown to be an essential negativetranscriptional regulator of embryonic and postnatal vessel formation[35,46]. In endothelial cells SIRT1 binds, deacetylates and represses thetranscriptional activity of FoxO1 and, thus, point to this transcriptionfactor as an effector in the SIRT1-dependent angiogenic signallingpathway. The effects of SIRT1 on FoxO1 function vary depending on cell
type and FoxO1 target genes. Indeed, the mode of FoxO1 regulation bySIRT1 remains controversial, with some data suggesting that deacetyla-tion decreases [47] and others that it increases FoxO activity [36]. Ourfindings in intact EPCs suggest that the increased levels acetyl-FoxO1 byhigh glucose were reduced or further increased by SIRT1 activators orinhibitors, respectively. The potential role of resveratrol as a possiblemodulator of SIRT1 signaling pathway in high-glucose impaired EPCslevels is of interest. Indeed, we have recently demonstrated that pureresveratrol or resveratrol and other antioxidants contained in red winehave a beneficial effect on EPC number in vitro and in vivo [43,44].
Excessive generation of reactive oxygen species (ROS) mediated bythe mitochondrial and/or NAD(P)H oxidase may contribute to endo-thelial dysfunction and play a critical role in the progressive dete-rioration of vessel structure and function in patients with diabetes[48]. Hyperglycemia-induced overproduction of ROS was used toexplain EPC impairments observed in clinical diabetes [48]. However,it is also suggested that human EPCs, with high intrinsic expression ofantioxidant enzymes such as manganese superoxide dismutase, couldtolerate oxidative stress [49].
We studiedmajor changes induced by high glucose on EPCs. Analysisof proteome and transcriptome profiles were aimed to identify possibleSIRT1-relatedproteins and genesmodulated by high glucose. Significantchanges were observed in the expression levels of cell metabolism-,cell cycle-, and oxidative stress-related genes or proteins. In particular,among these genes SENP1 [50], p53 [51], RelA/p65 [52] have beenreported to be involved in the SIRT1 signaling cascade.
Moreover, a nicotinamide phosphorybosil transferase, the rate-limit-ing component in the mammalian NAD biosynthesis pathway, and themitochondrial humansuperoxidedismutase expression increasedduringhigh glucose treatment, whereas the expression of a glucose-related heatshock protein was inhibited. The increased expression of superoxidedismutase couldenhanced the tolerabilityof EPCs to increasedexogenousoxidative stress [49], which may contribute to their ability to engraftwithin ischemic tissue during vasculogenesis [53]. On the other hand,supplementationwith vitamin C, or cell-permeable antioxidant enzymesall failed to ameliorate the adverse effects of long-term exposure of EPCsto high glucose [37] and impaired NO, suggesting the role of othermechanisms rather than activated oxidative stress-related mechanismsasmain contributor to the in vitro high glucose-induced EPC dysfunction[37]. Further studies are still necessary to investigate the causal role ofthese genes (and relative coded proteins) in the downregulation of EPCnumber via SIRT1 signaling pathway after exposure to high glucose.
944 M.L. Balestrieri et al. / Biochimica et Biophysica Acta 1784 (2008) 936–945
The findings of the present study suggest SIRT1 as a novel regulatorof EPC levels during altered glucose homeostasis. Given the role of SIRT1as ametabolic sensor regulating glucosemetabolism, themodulation ofSIRT1 activity and/or expression might provide an opportunity forcounteracting impairment of EPC levels and functionality associatedwith ageing, cardiovascular risk factors and hyperglicemia, and couldrepresent a potential therapeutic target for vascular-relateddiseases andthe prevention of diabetes complications.
Appendix A. Supplementary data
Supplementary data associated with this article can be found, inthe online version, at doi:10.1016/j.bbapap.2008.03.004.
References
[1] M. Kaeberlein, M. McVey, L. Guarente, The SIR2/3/4 complex and SIR2 alonepromote longevity in Saccharomyces cerevisiae by two different mechanisms,Genes Dev. 13 (19) (1999) 2570–2580.
[2] L. Guarente, F. Picard, Calorie restriction-the SIR2 connection, Cell 120 (4) (2005)473–482.
[3] E. Nisoli, C. Tonello, A. Cardile, V. Cozzi, R. Bracale, L. Tedesco, S. Falcone, A. Valesrio,O. Cantoni, E. Clementi, S. Moncada, M.O. Carruba, Calorie restriction promotesmitochondrial biogenesis by inducing the expression of eNOS, Science 310 (5746)(2005) 314–317.
[4] L. Guarante, Sirtuins as potential targets for metabolic syndrome, Nature 444(7121) (2006) 868–874.
[5] F. Picard, M. Kurtev, N. Chung, A. Topark-Ngarm, T. Senawong, R. Machado DeOliveira, M. Leid, M.W. McBurney, L. Guarente, Sirt1 promotes fat mobilization inwhite adipocytes by repressing PPAR-gamma, Nature 429 (6993) (2004) 771–776.
[6] A. Brunet, L.B. Sweeney, J.F. Sturgill, K.F. Chua, P.L. Greer, Y. Lin, H. Tran, S.E. Ross, R.Mostoslavsky, H.Y. Cohen, L.S. Hu, H.L. Cheng, M.P. Jedrychowski, S.P. Gygi, D.A.Sinclair, F.W. Alt, M.E. Greenberg, Stress-dependent regulation of FOXO transcriptionfactors by the SIRT1 deacetylase, Science 303 (5666) (2004) 2011–2015.
[7] L. Bordone, L. Guarente, Calorie restriction SIRT1 and metabolism: understandinglongevity, Nat. Rev. Mol. Cell Biol. 6 (4) (2005) 298–305.
[8] H. Ota, M. Akishita, M. Eto, K. Iijima, M. Kanei, Y. Ouchi, Sirt1 modulates prematuresenescence-like phenotype in human endothelial cells, J. Mol. Cell. Cardiol. 43 (5)(2007) 571–579.
[9] I.Mattagajasingh,C.S.Kim,A.Naqvi, T. Yamamori, T.A.Hoffman, S.B. Jung, J.DeRicco,K.Kasuno, K. Irani, SIRT1 promotes endothelium-dependent vascular relaxation byactivating endothelial nitric oxide synthase, Proc. Natl. Acad. Sci. U. S. A. 104 (37)(2007) 14855–14860.
[10] M. Potente, L. Ghaeni, D. Baldessari, R. Mostoslavsky, L. Rossig, F. Dequiedt, J.Haendeler, M. Mione, E. Dejana, F.W. Alt, A.M. Zeiher, S. Dimmeler, SIRT1 controlsendothelial angiogenic functions during vascular growth, Genes Dev. 21 (20)(2007) 2644–2658.
[11] A. Abaci, A. Oguzhan, S. Kahraman, N.K. Eryol, S. Unal, H. Arinc, A. Ergin, Effect ofdiabetes mellitus on formation of coronary collateral vessels, Circulation 99 (17)(1999) 2239–2242.
[12] M.J. Sheetz, G.L. King, Molecular understanding of hyperglycemia's adverse effectsfor diabetic complications, Molecular understanding of hyperglycemia's adverseeffects for diabetic complications, JAMA 288 (20) (2002) 2579–2588.
[13] G.P . Fadini, M.Miorin, M. Facco, S. Bonamico, I. Baesso, F. Grego,M.Menegolo, de S.V.Kreutzenberg, A. Tiengo, C. Agostini, A. Avogaro, Circulating endothelial progenitorcells are reduced in peripheral vascular complications of type 2 diabetes mellitus,J. Am. Coll. Cardiol. 45 (9) (2005) 1449–1457.
[14] C.J. Loomans, E.J. deKoning, F.J. Staal,M.B. Rookmaaker, C.Verseyden,H.C. deBoer,M.C.Verhaar, B. Braam, T.J. Rabelink, A.J. van Zonneveld, Endothelial progenitor celldysfunction: a novel concept in the pathogenesis of vascular complications of type 1diabetes, Diabetes 53 (1) (2004) 195–199.
[15] O.M. Tepper, R.D. Galiano, J.M. Capla, C. Kalka, P.J. Gagne, G.R. Jacobowitz, J.P.Levine, G.C. Gurtner, Human endothelial progenitor cells from type II diabeticsexhibit impaired proliferation, adhesion, and incorporation into vascular struc-tures, Circulation 106 (22) (2002) 2781–2786.
[16] M. Ii, H. Takenaka, J. Asai, K. Ibusuki, Y. Mizukami, K. Maruyama, Y.S. Yoon, A.Wecker, C. Luedemann, E. Eaton, M. Silver, T. Thorne, D.W. Losordo, Endothelialprogenitor thrombospondin-1 mediates diabetes-induced delay in reendothelia-lization following arterial injury, Circ. Res. 98 (5) (2006) 697–704.
[17] C. Urbich, S. Dimmeler, Endothelial progenitor cells: characterization and role invascular biology, Circ. Res. 95 (4) (2004) 343–353.
[18] C. Napoli, A. Balestrieri, L.J. Ignarro, Therapeutic approaches in vascular repairinduced by adult bone marrow cells and circulating progenitor endothelial cells,Curr. Pharm, Des. 13 (31) (2007) 3245–3251.
[19] T. Takahashi, C. Kalka, H. Masuda, D. Chen, M. Silver, M. Kearney, M. Magner, J.M.Isner, T. Asahara, Ischemia- and cytokine-induced mobilization of bone marrow-derived endothelial progenitor cells for neovascularization, Nat. Med. 5 (4) (1999)434–438.
[20] J.M. Hill, G. Zalos, J.P. Halcox, W.H. Schenke, M.A. Waclawiw, A.A. Quyyumi, T.Finkel, Circulating endothelial progenitor cells, vascular function, and cardiovas-cular risk, N. Engl. J. Med. 348 (7) (2003) 593–600.
[21] C. Schmidt-Lucke, L. Rossig, S. Fichtlscherer, M. Vasa, M. Britten, U. Kamper, S.Dimmeler, A.M. Zeiher, Reduced number of circulating endothelial progenitor cellspredicts future cardiovascular events: proof of concept for the clinical importanceof endogenous vascular repair, Circulation 111 (22) (2005) 2981–2987.
[22] N. Werner, S. Kosiol, T. Schiegl, P. Ahlers, K. Walenta, A. Link, M. Bohm, G. Nickenig,Circulating endothelial progenitor cells and cardiovascular outcomes, N. Engl. J.Med. 353 (10) (2005) 999–1007.
[23] M. Vasa, S. Fichtlscherer, A. Aicher, K. Adler, C. Urbich, H. Martin, A.M. Zeiher, S.Dimmeler, Number and migratory activity of circulating endothelial progenitorcells inversely correlate with risk factors for coronary artery disease, Circ. Res. 89(1) (2001) E1–E7.
[24] S. Kuki, T. Imanishi, K. Kobayashi, Y. Matsuo, M. Obana, T. Akasaka, Hyperglycemiaaccelerated endothelial progenitor cell senescence via the activation of p38mitogen-activated protein kinase, Circ. J. 70 (8) (2006) 1076–1081.
[25] V. Marchetti, R. Menghini, S. Rizza, A. Vivanti, T. Feccia, D. Lauro, A. Fukamizu, R.Lauro, M. Federici, Benfotiamine counteracts glucose toxicity effects on endothe-lial progenitor cell differentiation via Akt/FoxO signalling, Diabetes 55 (8) (2006)2231–2237.
[26] A. Liguori, C. Fiorito, M.L. Balestrieri, E. Crimi, G. Bruzzese, S. Williams-Ignarro, M.D'Amora, L. Sommese, V. Grimaldi, P.B. Minucci, A. Giovane, B. Farzati, L.J. Ignarro,C. Napoli, Functional impairment of hematopoietic progenitor cells in patientswith coronary heart disease, Eur. J. Haematol. 80 (2008) 258–264.
[27] J. Ben-Shoshan, J. George, Endothelial progenitor cells as therapeutic vectors incardiovascular disorders: from experimental models to human trials, Pharmacol.Ther. 115 (1) (2007) 25–36.
[28] C. Napoli, C. Maione, C. Schiano, C. Fiorito, L.J. Ignarro, Bone marrow cell-mediatedcardiovascular repair: potential of combined therapies, Trends Mol. Med. 13 (7)(2007) 278–286.
[29] A. Casamassimi, M.L. Balestrieri, C. Fiorito, C. Schiano, C. Maione, R. Rossiello, V.Grimaldi, V. Del Giudice, C. Balestrieri, B. Farzati, V. Sica, C. Napoli, Comparisonbetween total endothelial progenitor cell isolation versus enriched Cd133+culture, J. Biochem. 141 (4) (2007) 503–511.
[30] V. Lionetti, A. Raiola, L. Camardella, A. Giovane, N. Obel, M. Pauly, F. Favaron, F.Cervone, D. Bellincampi, Overexpression of pectin methylesterase inhibitors inArabidopsis restricts fungal infection by Botrytis cinerea, Plant Physiol. 143 (4)(2007) 1871–1880.
[31] C. Napoli, F. de Nigris, J.S. Welch, F.B. Calara, R.O. Stuart, C.K. Glass, W. Palinski,Maternal hypercholesterolemia during pregnancy promotes early atherogenesis inLDL receptor-deficient mice and alters aortic gene expression determined bymicroarray, Circulation 105 (11) (2002) 1360–1367.
[32] C. Napoli, F. de Nigris, V. Sica, New advances in microarrays: finding the genescausally involved in disease, Methods Mol. Med. 108 (2005) 215–233.
[33] G. Dennis Jr, B.T. Sherman, D.A. Hosack, J. Yang, W. Gao, H.C. Lane, R.A. Lempicki,DAVID: Database for Annotation, Visualization, and Integrated Discovery, GenomeBiol. 4 (5) (2003) P3.
[34] F.H. Seeger, J. Haendeler, D.H. Walter, U. Rochwalsky, J. Reinhold, C. Urbich, L.Rossig, A. Corbaz, Y. Chvatchko, A.M. Zeiher, S. Dimmeler, p38 mitogen-activatedprotein kinase downregulates endothelial progenitor cells, Circulation 111 (9)(2005) 1184–1191.
[35] M. Potente, C. Urbich, K. Sasaki, W.K. Hofmann, C. Heeschen, A. Aicher, R. Kollipara,R.A. DePinho, A.M. Zeiher, S. Dimmeler, Involvement of Foxo transcription factorsin angiogenesis and postnatal neovascularization, J. Clin. Invest. 115 (9) (2005)2382–2392.
[36] H. Daitoku, M. Hatta, H. Matsuzaki, S. Aratani, T. Ohshima, M. Miyagishi, T.Nakajima, A. Fukamizu, Silent information regulator 2 potentiates Foxo1-mediatedtranscription through its deacetylase activity, Proc. Natl. Acad. Sci. 101 (27) (2004)10042–10047.
[37] Y.H. Chen, S.J. Lin, F.Y. Lin, T.C. Wu, C.R. Tsao, P.H. Huang, P.L. Liu, Y.L. Chen, J.W.Chen, High glucose impairs early and late endothelial progenitor cells bymodifying nitric oxide-related but not oxidative stress-mediated mechanisms,Diabetes 56 (6) (2007) 1559–1568.
[38] K.F. Chua, R. Mostoslavsky, D.B. Lombard, W.W. Pang, S. Saito, S. Franco, D. Kaushal,H.L. Cheng, M.R. Fischer, N. Stokes, M.M. Murphy, E. Appella, F.W. Alt, MammalianSIRT1 limits replicative life span in response to chronic genotoxic stress, CellMetab. 2 (1) (2005) 67–76.
[39] A.S. Lundberg, W.C. Hahn, P. Gupta, R.A. Weinberg, Genes involved in senescenceand immortalization, Curr. Opin. Cell Biol. 12 (6) (2000) 705–709.
[40] R.K. Hopper, S. Carroll, A.M. Aponte, D.T. Johnson, S. French, R.F. Shen, F.A.Witzmann, R.A. Harris, R.S. Balaban, Mitochondrial matrix phosphoproteome:effect of extra mitochondrial calcium, Biochemistry 45 (8) (2006) 2524–2536.
[41] F. Shantsila, T. Watson, G.Y. Lip, Endothelial progenitor cells in cardiovasculardisorders, J. Am. Coll. Cardiol. 49 (7) (2007) 741–752.
[42] U. Laufs, N.Werner, A. Link,M. Endres, S.Wassmann, K. Jurgens, E.Miche,M. Bohm,G.Nickenig, Physical training increases endothelial progenitor cells, inhibits neointimaformation, and enhances angiogenesis, Circulation 109 (2) (2004) 220–226.
[43] M.L. Balestrieri, C. Schiano, F. Felice, A. Casamassimi, A. Balestrieri, L. Milone, L.Servillo, C. Napoli, Effect of low doses of red wine and pure resveratrol oncirculating endothelial progenitor cells, J. Biochem. 143 (2008) 179–186.
[44] M.L. Balestrieri, C. Fiorito, E. Crimi, F. Felice, C. Schiano, L. Milone, A. Casamassimi,A. Giovane, V. Grimaldi, V. Del Giudice, P.B. Minucci, F.P. Mancini, L. Servillo, F.P.D'Armiento, B. Farzati, C. Napoli, Effect of red wine antioxidants and minorpolyphenolic constituents on endothelial progenitor cells after physical training inmice, Int J. Cardiol. (Feb 4 2008). [Electronic publication ahead of print] PMID:18255172.
[45] F. de Nigris, M.L. Balestrieri, S-W. Ignarro, F.P. D'Armiento, L.O. Lerman, R. Byrns, E.Crimi, A. Palagiano, V. Sica, L.J. Ignarro, C. Napoli, Therapeutic effects of autologous

945M.L. Balestrieri et al. / Biochimica et Biophysica Acta 1784 (2008) 936–945
bone marrow cells and metabolic intervention in the ischemic hindlimb ofspontaneously hypertensive rats involve reduced cell senescence and CXCR4/Akt/eNOS pathways, J. Cardiov. Pharmacol. 50 (4) (2007) 424–433.
[46] J.H. Paik, R. Kollipara, G. Chu, H. Ji, Y. Xiao, Z. Ding, L. Miao, Z. Tothova, J.W. Corner,D.R. Carrasco, S. Jiang, D.G. Gilliland, L. Chin, W.H. Wong, D.H. Castrillon, R.A.DePinho, FoxOs are lineage-restricted redundant tumor suppressors and regulateendothelial cell homeostasis, Cell 128 (2) (2007) 309–323.
[47] M.C. Motta, N. Divecha, M. Lemieux, C. Kamel, D. Chen, W. Gu, Y. Bultsma, M.McBurney, L. Guarente, Mammalian SIRT1 represses forkhead transcription factors,Cell 116 (4) (2004) 551–563.
[48] M. Brownlee, Biochemistry and molecular cell biology of diabetic complications,Nature 414 (6865) (2001) 813–820.
[49] E. Dernbach, C. Urbich, R.P. Brandes, W.K. Hofmann, A.M. Zeiher, S. Dimmeler,Antioxidative stress-associated genes in circulating progenitor cells: evidence
for enhanced resistance against oxidative stress, Blood 104 (12) (2004)3591–3597.
[50] Y. Yang, W. Fu, J. Chen, N. Olashaw, X. Zhang, S.V. Nicosia, K. Bhalla, W. Bai, SIRT1sumoylation regulates its deacetylase activity and cellular response to genotoxicstress, Nat. Cell Biol. 9 (11) (2007) 1253–1262.
[51] E.J. Kim, JH. Kho, M.R. Kang, S.J. Um, Active regulator of SIRT1 cooperates withSIRT1 and facilitates suppression of p53 activity, Mol. Cell 28 (2) (2007) 277–290.
[52] T. Bouras, M. Fu, A.A. Sauve, F. Wang, A.A. Quong, N.D. Perkins, R.T. Hay, W. Gu, R.G.Pestell, SIRT1 deacetylation and repression of p300 involves lysine residues 1020/1024 within the cell cycle regulatory domain 1, J. Biol. Chem. 280 (11) (2005)10264–10276.
[53] M.J. Callaghan, D.J. Ceradini, G.C. Gurtner, Hyperglycemia-induced reactive oxygenspecies and impaired endothelial progenitor cell function, Antioxid. Redox Signal.7 (11–12) (2005) 1476–1482.