Targeted Ablation of Oligodendrocytes Induces Axonal Pathology Independent of Overt Demyelination
Upload
independentCategory
view
0download
0
PDGF and FGF2 Regulate OligodendrocyteProgenitor Responses to Demyelination
Emma E. Frost,1 Joseph A. Nielsen,2 Tuan Q. Le,1 Regina C. Armstrong1,2
1 Department of Anatomy, Physiology and Genetics, Uniformed Services University of the HealthSciences, Bethesda, Maryland 20814-4799
2 Program in Molecular and Cell Biology, Uniformed Services University of the Health Sciences,Bethesda, Maryland 20814-4799
Received 18 January 2002; accepted 6 August 2002
ABSTRACT: Acute demyelination of adult CNS,resulting from trauma or disease, is initially followed byremyelination. However, chronic lesions with subse-quent functional impairment result from eventual fail-ure of the remyelination process, as seen in multiplesclerosis. Studies using animal models of successful re-myelination delineate a progression of events facilitatingremyelination. A universal feature of this repair processis extensive proliferation of oligodendrocyte progenitorcells (OPs) in response to demyelination. To investigatesignals that regulate OP proliferation in response todemyelination we used murine hepatitis virus-A59(MHV-A59) infection of adult mice to induce focal de-myelination throughout the spinal cord followed byspontaneous remyelination. We cultured glial cells di-rectly from demyelinating and remyelinating spinal
cords using conditions that maintain the dramaticallyenhanced OP proliferative response prior to CNS remy-elination. We identify PDGF and FGF2 as significantmitogens regulating this proliferative response. Further-more, we demonstrate endogenous PDGF and FGF2activity in these glial cultures isolated from demyeli-nated CNS tissue. These findings correlate well with ourprevious demonstration of increased in vivo expressionof PDGF and FGF2 ligand and corresponding receptorsin MHV-A59 lesions. Together these studies support thepotential of these pathways to function in vivo as criticalfactors in regulating remyelination. © 2003 Wiley Periodi-
cals, Inc.* J Neurobiol 54: 457–472, 2003
Keywords: PDGF; FGF2; remyelination; oligodendro-cyte progenitor; demyelinating disease
INTRODUCTION
Oligodendrocyte myelination of CNS axons facilitatesconduction of electrical signals between neurons. Indemyelinating diseases, such as multiple sclerosis (MS),myelin damage results in impaired conduction and pro-
gressive axonal degeneration. Limited spontaneous re-myelination occurs in acute MS lesions, yet recurringmyelin damage is not sufficiently repaired (Raine andWu, 1993; Prineas et al., 1993). The cellular and molec-ular mechanisms of remyelination are not clear, how-ever, a key feature is the generation of remyelinatingcells from local precursor cells. Several studies haveidentified immature oligodendrocyte lineage cells(OLCs) in the normal adult human CNS (Wolswijk andNoble, 1989; Armstrong et al., 1992; Scolding et al.,1995; Roy et al., 1999), and the density of these imma-ture OLCs is increased in acute MS lesions (Chang et al.,2000; Maeda et al., 2001). These precursor cells mayserve as targets for developing therapeutic strategies toimprove OLC regeneration and the extent of remyelina-tion in human demyelinating diseases.
Correspondence to: R. Armstrong ([email protected]).Contract grant sponsor: National Institutes of Health; contract
grant numbers: NS33316 and NS39293.Contract grant sponsor: The National Multiple Sclerosis Soci-
ety; contract grant number: RG2606.© 2003 Wiley Periodicals, Inc. *This article is a US Governmentwork and, as such, is in the public domain in the United States ofAmerica.Published online 8 January 2003 in Wiley InterScience (www.interscience.wiley.com).DOI 10.1002/neu.10158
457
Regulatory mechanisms involved in remyelinationcan be readily analyzed in adult rodent CNS modelsthat achieve successful remyelination in response toacute demyelination. Oligodendrocyte progenitorcells (OPs) persist in the adult rodent CNS (ffrench-Constant and Raff, 1986; Armstrong et al., 1990;Gensert and Goldman, 1997; Horner et al., 2000). Inseveral models of transient demyelination, OP prolif-eration occurs prior to remyelination (e.g., Carroll etal., 1998; Keirstead et al., 1998; Redwine and Arm-strong, 1998). Several developmentally important tro-phins are expressed in normal adult rodent CNS, andmay be more abundant in remyelinating rodent CNS(reviewed in Armstrong, 2000). As candidate mole-cules regulating OP responses in remyelinating tissue,we focus on PDGF and FGF2, two relatively well-characterized trophins for developing OPs.
We use murine hepatitis virus A-59 (MHV-A59) toinduce transient focal demyelination throughout thespinal cord, which is followed by spontaneous remy-elination and functional recovery (Jordan et al., 1989;Redwine and Armstrong, 1998). Our previous studieshave shown an up-regulation of platelet-derivedgrowth factor receptor-� (PDGF�R) expressing cellsassociated with MHV-A59 lesions, and correspondingincreases in PDGF-A ligand (Redwine and Arm-strong, 1998). We have also shown significant in-creases in FGF2 ligand and receptor expression inthese remyelinating lesions (Messersmith et al.,2000). Thus, PDGF and FGF2 ligands and receptorsare expressed during remyelination with a temporal,spatial, and cellular distribution consistent with a po-tential role in generating remyelinating OLCs.
In this study we use glial cultures isolated at specificstages of MHV-A59 disease progression to directly ex-amine the role of PDGF and FGF2 in regulating OLCproliferation and differentiation associated with remyeli-nation. We investigate the activity of PDGF-AA andFGF2, each tested singly and in combination. In addi-tion, we examine the significance of endogenously pro-duced PDGF and FGF2 in the cultures using inhibitorsspecific to each pathway. Importantly, at two distinctphases of disease progression, demyelination and earlyremyelination, we compare OLC responses elicited byexogenous and endogenous PDGF and FGF2. We showthat adult OP responses are clearly regulated by PDGFand FGF2, especially acting in combination, and that theOP responses differ with disease state.
MATERIALS AND METHODS
MHV-A59 Injection
As previously described (Redwine and Armstrong, 1998),MHV-A59 virus stock (1000 PFU in 10 �L) was injected
intracranially into 28-day-old C57Bl/6 female mice(Charles River, Wilmington, MA) to produce focal areas oftransient demyelination throughout the rostrocaudal extentof the spinal cord white matter. Motor impairment wasquantified by recording the period of time mice were able tohang upside down supporting their weight by gripping thebars of a metal cage top, with a maximum period set at 60 s(Redwine and Armstrong, 1998). Measurements were takenon days 7, 10, 14, 17, 21, 25, 28, and 32 days postinjection(dpi). The extent of demyelination was classified as“severely” affected if the mice were unable to hang on to thecage top for at least 30 s on 2 or more test days during thefirst 14 dpi. All animals were handled in accordance withprocedures approved by the USUHS Institutional AnimalCare and Use Committee.
Tissue Preparation
As previously described (Redwine and Armstrong, 1998),mice were perfused with 4% paraformaldehyde and thespinal cords removed. For histological observation, tissuewas osmicated, embedded in plastic, cut into 1 �m semithinsections, and stained with toluidine blue. For immunostain-ing, spinal cord segments were postfixed overnight, cryo-protected with 30% sucrose, embedded in Tissue Tek OCTcompound, and stored at �80°C.
Immunostaining of Tissue Sections
Fifteen-micrometer cryosections were thaw mounted ontoSuperfrost slides and immunostained for NG2 and PDGF�Rto identify OPs in situ (Redwine and Armstrong, 1998;Messersmith et al., 2000). Primary antibodies used wererabbit polyclonal anti-NG2 antibody (1:500; a generous giftfrom Dr. William Stallcup) and rat monoclonal anti-PDGF�R antibody (1:200; Pharmingen, San Diego, CA).Donkey antirabbit Cy3 conjugate (Jackson Immunore-search, West Grove, PA) was used to detect NG2 and thePDGF�R was detected with biotinylated donkey antiratF(ab�)2 (Jackson Immunoresearch) with FITC-tyramide am-plification (New England Nuclear, Boston, MA). Sectionswere stained with DAPI (Sigma) prior to mounting.
In Situ Hybridization
In situ hybridization and preparation of digoxigenin-labeledriboprobes were performed as previously published foranalysis of MHV-A59 spinal cord sections (Redwine andArmstrong, 1998; Messersmith et al., 2000). The digoxige-nin-labeled riboprobe used to detect FGF2 was preparedfrom a cDNA template complementary to nucleotides1–475 of mouse FGF2 (gift from Dr. Gail Martin, Univer-sity of California at San Francisco; Hebert et al., 1990). ThecDNA template used for PDGF-A (kindly provided by Dr.Mark Mercola, Harvard Medical School) was complemen-tary to an approximately 0.9 kb mRNA fragment of mousePDGF-A mRNA (Mercola et al., 1990). The cDNA tem-plate for the proteolipid protein (PLP) ribonucleotide probe
458 Frost et al.
(gift from Dr. Lynn Hudson, National Institutes of Health)was complementary to a 980 bp fragment of the mouse PLPmRNA sequence (Hudson et al., 1987). An in vitro tran-scription kit (Ambion, Austin, TX) was used to incorporatedigoxigenin-UTP (Boehringer Mannheim, Indianapolis,IN). The digoxigenin-labeled riboprobes were hybridized tomixed glial cultures prepared from spinal cords of 4 weekspostinjection (wpi) MHV-A59 severely affected mice.Digoxigenin was detected with an alkaline phosphatase-conjugated sheep antidigoxigenin antibody (BoehringerMannheim), followed by reaction with NBT/BCIP substrate(DAKO, Carpinteria, CA).
Neonatal Brain OligodendrocytePrecursor Cell Isolation
Neonatal OPs (nOPs) were prepared from postnatal day 2rat brains, by a method detailed in Armstrong (1998). Ap-proximately 10–14 days after plating, the nOPs and micro-glia were dislodged by shaking the flasks, followed byplating on noncoated tissue culture plastic to allow thedifferential adhesion of microglial cells. The nOP cell sus-pension was collected, concentrated, and resuspended inSato’s defined medium with high insulin (Bottenstein andSato, 1979), which is Dulbecco’s modified Eagle’s medium(DME; Life Technologies, Rockville, MD) supplementedwith the following reagents (from Sigma, St. Louis, MOunless otherwise stated): 25 �g/mL gentamicin (Life Tech-nologies), 5 �g/mL bovine insulin, 50 �g/mL human trans-ferrin, 100 �g/mL bovine serum albumin (BSA) fraction V,66 ng/mL progesterone, 16 �g/mL putrescine, 5 ng/mLsodium selenite, 400 ng/mL thyroxine (T4), and 400 ng/mLtri-iodothyroxine (T3) (Biofluids Inc., Rockville, MD).
Inhibitors of PDGF and FGF2
Rat brain nOP cells proliferate extensively and reproduciblyin response to either PDGF-AA or FGF2 (McKinnon et al.,1990; Baron et al., 2000). Therefore, nOPs were used tocharacterize the specificity of inhibitors of each growthfactor pathway.
OPs express only one of the PDGF receptor isoforms,the alpha receptor (PDGF�R) (Hart et al., 1989; Pringle etal., 1992). The PDGF�R is a protein tyrosine kinase recep-tor with numerous sites of phosphorylation that interact withseveral different signal transduction molecules (Heldin andWestermark, 1999). Therefore, to block activity of thePDGF pathway, we selected a specific inhibitor of thekinase activity of the PDGF�R. The AG1295 compound(Calbiochem, La Jolla, CA) is 6,7-dimethyl-2-phenylqui-noxaline, a tyrphostin that selectively inhibits phosphoryla-tion by the PDGF receptor tyrosine kinase. AG1295 haspreviously been shown to have no effect on autophosphor-ylation of the epidermal growth factor receptor even atconcentrations up to 100 �M (Kovalenko et al., 1994).Kovalenko et al. (1994) further showed that the IC50 forAG1295 inhibition of DNA synthesis in Swiss 3T3 cellswas 2.5 �M. Other studies have used 10 �M AG1295 tospecifically inhibit PDGF receptor activation (Banai et al.,
1998; Iwamoto et al., 2000). A dose response curve (1.0,2.5, 10, and 25 �M) of AG1295 was used to test theinhibition of proliferation of nOPs in response to 10 ng/mLPDGF-AA. Based upon the results with nOPs a singleconcentration of 10 �M AG1295 was used for the adultOLC proliferation studies.
In contrast to the single receptor types of the PDGFpathway, OLCs express at least three different FGF receptortypes (Bansal et al., 1996; Messersmith et al., 2000). Inaddition, the FGF receptors are activated by multiple li-gands of the FGF family (Ornitz et al., 1996; Ornitz andItoh, 2001). Therefore, to specifically investigate the role ofFGF2 ligand in the regulation of OLC proliferation, we usedan anti-FGF2 neutralizing antibody (FGF2nAb) that hasbeen used to block activity of FGF2 in vivo (Nilsson et al.,2001). The FGF2nAb (AF-233-NA; R&D Systems, Minne-apolis, MN) was used at a concentration of 1 �g/mL, whichis the manufacturer recommended ND50, and is 10X theconcentration required to block maximal proliferation ofNIH3T3 cells in response to rhFGF2.
Proliferation Assay
The purified nOPs were gently triturated to produce a singlecell suspension. Cells were then plated at 10,000 cells per12 mm PDL-coated glass coverslip in Sato’s defined me-dium supplemented with 0.5% fetal bovine serum (FBS)(Life Technologies), 10 ng/mL PDGF-AA (R&D Systems),and 10 ng/mL FGF2 (R&D Systems) overnight. The fol-lowing day the medium was replaced with serum/growthfactor-free Sato’s medium for 6 h. The medium was thenreplaced with serum-free Sato’s medium containing 10ng/mL PDGF-AA or FGF2 with or without inhibitors, and10 �M BrdU (Boehringer Mannheim) for 19 h.
To prepare cells for immunodetection of incorporatedBrdU, the cells were washed with cold HEPES bufferedMinimal Essential Medium (Life Technologies), fixed inmethanol at �20°C for 10 min, then treated for 1 min with0.2% paraformaldehyde, washed, treated with 0.07 MNaOH for 7 min, washed, then treated with 2% paraformal-dehyde for 3 min. Monoclonal anti-BrdU antibody (0.25�g/mL in PBS; Beckton Dickinson, San Jose, CA) wasadded to the cells for 30–60 min at room temperature (RT)and detected with donkey antimouse IgG (H�L) F(ab�)2
FITC conjugate (Jackson Immunoresearch). Cells werestained with the nuclear stain DAPI (Sigma) prior to mount-ing. Cell proliferation was assessed as the percentage ofDAPI� nOPs that were also BrdU�. At least 100 cells percoverslip were counted with three to four coverslips perexperiment and three experiments per inhibitor.
Cell Viability Assay
Purified nOPs were prepared as for the proliferation assay.Propidium iodide (PI) (20 �g/mL; Sigma), which is ex-cluded from live cells, was added to each coverslip for 10min. Cells were then fixed with 4% paraformaldehyde for10 min at RT and stained with DAPI (see above). Cellviability was assessed as the percentage of DAPI� PI� OPs
PDGF and FGF2 in OP Response to Demyelination 459

per coverslip. At least 100 cells per coverslip were counted,with three to four coverslips per experiment and threeexperiments per growth factor pathway inhibitor.
Mixed Glial Cell Preparationfrom Spinal Cord
Only mice meeting the criteria of severely affected wereused for tissue culture. Mice were sacrificed at either of twostages of the disease progression: at 14–17 dpi (“2 wpi”), orat 28–32 dpi (“4 wpi”). Spinal cords were removed from sixmice for each mixed glial cell preparation. Whole spinalcords were used in this study because of the uncertainties ofthe anatomical locations of various potential pools of pre-cursor cells that may contribute to remyelination, and be-cause prolonged microdissection time to isolate the multiplefocal lesion areas throughout each cord would significantlydecrease cell yield in cultures. The spinal cords wereminced and dissociated according to a protocol modifiedfrom Armstrong et al. (1990). Briefly, tissue was incubatedat 37°C in 0.25% trypsin (Sigma) with 50 U/mL DNase I(Sigma) in cold isolation medium [MEM-HEPES supple-mented with 25 �g/mL gentamicin, 5000 U/mL penicillin,and 5 mg/mL streptomycin (Sigma)] twice for 14 min each.After each incubation period, the supernatant was collectedinto DME plus 10% FBS (DFM) and replaced with freshenzyme solution. The tissue was then passed through aflame polished glass Pasteur pipette, then through a 26 Gneedle prior to being pooled with the supernatants. Glialcells were separated from myelin using a 30% Percoll(Pharmacia, Piscataway, NJ) gradient at 30,000�g for 30min at 4°C in 50 mL Oak Ridge centrifuge tubes (FisherScientific, Pittsburgh, PA). The glial cell layer, between themyelin cap and the red blood cell pellet, was removedcarefully and resuspended in cold isolation medium. Thecells were centrifuged for 10 min at 230�g. The supernatantwas removed and the cell pellet was resuspended in DFM.The cells were plated onto extracellular matrix coated 35mm tissue culture dishes (Accurate Chemical, Westbury,NY) at a density of one spinal cord per two to three dishes,in a volume of 200 �L/dish, and incubated at 37°C. After2 h a further 1.3 mL DFM was added to each dish. Two dayslater the medium was removed and replaced with Sato’smedium plus growth factors and/or inhibitors. After a fur-ther 48 h in vitro, BrdU was added (10 �M), and cells werefixed 19 h later for analysis.
Immunocytochemistry
Cultured OLCs from MHV-A59 were identified using three-color immunofluorescence with differentiation stage-spe-cific markers. Anti-NG2 antibody recognizes a chondroitinsulphate proteoglycan that is expressed by OPs (Nishiyamaet al., 1996a,b). O1 monoclonal antibody recognizes a cellsurface galactocerebroside that is a marker of mature oligo-dendrocytes (Bansal and Pfeiffer, 1992).
BrdU was added to the cultures for 19 h, with O1antibody (1:10 supernatant from hybridoma cultures con-taining 10% FBS in DME) being added for the final hour at
37°C. The cells were then fixed, permeabilized, and incu-bated with anti-BrdU as detailed above. Donkey antimouseIgG (H�L) F(ab�)2 FITC conjugate was used to detect theBrdU, and goat antimouse IgM TRITC conjugate (JacksonImmunoresearch) was used to detect the O1, for 30 min atRT. Cells were then incubated overnight at 4°C with rabbitpolyclonal anti-NG2 antibody (1:250–500 dilutions; gener-ous gifts from Dr. Joel Levine and Dr. William Stallcup).NG2 was detected with AMCA conjugated, donkey antirab-bit secondary antibody (Jackson Immunoresearch) at RT for30 min. Cultures were also analyzed for O4 and GFAPimmunoreactivity to identify a broad range of OLC stagesand the astrocytic cell population. In these experiments,cultures were treated as detailed above, substituting O4antibody (1:10 dilution of supernatant from hybridoma cul-tures and containing 10% FBS in DME) for the O1 anti-body, and GFAP (0.41 �g/mL; Dako, Carpinteria, CA) forthe NG2 antibody. Cells were then counted using a ZeissPhotoscope III. Thirty different fields of view using a 25Xobjective with a 1.25-optivar were counted per dish, whichcovered approximately 12.5% of the total measurable areaof the dish. Prior to analyzing the dishes, we verified that 30fields of view were a representative sample and compliedwith assumptions necessary for this analysis (i.e., normalityof distributions and homogeneity of variances).
Clonal Analysis
Mixed glial spinal cord cultures were prepared as detailedabove. A combination of PDGF-AA and FGF2, or a com-bination of the inhibitors AG1295 and FGF2nAb, wasadded to the dishes at day 2. After a further 24 h, the BAGreplication-deficient retrovirus [80 plaque forming units(PFU); Price et al., 1987; Levison et al., 1999; generouslyprovided by Dr. Steve Levison, Penn State University, Her-shey, PA] was added to the cultures, which were returned tothe incubator for a further 48 h. O1 or O4 monoclonalantibody (as detailed above) was added to the medium forthe final 60 min. The dishes were then fixed in 2% parafor-maldehyde and the O1 or O4 monoclonal antibody wasdetected as detailed above. The cultures were then incubatedfor 24 h at 4°C with anti-NG2 (as above) and �-galactosi-dase (�-gal) using the 40-1A monoclonal antibody (1:2dilution of supernatant from hybridoma cultures containing15% FBS in DME). The hybridoma cells were obtainedfrom the Developmental Studies Hybridoma Bank, devel-oped under the auspices of the NICHD and maintained bythe University of Iowa, Department of Biological Sciences(Iowa City, IA, 52242). Monoclonal 40-1A was detectedwith donkey antimouse IgG FITC (Jackson Immunore-search). All labeled clones were counted within each dish.
Imaging
All images were collected using a Spot II Camera (Diag-nostic Instruments, Inc.) attached to an Olympus IX70 epi-fluorescence microscope, with associated software and Pho-toshop 5.0.
460 Frost et al.

RESULTS
The role of PDGF and FGF2 in the regulation of OLCproliferation and differentiation during demyelinationand remyelination was investigated using glial cellcultures isolated from spinal cords of MHV-A59 in-fected adult mice. To ensure that reproducibly af-fected mice were used in each culture preparation,motor impairment was monitored by measuring thelength of time the MHV-A59 injected mice were ableto hang upside down from the wires of a cage top andsupport their weight (Fig. 1). Mice unable to hang fora minimum of 30 s or less, for at least two out of thefirst three test dates (days 7, 10, 14), were classified asseverely affected (Redwine and Armstrong, 1998).Previous studies have shown demyelinated lesionsbeginning at 1 wpi with more extensive areas ofmyelin degeneration by 2 wpi (Jordan et al., 1989;Armstrong et al., 1990). In subsequent weeks, myelindebris is cleared and remyelination is initiated (Jordanet al., 1989; Redwine and Armstrong, 1998).
In the current study, the overall area of demyeli-nation throughout the spinal cord was assessed in arepresentative severely affected mouse by measuringthe area of lesion in toluidine blue stained sections[Fig. 2(A); n � 152 sections throughout the spinalcord]. Characteristic areas of focal demyelinationwere observed in each funiculus. The proportion of
white matter area with myelin loss was 18.3 � 3.6%,12.9 � 2.2%, and 24.0 � 4.2% for cervical, thoracic,and lumbar levels, respectively. In addition to myelinloss, lesions typically exhibited vacuolation and in-
Figure 1 Time course of murine hepatitis virus induceddisease progression. Intracranial injection of MHV-A59 re-sults in motor function impairment. Mice were tested forlimb motor impairment (hang time) prior to being sacrificedfor mixed glial cultures between 14–17 days postinjection(dpi) (during demyelination “D”), and between 28–32 dpi(remyelination “R”). Hang time was scored as the periodthat each mouse could hang upside down from a metal cagetop. Prior to infection and upon recovery, mice could holdon for a maximum allowed period of 60 s. Hang time scoresshown are combined for all the mice used in this study, sothat values given include the mice sacrificed later on thatday. Error bars indicate S.E.M. Days 0–14, n � 83; day 17,n � 71; days 21–28, n � 52; day 32, n � 34.
Figure 2 MHV induced spinal cord lesions. Transversesections of lesioned spinal cord segments from MHV-A59injected mice sacrificed during remyelination (4 wpi). (A)Toluidine blue staining reveals the characteristic histopa-thology of lesioned tissue, with reduced dark myelin stain-ing, increased cell density, and vacuolation. Adjacent tissuedemonstrates normal appearing myelin [pink arrowhead in-dicates example, shown enlarged as inset (i)]. In addition,thin myelin sheaths are evident in the lesion [yellow arrow-head indicates example, shown enlarged as inset (ii)], whichis consistent with remyelination. (B, C) Immunohistochem-istry for NG2 (red) and PDGF�R (green), with DAPI stain-ing of DNA in nuclei (blue) to identify OPs in normalappearing white matter (B) and in an MHV-A59 inducedlesion (C). Arrowheads indicate cells shown enlarged asinsets. During remyelination (4 wpi), lesions show in-creased density of OPs and increased intensity of NG2immunoreactivity. Mitotic cells in lesioned white matter[(C), inset] show extremely strong immunoreactivity forNG2 and PDGF�R (dual immunoreactivity appears yel-low). Scales bars � 50 �m.
PDGF and FGF2 in OP Response to Demyelination 461

creased cell density [Fig. 2(A)]. Lesion areas showedaccumulation of OPs, which were identified by im-munostaining for NG2 and PDGF�R [Fig. 2(B,C)].
To analyze OP responses, cultures were preparedfrom spinal cords of mice sacrificed at two distinctphases of disease progression. The time of sacrificewas restricted to within a 5 day window of each phaseto minimize variation within disease progression.Within the demyelination phase, 14–17 days afterMHV-A59 injection was used as the earliest point atwhich the mice could be classified as “severe” to beused for preparations of cultures. These cultures arereferred to as 2 wpi. This period corresponds withsevere loss of motor function and the viral infection ofthe white matter (Jordan et al., 1989). Cultures werealso prepared from tissue 28–32 days postinjection(referred to as 4 wpi). This period corresponds withrecovery of motor function (Fig. 1) and viral clear-ance (Jordan et al., 1989; Redwine and Armstrong,1998). For each cell preparation, spinal cords from sixseverely affected mice were combined in order tominimize the variability between mice.
Identification of Glial Cell Types inCultures from Spinal Cords of MHV-A59Infected Mice
The cell types in the cultures were characterized usingthree-color immunofluorescence. Cell type-specificantibodies facilitated the identification of specificstages of differentiation of the OLCs within the cul-tures (see Materials and Methods). In addition, BrdUincorporation was used to identify proliferating cellswith each antigenic phenotype. OPs were identified asNG2�, O1�. Transitional oligodendrocytes wereidentified as NG2�, O1�. Differentiated oligodendro-cytes were identified as NG2�, O1� (Fig. 3).
An extracellular matrix culture substrate was usedto promote the adhesion of OLCs of all differentiationstages as well as astrocytes and microglia, as previ-ously shown (Armstrong et al., 1990). Experimentsusing glial fibrillary acidic protein (GFAP) as amarker for astrocytes confirmed that these culturescontained astrocytes, upon which the OLCs were of-ten observed (not shown). Cells with astrocytic mor-phology and those with microglial morphology werealso prevalent within the cultures (Fig. 4).
In Situ Hybridization Analysis ofGrowth Factor mRNA Expression inCultures from Spinal Cords ofMHV-A59 Infected Mice
Previous studies have shown that activated astrocytesand microglial cells synthesize and secrete both
PDGF and FGF2 within demyelinated lesions (Red-wine and Armstrong, 1998; Messersmith et al., 2000;Liu et al., 1998). Therefore, de novo synthesis of
Figure 3 Characterization of oligodendrocyte lineagecells within glial cultures isolated from remyelinating spinalcord. Three-color immunofluorescence was used to identifytwo different antigen-specific stages of the oligodendrocytelineage within the cultures, in addition to BrdU incorpora-tion, which was used to identify proliferating cells. (A) Anoligodendrocyte progenitor cell (OP) was identified as anNG2�, O1� cell. (B) A differentiated oligodendrocyte wasidentified as being NG2�, O1�. (C) Phase contrast showsthe glial cells present in the culture. (A), (B), and (C) showthe same field. (D) A proliferating OP was identified asNG2� BrdU� (also O1�, not shown). Scale bar in (C) � 50�m; in (D) � 25 �m.
462 Frost et al.

PDGF-A and FGF2 by cells within the mixed glialcultures was demonstrated using in situ hybridization.Mixed glial cultures were prepared as describedabove. In cultures isolated at 4 wpi, both astrocytesand microglial cells exhibited PDGF-A and FGF2mRNA signal [Fig. 4(A,B)]. Signal intensity in astro-cytes appeared to be greater for FGF2 than for PDGF-A, which is consistent with results seen in this modelin vivo (Redwine and Armstrong, 1998; Messersmithet al., 2000). Cultures were also analyzed for PLPmRNA [Fig. 4(C,D)], a marker of mature oligoden-drocytes, and FGF2 sense mRNA [Fig. 4(E,F)], todemonstrate specificity of the in situ hybridizationdetection.
Characterization of Growth FactorInhibitors
To investigate the role of endogenously producedPDGF and FGF2 in the regulation of proliferation inthese cultures we used reagents that inhibited each
growth factor pathway. The tyrphostin compoundAG1295 was used to inhibit PDGF�R tyrosine kinasephosphorylation. The activity of FGF2 was inhibitedwith a neutralizing antibody (FGF2nAb).
The specificity of each inhibitor was demonstratedusing BrdU incorporation in neonatal rat cortical OPcultures (nOP), in which PDGF and FGF2 have beencharacterized as potent mitogens (McKinnon et al.,1990; Baron et al., 2000). AG1295 is a specific in-hibitor of PDGF receptor activated DNA synthesis,with an IC50 of 2.5 �M in Swiss 3T3 cells (Kovalenkoet al., 1994) that has previously been shown to inhibitPDGF induced proliferation of several different celltypes (for example Banai et al., 1998; Iwamoto et al.,2000). In this study a dose response analysis ofAG1295 showed that 2.5 �M AG1295 only inhibitedPDGF induced proliferation by 9.1%, whereas 10 �MAG1295 inhibited PDGF induced proliferation by35.8%, back to levels seen in cultures without PDGF(Fig. 5). Previous studies have demonstrated that at 10�M, AG1295 inhibited the phosphorylation of PDGF
Figure 4 Characterization of growth factor expression by in situ hybridization. In situ hybridiza-tion was performed on cultures derived from spinal cords isolated during remyelination, at 4 wpi.Signal was detected in astrocytes (examples at arrows) and microglial cells (examples at arrow-heads) within the cultures. (A) Bright field photomicrograph showing the PDGF antisense riboprobesignal. (B) Bright field photomicrograph showing the FGF2 antisense riboprobe signal. (C) Phasecontrast photomicrograph showing the presence of astrocyte clusters and microglial cells that arePLP negative, compared to (D) bright field photomicrograph showing PLP antisense riboprobesignal in oligodendrocytes. (E) and (F) FGF2 sense probe was used to demonstrate hybridizationspecificity and background. (E) Phase contrast photomicrograph showing an astrocyte cluster,microglial cells, and oligodendrocytes present in the cultures. (F) Bright field photomicrograph ofpanel (E) showing lack of hybridization with the FGF2 sense probe. Scale bars � 50 �m.
PDGF and FGF2 in OP Response to Demyelination 463

receptors and subsequent downstream signaling path-ways leading to proliferation, without inhibiting thetyrosine kinase activity of the EGF receptor(Kovalenko et al., 1994; Banai et al., 1998). There-fore, subsequent experiments used 10 �M AG1295 tomaximally inhibit PDGF�R signaling in the nOP cul-tures (Fig. 5) without compromising cell viability(assessed by a propidium iodide exclusion assay; datanot shown). Compared to EGF receptors, FGF ty-rosine kinase receptors are even more closely relatedto the PDGF�R. Therefore, we confirmed thatAG1295 inhibition was specific to PDGF by showingthat AG1295 did not affect proliferation induced byFGF2 (Fig. 5). In parallel experiments, the FGF2nAb(at 1 �g/mL, the recommended ND50) significantlyinhibited the nOP proliferation induced by FGF2 (Fig.5), without compromising cell viability (data notshown), yet had no marked effect on the PDGF-AAresponse (Fig. 5).
Endogenous PDGF and FGF2 StimulateProliferation of OPs in Cultures Isolatedduring Demyelination (2 wpi)
Within glial cultures derived from demyelinated spi-nal cord at 2 wpi and then grown for 2 days in vitro
(div) in DFM, 42% of the OLCs had incorporatedBrdU. The majority of these OLCs were NG2� OPs[Fig. 6(A)]. After a further 3 days in defined mediumalone (control), the total percentage of proliferatingcells did not change significantly. The addition ofexogenous PDGF-AA and FGF2 for these 3 div alsodid not significantly change the total proportion ofproliferating OLCs, even when added in combination[Fig. 6(A)]. One possible explanation for this result isthat the OLCs are responding maximally to endoge-nous growth factors synthesized by cells within thecultures. Indeed, inhibition of endogenously producedPDGF and FGF2 activity using AG1295 andFGF2nAb, either individually or in combination, sig-nificantly reduced both the total percentage of prolif-erating OLCs and the proportion of NG2� OPs thathad incorporated BrdU (Fig. 6).
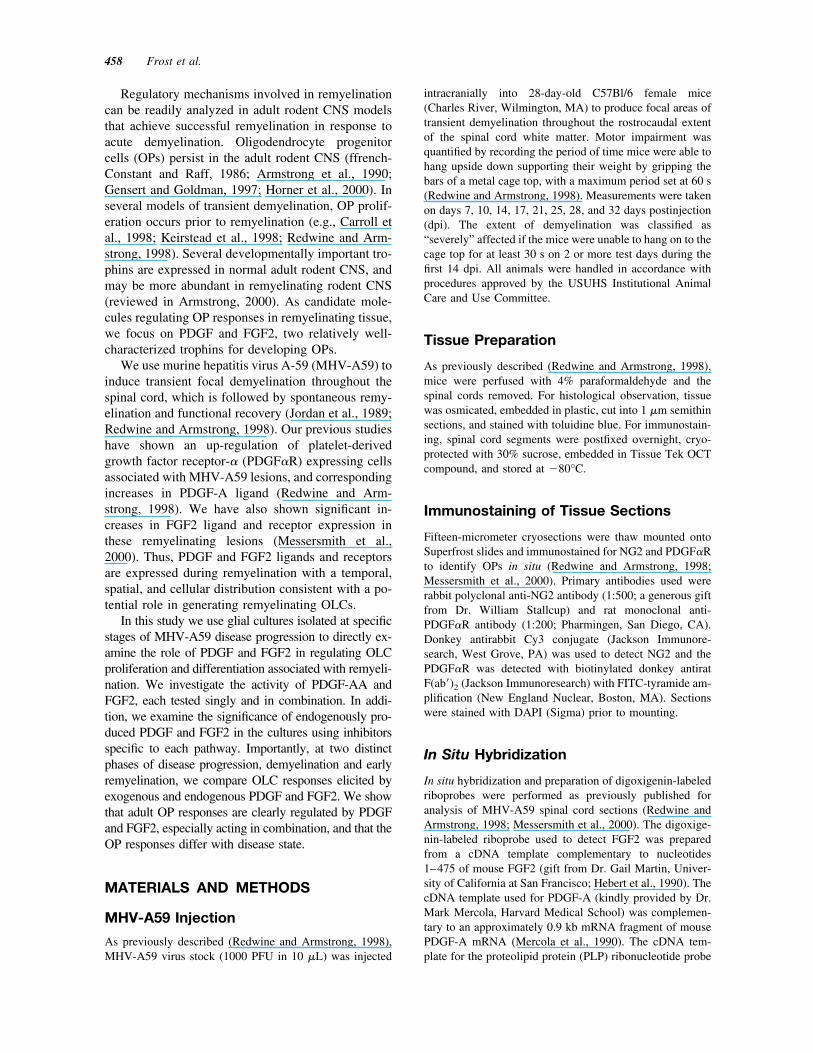
Endogenous PDGF and FGF2 PreventOLC Differentiation in Cultures ofDemyelinated Spinal Cord (2 wpi)
The OLC population within cultures derived fromdemyelinated spinal cord (at 2 wpi) consisted primar-ily of NG2� OPs [Fig. 7(A), black bars] after 2 div inDFM. After a further 3 div, in defined medium alone(control), there was no change in the proportion ofNG2� OPs [Fig. 7(B)]. The addition of exogenousgrowth factors did not significantly alter the antigenicphenotype of the OLCs. In contrast, the inhibitorsAG1295 and FGF2nAb, both individually and incombination, significantly reduced the proportion ofNG2� OPs among the OLC populations in thesecultures (Fig. 7). Consistent with the proliferationanalysis (above), these findings indicate that endoge-nous PDGF and FGF2 signaling prevents OP differ-entiation during the demyelination stage of the diseaseprogression.
OP Proliferation in Cultures Derivedduring Remyelination (4 wpi)
Within cultures derived from remyelinating spinalcord (at 4 wpi) and then grown for 2 div in DFM, 23%of the OLCs incorporated BrdU [Fig. 8(A)]. Thisproportion of proliferating OLCs was less than thatseen at 2 wpi [Fig. 6(A)] (p � .005). Approximatelyhalf of the BrdU labeled OLCs were NG2� OPs [Fig.8(A), black bars]. After a further 3 days in definedmedium alone (control), the percentage of NG2� OPsthat had incorporated BrdU was significantly reducedby approximately 60%. The addition of exogenousPDGF-AA with FGF2 significantly increased NG2�
OP proliferation [Fig. 8(B)]. The growth factor inhib-itors AG1295 and FGF2nAb did not reduce the total
Figure 5 Characterization of growth factor specific inhib-itors. The specificity of the PDGF�R inhibitor AG1295 andthe anti-FGF2 neutralizing antibody (FGF2nAb) was as-sessed in neonatal rat brain OPs (nOP) using BrdU incor-poration as a marker of proliferation. Black bars denotePDGF-AA treated nOPs and gray bars denote FGF2 (FGF2)treated nOPs. AG1295 (10 �M) maximally inhibitedPDGF-�� (10 ng/mL) stimulated proliferation of nOPs,with no marked effect on FGF2 induced proliferation. TheFGF2nAb at 1 �g/mL significantly inhibited proliferationinduced by FGF2 (10 ng/mL) with no marked effect onPDGF-AA induced proliferation. Each value (�S.E.M.)represents four experiments with three to four replicates andat least 100 cells were counted per coverslip (**p � .005compared to growth factor condition without inhibitor).Statistical analysis was paired two-tailed t test analysis.
464 Frost et al.

percentage of proliferating OLCs when used individ-ually [Fig. 8(A)]. In combination, however, the inhib-itors did significantly reduce the total percentage ofOLCs incorporating BrdU [Fig. 8(A)] and the propor-tion of NG2� OPs that were BrdU� [Fig. 8(B)]. Thus,at 4 wpi, endogenous PDGF and FGF2 still contributeto OP proliferation. However, the significant responseto exogenous PDGF-AA and FGF2 during remyeli-nation also indicates that endogenous PDGF andFGF2 are no longer acting at saturation levels, and theappropriate growth factor receptors are still availableto respond at 4 wpi.
OP Differentiation in Cultures Derivedduring Remyelination (4 wpi)
The OLC population within the cultures from 4 wpitissue consisted of predominantly NG2� OPs [Fig.9(A)] after 2 div in DFM, similar to that seen in 2 wpicultures [Fig. 7(A)]. However, in contrast to culturesfrom 2 wpi, after a further 3 div in defined mediumalone, there were significantly fewer NG2� OPs, withthe majority of cells being in later stages of thelineage [Fig. 9(A)] (p � .0027 vs. control). Thispattern indicates that OLCs derived from 4 wpi tissueexhibit an increased tendency to differentiate. Thus,OLC differentiation within this culture system corre-lates with OLC transitions expected for the onset ofremyelination at this stage of the disease progressionin vivo.
Analysis of OLC differentiation in the culturesfrom tissue at 4 wpi, with either inhibition or additionof PDGF and FGF2, also indicated differences rela-tive to cultures derived from 2 wpi tissue. In culturesfrom 4 wpi tissue, AG1295 and FGF2nAb had noeffect on OLC differentiation when used either indi-vidually or in combination [Fig. 9(A)]. This furthersupports the suggestion that the OLC response toendogenous PDGF and FGF2 signaling is reduced at4 wpi relative to 2 wpi. Moreover, addition of PDGF-AA or FGF2, either individually or in combination,significantly increased the proportion of NG2� OPscompared to defined medium alone (Fig. 9), which isagain consistent with maintained expression ofgrowth factor receptors at 4 wpi. This increase may bedue to proliferation (see above) that generates moreNG2� OPs. Alternatively, the exogenous PDGF-AA
dishes per treatment across three to four different glialpreparations. (p vs. control *p � .05, **p � .01). Statisticalanalysis was one-way analysis of variance, followed bypaired two-tailed t test analysis.
Figure 6 Endogenous PDGF and FGF2 enhance prolifer-ation of oligodendrocyte lineage cells in mixed glial cul-tures of demyelinated spinal cords. In cultures preparedfrom 2-week postinfection (2 wpi) tissue, OLC proliferationwas assessed as the percentage of total OLCs (labeled withNG2 and/or O1 stage-specific immunomarkers) that incor-porated BrdU during a terminal 19 h pulse. Black barsrepresent NG2�O1� cells, gray bars represent NG2�O1�
cells, and white bars represent NG2�O1� cells. (A) OLCproliferation is not altered by the addition of exogenousPDGF AA and/or FGF2. In contrast, inhibition of either orboth endogenous growth factors results in significant inhi-bition of proliferation. (B) NG2�O1� cell proliferation isnot affected by exogenous PDGF-AA or FGF2, however, itis significantly reduced by the inhibition of endogenousPDGF and FGF2. For each value (�S.E.M.) n � 4–6
PDGF and FGF2 in OP Response to Demyelination 465
and FGF2 may be maintaining the NG2� OP popu-lation by blocking maturation to the O1� stage.
Clonal Analysis Distinguishes betweenthe Mitogenic and Differentiation Effectsof PDGF and FGF2
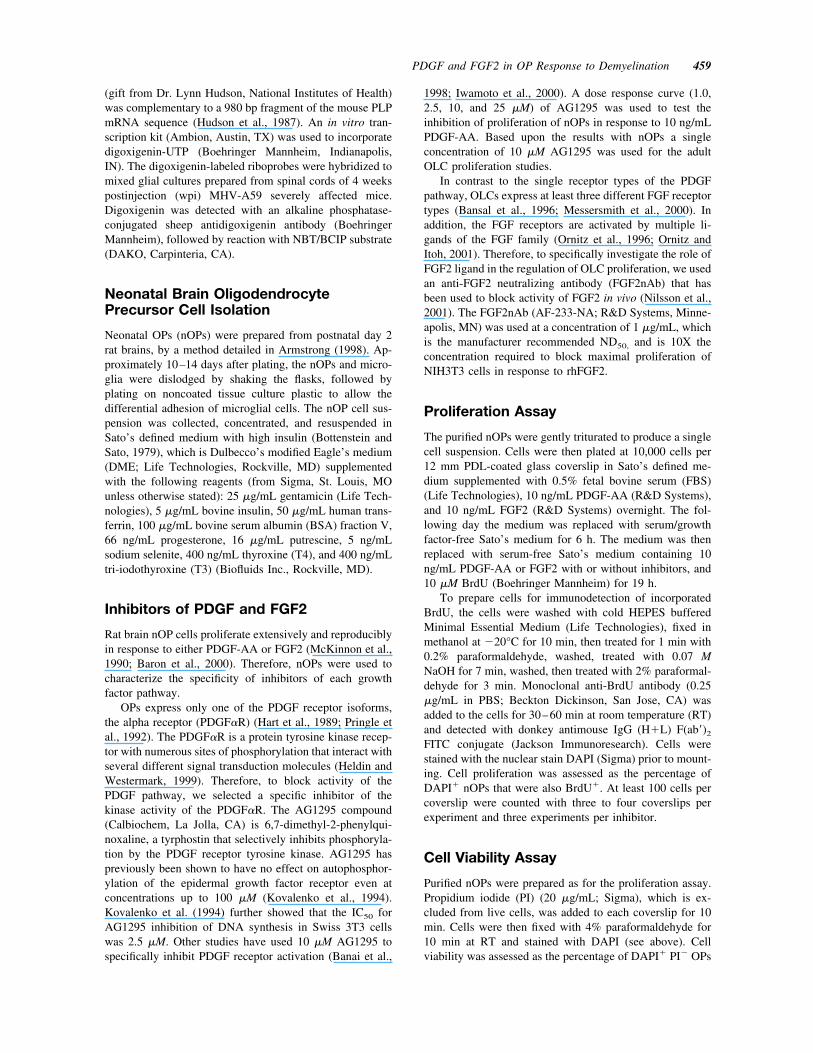
To more specifically delineate the roles of PDGF andFGF2 in the regulation of OLC proliferation anddifferentiation during early remyelination, cells iso-lated from spinal cords at 4 wpi were infected with theBAG replication-deficient retrovirus. Cells infectedwith the BAG retrovirus expressed �-gal as a herita-ble marker that allowed identification of clonally de-rived cells 48 h after infection (Fig. 10). Because theBAG retrovirus is integrated into the chromosomeafter mitosis (Hajihosseini et al., 1993), the number of�-gal� OLC clones per dish is proportional to theextent of proliferation of the OLC population,whereas the antigenic phenotype indicates the stage ofdifferentiation.
Cultures grown in defined medium alone (control)contained a mean of six OLC clones per dish (Fig.11), whereas cultures treated with a combination ofPDGF-AA and FGF2 contained approximately twiceas many OLC clones per dish. Importantly, in bothcontrol dishes and in PDGF-AA- and FGF2-contain-ing medium, the antigenic phenotype of �-gal� OLCswas similar (control � 64.5 � 3.7% NG2� cells;PDGF � FGF2 treatment � 60.1 � 1.9% NG2�
cells). Therefore, exogenous PDGF-AA and FGF2 didnot directly alter differentiation of newly generatedOPs at 4 wpi. Further, a combination of the PDGF andFGF2 inhibitors significantly reduced the mean num-ber of clones per culture (Fig. 11), but also had nomarked effect on the differentiation state within theclones (51.0 � 11.6% NG2� cells). Taken together,these data indicate that PDGF and FGF2 in combina-tion regulate OLC generation during remyelination byacting directly as mitogens for OPs.
DISCUSSION
Several studies using experimentally induced demy-elination have shown increases in OP proliferationassociated with remyelination (e.g., Redwine andArmstrong, 1998; Mason et al., 2000; McTigue et al.,2001). However, the mechanisms that induce OP pro-liferation remain unclear. Using an in vitro assaysystem, this study demonstrates that the proliferationof OPs, during experimentally induced demyelinationand remyelination of the adult CNS, is significantlyinfluenced by PDGF and FGF2 acting in combination.
The MHV-A59 coronavirus model used in this
Figure 7 Endogenous PDGF and FGF2 prevent oligoden-drocyte lineage cell differentiation in cultures of demyeli-nated spinal cord. Differentiation of the OLC population inmixed glial cultures of demyelinated spinal cords (at 2 wpi)was assessed using stage-specific markers. Black bars rep-resent early stage NG2�O1� progenitor cells, gray barsrepresent the transitional stage NG2�O1� cells, and whitebars represent differentiated NG2�O1� oligodendrocytes.(A) The addition of exogenous growth factors did not sig-nificantly alter the antigenic phenotype of the OLCs. (B)The inhibition of endogenous PDGF-AA and FGF2 with theinhibitors AG1295 and anti-FGF2 neutralizing antibody(FGF2nAb), both individually and in combination, signifi-cantly reduced the number of NG2� cells in the cultures.For each value (�S.E.M.) n � 4–6 dishes per treatmentacross three to four different glial preparations. (p vs. con-trol **p � .01). Statistical analysis was one-way analysis ofvariance, followed by paired two-tailed t test analysis.
466 Frost et al.

study is well suited for examining the events sur-rounding spontaneous remyelination following acutedemyelination of the adult mouse CNS. During thefirst weeks after intracranial injection of the virus,throughout the spinal cord focal lesions develop andare characterized by significant oligodendrocyte losswith subsequent myelin destruction (Jordan et al.,1989). This demyelination of the spinal cord results inparesis, paralysis, and grasping difficulty (representedin Fig. 1; Godfraind et al., 1989; Jordan et al., 1989;Redwine and Armstrong, 1998). Remyelination canbe identified by light microscopy at 3–4 wpi, withseveral wraps of myelin visible by electron micros-copy at 4 wpi, which coincides with recovery ofmotor function (Jordan et al., 1989; Redwine andArmstrong, 1998). The number of remyelinated axonsand thickness of myelin continues to progress in sub-sequent weeks (Jordan et al., 1989; Armstrong et al.,1990).
This study and our previous work (Armstrong etal., 1990) used cultures prepared from spinal cords ofMHV-A59 infected mice to examine cellular re-sponses to demyelination and remyelination. To en-sure inclusion of all potential pools of progenitors(discussed in Reynolds et al., 2001), entire spinalcords from severely affected mice were used to pre-pare mixed glial cultures for this study. Using this invitro system we have previously shown that the totalnumber of OLCs isolated from spinal cords at pro-gressive stages of the MHV-A59 induced disease issignificantly increased when compared to agematched controls (Armstrong et al., 1990). Thepresent study shows significantly more OLC prolifer-ation occurring during the demyelination stage of thedisease, and more specifically identifies NG2� OPs asthe major proliferative phenotype within the OLCpopulation (Fig. 6). During remyelination (4 wpi) wealso found that the total number of OLCs (Armstronget al., 1990), and more specifically the number ofNG2� OPs (current study, data not shown), was sig-nificantly increased compared to age matched controlanimals (Armstrong et al., 1990). The most prolifer-ative NG2� cells were negative for O1 immunostain-ing (Figs. 6 and 8). Thus, this technique appears todistinguish progenitors from remyelinating spinalcord compared with a report of normal adult progen-itors from optic nerve expressing NG2 or A2B5 withO1 (Shi et al., 1998).
The present study further demonstrates that OPs
Figure 8 Oligodendrocyte progenitor proliferation in cul-tures derived during remyelination is regulated by PDGFand FGF2. In mixed glial cultures of remyelinating spinalcords (4 wpi), OLC proliferation was assessed as the per-centage of total OLCs immunolabeled with anti-NG2 and/orO1 that had incorporated BrdU. Black bars representNG2�O1� oligodendrocyte progenitor cells, gray bars rep-resent transitional NG2�O1� cells, and white bars representNG2�O1� oligodendrocytes. (A) OLC proliferation is sig-nificantly increased by a combination of exogenous PDGF-AA and FGF2. Inhibition of both endogenous growth fac-tors with a combination of AG1295 and anti-FGF2neutralizing antibody (FGF2nAb) results in significant in-hibition of proliferation of the OLC population. (B) Specif-ically, the NG2�O1� cell proliferation is significantly in-creased in the presence of a combination of exogenousPDGF-AA and FGF2, and significantly inhibited in thepresence of a combination of AG1295 and FGF2nAb. For
each value (�S.E.M.) n � 3–6 dishes per treatment acrossfour different glial preparations. (p vs. control *p � .05,***p � .005). Statistical analysis was one-way analysis ofvariance, followed by paired two-tailed t test analysis.
PDGF and FGF2 in OP Response to Demyelination 467

show an increased tendency to differentiate in culturesisolated during remyelination (Fig. 9), as would matchthe transition appropriate for remyelination in vivo.Thus, our in vitro system maintains the progression ofOLC proliferation, accumulation, and differentiationthat has been documented to occur in experimentalmodels of demyelination and remyelination in vivo(Ludwin, 1979; Godfraind et al., 1989; Mason et al.,2000; McTigue et al., 2001). Therefore, we can takeadvantage of this in vitro model to facilitate a reduc-tionist approach to the investigation of putativegrowth factor and cytokine interactions that regulateOLC responses during spontaneous remyelination ofthe adult CNS.
Based upon previous developmental and in vitrostudies we focused on examining the effects of PDGFand FGF2 signaling to determine the mechanisms
Figure 9 Oligodendrocyte lineage cells are more likely todifferentiate in cultures derived during remyelination. Dif-ferentiation of the OLC population in mixed glial cultures ofremyelinating spinal cords (4 wpi) was assessed usingstage-specific markers. Black bars represent NG2�O1�
OPs, gray bars represent transitional NG2�O1� cells, andwhite bars represent premyelinating NG2�O1� oligoden-drocytes. (A) After 2 days in vitro (div) in DME plus 10%FBS, the OLC population within the cultures consisted ofpredominantly NG2�O1� OPs. However, in contrast tocultures from 2 wpi (Fig. 7), after a further 3 days in Sato’sdefined medium alone (control), there were significantlyfewer NG2� OPs, with the majority of cells being in laterstages of the lineage. (B) The addition of exogenous PDGF-AA and/or FGF2 significantly increases the percentage ofNG2�O1� cells in the cultures. The growth factor inhibi-tors, AG1295 and anti-FGF2 neutralizing antibody(FGF2nAb), had no effect on OLC differentiation in the
Figure 10 Clonal analysis of mixed glial cultures derivedfrom remyelinating spinal cords. To distinguish between theeffects of PDGF and FGF2 on proliferation and differenti-ation, cultures derived from remyelinating spinal cords (4wpi) were infected with BAG replication-incompetent ret-rovirus to introduce �-galactosidase as a heritable marker.OLCs were characterized using antigen-specific markers forthe different stages of the oligodendrocyte lineage. (A) OPswere identified by NG2 expression. (B) Differentiated oli-godendrocytes were identified with O1 antibody; in thisfield of view the cells are O1�. (C) �-galactosidase (BG)incorporation was used to identify clonally derived cellswithin each antigenic phenotype. (D) Phase contrast (PC)shows a variety of glial cell types within the cultures. Scalebar � 25 �m.
cultures when used either individually or in combination.For each value (�S.E.M.) n � 3–6 dishes per treatmentacross at least four different glial preparations. (p vs. control***p � .005). Statistical analysis was one-way analysis ofvariance, followed by paired two-tailed t test analysis.
468 Frost et al.
regulating enhanced OP proliferation in response todemyelination. During development PDGF andFGF2, both individually and in combination, are im-portant regulators of nOP proliferation prior to my-elination in the developing CNS (Bogler et al., 1990;McKinnon et al., 1990; van Heyningen et al., 2001).In addition, PDGF and FGF2 regulate the prolifera-tion of OP cells isolated from normal adult opticnerve, spinal cord, and corpus callosum (Wolswijkand Noble, 1992; Engel and Wolswijk, 1996; Masonand Goldman, 2002). Studies of ligand and receptorlocalization in lesions of the MHV-A59 model pro-vide further support for a potential role for PDGF andFGF2 during remyelination in vivo (Redwine andArmstrong, 1998; Messersmith et al., 2000).
Proliferation of PDGF�R� OPs is increased in andaround lesions in the MHV-A59 model and is asso-ciated with increased numbers of NG2 expressingcells (Redwine and Armstrong, 1998; Armstrong,2000). Also, the density of cells expressing FGF re-
ceptors increases in remyelinating MHV-A59 lesionsin comparison to nonlesioned spinal cord tissue(Messersmith et al., 2000). Our previous studies havealso identified increases in expression of PDGF andFGF2 ligand in and around lesions in the MHV-A59model (Redwine and Armstrong, 1998; Messersmithet al., 2000). Specifically, PDGF ligand expressionwas associated with reactive astrocytes around lesionsin the spinal cord (Redwine and Armstrong, 1998). Inaddition, increased FGF2 expression was reported inactivated astrocytes and microglia in lesions resultingfrom MHV-A59 infection (Messersmith et al., 2000)and from experimental allergic encephalomyelitis(Liu et al., 1999).
These findings support the prediction that PDGFand FGF2 are involved in the regulation of OLCproliferation in response to demyelination. Surpris-ingly, our earlier study showed no effects of exoge-nous PDGF and FGF2 on the proliferation of OLCs inthe cultures derived from MHV-A59 lesioned spinalcords (Armstrong et al., 1990). The present studydemonstrates a logical explanation for these previousresults being disparate with the predicted role ofPDGF and FGF2, and provides further insights intothe potential activity of PDGF and FGF2 in the pro-gression of demyelination and remyelination. Thecurrent work clearly shows: the importance of thecombination of PDGF and FGF2, as well as endog-enously produced PDGF and FGF2, in the regulationof OLC proliferation; the NG2� OP stage of OLCs ismost responsive to PDGF and FGF2; depending uponthe disease stage used for preparation of the cultures,the NG2� OP sensitivity varies, possibly in responseto changes in the level of exogenous versus endoge-nous PDGF and FGF2. The mitogenic activity ofendogenous PDGF and FGF2 appears most importantduring the demyelination phase when overall OP pro-liferation is most robust. Further studies of the growthfactor expression within the cultures and the receptordownstream signaling pathways are required to fullyelucidate the regulatory mechanism of these growthfactor pathways.
In studies using neonatal CNS, PDGF and FGF2both affect the differentiation state of nOPs, as well asacting as mitogens for nOPs (Bogler et al., 1990;McKinnon et al., 1993; Grinspan et al., 1996; God-dard et al., 1999). The present study used clonalanalysis to distinguish between these two differentpotential roles of PDGF and FGF2 during remyelina-tion. Our results (Fig. 11) show that the differentiationof �-gal� OLC clones is not affected by the additionof exogenous PDGF and FGF2, whereas OP prolifer-ation is increased. This implies that other putativefactors are present in the cultures, and potentially in
Figure 11 Quantification of clonal analysis. Cultures de-rived from remyelinating spinal cords (4 wpi) were infectedwith BAG replication-incompetent retrovirus to introduce�-galactosidase as a heritable marker. OLCs were charac-terized using antigen-specific markers for the differentstages of the oligodendrocyte lineage (as shown in Fig. 10).The number of clones identified within each treatment is anindicator of the level of proliferation within that treatment atthe time of retroviral infection. A combination of exogenousPDGF-AA and FGF2 (triangles) increases the total numberof OLC clones relative to control conditions (circles). Inhi-bition of the PDGF and FGF2 (squares) reduces the totalnumber of clones/dish. Each treatment was repeated in fourdishes within each of two different glial preparations. Sta-tistical analysis was one-way analysis of variance, followedby paired two-tailed t test analysis.
PDGF and FGF2 in OP Response to Demyelination 469

vivo, which contribute to the regulation of OLC dif-ferentiation.
Increased expression of other growth factors andcytokines has been reported in experimental modelsof demyelination and may influence OLC responses.Glial Growth Factor 2, TNF�, and TGF-�1 may con-tribute to a hierarchy of growth factor interaction that,along with PDGF and FGF2, may regulate OP prolif-eration and differentiation to bring about remyelina-tion (Cannella et al., 1998; Shi et al., 1998; Hinks andFranklin, 1999; Arnett et al., 2001). Other growthfactors, such as IGF1, may also promote oligodendro-cyte survival in demyelinating diseases (Mason et al.,2000). However, more detailed methods of analysiswill be required to clarify the role of other trophins inthe regulation of OLCs during remyelination. Furtherstudies will be important to assess the in vivo efficacyof a growth-factor-based therapeutic strategy, and toextend this work to the context of human demyelinat-ing diseases such as multiple sclerosis. The presentstudy illustrates how the control of the effects ofgrowth factor treatment for demyelinating diseasemay require knowledge of the most responsive cellpopulations, the interactions among combinations oftrophins, and how growth factor therapies may needto be modulated throughout a disease course.
We thank: Drs. Steve Levison, Joel Levine, and BillStallcup for reagents; Joshua Murtie and Sue Pletcher fortechnical assistance and helpful comments; Drs. KatharineBlaschuk, Deb McLaughlin, and Beata Gierdalska for help-ful comments and discussion; and Adam Vana and Dr.Yong-Xing Zhou for critical reading of the manuscript.
REFERENCES
Armstrong R, Friedrich Jr VL, Holmes KV, Dubois-DalcqM. 1990. In vitro analysis of the oligodendrocyte lineagein mice during demyelination and remyelination. J CellBiol 111:1183–1195.
Armstrong RC. 1998. Isolation and characterization of im-mature oligodendrocyte lineage cells. Methods 16:282–292.
Armstrong RC. 2000. Potential Roles of Trophic Factors inCNS Development and Recovery from DemyelinatingDisease. In: Mocchetti I, editor. Neurobiology of theTrophins. Johnson City, TN: FP Graham Publishing Co.p 333–353.
Armstrong RC, Dorn HH, Kufta CV, Friedman E, Dubois-Dalcq ME. 1992. Pre-oligodendrocytes from adult humanCNS. J Neurosci 12:1538–1547.
Arnett HA, Mason J, Marino M, Suzuki K, Matsushima GK,Ting JP. 2001. TNFalpha promotes proliferation of oli-godendrocyte progenitors and remyelination. Nat Neuro-sci 4:1116–1122.
Banai S, Wolf Y, Golomb G, Pearle A, Waltenberger J,
Fishbein I, Schneider A, Gazit A, Perez L, Huber R,Lazarovichi G, Rabinovich L, Levitzki A, Gertz SD.1998. PDGF-receptor tyrosine kinase blocker AG1295selectively attenuates smooth muscle cell growth in vitroand reduces neointimal formation after balloon angio-plasty in swine. Circulation 97:1960–1969.
Bansal R, Kumar M, Murray K, Morrison RS, Pfeiffer SE.1996. Regulation of FGF receptors in the oligodendro-cyte lineage. Mol Cell Neurosci 7:263–275.
Bansal R, Pfeiffer SE. 1992. Novel stage in the oligoden-drocyte lineage defined by reactivity of progenitors withR-mAb prior to O1 anti-galactocerebroside. J NeurosciRes 32:309–316.
Baron W, Metz B, Bansal R, Hoekstra D, de Vries H. 2000.PDGF and FGF-2 signaling in oligodendrocyte progeni-tor cells: regulation of proliferation and differentiation bymultiple intracellular signaling pathways. Mol Cell Neu-rosci 15:314–329.
Bogler O, Wren D, Barnett SC, Land H, Noble M. 1990.Cooperation between two growth factors promotes ex-tended self-renewal and inhibits differentiation of oligo-dendrocyte-type-2 astrocyte (O-2A) progenitor cells.Proc Natl Acad Sci USA 87:6368–6372.
Bottenstein JE, Sato GH. 1979. Growth of a rat neuroblas-toma cell line in serum-free supplemented medium. ProcNatl Acad Sci USA 76:514–517.
Cannella B, Hoban CJ, Gao YL, Garcia-Arenas R, LawsonD, Marchionni M, Gwynne D, Raine CS. 1998. Theneuregulin, glial growth factor 2, diminishes autoimmunedemyelination and enhances remyelination in a chronicrelapsing model for multiple sclerosis. Proc Natl AcadSci USA 95:10100–10105.
Carroll WM, Jennings AR, Ironside LJ. 1998. Identificationof the adult resting progenitor cell by autoradiographictracking of oligodendrocyte precursors in experimentalCNS demyelination. Brain 121:293–302.
Chang A, Nishiyama A, Peterson J, Prineas J, Trapp BD.2000. NG2-positive oligodendrocyte progenitor cells inadult human brain and multiple sclerosis lesions. J Neu-rosci 20:6404–6412.
Engel U, Wolswijk G. 1996. Oligodendrocyte-type-2 astro-cyte (O-2A) progenitor cells derived from adult rat spinalcord: in vitro characteristics and response to PDGF,bFGF and NT-3. Glia 16:16–26.
ffrench-Constant C, Raff MC. 1986. The oligodendrocyte-type-2 astrocyte cell lineage is specialized for myelina-tion. Nature 323:335–338.
Gensert JM, Goldman JE. 1997. Endogenous progenitorsremyelinate demyelinated axons in the adult CNS. Neu-ron 19:197–203.
Goddard DR, Berry M, Butt AM. 1999. In vivo actions offibroblast growth factor-2 and insulin-like growth factor-Ion oligodendrocyte development and myelination in thecentral nervous system. J Neurosci Res 57:74–85.
Godfraind C, Friedrich VL, Holmes KV, Dubois-Dalcq M.1989. In vivo analysis of glial cell phenotypes during aviral demyelinating disease in mice. J Cell Biol 109:2405–2416.
Grinspan JB, Reeves MF, Coulaloglou MJ, Nathanson D,Pleasure D. 1996. Re-entry into the cell cycle is required
470 Frost et al.

for bFGF-induced oligodendroglial dedifferentiation andsurvival. J Neurosci Res 46:456–464.
Hajihosseini M, Iavachev L, Price J. 1993. Evidence thatretroviruses integrate into post-replication host DNA.Embo J 12:4969–4974.
Hart IK, Richardson WD, Heldin CH, Westermark B, RaffMC. 1989. PDGF receptors on cells of the oligodendro-cyte-type-2 astrocyte (O-2A) cell lineage. Development105:595–603.
Hebert JM, Basilico C, Goldfarb M, Haub O, Martin GR.1990. Isolation of cDNAs encoding four mouse FGFfamily members and characterization of their expressionpatterns during embryogenesis. Dev Biol 138:454–463.
Heldin CH, Westermark B. 1999. Mechanism of action andin vivo role of platelet-derived growth factor. Physiol Rev79:1283–1316.
Hinks GL, Franklin RJ. 1999. Distinctive patterns of PDGF-A, FGF-2, IGF-I, and TGF-beta1 gene expression duringremyelination of experimentally-induced spinal cord de-myelination. Mol Cell Neurosci 14:153–168.
Horner PJ, Power AE, Kempermann G, Kuhn HG, PalmerTD, Winkler J, Thal LJ, Gage FH. 2000. Proliferation anddifferentiation of progenitor cells throughout the intactadult rat spinal cord. J Neurosci 20:2218–2228.
Hudson LD, Berndt JA, Puckett C, Kozak CA, LazzariniRA. 1987. Aberrant splicing of proteolipid proteinmRNA in the dysmyelinating jimpy mutant mouse. ProcNatl Acad Sci USA 84:1454–1458.
Iwamoto H, Nakamuta M, Tada S, Sugimoto R, Enjoji M,Nawata H. 2000. Platelet-derived growth factor receptortyrosine kinase inhibitor AG1295 attenuates rat hepaticstellate cell growth. J Lab Clin Med 135:406–412.
Jordan CA, Friedrich Jr VL, Godfraind C, Cardellechio CB,Holmes KV, Dubois-Dalcq M. 1989. Expression of viraland myelin gene transcripts in a murine CNS demyeli-nating disease caused by a coronavirus. Glia 2:318–329.
Keirstead HS, Levine JM, Blakemore WF. 1998. Responseof the oligodendrocyte progenitor cell population (de-fined by NG2 labelling) to demyelination of the adultspinal cord. Glia 22:161–170.
Kovalenko M, Gazit A, Bohmer A, Rorsman C, RonnstrandL, Heldin CH, Waltenberger J, Bohmer FD, Levitzki A.1994. Selective platelet-derived growth factor receptorkinase blockers reverse sis-transformation. Cancer Res54:6106–6114.
Levison SW, Young GM, Goldman JE. 1999. Cycling cellsin the adult rat neocortex preferentially generate oligo-dendroglia. J Neurosci Res 57:435–446.
Liu HN, Larocca JN, Almazan G. 1999. Molecular path-ways mediating activation by kainate of mitogen-acti-vated protein kinase in oligodendrocyte progenitors.Brain Res Mol Brain Res 66:50–61.
Liu X, Mashour GA, Webster HF, Kurtz A. 1998. BasicFGF and FGF receptor 1 are expressed in microgliaduring experimental autoimmune encephalomyelitis:temporally distinct expression of midkine and pleiotro-phin. Glia 24:390–397.
Ludwin SK. 1979. An autoradiographic study of cellularproliferation in remyelination of the central nervous sys-tem. Am J Pathol 95:683–696.
Maeda Y, Solanky M, Menonna J, Chapin J, Li W, DowlingP. 2001. Platelet-derived growth factor-alpha receptor-positive oligodendroglia are frequent in multiple sclerosislesions. Ann Neurol 49:776–785.
Mason JL, Goldman JE. 2002. A2B5(�) and O4(�) Cy-cling Progenitors in the Adult Forebrain White MatterRespond Differentially to PDGF-AA, FGF-2, and IGF-1.Mol Cell Neurosci 20:30–42.
Mason JL, Jones JJ, Taniike M, Morell P, Suzuki K, Mat-sushima GK. 2000. Mature oligodendrocyte apoptosisprecedes IGF-1 production and oligodendrocyte progen-itor accumulation and differentiation during demyelina-tion/remyelination. J Neurosci Res 61:251–262.
McKinnon RD, Matsui T, Dubois-Dalcq M, Aaronson SA.1990. FGF modulates the PDGF-driven pathway of oli-godendrocyte development. Neuron 5:603–614.
McKinnon RD, Piras G, Ida Jr JA, Dubois-Dalcq M. 1993.A role for TGF-beta in oligodendrocyte differentiation.J Cell Biol 121:1397–1407.
McTigue DM, Wei P, Stokes BT. 2001. Proliferation ofNG2-positive cells and altered oligodendrocyte numbersin the contused rat spinal cord. J Neurosci 21:3392–3400.
Mercola M, Wang CY, Kelly J, Brownlee C, Jackson-Grusby L, Stiles C, Bowen-Pope D. 1990. Selective ex-pression of PDGF A and its receptor during early mouseembryogenesis. Dev Biol 138:114–122.
Messersmith DJ, Murtie JC, Le TQ, Frost EE, ArmstrongRC. 2000. Fibroblast growth factor 2 (FGF2) and FGFreceptor expression in an experimental demyelinatingdisease with extensive remyelination. J Neurosci Res62:241–256.
Nilsson E, Parrott JA, Skinner MK. 2001. Basic fibroblastgrowth factor induces primordial follicle developmentand initiates folliculogenesis. Mol Cell Endocrinol 175:123–130.
Nishiyama A, Lin XH, Giese N, Heldin CH, Stallcup WB.1996a. Co-localization of NG2 proteoglycan and PDGFalpha-receptor on O2A progenitor cells in the developingrat brain. J Neurosci Res 43:299–314.
Nishiyama A, Lin XH, Giese N, Heldin CH, Stallcup WB.1996b. Interaction between NG2 proteoglycan and PDGFalpha-receptor on O2A progenitor cells is required foroptimal response to PDGF. J Neurosci Res 43:315–330.
Ornitz DM, Itoh N. 2001. Fibroblast growth factors. Ge-nome Biol 2:reviews3005.1–3005.12.
Ornitz DM, Xu J, Colvin JS, McEwen DG, MacArthur CA,Coulier F, Gao G, Goldfarb M. 1996. Receptor specificityof the fibroblast growth factor family. J Biol Chem 271:15292–15297.
Price J, Turner D, Cepko C. 1987. Lineage analysis in thevertebrate nervous system by retrovirus-mediated genetransfer. Proc Natl Acad Sci USA 84:156–160.
Prineas JW, Barnard RO, Kwon EE, Sharer LR, Cho ES.1993. Multiple sclerosis: remyelination of nascent le-sions. Ann Neurol 33:137–151.
Pringle NP, Mudhar HS, Collarini EJ, Richardson WD.1992. PDGF receptors in the rat CNS: during late neuro-genesis, PDGF alpha-receptor expression appears to berestricted to glial cells of the oligodendrocyte lineage.Development 115:535–551.
PDGF and FGF2 in OP Response to Demyelination 471

Raine CS, Wu E. 1993. Multiple sclerosis: remyelination inacute lesions. J Neuropathol Exp Neurol 52:199–204.
Redwine JM, Armstrong RC. 1998. In vivo proliferation ofoligodendrocyte progenitors expressing PDGFalphaRduring early remyelination. J Neurobiol 37:413–428.
Reynolds R, Cenci di Bello I, Dawson M, Levine J. 2001.The response of adult oligodendrocyte progenitors todemyelination in EAE. Prog Brain Res 132:165–174.
Roy NS, Wang S, Harrison-Restelli C, Benraiss A, FraserRA, Gravel M, Braun PE, Goldman SA. 1999. Identifi-cation, isolation, and promoter-defined separation of mi-totic oligodendrocyte progenitor cells from the adult hu-man subcortical white matter. J Neurosci 19:9986–9995.
Scolding NJ, Rayner PJ, Sussman J, Shaw C, Compston
DA. 1995. A proliferative adult human oligodendrocyteprogenitor. NeuroReport 6:441–445.
Shi J, Marinovich A, Barres BA. 1998. Purification andcharacterization of adult oligodendrocyte precursor cellsfrom the rat optic nerve. J Neurosci 18:4627–4636.
van Heyningen P, Calver AR, Richardson WD. 2001. Con-trol of progenitor cell number by mitogen supply anddemand. Curr Biol 11:232–241.
Wolswijk G, Noble M. 1989. Identification of an adult-specific glial progenitor cell. Development 105:387–400.
Wolswijk G, Noble M. 1992. Cooperation between PDGFand FGF converts slowly dividing O-2Aadult progenitorcells to rapidly dividing cells with characteristics ofO-2Aperinatal progenitor cells. J Cell Biol 118:889–900.
472 Frost et al.
Copyright © 2022 FDOKUMEN


![PET imaging of demyelination and remyelination in the cuprizone mouse model for multiple sclerosis: A comparison between [11C]CIC and [11C]MeDAS](https://static.fdokumen.com/doc/165x107/63419d7d8768bcaafb01b673/pet-imaging-of-demyelination-and-remyelination-in-the-cuprizone-mouse-model-for.jpg)