Duration of breastfeeding is associated with leptin (LEP) DNA ...
10
SHORT REPORT Open Access Duration of breastfeeding is associated with leptin (LEP) DNA methylation profiles and BMI in 10-year-old children William B. Sherwood 1 , Victoria Bion 1 , Gabrielle A. Lockett 1 , Ali H. Ziyab 2 , Nelís Soto-Ramírez 3 , Nandini Mukherjee 4 , Ramesh J. Kurukulaaratchy 5,6 , Susan Ewart 7 , Hongmei Zhang 4 , S. Hasan Arshad 5,6 , Wilfried Karmaus 4 , John W. Holloway 1,5 and Faisal I. Rezwan 1* Abstract Background: Breastfeeding is protective against many long-term diseases, yet the mechanisms involved are unknown. Leptin gene (LEP) is reported to be associated with body mass index (BMI). On the other hand, breastfeeding duration has been found to be associated with DNA methylation (DNAm) of the LEP gene. Therefore, epigenetic regulation of LEP may represent the mechanism underlying the protective effect of breastfeeding duration against obesity. Methods: In the Isle of Wight Birth Cohort, peripheral blood DNAm at 23 cytosine-phosphate-guanine sites (CpGs) in the LEP locus in 10-year-old (n = 297) samples and 16 CpGs in 18-year-old (n = 305) samples, were generated using the Illumina Infinium MethylationEPIC and HumanMethylation450 Beadchips respectively and tested for association with breastfeeding duration (total and exclusive) using linear regression. To explore the association between breastfeeding durations and genome-wide DNAm, epigenome-wide association studies (EWASs) and differential methylation region (DMR) analyses were performed. BMI trajectories spanning the first 18 years of life were used as the outcome to test the association with breastfeeding duration (exposure) using multi-nominal logistic regression. Mediation analysis was performed for significant CpG sites. Results: Both total and exclusive breastfeeding duration were associated with DNAm at four LEP CpG sites at 10 years (P value < 0.05), and not at 18 years. Though no association was observed between breastfeeding duration and genome-wide DNAm, DMR analyses identified five significant differentially methylated regions (Sidak adjusted P value < 0.05). Breastfeeding duration was also associated with the early transient overweight trajectory. Furthermore, DNAm of LEP was associated with this trajectory at one CpG site and early persistent obesity at another, though mediation analysis was not significant. Conclusions: Breastfeeding duration is associated with LEP methylation at age 10 years and BMI trajectory. LEP DNAm is also significantly associated with BMI trajectories throughout childhood, though sample sizes were small. However, mediation analysis did not demonstrate that DNAm of LEP explained the protective effect of breastfeeding against childhood obesity. Keywords: BMI trajectories, Breastfeeding, DNA methylation, Exclusive breastfeeding, Epigenetics, Obesity, Leptin © The Author(s). 2019 Open Access This article is distributed under the terms of the Creative Commons Attribution 4.0 International License (http://creativecommons.org/licenses/by/4.0/), which permits unrestricted use, distribution, and reproduction in any medium, provided you give appropriate credit to the original author(s) and the source, provide a link to the Creative Commons license, and indicate if changes were made. The Creative Commons Public Domain Dedication waiver (http://creativecommons.org/publicdomain/zero/1.0/) applies to the data made available in this article, unless otherwise stated. * Correspondence: [email protected] 1 Human Development and Health, Faculty of Medicine, University Hospital Southampton, University of Southampton, Duthie Building, MP808, Tremona Road, Southampton, Hampshire SO16 6YD, UK Full list of author information is available at the end of the article Sherwood et al. Clinical Epigenetics (2019) 11:128 https://doi.org/10.1186/s13148-019-0727-9
-
Upload
khangminh22 -
Category
Documents
-
view
0 -
download
0
Transcript of Duration of breastfeeding is associated with leptin (LEP) DNA ...
SHORT REPORT Open Access
Duration of breastfeeding is associatedwith leptin (LEP) DNA methylation profilesand BMI in 10-year-old childrenWilliam B. Sherwood1, Victoria Bion1, Gabrielle A. Lockett1, Ali H. Ziyab2, Nelís Soto-Ramírez3, Nandini Mukherjee4,Ramesh J. Kurukulaaratchy5,6, Susan Ewart7, Hongmei Zhang4, S. Hasan Arshad5,6, Wilfried Karmaus4,John W. Holloway1,5 and Faisal I. Rezwan1*
Abstract
Background: Breastfeeding is protective against many long-term diseases, yet the mechanisms involved areunknown. Leptin gene (LEP) is reported to be associated with body mass index (BMI). On the other hand,breastfeeding duration has been found to be associated with DNA methylation (DNAm) of the LEP gene. Therefore,epigenetic regulation of LEP may represent the mechanism underlying the protective effect of breastfeedingduration against obesity.
Methods: In the Isle of Wight Birth Cohort, peripheral blood DNAm at 23 cytosine-phosphate-guanine sites (CpGs)in the LEP locus in 10-year-old (n = 297) samples and 16 CpGs in 18-year-old (n = 305) samples, were generatedusing the Illumina Infinium MethylationEPIC and HumanMethylation450 Beadchips respectively and tested forassociation with breastfeeding duration (total and exclusive) using linear regression. To explore the associationbetween breastfeeding durations and genome-wide DNAm, epigenome-wide association studies (EWASs) anddifferential methylation region (DMR) analyses were performed. BMI trajectories spanning the first 18 years of lifewere used as the outcome to test the association with breastfeeding duration (exposure) using multi-nominallogistic regression. Mediation analysis was performed for significant CpG sites.
Results: Both total and exclusive breastfeeding duration were associated with DNAm at four LEP CpG sites at 10years (P value < 0.05), and not at 18 years. Though no association was observed between breastfeeding durationand genome-wide DNAm, DMR analyses identified five significant differentially methylated regions (Sidak adjusted Pvalue < 0.05). Breastfeeding duration was also associated with the early transient overweight trajectory.Furthermore, DNAm of LEP was associated with this trajectory at one CpG site and early persistent obesity atanother, though mediation analysis was not significant.
Conclusions: Breastfeeding duration is associated with LEP methylation at age 10 years and BMI trajectory. LEPDNAm is also significantly associated with BMI trajectories throughout childhood, though sample sizes were small.However, mediation analysis did not demonstrate that DNAm of LEP explained the protective effect ofbreastfeeding against childhood obesity.
Keywords: BMI trajectories, Breastfeeding, DNA methylation, Exclusive breastfeeding, Epigenetics, Obesity, Leptin
© The Author(s). 2019 Open Access This article is distributed under the terms of the Creative Commons Attribution 4.0International License (http://creativecommons.org/licenses/by/4.0/), which permits unrestricted use, distribution, andreproduction in any medium, provided you give appropriate credit to the original author(s) and the source, provide a link tothe Creative Commons license, and indicate if changes were made. The Creative Commons Public Domain Dedication waiver(http://creativecommons.org/publicdomain/zero/1.0/) applies to the data made available in this article, unless otherwise stated.
* Correspondence: [email protected] Development and Health, Faculty of Medicine, University HospitalSouthampton, University of Southampton, Duthie Building, MP808, TremonaRoad, Southampton, Hampshire SO16 6YD, UKFull list of author information is available at the end of the article
Sherwood et al. Clinical Epigenetics (2019) 11:128 https://doi.org/10.1186/s13148-019-0727-9
IntroductionThe multiple health benefits of breastfeeding are wellrecognised, with the World Health Organization (WHO)recommending that infants should be exclusively breast-fed up until 6 months and then breastfed alongside com-plementary food until 2 years of age [1], though globally,a high proportion of infants are not breastfed accordingto international guidelines [2, 3].Infants who are not breastfed are at increased risk of
all-cause and infection-related mortality [4]. For infantswith higher intensity of breastfeeding, there is a reduc-tion in morbidities such as respiratory infection anddiarrhea in their first five years of life [5]. Long-term, ad-equate breastfeeding has been associated with a range ofphenotypes including a lowered risk of type 2 diabetes[6], improved performance in intelligence tests [7], andreduced risk of childhood leukemia [8]. Conversely, as-sociations between breastfeeding and later disease riskare not always as clear cut, such as in the context of al-lergic disease [9–11]. Methodical disparities includingdefining exposure and adjustment for confounding fac-tors make the comparison between studies difficult [12].Similarly, conflicting results on the relationship betweenbreastfeeding and obesity have been attributed to hetero-geneity between studies, residual confounding, and in-sufficient statistical power [13]. However, several studiesand meta-analyses have recently reported a significantassociation between breastfeeding duration and child-hood obesity [6, 14, 15]. Based on current evidence, theWHO reports that breastfeeding appears to reduce therisk of being overweight and obese in childhood [16].Early life nutrition, and breastfeeding in particular, up
to 2 years of life, are considered to be critical for pro-gramming of long-term health. The composition of hu-man breastmilk, as a source of nutrition and bioactivefactors, is crucial in understanding the mechanism be-hind its beneficial effect [17]. For example, breastmilk ishigh in long-chain polyunsaturated fatty acids (LCPU-FAs), which in adults are associated with a lower risk ofmetabolic syndrome and cardiovascular disease [18],though evidence of their benefit in children is less clear[19, 20]. Moreover, maternal antibodies in human milkare taken up by an infant’s intestinal dendritic cells tosupport their immature acquired immunity [17]. Exactlyhow these metabolites and antibodies convey the long-term protective effects of breastmilk needs further inves-tigation [21], though recent evidence suggests that somemay be directly related to epigenetic changes [22] andinfants’ gut microbiota [23].A variety of nutritional sources are thought to induce
epigenetic changes, including changes in DNA methyla-tion (DNAm) [24]. In particular, early life nutritional ex-posures, such as maternal protein restriction inpregnancy and methyl donor nutrients including folate,
methionine, and some B-vitamins, may leave long-lastingchanges to DNAm in humans [25, 26]. Furthermore,components of human breastmilk are thought to induceepigenetic changes such as to LCPUFAs [27], and lacto-ferrin, which by suppressing the NF-κB signaling path-way may explain why breastmilk is protective againstneonatal necrotizing enterocolitis [22].However, to date, few studies have investigated the as-
sociation between breastfeeding duration and DNAmlevels [28, 29]. In one of these studies, Obermann-Borstand colleagues demonstrated that breastfeeding durationwas significantly associated with a reduction in methyla-tion in whole blood DNA of the leptin gene (LEP) inyoung children (mean age 17 months) [28]. LEP isexpressed in adipocytes and encodes the hormone leptin,important in the regulation of energy intake by inducingearly satiety. However, defective production of LEP is as-sociated with obesity [30], and LEPR/LEPROT DNAmhas been demonstrated to interact with genotype to in-fluence both leptin levels and BMI [31]. This suggeststhat breastfeeding duration, associated with postnatalDNAm, may contribute to childhood obesity. The aimof this study was to replicate and extend the study byObermann-Borst et al., in the Isle of Wight Birth Cohort(IOWBC) to test the association between breastfeedingand DNAm of cytosine-phosphate-guanines (CpGs) inLEP gene in peripheral blood at later ages (10 and 18years) and further explore the association betweenbreastfeeding duration and body mass index (BMI),where DNAm may act as a mediator.
MethodsIsle of Wight Birth CohortThe IOWBC (second generation also known as IoW F1)was recruited between 1989 and 1990 (n = 1536) [32,33]. The parents (first generation, IoW F0) of all infantsborn over this period were contacted at birth, and subse-quently, 95% of infants (n = 1456) were enrolled follow-ing informed consent and exclusion. Follow-ups wereconducted at 1, 2, 4, 10, and 18 years, where informationwas gathered about the participants, such as infant nutri-tion and breastfeeding practice [34]. Peripheral bloodsamples were collected from participants at age 10 and18 years and DNAm measured for 297 and 305 samples,at ages 10 and 18 respectively, of whom 162 participantswere matched between the two groups. Descriptive sta-tistics of the sub-cohorts for exposure and covariates arepresented in Table 1.
Categorization of breastfeeding durationTwo categories, exclusive and total breastfeeding dura-tions, were used to define the duration of breastfeedingfor each participant. The exclusive breastfeeding dur-ation was defined as the length of time (in weeks) a child
Sherwood et al. Clinical Epigenetics (2019) 11:128 Page 2 of 10

was breastfed, until formula feed and/or solid foods wereintroduced. The total breastfeeding duration, equates tothe total number of weeks a mother breastfed her childirrespective of the introduction of formula feed and/orsolid foods.
DNA extraction and arrayingDNA was extracted from peripheral blood samples usinga standard salting out procedure. Approximately 1 μg ofDNA was bisulfite-treated using the EZ 96-DNA methy-lation kit (Zymo Research, Irvine, CA, USA) using themanufacturer’s standard protocol. The Infinium Methy-lationEPIC BeadChips (age 10-year samples) and Infi-nium HumanMethylation450 (age 18-year samples) fromIllumina (Illumina, San Diego, CA, USA) were used toobtain methylation levels following the manufacturer’sstandard protocol. Methylation 450k and EPIC data (βvalues) were pre-processed for quality control, followingthe CPACOR pipeline [35], and batch effect was cor-rected using ComBat [36].
Candidate Leptin CpG selectionIn Obermann-Borst et al. study, seven CpG sites in theLEP gene were analyzed. The UCSC Batch CoordinateConversion tool (LiftOver, https://genome.ucsc.edu/cgi-bin/hgLiftOver) was used to convert genome coordinates
from the hg18 assembly, used by Obermann-Borst et al.,to the human genome hg19 assembly [37]. Four of theseseven CpG sites were present in our analysis. For allCpGs annotated near LEP gene, for the 18-year samples,a total of 16 CpG sites were analyzed in LEP, whereas 23CpG sites in LEP were analyzed in the 10-year samples,where the more comprehensive EPIC beadchips wereused (see Additional file 1: Table S1).
Confounding factorsThe same covariates used by Obermann-Borst et al. wereused in the analysis, namely, child sex, birth weight, ges-tational age, serum leptin (ng/mL at either 10 or 18years), BMI (at either 10 or 18 years), maternal socioeco-nomic status (defined using maternal socioeconomiccluster information: high, low, low-low, low-mid, andmid, using household income, number of rooms, andmaternal education), and maternal smoking at birth.However, unlike the original study, birth weight, andgestational age were kept as separate variables and z-scores were not considered to be appropriate [38]. Parityand maternal age were added as covariates for these ana-lyses, having been previously found to be associated withbreastfeeding duration [39]. Additionally, breastfeedingduration was used as a continuous variable rather thancategorical. Cell proportions (CD8T, CD4T, NK, B Cells,
Table 1 Characteristics of Isle of Wight Birth Cohort participants at 10 and 18 years.
Characteristic IOWBC Participants at 10 years (n = 297) IOWBC Participants at 18 years (n = 305)
Child sex (female) 190 (64.0%) 209 (68.5%)
Maternal socioeconomic status
1 (lowest) 41 (13.8%) 49 (16.1%)
2 60 (20.2%) 52 (17.0%)
3 89 (29.9%) 88 (28.9%)
4 82 (27.6%) 85 (27.9%)
5 (highest) 25 (8.4%) 31 (10.2%)
No maternal smokingduring pregnancy
238 (80.1%) 250 (82.0%)
Gestational age < 38 weeks 12 (4.0%) 15 (4.9%)
Overweight (BMI > 19.8 at10 years, > 25 at 18)
62 (20.9%) 83 (27.2%)
Never breastfed 38 (12.8%) 48 (15.7%)
BMI trajectory
Normal (reference) 211 (71%) 215 (70.5%)
Delayed overweight(trajectory 2)
41 (13.8%) 48 (15.8%)
Early transient overweight(trajectory 3)
33 (11.1%) 30 (9.8%)
Early persistent obesity(trajectory 4)
12 (4.1%) 12 (3.9%)
Descriptive statistics on exposure and covariates of participants included in the study. This is given as the number of participants in each category and as apercentage for each characteristic. Note that for the overweight category, different BMI cut-offs are used at 10 or 18 years, as defined by the InternationalObesity Taskforce
Sherwood et al. Clinical Epigenetics (2019) 11:128 Page 3 of 10

monocytes, granulocytes) were estimated using the minfipackage [40] and cell composition coefficients were de-rived using the Houseman method [41].
BMI trajectoriesFour BMI trajectories (normal, early persistent obesity,delayed overweight, and early transient overweight)covering the period from 1 to 18 years of age, as pro-posed by Ziyab et al. [42], were utilized to assess theassociation between breastfeeding duration and BMI tra-jectories. These four trajectories were categorized usingage-specific BMI thresholds for ‘obesity’ and ‘overweight,’ as defined by the International Obesity Taskforce forages 4, 10 and 18 years [43], and WHO standards forage 1 year [44]. They were defined in 1240 participantsof the IOWBC and the trajectories for 10 and 18-yearsamples are described in Table 1.
Statistical analysesIntra-class correlations (ICC) were estimated among 14common LEP CpGs in 162 matched samples (commonbetween 10 and 18 years) to assess the DNAm stabilityover time. Four models were run exploring the associ-ation between exclusive breastfeeding duration or totalbreastfeeding duration and LEP DNAm at either 10 or18 years using linear regression adjusted for covariatesand cell types.Further, we performed an epigenome-wide association
study (EWAS) to identify differentially methylated posi-tions (DMPs) that are associated with breastfeeding dura-tions (both exclusive and total), using linear regressionadjusted for confounding factors and cell types, in both10- and 18-year samples as described for the LEP analyses.Multiple hypothesis testing was accounted for by control-ling the false discovery rate (FDR), using Benjamini andHochberg’s algorithm [45]. CpGs with FDR corrected Pvalue < 0.05 were considered statistically significant. Toidentify differentially methylated regions (DMRs), com-posed of multiple signals across individual CpG positions,comb-p [46] (Python v2.7) was used. Comb-p identifies re-gions enriched with low unadjusted P values (here, P value< 0.05) from the EWAS analysis, based on the probe loca-tion. For each region, the comb-p algorithm adjusts theCpG P values for auto-correction between probes by usingthe Stouffer-Liptak-Kechris (slk) correction with multipletesting adjustment using a one-step Sidak correctionmethod. Regions with least two CpG probes within 200base pairs, having a Sidak-corrected P value < 0.05, wereconsidered statistically significant.The association between breastfeeding duration (ex-
clusive and total) and BMI trajectories was tested in thesubset of children, matched with 10-year old samples,using multi-nominal logistic regression with ‘normal’BMI trajectory as reference. Furthermore, the association
between BMI trajectory and LEP DNAm was investi-gated with only those CpGs found to be significant withbreastfeeding duration. P value < 0.05 was used as thesignificance level. All analyses were performed using R(version 3.3.2).
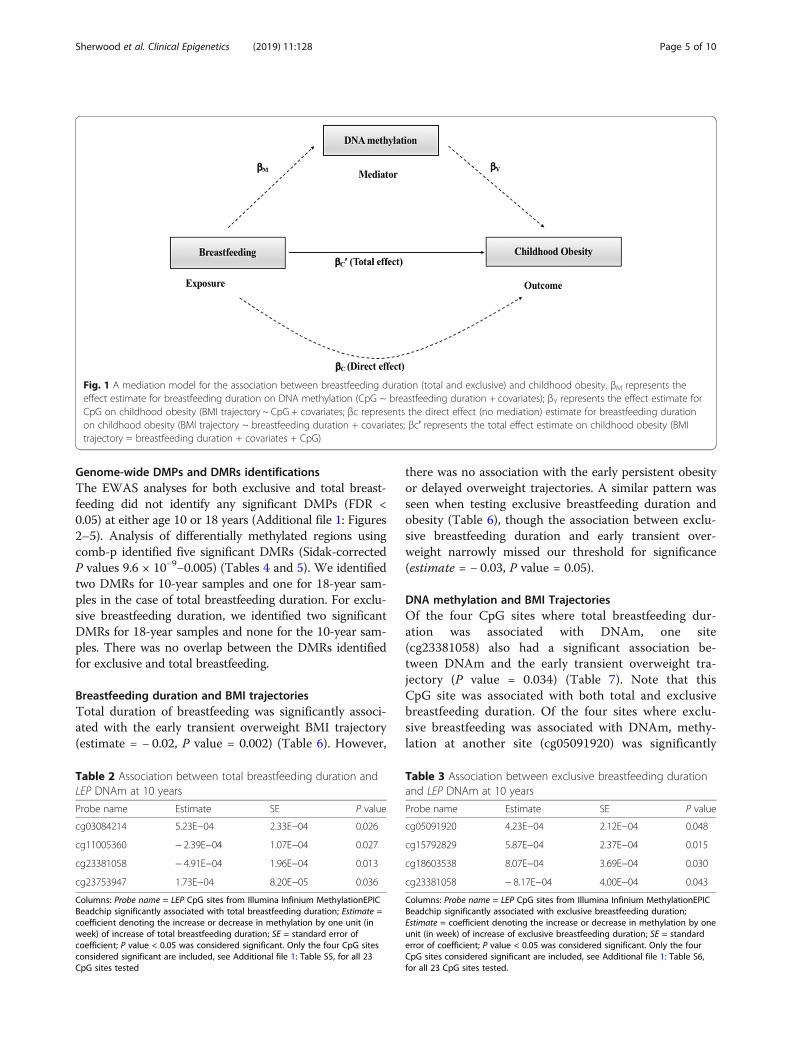
Mediation analysisModel-based causal mediation analysis, using the R-pack-age “mediation” [47], was performed to explore whetherthe association between breastfeeding duration and BMItrajectory is mediated by DNAm (Fig. 1). Only the LEPCpGs significantly associated with BMI trajectory wereutilized for the mediation analysis as the mediator. Firstly,we estimated the effect of breastfeeding duration (expos-ure) on LEP DNAm (mediator) and then, we estimatedthe combined effect of breastfeeding duration (exposure)and LEP DNAm (mediator) on the BMI trajectory (out-come). Both of these effects were adjusted for the covari-ates mentioned above. Bootstrapping was used to testsignificance level (P value < 0.05).
ResultsStability of DNA methylationIntra-class correlation shows that 64.3% of the commonCpGs (9 out of 14) were fairly moderately stable (ICCbetween 0.05 to 0.75) over 8 years (Additional file 1:Table S2). A moderate-good degree of stability wasfound in three CpGs between the two measurements.The highest ICC observed (in cg19594666) was 0.69 witha 95% confidence interval from 0.58 to 0.77 (F(161,161)= 3.22, P value = 2.79 × 10⁻¹³).
Breastfeeding duration and LEP DNA methylationAt 10 years, the total breastfeeding duration was signifi-cantly associated with DNAm at four CpG sites in LEP (Pvalue < 0.05, Table 2). Two of the CpGs (cg03084214 andcg23753947) were available in 18-year samples, whichshowed significant differences with 10-year samples (Add-itional file 1: Figure S1). However, for the 18-year samples,there were no significant associations seen between eithertotal breastfeeding or exclusive breastfeeding duration andDNAm at any of the 16 LEP CpG sites interrogated (Add-itional file 1: Tables S3 and S4).Similarly, the duration that a child was exclusively
breastfed was associated with significant changes (Pvalue < 0.05) in DNAm at four CpG sites, in samplestaken at 10 years (Table 3). Lower methylation of onesite (cg23381058) was significantly associated with bothexclusive and total breastfeeding duration. Another CpG(cg18603538) was available in 18-year samples, whichshowed no significant differences with 10-year samples(Additional file 1: Figure S1).
Sherwood et al. Clinical Epigenetics (2019) 11:128 Page 4 of 10
Genome-wide DMPs and DMRs identificationsThe EWAS analyses for both exclusive and total breast-feeding did not identify any significant DMPs (FDR <0.05) at either age 10 or 18 years (Additional file 1: Figures2–5). Analysis of differentially methylated regions usingcomb-p identified five significant DMRs (Sidak-correctedP values 9.6 × 10⁻⁹−0.005) (Tables 4 and 5). We identifiedtwo DMRs for 10-year samples and one for 18-year sam-ples in the case of total breastfeeding duration. For exclu-sive breastfeeding duration, we identified two significantDMRs for 18-year samples and none for the 10-year sam-ples. There was no overlap between the DMRs identifiedfor exclusive and total breastfeeding.
Breastfeeding duration and BMI trajectoriesTotal duration of breastfeeding was significantly associ-ated with the early transient overweight BMI trajectory(estimate = − 0.02, P value = 0.002) (Table 6). However,
there was no association with the early persistent obesityor delayed overweight trajectories. A similar pattern wasseen when testing exclusive breastfeeding duration andobesity (Table 6), though the association between exclu-sive breastfeeding duration and early transient over-weight narrowly missed our threshold for significance(estimate = − 0.03, P value = 0.05).
DNA methylation and BMI TrajectoriesOf the four CpG sites where total breastfeeding dur-ation was associated with DNAm, one site(cg23381058) also had a significant association be-tween DNAm and the early transient overweight tra-jectory (P value = 0.034) (Table 7). Note that thisCpG site was associated with both total and exclusivebreastfeeding duration. Of the four sites where exclu-sive breastfeeding was associated with DNAm, methy-lation at another site (cg05091920) was significantly
Table 2 Association between total breastfeeding duration andLEP DNAm at 10 years
Probe name Estimate SE P value
cg03084214 5.23E−04 2.33E−04 0.026
cg11005360 − 2.39E−04 1.07E−04 0.027
cg23381058 − 4.91E−04 1.96E−04 0.013
cg23753947 1.73E−04 8.20E−05 0.036
Columns: Probe name = LEP CpG sites from Illumina Infinium MethylationEPICBeadchip significantly associated with total breastfeeding duration; Estimate =coefficient denoting the increase or decrease in methylation by one unit (inweek) of increase of total breastfeeding duration; SE = standard error ofcoefficient; P value < 0.05 was considered significant. Only the four CpG sitesconsidered significant are included, see Additional file 1: Table S5, for all 23CpG sites tested
Table 3 Association between exclusive breastfeeding durationand LEP DNAm at 10 years
Probe name Estimate SE P value
cg05091920 4.23E−04 2.12E−04 0.048
cg15792829 5.87E−04 2.37E−04 0.015
cg18603538 8.07E−04 3.69E−04 0.030
cg23381058 − 8.17E−04 4.00E−04 0.043
Columns: Probe name = LEP CpG sites from Illumina Infinium MethylationEPICBeadchip significantly associated with exclusive breastfeeding duration;Estimate = coefficient denoting the increase or decrease in methylation by oneunit (in week) of increase of exclusive breastfeeding duration; SE = standarderror of coefficient; P value < 0.05 was considered significant. Only the fourCpG sites considered significant are included, see Additional file 1: Table S6,for all 23 CpG sites tested.
Fig. 1 A mediation model for the association between breastfeeding duration (total and exclusive) and childhood obesity. βM represents theeffect estimate for breastfeeding duration on DNA methylation (CpG ~ breastfeeding duration + covariates); βY represents the effect estimate forCpG on childhood obesity (BMI trajectory ~ CpG + covariates; βc represents the direct effect (no mediation) estimate for breastfeeding durationon childhood obesity (BMI trajectory ~ breastfeeding duration + covariates; βc′ represents the total effect estimate on childhood obesity (BMItrajectory = breastfeeding duration + covariates + CpG)
Sherwood et al. Clinical Epigenetics (2019) 11:128 Page 5 of 10

associated with the early persistent obesity trajectory(P value = 0.028). These results have been placed inAdditional file 1: Table S7 along with other non-sig-nificant CpGs for all of the trajectories.Table 7 Association between early transient overweight
(BMI trajectory 3) and LEP DNAm at 10 years previouslyassociated with breastfeeding duration (associated P valuesare shown)Columns: Probe name = LEP CpG sites from Illumina
Infinium MethylationEPIC Beadchip, which are signifi-cantly associated with either total or exclusive breastfeed-ing; Estimate = coefficient denoting one-unit increase inthe methylation level for specific CpG is associated withthe decrease in the log odds of being in the BMI trajectory3; standard error = standard error of coefficient. DNAmethylation analyzed against BMI trajectories with BMItrajectory 1 (normal) as a control. P value < 0.05 was con-sidered significant and indicated by *
Mediation analysisThere were no statistically significant effects ofcg23381058 methylation as a mediator between totalbreastfeeding duration and the early transient over-weight trajectory (Table 8). Similarly, there was no asso-ciation when looking at exclusive breastfeeding duration(Table 8). In the case of total breastfeeding duration, nosignificant direct effect (P value = 0.06) or total effect (Pvalue = 0.07) on early transient overweight trajectorywas observed.
DiscussionWe examined the association between breastfeedingduration and DNAm on the LEP gene, finding asignificant association at 10 years but not at 18 years.Exclusive breastfeeding duration was significantlyassociated with DNAm at four CpGs and total breast-feeding was also associated with DNAm at four sites,and among them, one site, cg23381058, was in common.Previous studies investigating the association between
breastfeeding and DNAm, in animal and human models,have used total breastfeeding duration as their exposure[48]. However, there are concerns about the variabilityof breastfeeding within these parameters. For example,infants could be largely formula-fed, yet still classified asbreastfeeding. Using an exclusive breastfeeding category,in comparison with total breastfeeding, gives more confi-dence over the exposure variable. The importance of thisdistinction is highlighted by ongoing research into im-pact of breastfeeding on infant outcomes, shaping healthpolicy [1].In addition, epigenome-wide association analysis was
undertaken to identify other DMPs and DMRs associatedwith the breastfeeding duration (exclusive and total) and forboth 10- and 18-year samples. To our knowledge, this is thefirst time such an analysis, investigating the association be-tween breastfeeding and DNAm, has been conducted usingan EWAS approach. In the case of DMPs, no genome-widesignificant (FDR < 0.05) hits were found. This is likely dueto lack of power and follow up studies in larger cohortsand/or with DNAm measurements earlier in childhood arewarranted. We did however identify five significant DMRs(Sidak-corrected P values < 0.05) associated with breastfeed-ing duration. One of these genes, GAS5, was reported in arecent paper exploring whether long non-coding RNAs(lncRNAs), important in the development and gene expres-sion, were encapsulated in extracellular vesicles withinbreastmilk [49]. Among others, GAS5 was detected and in-deed highly correlated. Involved in metabolic functions andimmune system programming, and as a significant epigen-etic regulator, GAS5 is a potential candidate breast-milkcompound, that could be important in the effect of breast-feeding. We are not aware of any previous research linkingbreastfeeding with the remaining DMRs; WBP1L, CYTH4,VSTM1, and FAM228A. Interestingly though, a recent studyby Rzehak et al. [50], found an association between DNAmat cg14518658 near CYTH4 gene and body composition inpre-school children, adjacent to one of the significant DMRs(chr22:37678728-37678791) identified in this study.
Table 4 Statistically significant differentially methylated regions (DMRs) (Sidak P value < 0.05) for total breastfeeding duration
Age Location No. of probes Slk P value Sidak P value Ref gene name and genomic feature CpG feature
10 chr10:104535854-104535920 2 4.62E−07 0.005 WBP1L TSS200; body; 5′UTR;1stExon NA
10 chr19:54567060-54567128 3 3.74E−07 0.004 VSTM1 5′UTR;1stExon; body NA
18 chr22:37678728-37678791 2 2.49E−07 0.002 CYTH4 Body NA
Both Slk = uncorrected Stouffer-Liptak-Kechris P values, and Sidak P values corrected for multiple testing are reported. Here, 5′UTR = 5 prime untranslated region;TSS200 = 0–200 bases upstream from the transcription start sites; TSS1500 = 200–1500 bases upstream from the transcriptional start site; body = gene body
Table 5 Statistically significant differentially methylated regions (DMRs) (Sidak P value < 0.05) for exclusive breastfeeding duration
Age Location No. of probes Slk P value Sidak P value Ref gene name and genomic feature CpG feature
18 chr1:173837002-173837197 7 4.13E−12 9.62E−09 GAS5 Body; TSS150;TSS200 Island, shore
18 chr2:24397787-24397845 3 1.43E−07 0.001 FAM228A TSS200 Island
Both Slk = uncorrected Stouffer-Liptak-Kechris P values, and Sidak P values corrected for multiple testing are reported. Here, 5′UTR = 5 prime untranslated region;TSS200 = 0–200 bases upstream from the transcription start sites; TSS1500 = 200–1500 bases upstream from the transcriptional start site; body = gene body
Sherwood et al. Clinical Epigenetics (2019) 11:128 Page 6 of 10

The study by Obermann–Borst et al. demonstratedthat breastfeeding is associated with DNAm in LEP geneat 17 months of age. Obermann-Borst et al. hypothe-sized that induced epigenetic regulation of leptin expres-sion may be mechanistic in the protective effect ofbreastfeeding against obesity (Fig. 1). Our results supportObermann-Borst et al. findings, at a later stage in child-hood (10 years) but not into young adulthood (18 years).However, though significant, these effect sizes weresmall and we saw varying direction of effect betweenprobes. Stability of DNAm at cg23381058 over timecould not be assessed as it was not present on bothDNAm Bead Chip platforms. However, the majority ofCpGs exhibited moderate stability over time. Thischange in DNAm may be a response to other environ-mental stimuli by 18 years, and indeed it is recognizedthat DNAm levels in an individual alter throughoutchildhood [51].The next stage was to examine whether breastfeeding
duration is associated with obesity in the IOWBC. TheBMI trajectories, devised by Ziyab et al. [42], incorporatethe different age-specific (BMI) thresholds of obesityproposed by the International Obesity Task Force andWHO, allowing analysis of the maintenance of this asso-ciation throughout childhood. A significant associationbetween total breastfeeding duration and the ‘early tran-sient overweight’ BMI trajectory was seen in the subsetof children, matched to 10-year-old samples. It shouldbe noted that the sample size in this trajectory was con-siderably smaller (n = 33 at age 10) than in the normalreference category (n = 211). No association was seen
between total breastfeeding duration and early persistentobesity or delayed overweight trajectory. Again the sam-ple sizes in these trajectories were far smaller (n = 12 atage 10 in early persistent obesity group) than the refer-ence trajectory; therefore, a significant effect of breast-feeding may not have been seen due to low power.Nonetheless, these results suggest breastfeeding durationmay be involved in a short-term inverse association withchildhood obesity. Another independent study examin-ing the BMI trajectories of 276 infants, found that for-mula-fed infants gain weight more rapidly anddisproportionately than breastfed infants [52]. This wasattributed to increased lean mass, suggesting that de-layed obesity associated with breastfeeding is not relatedto increased adiposity in infancy. This evidence contra-dicts our results, which indicates that breastfeeding is in-dependently associated with both DNAm and obesity inchildhood, but not long-term.Multiple studies have demonstrated that DNAm at a
number of loci is significantly associated with childhoodobesity, for example in HIF3A gene [53], as well as leptinand adiponectin, where DNAm is also associated withlow-density lipoprotein cholesterol levels [54, 55]. How-ever, in this case, LEP DNAm levels have been reportedto be negatively associated with BMI, contrasting withthe hypothesis by Obermann-Borst et al., who suggestedthat hypo-methylation on the LEP gene may protectagainst obesity, i.e., reduce BMI. Indeed, we found amixture of increased and decreased methylation indicat-ing the relationship may not be simple. We also soughtto test the association between DNAm and BMI trajec-tory in the IOWBC. DNAm at the CpG site cg23381058,which had shown a significant negative association withtotal and exclusive breastfeeding duration, was found tobe negatively associated with early transient overweight,though mediation analysis of this CpG site was not sig-nificant (P < 0.05). This CpG site is located within an in-tron of LEP, in a transcription factor binding site.Conversely, an effect was seen at cg05091920, thoughhere a decrease in the methylation level was associatedwith the decrease in the log odds of being in early per-sistent obesity trajectory.We recognize that there are some limitations to this
study. Firstly, we had no measurements of DNAm in in-fancy and thus our mediation analysis is based on the
Table 7 Mediation analysis between cg23381058, total breastfeeding duration and BMI Trajectory 3 (Early transient overweight)
Total breastfeeding Exclusive breastfeeding
Probe name Estimate SE P value Probe name Estimate SE P value
cg03084214 6.585 7.330 0.349 cg05091920 − 15.843 10.651 0.125
cg11005360 2.986 15.504 0.366 cg15792829 − 17.064 9.602 0.155
cg23381058 3.183 4.277 0.034* cg18603538 − 1.101 6.033 0.292
cg23753947 -23.567 17.710 0.946 cg23381058 4.805 3.187 0.034*
Table 6 Association between duration of total and exclusivebreastfeeding and BMI trajectory
Total breastfeeding Exclusive breastfeeding
BMI trajectory Estimate SE P value Estimate SE P value
2 0.007 0.007 0.29 0.002 0.014 0.88
3 − 0.02 0.008 0.002* − 0.03 0.015 0.05
4 0.012 0.014 0.40 − 0.02 0.030 0.43
BMI trajectory defined by Ziyab et al. [42]. Columns: trajectory 2 = earlypersistent obesity, trajectory 3 = early transient overweight, trajectory 4 =delayed overweight; estimate = coefficient denoting one-unit (in week)increase in breastfeeding duration is associated with the increase in the logodds of being in BMI trajectory; standard error = standard error of coefficient.P value < 0.05 was considered significant and is indicated by *. Each trajectorywas tested against the control group (BMI trajectory 1)
Sherwood et al. Clinical Epigenetics (2019) 11:128 Page 7 of 10

assumption that DNAm at age 10 years associated withbreastfeeding duration is stable from infancy. Most im-portantly, it is difficult to establish a causal relationshipbetween breastfeeding, DNAm, and obesity. It has beenpreviously reported that changes in DNAm are a conse-quence of obesity [56–58]; however, these studies werelargely conducted in adult populations, and inter-studycomparison is difficult. Furthermore, breastfeeding mayalter DNAm in a tissue-specific manner, and what effectthis DNAm has on LEP expression as well as tissue spe-cificity must be explored. Whilst this study and that ofObermann-Borst et al. used peripheral blood samples,and leptin hormone circulates through the blood, theLEP gene is known to be expressed in adipocytes, ques-tioning the biological relevance. However, it has beendemonstrated that epigenetic markers in blood accur-ately reflect those in adipose tissue [54, 55]. Peripheralblood remains an effective tissue from which to measureDNAm in childhood, though the investigation of alterna-tive tissues is of interest.The findings of this study require replication in other
cohorts with childhood data and larger sample sizes toimprove our understanding of how the relationship be-tween breastfeeding, DNAm, and obesity varies through-out childhood. Cohorts with methylation data from cordblood and matched participants later in childhood couldalso help to establish causality. Epigenome-wide associ-ation studies have helped identify thousands of differen-tially methylated genes, associated with disease processesand/or environmental processes. This will be an import-ant step to identify the importance of DNAm as a mech-anism propagating the long-term protective effects ofbreastfeeding.
ConclusionIn line with previous studies, a significant association ofbreastfeeding duration with altered methylation at sevenCpG sites on LEP gene was observed, and an associationof breastfeeding duration with childhood obesity wasconfirmed. Future studies in larger population samplesare warranted to further explore the potential of DNAmat LEP and other sites in the genome in mediating theeffect of breastfeeding on childhood obesity.
Additional file
Additional file 1: Table S1. Annotation of LEP CpGs used in theanalyses. Table S2. Stability of LEP CpGs (between 10 and 18 years).TableS3. Association between total breastfeeding duration and LEP DNAm (16CpGs) at 18 years. Table S4. Association between exclusive breastfeedingduration and LEP DNAm (16 CpGs) at 18 years. Table S5. Associationbetween total breastfeeding duration and LEP DNAm (23 CpGs) at 10years. Table S6. Association between exclusive breastfeeding durationand LEP DNAm (23 CpGs) at 10 years. Table S7. Association between BMItrajectories and LEP DNAm (at 10 years) at CpGs previously associatedwith total or exclusive breastfeeding duration (associated P-values havebeen shown). Figure S1. Comparisons of methylation level (beta) ofsignificant common CpGs in matched 162 samples (10 and 8 years).(DOCX 3070 kb)
AbbreviationsCpG: Cytosine-phosphate-guanine; DNAm: DNA methylation; IOWBC: Isle ofWight Birth Cohort; LCPUFAs: Long-chain polyunsaturated fatty acids;LEP: Leptin; WHO: World Health Organization
AcknowledgementsWe would like to acknowledge the help of all the staff at The David HideAsthma and Allergy Research Centre in undertaking the assessments of theIsle of Wight Birth Cohort and Nikki Graham for technical support. We wouldalso like to acknowledge the help of the participants and their families whohave helped us over the last two and a half decades.
Authors’ contributionsJWH and FIR conceived and designed the study. WBS analyzed the data andwrote the initial draft. VB, GAL, AHZ, NS, and NM analyzed phenotypes in thecohort. RJK and SHA collected the clinical data. JWH, SE, HZ, and WKdesigned and oversaw the epigenetic studies in the cohort. SHA is the ChiefInvestigator for the IOWBC. All authors read and approved the finalmanuscript.
FundingSHA, WK, HZ, and JWH and ongoing studies in the IOWBC cohort arecurrently supported by the National Institutes of Health (R01AI121226, andR01AI091905, and 1R01HL132321). FIR and JWH acknowledge support fromthe Ageing Lungs in European Cohorts (ALEC) Study (www.alecstudy.org),which has been funded by the European Union’s Horizon 2020 Research andInnovation programme under grant agreement no. 633212.
Availability of data and materialsThe datasets used and/or analyzed during the current study are availablefrom the corresponding author on reasonable request. For access to the fullIsle of Wight Cohort data please see: http://www.allergyresearch.org.uk/studies/birth-cohort/-cohort-data-use
Ethics approval and consent to participateEthical approvals for both IOWBC was obtained from the relevant authoritiesas follows:IOWBC–10-year follow-up: Isle of Wight Local Research Ethics Committee, Isleof Wight Health Authority, Protocol No. 18/98. Date: 20 July 1998. Eighteen-
Table 8 Mediation analysis between cg23381058, total breastfeeding duration, and BMI trajectory 3 (early transient overweight)
Total breastfeeding duration Exclusive breastfeeding duration
Beta 95% CI Lower 95% CI Upper P value Beta 95% CI Lower 95% CI Upper P value
ACME 5.81E−05 − 2.46E−04 4.31E−04 0.73 2.48E−04 − 3.1E−04 1.19E−03 0.42
ADE − 2.43E−03 − 4.94E−03 1.16E−04 0.06 − 2.25E−03 − 7.27E−03 2.76E−03 0.36
Total effect − 2.37E−03 − 4.91E−03 1.42E−04 0.07 − 2.00E-03 − 7.07E−03 3.06E−03 0.42
Prop. mediated − 2.45E−02 − 4.19E−01 2.72E−01 0.76 − 0.12 − 1.66 1.54 0.72
Columns: Effects— ACME average causal mediation effects, ADE average direct effects, Total effect, sum of a mediation (indirect) effect and a direct effect, Prop.mediated proportion of the total effect explained by the mediator
Sherwood et al. Clinical Epigenetics (2019) 11:128 Page 8 of 10

year follow-up: Isle of Wight, Portsmouth, and Southeast Hampshire ResearchEthics Committee. REC reference number: 06/Q1701/34, Date: 21 June 2006.
Consent for publicationNot applicable.
Competing interestsThe authors declare that they have no competing interests.
Author details1Human Development and Health, Faculty of Medicine, University HospitalSouthampton, University of Southampton, Duthie Building, MP808, TremonaRoad, Southampton, Hampshire SO16 6YD, UK. 2Department of CommunityMedicine and Behavioral Sciences, Faculty of Medicine, Kuwait University,Kuwait City, Kuwait. 3College of Social Work, University of South Carolina,Columbia, SC, USA. 4Division of Epidemiology, Biostatistics andEnvironmental Health, School of Public Health, University of Memphis, 236ARobison Hall, Memphis, TN 38152, USA. 5Clinical and Experimental Sciences,Faculty of Medicine, University of Southampton, Southampton, UK. 6TheDavid Hide Asthma and Allergy Research Centre, Isle of Wight, UK. 7Collegeof Veterinary Medicine, Michigan State University, East Lansing, MI, USA.
Received: 22 January 2019 Accepted: 16 August 2019
References1. WHO. Essential Nutrition Actions: improving maternal, newborn, infant and
young child health and nutrition: World Health Organization; 2013.2. McAndrew F, Thompson J, Fellows L, Large A, Speed M, Renfrew MJ. Infant
Feeding Survey 2010: Health and Social Care Information Centre; 2012.3. Victora CG, Bahl R, Barros AJD, França GVA, Horton S, Krasevec J, et al.
Breastfeeding in the 21st century: epidemiology, mechanisms, and lifelongeffect. Lancet. 2016;387(10017):475–90.
4. Sankar MJ, Sinha B, Chowdhury R, Bhandari N, Taneja S, Martines J, et al.Optimal breastfeeding practices and infant and child mortality: a systematicreview and meta-analysis. Acta Paediatr. 2015;104:3–13.
5. Horta B, Victora CG. Short-term effects of breastfeeding: a systematic reviewof the benefits of breastfeeding on diarrhoea and pneumonia mortality:World Health Organization; 2013.
6. Horta BL. Mola CL de, Victora CG. Long-term consequences of breastfeedingon cholesterol, obesity, systolic blood pressure and type 2 diabetes: asystematic review and meta-analysis. Acta Paediatr. 2015;104:30–7.
7. Horta BL, de MCL, Victora CG. Breastfeeding and intelligence: a systematicreview and meta-analysis. Acta Paediatr. 2015 Nov;104:14–9.
8. Amitay EL, Keinan-Boker L. Breastfeeding and Childhood LeukemiaIncidence. JAMA Pediatr. 2015 Jun;169(6):e151025.
9. Lodge CJ, Tan DJ, Lau MXZ, Dai X, Tham R, Lowe AJ, et al. Breastfeedingand asthma and allergies: a systematic review and meta-analysis. ActaPaediatr. 2015 Nov;104:38–53.
10. Yang YW, Tsai CL, Lu CY. Exclusive breastfeeding and incident atopicdermatitis in childhood: a systematic review and meta-analysis ofprospective cohort studies. Br J Dermatol. 2009 Aug;161(2):373–83.
11. Bion V, Lockett GA, Soto-Ramírez N, Zhang H, Venter C, Karmaus W, et al.Evaluating the efficacy of breastfeeding guidelines on long-term outcomesfor allergic disease. Allergy. 2016 May;71(5):661–70.
12. Matheson MC, Allen KJ, Tang MLK. Understanding the evidence for andagainst the role of breastfeeding in allergy prevention. Clin & ExpAllergy. 2012 Jan;42(6):827–851.
13. Beyerlein A, von Kries R. Breastfeeding and body composition in children:will there ever be conclusive empirical evidence for a protective effectagainst overweight? Am J Clin Nutr. 2011 Apr;94(suppl_6):1772S–5S.
14. Uwaezuoke SN, Eneh CI, Ndu IK. Relationship between exclusivebreastfeeding and lower risk of childhood obesity: a narrative review ofpublished evidence. Clin Med Insights Pediatr. 2017 Jan;11:117955651769019.
15. Yan J, Liu L, Zhu Y, Huang G, Wang PP. The association betweenbreastfeeding and childhood obesity: a meta-analysis. BMC Public Health.2014 Dec;14(1).
16. Robinson SM. Infant nutrition and lifelong health: current perspectives andfuture challenges. J Dev Orig Health Dis. 2015 Jun;6(05):384–9.
17. Ballard O, Morrow AL. Human milk composition. nutrients and bioactivefactors. Pediatr Clin North Am. 2013 Feb;60(1):49–74.
18. Micha R, Mozaffarian D. Saturated fat and cardiometabolic risk factors,coronary heart disease, stroke, and diabetes: a fresh look at the evidence.Lipids. 2010 Mar;45(10):893–905.
19. Stroobant W, Braun KV, Jong JCK, Moll HA, Jaddoe VW, Brouwer IA, et al.Intake of different types of fatty acids in infancy is not associated withgrowth, adiposity, or cardiometabolic health up to 6 years of age. J Nutr.2017 Jan:jn241018.
20. Voortman T, van den HEH, Braun KVE, van den BM, Bramer WM,Chowdhurry R, et al. Effects of polyunsaturated fatty acid intake and statusduring pregnancy, lactation, and early childhood on cardiometabolic health:a systematic review. Prog Lipid Res. 2015 Jul;59:67–87.
21. Marincola FC, Dessì A, Corbu S, Reali A, Fanos V. Clinical impact of humanbreast milk metabolomics. Clin Chim Acta. 2015 Dec;451:103–6.
22. Verduci E, Banderali G, Barberi S, Radaelli G, Lops A, Betti F, et al. EpigeneticEffects of Human Breast Milk. Nutrients. 2014 Apr;6(4):1711–24.
23. Pannaraj PS, Li F, Cerini C, Bender JM, Yang S, Rollie A, et al.Association between breast milk bacterial communities andestablishment and development of the infant gut microbiome. JAMAPediatr. 2017 Jul;171(7):647.
24. Canani RB, Di CM, Leone L, Bedogni G, Brambilla P, Cianfarani S, et al.Epigenetic mechanisms elicited by nutrition in early life. Nutr Res Rev. 2011Oct;24(02):198–205.
25. Peter CJ, Fischer LK, Kundakovic M, Garg P, Jakovcevski M, Dincer A, etal. DNA methylation signatures of early childhood malnutritionassociated with impairments in attention and cognition. Biol Psychiatry.2016 Nov;80(10):765–74.
26. Choi S-W, Friso S. Epigenetics: a new bridge between nutrition and health.Adv Nutr. 2010 Oct;1(1):8–16.
27. Hoile SP, Clarke-Harris R, Huang R-C, Calder PC, Mori TA, Beilin LJ, et al.Supplementation with N-3 long-chain polyunsaturated fatty acids or oliveoil in men and women with renal disease induces differential changes inthe DNA methylation of FADS2 and ELOVL5 in peripheral bloodmononuclear cells. Schunck W-H. PLoS One. 2014;9(10):e109896.
28. Obermann-Borst SA, Eilers PHC, Tobi EW, de JFH, Slagboom PE, HeijmansBT, et al. Duration of breastfeeding and gender are associated withmethylation of the LEPTIN gene in very young children. Pediatr Res. 2013Jun;74(3):344–9.
29. Rossnerova A, Tulupova E, Tabashidze N, Schmuczerova J, Dostal M, RossnerP, et al. Factors affecting the 27K DNA methylation pattern in asthmatic andhealthy children from locations with various environments. Mutat Res. 2013Feb;741–742:18–26.
30. Al Maskari MY, Alnaqdy AA. Correlation between serum leptin levels,body mass index and obesity in Omanis. Sultan Qaboos Univ Med J.2006 Dec;6(2):27–31.
31. Yousefi M, Karmaus W, Zhang H, Ewart S, Arshad H, Holloway JW. Themethylation of the LEPR/LEPROT genotype at the promoter and bodyregions influence concentrations of leptin in girls and BMI at age 18years if their mother smoked during pregnancy. Int J Mol EpidemiolGenet. 2013;4(2):86–100.
32. Arshad SH, Holloway JW, Karmaus W, Zhang H, Ewart S, Mansfield L, et al.Cohort profile: the Isle Of Wight Whole Population Birth Cohort (IOWBC). IntJ Epidemiol. 2018.
33. Arshad SH, Karmaus W, Zhang H, Holloway JW. Multigenerationalcohorts in patients with asthma and allergy. J Allergy Clin Immunol.2017 Feb;139(2):415–21.
34. Arshad SH, Hide DW. Effect of environmental factors on the developmentof allergic disorders in infancy. J Allergy Clin Immunol. 1992;90(2):235–41.
35. Lehne B, Drong AW, Loh M, Zhang W, Scott WR, Tan S-T, et al. A coherentapproach for analysis of the Illumina HumanMethylation450 BeadChipimproves data quality and performance in epigenome-wide associationstudies. Genome Biol. 2015;16(1).
36. Johnson WE, Li C, Rabinovic A. Adjusting batch effects in microarrayexpression data using empirical Bayes methods. Biostatistics. 2006;8(1):118–27.
37. Kent WJ, Sugnet CW, Furey TS, Roskin KM, Pringle TH, Zahler AM, et al. Thehuman genome browser at UCSC. Genome Res. 2002;12(6):996–1006.
38. Delbaere I, Vansteelandt S, De BD, Verstraelen H, Gerris J, De SP, et al.Should we adjust for gestational age when analysing birth weights? Theuse of z-scores revisited. Hum Reprod. 2007 Jun;22(8):2080–3.
Sherwood et al. Clinical Epigenetics (2019) 11:128 Page 9 of 10
39. Kitano N, Nomura K, Kido M, Murakami K, Ohkubo T, Ueno M, et al.Combined effects of maternal age and parity on successful initiation ofexclusive breastfeeding. Prev Med Reports. 2016;3:121–6.
40. Aryee MJ, Jaffe AE, Corrada-Bravo H, Ladd-Acosta C, Feinberg AP, HansenKD, et al. Minfi: a flexible and comprehensive bioconductor package for theanalysis of Infinium DNA methylation microarrays. Bioinformatics. 2014;30(10):1363–9.
41. Houseman E, Accomando WP, Koestler DC, Christensen BC, Marsit CJ,Nelson HH, et al. DNA methylation arrays as surrogate measures of cellmixture distribution. BMC Bioinformatics. 2012;13(1):86.
42. Ziyab AH, Karmaus W, Kurukulaaratchy RJ, Zhang H, Arshad SH.Developmental trajectories of Body Mass Index from infancy to 18 years ofage: prenatal determinants and health consequences. J EpidemiolCommunity Health. 2014;68(10):934–41.
43. Cole TJ. Establishing a standard definition for child overweight and obesityworldwide: international survey. BMJ. 2000;320(7244):1240–1240.
44. WHO Child Growth Standards based on length/height, weight and age.Acta Paediatr (Oslo, Norw 1992) Suppl. 2006;450:76–85.
45. Benjamini Y, Hochberg Y. Controlling the false discovery rate: a practicaland powerful approach to multiple testing. J R Stat Soc Ser B [Internet].1995;57(1):289–300. Available from: http://www.jstor.org/stable/2346101
46. Pedersen BS, Schwartz DA, Yang IV, Kechris KJ. Comb-p: software forcombining, analyzing, grouping and correcting spatially correlated P-values.Bioinformatics. 2012 Nov;28(22):2986–8.
47. Tingley D, Yamamoto T, Hirose K, Keele L, Imai K. mediation: RPackage forcausal mediation analysis. J Stat Softw. 2014;59(5).
48. Hartwig FP, Loret de Mola C, Davies NM, Victora CG, Relton CL.Breastfeeding effects on DNA methylation in the offspring: a systematicliterature review. PLoS One [Internet]. 2017;12(3):e0173070 Available from:https://doi.org/10.1371/journal.pone.0173070.
49. Karlsson O, Rodosthenous RS, Jara C, Brennan KJ, Wright RO, Baccarelli AA, etal. Detection of long non-coding RNAs in human breastmilk extracellularvesicles: Implications for early child development. Epigenetics [Internet]. 2016;11(10):721–729. Available from: https://doi.org/10.1080/15592294.2016.1216285
50. Rzehak P, Covic M, Saffery R, Reischl E, Wahl S, Grote V, et al. DNA-methylation and body composition in preschool children: epigenome-wide-analysis in the European Childhood Obesity Project (CHOP)-Study. Sci Rep.2017;7(1):14349.
51. Gervin K, Andreassen BK, Hjorthaug HS, Carlsen KCL, akon CK-H, Undlien DE,et al. Intra-individual changes in DNA methylation not mediated by cell-type composition are correlated with aging during childhood. ClinEpigenetics. 2016;8(1).
52. Bell KA, Wagner CL, Feldman HA, Shypailo RJ, Belfort MB. Associations ofinfant feeding with trajectories of body composition and growth. Am J ClinNutr. 2017;106(2):491–8.
53. Wang S, Song J, Yang Y, Zhang Y, Wang H, Ma J. HIF3A DNA methylation isassociated with childhood obesity and ALT. Costa M, editor. PLoS One.2015;10(12):e0145944.
54. Houde A-A, Légaré C, Biron S, Lescelleur O, Biertho L, Marceau S, et al.Leptin and adiponectin DNA methylation levels in adipose tissues andblood cells are associated with BMI, waist girth and LDL-cholesterol levels inseverely obese men and women. BMC Med Genet. 2015;16(1).
55. Li R, Fein SB, Grummer-Strawn LM. Do infants fed from bottles lack self-regulation of milk intake compared with directly breastfed infants?Pediatrics. 2010;125(6):e1386–93.
56. Dick KJ, Nelson CP, Tsaprouni L, Sandling JK, Aïssi D, Wahl S, et al. DNAmethylation and body-mass index: a genome-wide analysis. Lancet. 2014Jun;383(9933):1990–8.
57. Ronn T, Volkov P, Gillberg L, Kokosar M, Perfilyev A, Jacobsen AL, et al.Impact of age, BMI and HbA1c levels on the genome-wide DNAmethylation and mRNA expression patterns in human adipose tissue andidentification of epigenetic biomarkers in blood. Hum Mol Genet. 2015;24(13):3792–813.
58. Wahl S, Drong A, Lehne B, Loh M, Scott WR, Kunze S, et al. Epigenome-wideassociation study of body mass index, and the adverse outcomes ofadiposity. Nature. 2017;541(7635):81–6.
Publisher’s NoteSpringer Nature remains neutral with regard to jurisdictional claims inpublished maps and institutional affiliations.
Sherwood et al. Clinical Epigenetics (2019) 11:128 Page 10 of 10