Localization of orexin-A-immunoreactive fibers in the mesencephalic trigeminal nucleus of the rat
Upload
independentCategory
view
0download
0
1
Supplemental Data Cell Metabolism, Volume 9 Enhanced Orexin Receptor-2 Signaling Prevents Diet-Induced Obesity and Improves Leptin Sensitivity Hiromasa Funato, Allen L. Tsai, Jon T. Willie, Yasushi Kisanuki, S. Clay Williams, Takeshi Sakurai, and Masashi Yanagisawa
Supplemental Figure Legends
Figure S1. Immunohistochemistry for orexin-A in the brain.
(A) Wild-type mouse exhibits orexin-A-positive neurons in the lateral
hypothalamic area (LHA). (B) CAG/orexin mouse shows strong orexin-A
immunoreactivity in the arcuate nucleus (ARH), ventromedial nucleus (VMH),
dorsomedial nucleus (DMH) and LHA, in addition to native orexin-A positive
neurons in LHA. CAG/orexin mouse also shows orexin-A immunoreactivity in the
suprachiasmatic nucleus (SCN)(C), nucleus accumbens shell (AcbSh)(D), globus
pallidus (GP)(E), stratus moleculare of Cornu Ammonis (CA)(F), the hilus of the
dentate gyrus (DG)(F), substantia nigra (SN)(G), area postrema (AP)(H), and
nucleus of the solitary tract (NTS)(H). Abbreviations: aca, anterior branch of the
anterior commissure; AHA, anterior hypothalamic area; CPu, caudate putamen; f,
fornix; LV, lateral ventricle; PVH, paraventricular nucleus; SP, septum; VTA,
ventral tegmental area. Scale bars: 400 μm
The immunohistochemistry for orexin-A was performed as described
previously (Chemelli et al., 1999) with some modifications. In brief, 3-5 month-
old male mice fed a low fat diet were deeply anesthetized with ketamine and
xylazine and transcardially perfused with PBS, and subsequently with 4%
paraformaldehyde. Brains were dissected and postfixed for 12 hr in 4%

2
paraformaldehyde before equilibrating in 30% sucrose. Free-floating sections
(35 um-thickness) were incubated in goat-serum before incubated in 1:1000
dilution of rabbit anti-orexin-A antibody (Chemicon, AB3704). Diaminobenzidine
was used to visualize orexin-A immunoreactivity.
Figure S2
Orexin-A-positive neurons and fibers.
(A) Orexin-A-positive neurons and fibers are observed in LHA of wild-type
mouse. (B) CAG/orexin mouse shows similar number of strong orexin-A
immunoreactive neurons and fibers in LHA as wild-type mouse. In addition,
weak immunoreactivities for orexin-A are recognized through LHA. (C) Orexin-A-
positive neurons and fibers are observed in LHA of wild-type mouse with
negligible background staining. (D) In addition to strongly orexin-A-positive
neurons, weak immunoreactivities are recognized in many cell bodies (indicated
by arrowheads). (E) Orexin-A-positive fibers are seen in ARH of wild-type
mouse. (F) In addition to orexin-A-positive fibers, weak orexin immunoreactivity
is recognized through ARH of CAG/orexin mouse. (G) SCN of wild-type mouse
is free from orexin-A-immunoreactivity. (H) CAG/orexin mouse shows weakly to
moderately orexin-A-immunoreactivities in cell bodies in SCN. (I) Dense orexin-
A-positive fibers are seen in dorsal raphe (DR) of wild-type mouse. (J)
CAG/orexin mouse shows dense orexin-A-positive fibers in DR as wild-type
mouse. The scale bars on (A) and (C) indicate 100 μm and 40μm, respectively.
The magnifications of (A) and (C) are same with (B, E, F, I, J) and (D, G, H),

3
respectively. (C, D, G, H) are observed using Nomarski differential-interference
contrast.
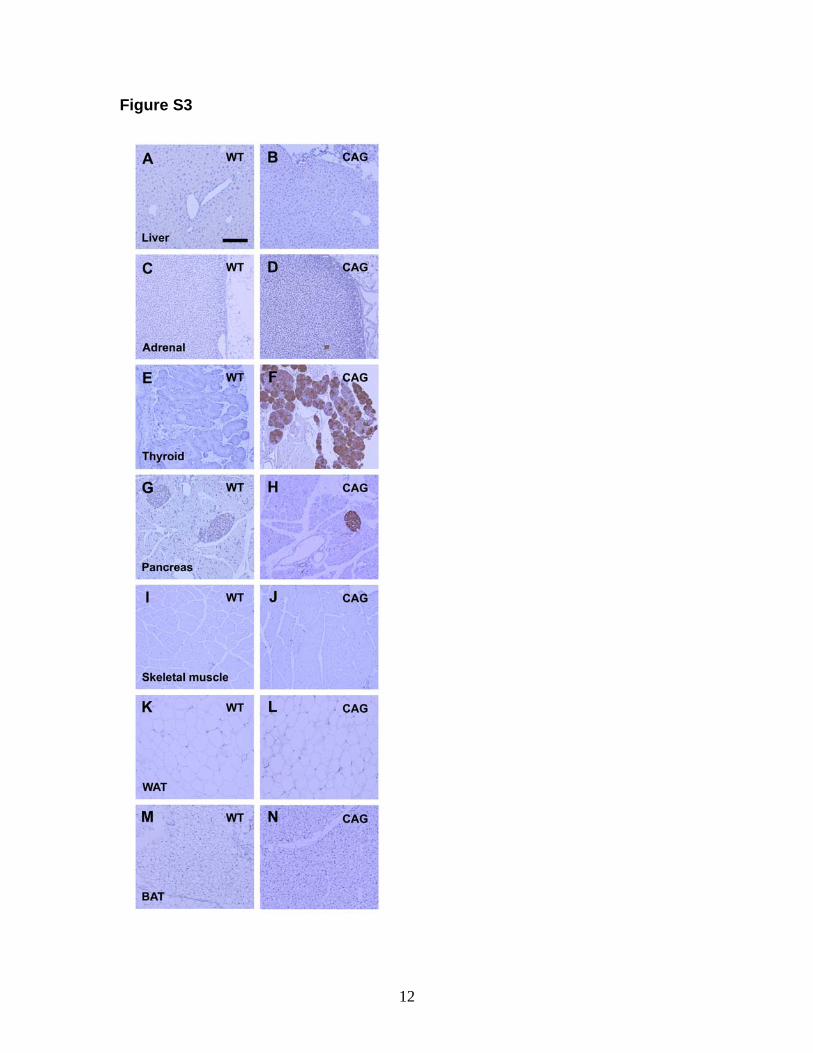
Figure S3
Immunohistochemistry for orexin-A in the peripheral tissues.
Wild-type mice did not exhibit orexin-A immunoreactivity in the liver (A), adrenal
gland (C), thyroid (E), pancreas (G), skeletal muscle (I), white adipose tissue (K),
and brown adipose tissue (M). CAG/orexin mice exhibited orexin-A
immunoreactivity in the thyroid (F), islet of the pancreas (H) and scattered orexin-
A-positive areas in the medulla of the adrenal gland (D), while no
immunoreactivity was observed in the liver (B), skeletal muscle (J), white adipose
tissue (L), and brown adipose tissue (N). Scale bar: 400 μm
Immunohistochemistry was performed as described in Figure S1 for male mice
fed a low fat diet.
Figure S4
The energy expenditure with effective mass correction and respiratory quotient of
orexin signaling-modified mice on a low fat diet
(A, B) The energy expenditure with effective mass correction (A) and respiratory
quotient (B) over 24 hr of CAG/orexin mice and wild-type mice.
(C, D) The energy expenditure with effective mass correction (A) and respiratory
quotient (B) over 24 hr of OX1R-/-; CAG/orexin mice and OX1R-/- mice.
(E, F) The energy expenditure with effective mass correction (A) and respiratory

4
quotient (B) over 24 hr of OX2R-/-; CAG/orexin mice and OX2R-/- mice.
(G, H) The averaged energy expenditure with effective mass correction (G) and
respiratory quotient (H).
Data were sampled every 40 min. Used mice are at the age of 16-20 weeks. The
numbers of mice are 6-9 mice per group. Data are expressed as means ± SEM.
Figure S5
Locomotion of orexin signaling-modified mice.
(A, B) The locomotion over 24 hr of CAG/orexin mice and wild-type mice on a
low fat (A) and a high fat diet (B) .
(C, D) The locomotion over 24 hr of OX1R-/-; CAG/orexin mice and OX1R-/- mice
on a low fat (C) and a high fat diet (D).
(E, F) The locomotion over 24 hr of OX2R-/-; CAG/orexin mice and OX2R-/- mice
on a low fat (E) and a high fat diet (F).
(G) The averaged locomotion of each genotypic group under different fat diet
condition.
Data were sampled every 40 min. Used mice are at the age of 16-20 weeks. The
numbers of mice are 6-9 mice per group. Data are expressed as means ± SEM.
Figure S6
Unaltered preference of CAG/orexin mice over high fat diet and sucrose-
containing water
(A) Both CAG/orexin mice and wild-type mice showed high preference over high

5
fat diet. The graph shows the food intake of high fat diet divided by total food
intake for 14 days.
(B) CAG/orexin mice consumed sucrose-containing water during two bottle
choice test in a similar volume as wild-type mice did.
(C) CAG/orexin mice showed preference to sucrose as wild-type mice did.
Two food bottles which contain a low fat diet or a high fat diet were put in
the cage of individually housed male mice. Mice were fed a low fat diet before
food preference test. The food intake for 14 days was measured.
Two drink bottles which contains water or sucrose-containing water were
put in the cage of individually housed mice fed a low fat diet. On the first 3
consecutive days, 3-5 month-old male mice were given the choice of water or 1%
sucrose solution. On next 3 consecutive days, the same mice were given the
choice of water or 10% sucrose solution. The position of two bottles was
switched daily and the daily drink volume was measured. Sucrose preference
was determined by the daily consumption of sucrose-containing water divided by
the daily total fluid consumption. 5-10 mice per group. Data are expressed as
means ± SEM.
Figure S7
Glucose tolerance of CAG/orexin transgenic mice fed a low fat diet.
CAG/orexin transgenic male mice fed a low fat diet has fasted glucose levels
similar to wild-type mice. Likewise, after the administration of glucose, the
glucose levels of CAG/orexin transgenic mice were similar to those of wild-type

6
mice at all time points tested.
Glucose tolerance test was performed as described in the method section.
3-4 month-old mice was used. 6-8 mice per group. Data are expressed as
means ± SEM.
Figure S8
Serum TSH, T3, and T4 levels of CAG/orexin mice.
(A) Serum TSH levels of CAG/orexin mice were significantly increased on a
high fat diet compared to those on a low fat diet while there was no significant
difference in serum TSH of wild-type mice on between a low and a high fat diet.
(B, C) Both CAG/orexin mice and wile type mice showed increased levels of T3
and T4 on a high fat condition. There was no significant difference between wilt
type and CAG/orexin mice in the levels of TSH(A) , T3(B), and T4(C).
Blood was collected at the late light phase at the age of 30 weeks. Serum
T3, T4, and TSH was determined by Dr. A. F. Parlow at the National Hormone
and Peptide Program using RIAs. 8-10 mice per group. We used Kruskal-Wallis
test to assess TSH data because there were some samples showing below the
detection limit (48 ng/ml). Data are expressed as means ± SEM.
Figure S9
UCPs mRNA expression in the brown adipose tissue and skeletal muscle.
(A) High fat diet increased UCP1 mRNA of CAG/orexin and wild-type mice.
There was no significant difference in UCP1 mRNA expression between

7
CAG/orexin and wild-type mice on each diet condition. Neither UCP2 nor 3
mRNA were affected by diet or by CAG/orexin transgene.
(B) None of UCP1, 2, or 3 mRNA was affected by diet or the CAG/orexin
transgene.
After 2 weeks of high fat diet feeding, we harvested the brown adipose
tissue and skeletal muscle of 3-4 month-old mice. RNA preparation and
quantitative PCR have been done as described in the methods section. UCPs
mRNA expression levels are normalized by GAPDH mRNA level and further
normalized by the average UCPs mRNA expression levels of wild-type mice on
low fat diet. 4-6 mice per group. Data are expressed as means ± SEM.
Figure S10
Adrenalin-related hormone levels and blood pressure of CAG/orexin mice
(A, B) CAG/orexin mice and wild-type mice had comparable levels of
epinephrine (A) and norepinephrine (B) in urine collected for 24 hours.
Urine was collected for 3 consecutive days from male mice fed a low fat
diet. Urinary epinephrine and norepinephrine concentrations were measured
using CatCombi ELISA kit (IBL) and normalized to body weight. Urine was
collected into 0.1N hydrochloric acid solution according to the manufacturer’s
protocol. 5 mice per group.
(C) No significant difference was observed in serum corticosterone levels
between wild-type mice and CAG/orexin mice. Blood was collected at the late
light phase. Serum corticosterone was determined using Corticosterone EIA

8
(Immunodiagnostic systems). 8-10 mice per group.
(D) No significant difference was observed in systolic blood pressure between
wild-type mice and CAG/orexin mice under low fat diet or high fat diet. Blood
pressure was measured with tail cuff method using the BP-2000 Blood Pressure
Analysis System II (Visitech Systems) after 4 days of acclimatization. 6 mice per
group. Data are expressed as means ± SEM.
Figure S11
Sleep/Awake analysis during ICV administration of OX2R agonist.
(A) Total time spent in each stage. There was no significant difference in daily
total time spent in wake, NREM, or REM.
(B) Episode duration in each stage. OX2R agonist-infused mice fed a low fat diet
showed longer duration for wake and NREM stages than PBS-infused mice fed a
low fat diet and OX2R agonist-infused mice fed a high fat diet.
We performed surgery for the implantation of an EEG/EMG electrode and
an osmotic pump-connected ICV cannula at a time at day0. Mice were
maintained on a low fat diet before and after surgery. From day9 to day10,
EEG/EMG recording for a low fat diet was performed as described previously
(Chemelli et al. Cell 1999; Willie et al Neuron 2003). Then, the diet was switched
to a high fat diet at day11 and further recorded EEG/EMG until day14. Osmotic
pumps infused OX2R agonist (0.5nmol/day) or PBS in the lateral ventricle for 14
days. 5 mice per group. Statistically significances were shown only within the
same food condition or the same drug infusion condition. Data are expressed as

9
means ± SEM.

10
Supplementary Figures
Figure S1

11
Figure S2
12
Figure S3

13
Figure S4

14
Figure S5

15
Figure S6

16
Figure S7

17
Figure S8

18
Figure S9

19
Figure S10

20
Figure S11

21
Table S1
Immunohistochemistry of Orexin-A
wild type CAG/orexin
Region cell body nerve fiber cell body nerve fiber
Cerebral cortex Cerebral cortex - + - + Anterior olfactory nucleus - ± - ± Olfactory tubercle - ± - ± Piriform cortex - ± - ± Endopiriform nucleus - ± - ± Basal ganglia Accumbens nucleus, shell - ± + + Accumbens nucleus, core - - ± - Lateral septal nucleus - + - + Medial septal nucleus - + - + Nucleus of the diagonal band - + ± + Caudate putamen - - - - Globus pallidus - - - - Bed nucleus of the stria terminalis - ++ ± ++ Anterior cortical amygdaloid nucleus - - - - Postetolateral cortical amygdaloid nucleus
- - - -
Postetomedial cortical amygdaloid nucleus
- - - -
Basolateral amygdaloid nucleus - ± - ± Basomedial amygdaloid nucleus - ± - ± Central amygdaloid nucleus - + - + Lateral amygdaloid nucleus - ± - ± Hippocampal formation

22
CA1 - - + - CA2 - - + - CA3 - - + - Dentate gyrus - - + - Subiculum - - - - Thalamus Anteriodorsal thalamic nucleus - - - - Anteriomedial thalamic nucleus - - - - Intermediodorsal thalamic nucleus - ± - ± Mediodorsal thalamic nucleus - - - - Laterodorsal thalamic nucleus - - - - Paraventricular thalamic nucleus - ++ - ++ Reuniens thalamic nucleus - + + + Central medial thalamic nucleus - ++ + ++ Lateral posterior thalamic nucleus - - - - Ventrolateral thalamic nucleus - - - - Ventromedial thalamic nucleus - - - - Reticular thalamic nucleus - - - - Zona incerta - + - + Epithalamus Medial habenular nucleus - - - - Lateral habenular nucleus - + - + Hypothalamus Medial preoptic nucleus - ++ + ++ Paraventricular hypothalamic nucleus - ++ + ++ Suprachiasmatic nucleus - - ++ - Anterior hypothalamic area - ++ + ++ Arcuate hypothalmic nucleus - ++ + ++ Ventromedial hypothalamic nucleus - ++ + ++ Dorsomedial hypothalamic nucleus - ++ + ++

23
Lateral hypothalamic area +++ +++ ++++ +++ Posterior hypothalamic area - ++ + ++ Lateral mammillary nucleus - - - - Medial mammillary nucleus - - - - Supramammillary nucleus - ++ - ++ Tuberomammillary nucleus - ++ ± ++ Brain stem and cerebellum Substance nigra, compact part - + + + Substance nigra, reticular part - - - - Ventral tegmental area - ++ + ++ Superior colliculus - ± - ± Inferior colliculus - ± - ± Interpeduncular nucleus - + - + Red nucleus - - - - Cerebellum - - - - Vestibular nucleus - ± - ± Oculomotor nucleus - - - - Motor trigeminal nucleus - - - - Facial nucleus - ± - ± Dorsal motor nucleus of vagus - ± - ± Hypoglossal nucleus - ± - ± Nucleus of the solitary tract - ++ + ++ Area postrema - + + + Parabrachial nucleus - ++ ± ++ Spinal trigeminal nucleus - - - - Dorsal raphe nucleus - ++ ± ++ Median raphe nucleus - ++ ± ++ Dorsal tegmental nucleus - - ± - Laterodorsal tegmental nucleus - ++ + ++ Locus coeruleus - ++ + ++ Periaqueductal gray - ++ ± ++ Pontine nucleus - - - -

24
Pontine reticular nucleus - ± - ± Inferior olivary nucleus - - - - Gigantocellular reticular nucleus - + ± +
Except LHA and SCN, orexin-A-immunoreactivity of cell body of CAG/orexin mouse is weak. Nomenclatures were based on Paxinos and Franklin.
Reference Paxinos G, Watson C. The mouse brain in stereotaxic coordinates, 2nd edition, Academic Press. (2000)
25
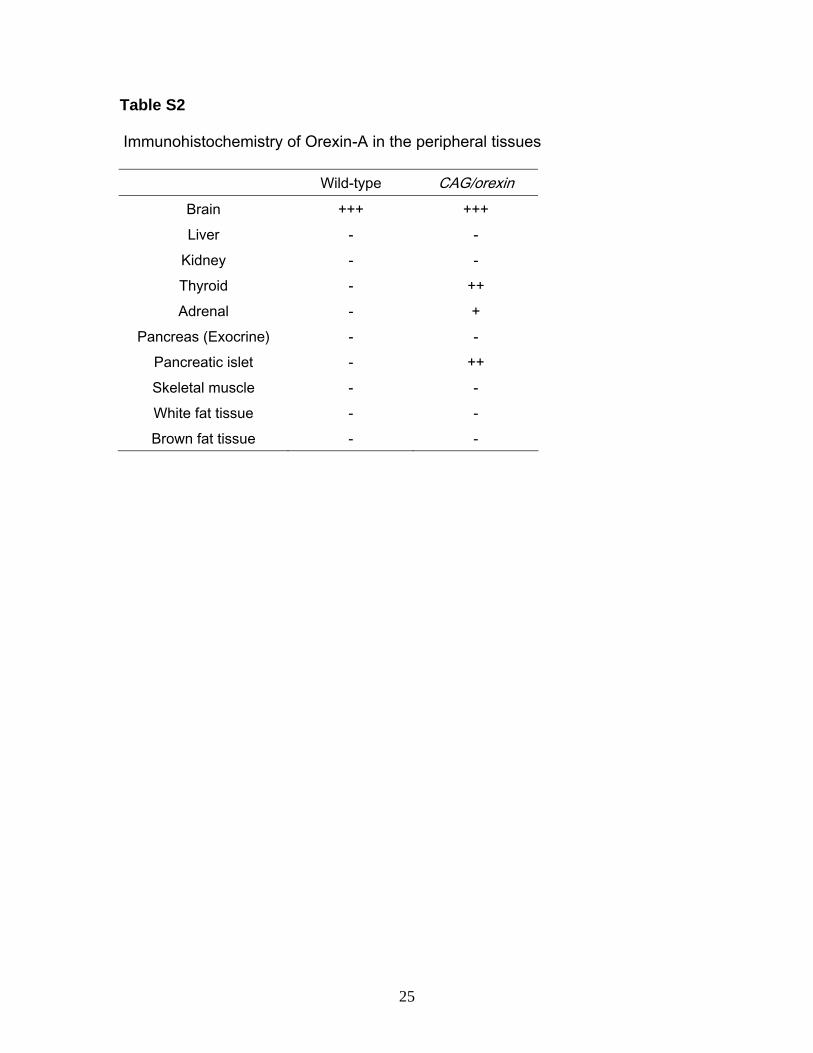
Table S2
Immunohistochemistry of Orexin-A in the peripheral tissues
Wild-type CAG/orexin Brain +++ +++ Liver - -
Kidney - - Thyroid - ++ Adrenal - +
Pancreas (Exocrine) - - Pancreatic islet - ++ Skeletal muscle - - White fat tissue - - Brown fat tissue - -

26
Table S3
Distribution of orexin receptors in peripheral tissues
Tissue Method OX1R OX2R Species Reference
Northern − − Rat Sakurai (1998) Heart RT-PCR − − Rat Johren (2001) RT-PCR, IHC
+ − Rat Kirchgessner (1999)
Stomach
RT-PCR − − Rat Johren (2001) Jejunum qPCR − − Mouse This study
Northern − − Rat Sakurai (1998) RT-PCR − − Rat Johren (2001)
Liver
qPCR − − Mouse This study RT-PCR − − Rat Johren (2001) RT-PCR + + Rat Kirchgessner
(1999) RT-PCR + + Rat Nowak (2005)
Pancreas
qPCR − − Mouse This study IHC + − Rat Kirchgessner
(1999) Pancreatic islet
qPCR 3% of brain expression level
30% of brain expression level
Mouse This study
RT-PCR + ND Rat Johren (2001) Thyroid gland qPCR 3% of brain
expression level
2% of brain expression level
Mouse This study
RT-PCR, IHC
− + Human Randeva (2001)
IHC + − Human Blanco (2002) RT-PCR, IHC
+ + Human, rat
Spinazzi (2005)
Adrenal cortex
RT-PCR − + Rat Johren (2001)

27
RT-PCR + + Rat Lopez (1999) RT-PCR − − Rat Johren (2001)
Adrenal medulla
IHC − + Human Blanco (2002) RT-PCR − − Rat Johren (2001) RT-PCR, IHC
+ + Human Digby (2006) White adipose tissue
qPCR − − Mouse This study Northern − − Rat Sakurai (1998) Skeletal
muscle RT-PCR − − Rat Johren (2001)
IHC, immunohistochemistry; RT-PCR, reverse transcriptase PCR; qPCR, quantitative
RT-PCR; +, detected; −, not detected; ND, not done.
References
Blanco, M., García-Caballero, T., Fraga, M., Gallego, R., Cuevas, J., Forteza, J.,
Beiras, A., and Diéguez, C. (2002). Cellular localization of orexin receptors in
human adrenal gland, adrenocortical adenomas and pheochromocytomas.
Regul. Pept. 15, 161–165.
Digby, J.E., Chen, J., Tang, J.Y., Lehnert, H., Matthews, R.N., and Randeva,
H.S. (2006). Orexin receptor expression in human adipose tissue: effects of
orexin-A and orexin-B. J. Endocrinol 191. 129–136.
Heinonen, M.V., Purhonen, A.K., Mäkelä, K.A., and Herzig, K.H. (2008).
Functions of orexins in peripheral tissues. Acta Physiol. 192. 471-485.
Johren, O., Neidert, S.J., Kummer, M., Dendorfer, A., and Dominiak, P. (2001).
Prepro-orexin and orexin receptor mRNAs are differentially expressed in
peripheral tissues of male and female rats. Endocrinology 142, 3324–3331.
Kirchgessner, A.L., and Liu, M. (1999). Orexin synthesis and response in the gut.

28
Neuron 24. 941–951.
Lopez, M., Senaris, R., Gallego, R., García-Caballero, T., Lago, F., Seoane, L.,
Casanueva, F., and Diéguez, C. (1999). Orexin receptors are expressed in the
adrenal medulla of the rat. Endocrinology 140. 5991–5994.
Nowak, K.W., Strowski, M.Z., Switonska, M.M., Kaczmarek, P., Singh, V., Fabis,
M., Mackowiak, P., Nowak, M., and Malendowicz, L.K. (2005). Evidence that
orexins A and B stimulate insulin secretion from rat pancreatic islets via both
receptor subtypes. Int J Mol Med 15. 969–972.
Randeva, H.S., Karteris, E., Grammatopoulos, D., and Hillhouse, E.W. (2001).
Expression of orexin-A and functional orexin type 2 receptors in the human adult
adrenals: implications for adrenal function and energy homeostasis. J. Clin.
Endocrinol. Metab. 86, 4808–4813.
Sakurai, T., Amemiya, A., Ishii, M., Matsuzaki, I., Chemelli, R.M., Tanaka, H.,
Williams, S.C., Richarson, J.A., Kozlowski, G.P., Wilson, S., et al. (1998).
Orexins and orexin receptors: a family of hypothalamic neuropeptides and G
protein-coupled receptors that regulate feeding behavior. Cell 92. 573–585.
Spinazzi, R., Rucinski, M., Neri, G., Malendowicz, L.K. & Nussdorfer, G.G.
(2005). Preproorexin and orexin receptors are expressed in cortisol-secreting
adrenocortical adenomas, and orexins stimulate in vitro cortisol secretion and
growth of tumor cells. J. Clin. Endocrinol. Metab. 90, 3544–3549.
Takahashi, K., Arihara, Z., Suzuki, T., Sone, M., Kikuchi, K., Sasano, H.,
Murakami, O., and Totsune, K. (2006). Expression of orexin-A and orexin
receptors in the kidney and the presence of orexin-A-like immunoreactivity in

29
human urine. Peptides 27. 871–877.
Copyright © 2022 FDOKUMEN