Aurora-A prevents transcription-replication conflicts in MYCN ...
172
Aurora-A prevents transcription-replication conflicts in MYCN-amplified neuroblastoma Aurora-A verhindert Transkriptions-Replikationskonflikte in MYCN-amplifizierten Neuroblastomen Doctoral thesis for a doctoral degree at the Graduate School of Life Sciences Julius-Maximilians-Universität Würzburg, Section: Biomedicine submitted by Isabelle Röschert from Ober-Hilbersheim Würzburg 2021
-
Upload
khangminh22 -
Category
Documents
-
view
1 -
download
0
Transcript of Aurora-A prevents transcription-replication conflicts in MYCN ...

Aurora-A prevents transcription-replication conflicts in MYCN-amplified neuroblastoma
Aurora-A verhindert Transkriptions-Replikationskonflikte in MYCN-amplifizierten Neuroblastomen
Doctoral thesis
for a doctoral degree
at the Graduate School of Life Sciences
Julius-Maximilians-Universität Würzburg,
Section: Biomedicine
submitted by
Isabelle Röschert
from Ober-Hilbersheim
Würzburg 2021

Members of the thesis committee:
Chairperson: Prof. Alexander Buchberger
Primary supervisor: Prof. Martin Eilers
Second supervisor: Prof. Manfred Gessler
Third supervisor: Prof. Stefan Knapp
Submitted on:
Date of Public Defense:
Date of Receipt of Certificates:

Substantial part of this thesis was published in the following article:
Roeschert I.*, Poon E.*, Henssen A.G., Dorado-Garcia H., Gatti M., Giansanti C., Jamin Y.,
Ade C.P., Gallant P., Schülein-Völk C., Beli P., Richards M., Rosenfeldt M., Altmeyer M.,
Anderson J., Eggert A., Dobbelstein M., Bayliss R., Chesler L., Büchel G. & Eilers M. (2021):
Combined inhibition of Aurora-A and ATR kinases results in regression of MYCN-amplified
neuroblastoma. Nature Cancer, https://doi.org/10.1038/s43018-020-00171-8
* authors contributed equally

Content Summary ................................................................................................................................. 1 Zusammenfassung ................................................................................................................. 2 1 Introduction ......................................................................................................................... 3
1.1 Neuroblastoma ............................................................................................................... 3 1.1.1 Classification systems .............................................................................................. 4 1.1.2 Prognostic features .................................................................................................. 5 1.1.3 Molecular differences in neuroblastoma .................................................................. 8
1.2 Cell cycle ...................................................................................................................... 10 1.2.1 Cell cycle checkpoints ............................................................................................ 10 1.2.2 Transcription, replication, and their coordination ................................................... 13
1.3 The transcription factor MYC ........................................................................................ 18 1.3.1 The family of MYC transcription factors ................................................................. 18 1.3.2 Structural and functional domains of the MYC protein ........................................... 19 1.3.3 Transcriptional functions of MYC ........................................................................... 21 1.3.4 Regulation of MYC ................................................................................................. 23
1.4 The kinase Aurora-A ..................................................................................................... 26 1.4.1 The family of Aurora kinases .................................................................................. 26 1.4.2 Canonical, mitotic functions of Aurora-A ................................................................ 27 1.4.3 Aurora-A in cancer ................................................................................................. 29 1.4.4 Mechanisms of regulation ...................................................................................... 30 1.4.5 Aurora-A and MYCN .............................................................................................. 32 1.4.6 Inhibition of Aurora-A ............................................................................................. 33
1.5 Aim of the thesis ........................................................................................................... 35 2 Materials ............................................................................................................................. 36
2.1 Cell lines and bacterial strains ...................................................................................... 36 2.1.1 Human cell lines ..................................................................................................... 36 2.1.2 Murine cell lines ..................................................................................................... 36 2.1.3 Bacterial strains ...................................................................................................... 36
2.2 Cultivation media and supplements .............................................................................. 36 2.2.1 Cultivation media for cell culture ............................................................................ 36 2.2.2 Supplements and inhibitors for cell lines ................................................................ 37 2.2.3 Cultivation media for bacterial strains .................................................................... 37 2.2.4 Supplements for bacterial strains ........................................................................... 38
2.3 Buffers and solutions .................................................................................................... 38 2.4 Standards, Enzymes, and Kits ...................................................................................... 41
2.4.1 Standards ............................................................................................................... 41 2.4.2 Enzymes ................................................................................................................ 41 2.4.3 Kits ......................................................................................................................... 41
2.5 Nucleic acids ................................................................................................................. 42 2.5.1 Primers ................................................................................................................... 42 2.5.2 shRNAs .................................................................................................................. 43 2.5.3 siRNAs ................................................................................................................... 44 2.5.4 Plasmids ................................................................................................................. 44
2.6 Antibodies ..................................................................................................................... 46 2.6.1 Primary antibodies for immunoblotting ................................................................... 46 2.6.2 Primary antibodies for immunofluorescence .......................................................... 46 2.6.3 Antibodies for ChIP ................................................................................................ 47

2.6.4 Secondary antibodies for immunoblotting .............................................................. 47 2.6.5 Secondary antibodies for Immunofluorescence ..................................................... 47
2.7 Consumables ................................................................................................................ 47 2.8 Equipment ..................................................................................................................... 48 2.9 Softwares and online programs .................................................................................... 49
3 Methods .............................................................................................................................. 50 3.1 Cell-biological methods ................................................................................................. 50
3.1.1 Cultivation of eukaryotic cell lines .......................................................................... 50 3.1.2 Transfection of cells ............................................................................................... 50 3.1.3 Lentivirus production .............................................................................................. 51 3.1.4 Lentiviral infection .................................................................................................. 51 3.1.5 Cell cycle synchronization of cells .......................................................................... 51 3.1.6 Harvesting and lysis of cells ................................................................................... 52 3.1.7 Fractionation of cells .............................................................................................. 52 3.1.8 FACS analyses ...................................................................................................... 52 3.1.9 Crystal violet staining ............................................................................................. 53
3.2 Molecular biology methods ........................................................................................... 54 3.2.1 Transformation of competent bacteria with plasmid DNA ...................................... 54 3.2.2 Isolation of plasmid DNA from bacteria .................................................................. 54 3.2.3 Restriction analysis of DNA .................................................................................... 54 3.2.4 Gel electrophoresis separating DNA fragments ..................................................... 55 3.2.5 Extraction and purification of DNA fragments ........................................................ 55 3.2.6 Ligation of DNA fragments into plasmids ............................................................... 55 3.2.7 Cloning ................................................................................................................... 56 3.2.8 Concentration measurement of nucleic acids ........................................................ 57 3.2.9 Nucleic acid isolation .............................................................................................. 57 3.2.10 Complementary DNA (cDNA) synthesis .............................................................. 58 3.2.11 Quantitative PCR (qPCR) .................................................................................... 59
3.3 Protein biochemical methods ........................................................................................ 59 3.3.1 Quantification of protein using colorimetric methods ............................................. 59 3.3.2 Bis-Tris gel electrophoresis .................................................................................... 60 3.3.3 Immunoblotting ....................................................................................................... 60 3.3.4 Chromatin Immunoprecipitation (ChIP) .................................................................. 61 3.3.5 Immunofluorescence .............................................................................................. 62 3.3.6 Proximity ligation assay (PLA) ............................................................................... 62 3.3.7 Phosphoproteomic analysis ................................................................................... 63
3.4 Next generation sequencing ......................................................................................... 64 3.4.1 ChIP-sequencing (ChIP-seq) ................................................................................. 65 3.4.2 RNA-sequencing (RNA-seq) .................................................................................. 66 3.4.3 4-thio-uridine (4sU)-sequencing (4sU-seq) ............................................................ 66
4 Results ............................................................................................................................... 68 4.1 Binding of Aurora-A to chromatin in S phase is MYCN-dependent .............................. 68
4.1.1 Binding of Aurora-A to chromatin changes during cell cycle .................................. 68 4.1.2 Chromatin association of Aurora-A in S phase is MYCN-dependent ..................... 69 4.1.3 Aurora-A is unphosphorylated in S phase .............................................................. 70
4.2 Identification of MYCN-dependent Aurora-A substrates in S phase ............................. 72 4.2.1 Identification of Aurora-A substrates in S phase .................................................... 72 4.2.2 Phosphoproteomics upon MYCN inhibition ............................................................ 77 4.2.3 Putative substrates of Aurora-A are in close proximity to MYCN and Aurora-A..... 79
4.2.4 Aurora-A phosphorylates histone 3 in S phase ...................................................... 80 4.2.5 pH3S10 is also regulated MYCN-dependent ......................................................... 86
4.3 Aurora-A regulates H3 deposition and thereby prevents transcription-replication conflicts in S phase ............................................................................................................. 88
4.3.1 Aurora-A leads to incorporation of H3.3 ................................................................. 88 4.3.2 Aurora-A inhibition impairs RNAPII function .......................................................... 89 4.3.3 Short-term inhibition of Aurora-A does not impact gene expression in S phase .... 92 4.3.4 Aurora-A inhibition impairs global splicing in S phase ........................................... 92 4.3.5 Aurora-A prevents transcription-replication conflicts .............................................. 95 4.3.6 RNase H1 induction stabilizes Nucleosome +1 ..................................................... 96 4.3.7 RNase H1 induction leads to stalling of RNAPII but does not increase transcription-replication conflicts .......................................................................................................... 97
4.4 Aurora-A inhibition activates ATR ................................................................................. 99 4.4.1 Aurora-A inhibition induces ATR activation ............................................................ 99 4.4.2 Aurora-A substrate SF3B2 prevents ATR activation .............................................. 99 4.4.3 Combined Aurora-A and ATR inhibition leads to apoptosis in a MYCN-dependent manner .......................................................................................................................... 101 4.4.4 RNase H1 induction does not prevent apoptosis ................................................. 105 4.4.5 PARP1 prevents the formation of transcription-replication conflicts .................... 106
5 Discussion ....................................................................................................................... 108 5.1 Aurora-A is MYCN-dependent bound to chromatin in S phase .................................. 108 5.2 Aurora-A is unphosphorylated in S phase .................................................................. 109 5.3 Investigation of MYCN-dependent Aurora-A substrates in S phase ........................... 110
5.3.1 Aurora-A substrates in S phase ........................................................................... 110 5.3.2 MYCN-dependent Aurora-A targets identified by MS .......................................... 111 5.3.3 H3S10 is a MYCN-dependent Aurora-A target .................................................... 113
5.4 Pathways regulated by Aurora-A in S phase .............................................................. 116 5.4.1 Aurora-A leads to incorporation of H3.3 ............................................................... 116 5.4.2 Aurora-A inhibition impairs RNAPII function ........................................................ 117 5.4.3 Aurora-A impacts RNA processing in S phase .................................................... 118 5.4.4 Aurora-A prevents transcription-replication conflicts ............................................ 121 5.4.5 Aurora-A inhibition induces ATR activation .......................................................... 122 5.4.6 Summary of processes regulated by Aurora-A in S phase .................................. 123
5.5 RNase H1 overexpression does not rescue Aurora-A inhibition ................................. 125 5.6 Improved therapeutic options for MYCN-amplified neuroblastoma ............................ 127
5.6.1 Combined Aurora-A and ATR inhibition ............................................................... 127 5.6.2 Combined Aurora-A and PARP1 inhibition .......................................................... 128 5.6.3 Clinical relevance of findings on therapy of neuroblastoma patients ................... 129
6 Bibliography .................................................................................................................... 130 7 Appendix ............................................................................................................................... I Table of figures .................................................................................................................... VII Table of tables ...................................................................................................................... IX Acknowledgement ................................................................................................................. X Publications .......................................................................................................................... XI Affidavit ................................................................................................................................ XII
Eidesstattliche Erklärung ................................................................................................... XII Curriculum vitae ................................................................................................................. XIII
1
Summary Neuroblastoma is the most abundant, solid, extracranial tumor in early childhood and the
leading cause of cancer-related childhood deaths worldwide. Patients with high-risk
neuroblastoma often show MYCN-amplification and elevated levels of Aurora-A. They have a
low overall survival and despite multimodal therapy options a poor therapeutic prognosis.
MYCN-amplified neuroblastoma cells depend on Aurora-A functionality. Aurora-A stabilizes
MYCN and prevents it from proteasomal degradation by competing with the E3 ligase
SCFFBXW7. Interaction between Aurora-A and MYCN can be observed only in S phase of the
cell cycle and activation of Aurora-A can be induced by MYCN in vitro. These findings suggest
the existence of a profound interconnection between Aurora-A and MYCN in S phase.
Nevertheless, the details remain elusive and were investigated in this study.
Fractionation experiments show that Aurora-A is recruited to chromatin in S phase in a MYCN-
dependent manner. Albeit being unphosphorylated on the activating T288 residue, Aurora-A
kinase activity was still present in S phase and several putative, novel targets were identified
by phosphoproteomic analysis. Particularly, eight phosphosites dependent on MYCN-
activated Aurora-A were identified. Additionally, phosphorylation of serine 10 on histone 3 was
verified as a target of this complex in S phase. ChIP-sequencing experiments reveal that
Aurora-A regulates transcription elongation as well as histone H3.3 variant incorporation in S
phase. 4sU-sequencing as well as immunoblotting demonstrated that Aurora-A activity impacts
splicing. PLA measurements between the transcription and replication machinery revealed that
Aurora-A prevents the formation of transcription-replication conflicts, which activate of kinase
ATR.
Aurora-A inhibitors are already used to treat neuroblastoma but display dose-limiting toxicity.
To further improve Aurora-A based therapies, we investigated whether low doses of Aurora-A
inhibitor combined with ATR inhibitor could increase the efficacy of the treatment albeit
reducing toxicity. The study shows that the combination of both drugs leads to a reduction in
cell growth as well as an increase in apoptosis in MYCN-amplified neuroblastoma cells, which
is not observable in MYCN non-amplified neuroblastoma cells. This new approach was also
tested by a collaboration partner in vivo resulting in a decrease in tumor burden, an increase
in overall survival and a cure of 25% of TH-MYCN mice. These findings indicate indeed a
therapeutic window for targeting MYCN-amplified neuroblastoma.

2
Zusammenfassung Das Neuroblastom ist der häufigste, solide, extrakranielle Tumor der frühesten Kindheit und
die häufigste mit Krebs verbundene Todesursache von Kleinkindern weltweit. Patienten mit
geringerer Überlebenswahrscheinlichkeit und schlechterer Therapieprognose zeigen oft eine
MYCN-Amplifikation und erhöhte Mengen von Aurora-A. Aurora-A ist eine Serin/Threonin-
Protein Kinase, die wichtige mitotische Prozesse reguliert. Aurora-A stabilisiert MYCN und
verhindert dadurch den proteasomalen Abbau von MYCN. Die Interaktion zwischen Aurora-A
und MYCN ist S Phasen-spezifisch und MYCN ist in vitro in der Lage, durch seine Bindung
Aurora-A zu aktivieren.
Die Funktionen und Prozesse, die von Aurora-A in der S Phase reguliert werden, sind noch
nicht hinreichend untersucht und daher Gegenstand dieser Dissertation.
Zell-Fraktionierungen zeigen, dass Aurora-A in der S Phase in einer MYCN-abhängigen Weise
an das Chromatin gebunden ist. Phosphoproteom-Analysen mittels Massenspektrometrie
identifizierten zahlreiche neue Substrate von Aurora-A, sowie acht Substrate von MYCN-
aktiviertem Aurora-A. Zusätzlich konnte gezeigt werden, dass Histon 3 Serin 10 von Aurora-A
in Abhängigkeit von MYCN in S Phase phosphoryliert wird. ChIP-Sequenzierungen zeigen,
dass Aurora-A die Elongation der Transkription und den Einbau der Histone Variante H3.3 in
S Phase beeinflusst. 4sU-Sequenzierung sowie Immunoblots zeigen einen Zusammenhang
zwischen der Aktivität von Aurora-A und dem Spleißosom in der S Phase. Zusätzlich konnte
mittels PLA nachgewiesen werden, dass Aurora-A die Entstehung von Transkriptions-
Replikationskonflikten verhindert, die andernfalls die Kinase ATR aktivieren würden.
Aurora-A Inhibitoren wurden unter anderem zur Therapie von Neuroblastomen eingesetzt,
allerdings ist die Dosis des Aurora-A Inhibitors durch die hohe Toxizität limitiert, was die
Effizienz der Therapie stark beeinträchtigt. Daher wurde untersucht, ob die gleichzeitige Gabe
von geringeren Mengen Aurora-A Inhibitor in Kombination mit einem ATR Inhibitor zur
Therapie geeignet ist. In vitro konnte gezeigt werden, dass die Kombination beider Inhibitoren
das Zellwachstum reduziert und das MYCN-amplifizierte Zellen im Vergleich zu MYCN nicht-
amplifizierten Zellen verstärkt durch Apoptose sterben. Durch einen Kollaborationspartner
konnte die Kombination der beiden Inhibitoren an Mäusen getestet werden. Die mit der
Kombination behandelten Mäuse, zeigen ein deutlich reduziertes Tumorwachstum, sowie
längeres Überleben. Somit stellt diese Kombination ein therapeutisches Fenster dar und
könnte zur Behandlung von Neuroblastompatienten genutzt werden.
3
1 Introduction
1.1 Neuroblastoma
Cancer is, after cardiovascular diseases, the second most common cause of death for people
worldwide. In 2018, 18 million new cancer cases occurred and about 9.5 million people died
because of cancer (WHO, 2020).
Cancer is a disease with various subtypes, each characterized by an abnormal cell growth due
to an unlimited number of cell divisions. It is a very heterogeneous disease and the probability
to get cancer varies with age, gender, and genetic factors. There are characteristic risk factors
for different kinds of tumors.
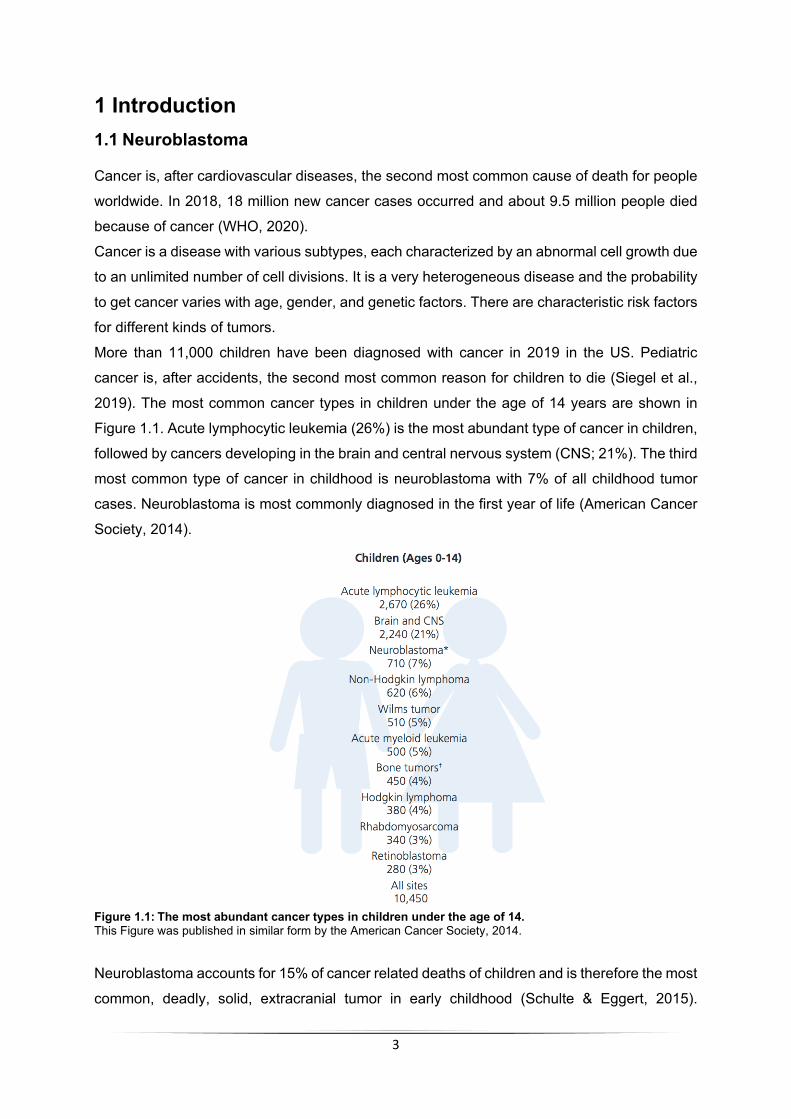
More than 11,000 children have been diagnosed with cancer in 2019 in the US. Pediatric
cancer is, after accidents, the second most common reason for children to die (Siegel et al.,
2019). The most common cancer types in children under the age of 14 years are shown in
Figure 1.1. Acute lymphocytic leukemia (26%) is the most abundant type of cancer in children,
followed by cancers developing in the brain and central nervous system (CNS; 21%). The third
most common type of cancer in childhood is neuroblastoma with 7% of all childhood tumor
cases. Neuroblastoma is most commonly diagnosed in the first year of life (American Cancer
Society, 2014).
Figure 1.1: The most abundant cancer types in children under the age of 14. This Figure was published in similar form by the American Cancer Society, 2014.
Neuroblastoma accounts for 15% of cancer related deaths of children and is therefore the most
common, deadly, solid, extracranial tumor in early childhood (Schulte & Eggert, 2015).

4
Additionally, neuroblastoma is with 97% of the cases the most common tumor of the
sympathetic nervous system. Neuroblastoma derives from a developing and incompletely
committed precursor cell from the neuronal crest tissue, which is called neuroblast (Hoehner
et al., 1996). The tumor arises along the sympathetic nervous system mainly at the adrenal
glands and the paraspinal ganglia, but it can also occur in the nervous tissues of neck, chest,
and abdomen (Ries et al., 1999). At the time of diagnosis, around 50% of the tumors already
have metastasized (Maris et al., 2007). Metastases mainly occur in the bone marrow, bone,
lymph nodes, liver, and brain (DuBois et al., 1999).
Neuroblastomas are clinically as well as biologically very heterogeneous tumors. Their cellular
heterogeneity is suggested to cause the wide range of clinical indications and the diverse
response to treatment. On one hand neuroblastomas have the highest proportion of
spontaneous and complete regression especially in very young patients. On the other hand,
there are high-risk neuroblastomas which have a poor prognosis despite multimodal therapy
(Ngan, 2015; Yamamoto et al., 1998; Carlsen, 1990).
Therapy leading to survival of children improved over the last decades. The 5-year survival
increased from 58% in the mid-1970s to 83% in 2014 (Schulte & Eggert, 2015).
1.1.1 Classification systems Since the mid-1990s, the International Neuroblastoma Staging System (INSS) is used to
classify neuroblastoma. Depending on the localization and the spreading of the primary tumor
the patients can be divided in six stages (1, 2A, 2B, 3, 4, 4S). The staging which only relies on
the localization and spread of the tumor cannot give reliable prognosis for individual patients.
Therefore, additional factors are essential like age of the patient, as well as tumor-specific
markers.
For that reason, a second classification system made by the Children´s Oncology Group is
commonly used to define risk of neuroblastoma patients. Patients are classified into three
groups (low, intermediate, or high) according to age, tumor histology, DNA ploidy, and MYCN-
amplification status (American Cancer Society).
The outcome of neuroblastomas largely depends on their stage. Low-risk tumors often regress
spontaneously or differentiate into benign ganglioneuroma. High-risk neuroblastomas almost-
always relapse despite therapy. 50% of high-risk neuroblastoma show a MYCN-amplification
which is therefore considered as an adverse prognostic factor (Seeger et al., 1985).

5
1.1.2 Prognostic features As mentioned above there are further prognostic features which define the outcome and
thereby the risk group of neuroblastoma patients. The categories which are used as prognostic
features are age, tumor histology, mutations, DNA ploidy, or chromosomal anomalies. They
are further explained and discussed:
Age
The age of the patient at diagnosis is the best predictor for the therapy outcome (Moroz et al.,
2011). 88% of children survive when the age at diagnosis is less than 18 months. When the
patient is older than 18 months and younger than 12 years the survival probability is 49% which
further decreases to 10% in patients older than 12 years (Cohn et al., 2009; Franks et al.,
1997). According to the neuroblastoma study NB97 performed in 2002, patients younger than
one year are most often found in classes with better prognosis (1, 2A, 2B, 3, or 4S), whereas
the majority of patients older than one year are found in the unfavourable class (4). This is also
reflected in the five-year survival, were children younger than one year (85%) survive more
often compared to patients older than one year (42%; NB97, 2002).
Tumor histology
Tumor histology is used by the International Neuroblastoma Pathology Classification (INPC)
to classify neuroblastomas based on the Shimada Index (Sano et al., 2006; Shimada et al.,
1999; Shimada et al., 1984). The Shimada Index is a tool for histopathological classification to
define clinical aggressiveness of peripheral neuroblastic tumors. The Index is based on the
patient age, degree of differentiation, and Mitosis-Karyorrhexis Index (defined as percentage
of the sum of mitotic cells and cells with fragmented nuclei; Sano et al., 2006). Based on recent
findings, it is suggested to stratify patients according to the immunohistochemistry (IHC)
staining of MYCN-, TERT-, and ALT-status since these staining give insights about the survival
benefits (Ikegaki et al., 2019). Patients with MYCN-amplification, TERT-overexpression, or
ALT-loss are considered as high-risk patient with unfavourable histology, whereas all other
patients would be considered as low-risk patients with favourable histology. IHC staining of
MYC family members is already incorporated into some pathologic analyses (Wang et al.,
2015).
Heritable germline and somatic mutations
The majority of neuroblastoma arises spontaneously. Only a small subset of neuroblastoma is
familial and is usually related to mutations in paired-like homeobox 2b (PHOX2B) and
anaplastic lymphoma kinase (ALK) genes.
The first discovered genetic predisposition regards mutations in PHOX2B which either lead to
a truncation of the protein or are found in the homeobox resulting in a loss of DNA binding
(Bourdeaut et al., 2005; Mosse et al., 2004; Trochet et al., 2004). The transcription factor
6
enables cell cycle exit and regulates differentiation of neuronal progenitors (Pattyn et al., 1999).
Mutations in PHOX2B are found in 6-10% of familial neuroblastoma cases (Raabe et al., 2008;
Mosse et al., 2004).
The second known genetic predisposition was found in ALK in 2008 (Janoueix-Lerosey et al.,
2008; Mosse et al., 2008). Mainly three missense mutations (R1192P, R1275Q, and G1128A)
occur within the kinase domain of ALK, found in the majority of familial as well as in up to 12%
of the sporadic cases (Chen et al., 2008; George et al., 2008). The membrane bound receptor
regulates several important signalling pathways like PI3K, JAK/STAT, and MAPK pathways
(reviewed in Hallberg & Palmer, 2016). Crosstalk between ALK and other proteins involved in
neuroblastoma has been observed, since overexpression of PHOX2B increases the
expression of ALK (Bachetti et al., 2010) and ALK has also been identified to cooperate with
MYCN in tumorigenesis (Schnepp et al., 2015).
Besides the germline mutations also somatic mutation have been identified in neuroblastoma
patients. Somatic mutations often found in neuroblastoma involve the tumor suppressor ATRX
(Cheung et al., 2012). 19 different mutations in ATRX have been found in neuroblastoma
patients. The mutations can occur on various sites, although 15 of those mutations result in a
truncation of the protein (Zeineldin et al., 2020). Patients with ATRX mutation are usually older
than five years and therefore have an unfavourable prognosis. ATRX recognized guanine-rich
stretches in DNA, often occurring at telomeres. Additionally, it positions the histone variant
H3.3 to prevent the formation of G-quadruplex (G4) structures, known to interfere with
replication and transcription (Clynes et al., 2013; Clynes & Gibbons, 2013). Loss of ATRX
results in homologous recombination at telomeres which in turn results in the alternative
lengthening of telomeres (ALT; Clynes et al., 2015). ATRX mutations are mutually exclusive
with MYCN-amplification (Zeineldin et al., 2020).
Besides ATRX mutations, also mutations or focal deletions in AT-rich interactive domain 1A
gene (ARID1A) and/or 1B gene (ARID1B) have been observed in 11% of neuroblastoma
cases. Those alterations result in a truncated protein with loss in two domains required for
DNA binding and interaction with topoisomerase II (TOP2; Sausen et al., 2013).
Additionally, mutations in TIAM1 have been identified to frequently (3%) occur in
neuroblastoma cases (Molenaar et al., 2012). TIAM1 is a guanine regulatory exchange factor
for the GTPase Rac and is a regulator of cytoskeleton organization and neuritogenesis (Matsuo
et al., 2003; Leeuwen et al., 1997). The mutations identified in neuroblastoma result in a
truncation of the protein or are predicted as damaging for the protein (Molenaar et al., 2012).
DNA ploidy
Eckenschlager et al., performed a study to correlate DNA ploidy with prognosis in
neuroblastoma patients not yet treated. Aneuploidy of DNA was correlated with low clinical
7
stage, young patients, as well as no MYCN-amplification and the overall survival was increased
in those patients (Eckschlager et al., 1996).
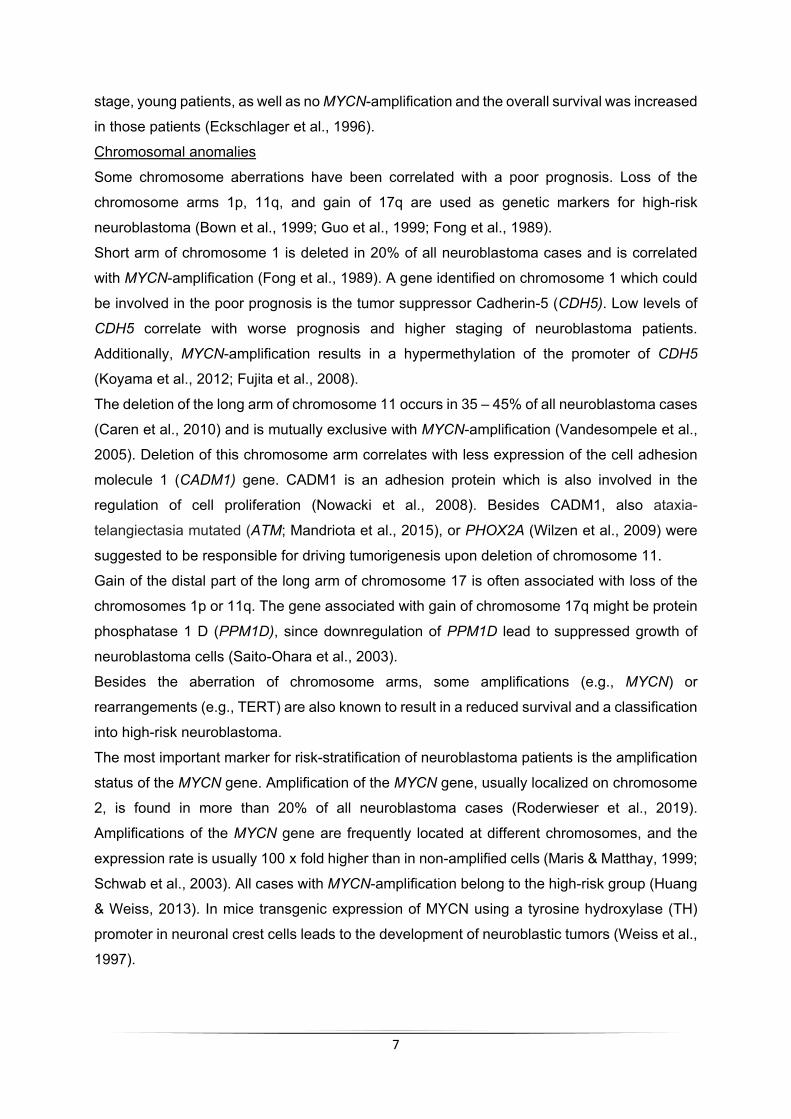
Chromosomal anomalies
Some chromosome aberrations have been correlated with a poor prognosis. Loss of the
chromosome arms 1p, 11q, and gain of 17q are used as genetic markers for high-risk
neuroblastoma (Bown et al., 1999; Guo et al., 1999; Fong et al., 1989).
Short arm of chromosome 1 is deleted in 20% of all neuroblastoma cases and is correlated
with MYCN-amplification (Fong et al., 1989). A gene identified on chromosome 1 which could
be involved in the poor prognosis is the tumor suppressor Cadherin-5 (CDH5). Low levels of
CDH5 correlate with worse prognosis and higher staging of neuroblastoma patients.
Additionally, MYCN-amplification results in a hypermethylation of the promoter of CDH5
(Koyama et al., 2012; Fujita et al., 2008).
The deletion of the long arm of chromosome 11 occurs in 35 – 45% of all neuroblastoma cases
(Caren et al., 2010) and is mutually exclusive with MYCN-amplification (Vandesompele et al.,
2005). Deletion of this chromosome arm correlates with less expression of the cell adhesion
molecule 1 (CADM1) gene. CADM1 is an adhesion protein which is also involved in the
regulation of cell proliferation (Nowacki et al., 2008). Besides CADM1, also ataxia-
telangiectasia mutated (ATM; Mandriota et al., 2015), or PHOX2A (Wilzen et al., 2009) were
suggested to be responsible for driving tumorigenesis upon deletion of chromosome 11.
Gain of the distal part of the long arm of chromosome 17 is often associated with loss of the
chromosomes 1p or 11q. The gene associated with gain of chromosome 17q might be protein
phosphatase 1 D (PPM1D), since downregulation of PPM1D lead to suppressed growth of
neuroblastoma cells (Saito-Ohara et al., 2003).
Besides the aberration of chromosome arms, some amplifications (e.g., MYCN) or
rearrangements (e.g., TERT) are also known to result in a reduced survival and a classification
into high-risk neuroblastoma.
The most important marker for risk-stratification of neuroblastoma patients is the amplification
status of the MYCN gene. Amplification of the MYCN gene, usually localized on chromosome
2, is found in more than 20% of all neuroblastoma cases (Roderwieser et al., 2019).
Amplifications of the MYCN gene are frequently located at different chromosomes, and the
expression rate is usually 100 x fold higher than in non-amplified cells (Maris & Matthay, 1999;
Schwab et al., 2003). All cases with MYCN-amplification belong to the high-risk group (Huang
& Weiss, 2013). In mice transgenic expression of MYCN using a tyrosine hydroxylase (TH)
promoter in neuronal crest cells leads to the development of neuroblastic tumors (Weiss et al.,
1997).
8
Telomerase reverse transcriptase (TERT) is rearranged in 10% and overexpressed in
additional 5% of all neuroblastoma cases (Roderwieser et al., 2019). The rearrangement
results in the proximity of a super-enhancer to the TERT promoter, leading to an increased
expression of TERT (Peifer et al., 2015; Valentijn et al., 2015). TERT overexpression results
in the activation of several signalling pathways like E2F, WNT, MYC, and DNA repair
pathways. MYCN overexpression also results in upregulation of TERT (Peifer et al., 2015).
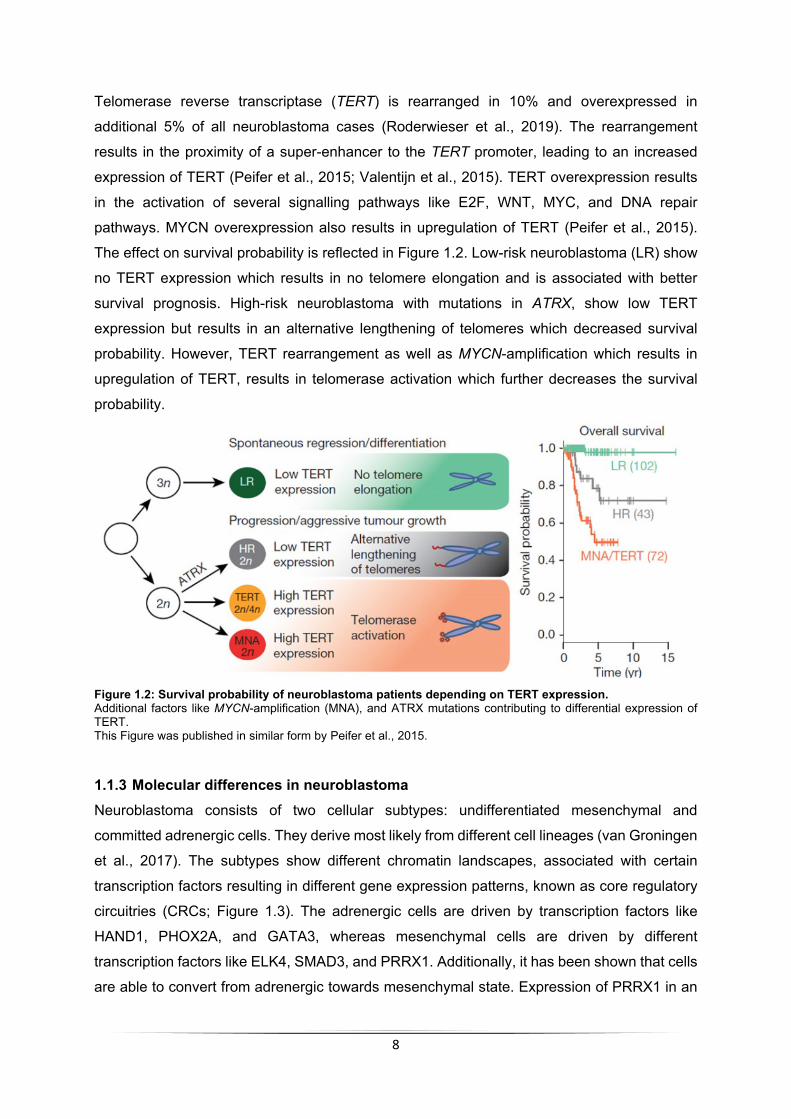
The effect on survival probability is reflected in Figure 1.2. Low-risk neuroblastoma (LR) show
no TERT expression which results in no telomere elongation and is associated with better
survival prognosis. High-risk neuroblastoma with mutations in ATRX, show low TERT
expression but results in an alternative lengthening of telomeres which decreased survival
probability. However, TERT rearrangement as well as MYCN-amplification which results in
upregulation of TERT, results in telomerase activation which further decreases the survival
probability.
Figure 1.2: Survival probability of neuroblastoma patients depending on TERT expression. Additional factors like MYCN-amplification (MNA), and ATRX mutations contributing to differential expression of TERT. This Figure was published in similar form by Peifer et al., 2015.
1.1.3 Molecular differences in neuroblastoma Neuroblastoma consists of two cellular subtypes: undifferentiated mesenchymal and
committed adrenergic cells. They derive most likely from different cell lineages (van Groningen
et al., 2017). The subtypes show different chromatin landscapes, associated with certain
transcription factors resulting in different gene expression patterns, known as core regulatory
circuitries (CRCs; Figure 1.3). The adrenergic cells are driven by transcription factors like
HAND1, PHOX2A, and GATA3, whereas mesenchymal cells are driven by different
transcription factors like ELK4, SMAD3, and PRRX1. Additionally, it has been shown that cells
are able to convert from adrenergic towards mesenchymal state. Expression of PRRX1 in an

9
adrenergic cell leads to a reprogramming towards a mesenchymal state (van Groningen et al.,
2017).
Figure 1.3: Heatmap showing the clustering of mRNA expression profiles of four mesenchymal (MES) and corresponding adrenergic (ADRN) cell lines. This Figure was published in similar form by van Groningen et al., 2017.
Those cell states are co-occurring, meaning that one tumor can consist of adrenergic as well
as mesenchymal cells. Those cell populations differ in their response to treatment.
Chemotherapy results in a decrease of adrenergic cells, whereas mesenchymal cells remain
largely unaffected. This results in an enrichment of mesenchymal cells after therapy and in
relapsed tumors (Boeva et al., 2017; van Groningen et al., 2017).
Later data identified that those CRCs might even result in four different epigenetic subtypes.
Three subtypes reflect the clinical groups MYCN-amplified, MYCN non-amplified with high-
risk, MYCN non-amplified with low-risk, whereas the fourth group shows mesenchymal
characteristics and may arise from a multipotent Schwann precursor cell (Gartlgruber et al.,
2020).
10
1.2 Cell cycle
The cell cycle of eukaryotes is divided in four distinct phases: G1, S, G2, and mitosis (M).
Additionally, there is a quiescent state called G0 phase. The first cell cycle stage is G1 phase,
in which the cells increase the number of organelles, the supply of proteins required for cell
growth, and the capacity of protein synthesis. In S phase DNA replication occurs, aiming at the
duplication of all chromosomes. In G2 phase - which has similar aspects as G1 phase - the
cells are prepared for mitosis. During the M phase the chromosomes are separated into two
identical sets. The M phase is further subdivided into prophase, metaphase, anaphase, and
telophase. At the end of telophase, cytokinesis occurs enabling the distribution and separation
of all components into two identical daughter cells (reviewed in Batty & Gerlich, 2019).
If there are no external growth stimuli it is also possible for a cell, after mitosis is completed, to
go into G0 phase. Most cells with diploid DNA content in adults are in the G0 state, either
transiently (quiescent) or permanently (terminal differentiated or senescent; Ding et al., 2020).
The cell cycle needs to be tightly controlled since the genetic integrity as well as aberrant and
unscheduled cell division could lead to malignancies like cancer, autoimmunity, and
degenerative disorders (Zubiaga, 2020).
1.2.1 Cell cycle checkpoints There are cell cycle checkpoints to ensure that all important processes for one cell cycle phase
are successfully completed before entering the next cell cycle phase (Hartwell & Weinert,
1989). Key regulators of checkpoints are heterodimers composed of cyclins and cyclin-
dependent kinases (CDKs). Binding of the regulatory subunit (cyclins) to the catalytic subunit
(CDKs) lead to the activation of the latter (Nigg, 1995). The heterodimers can then
phosphorylate proteins and consecutively orchestrate the entry into the next cell cycle phase.
Mitogenic signals (e.g., hormones and growth factors) can induce activation of cyclins/CDKs
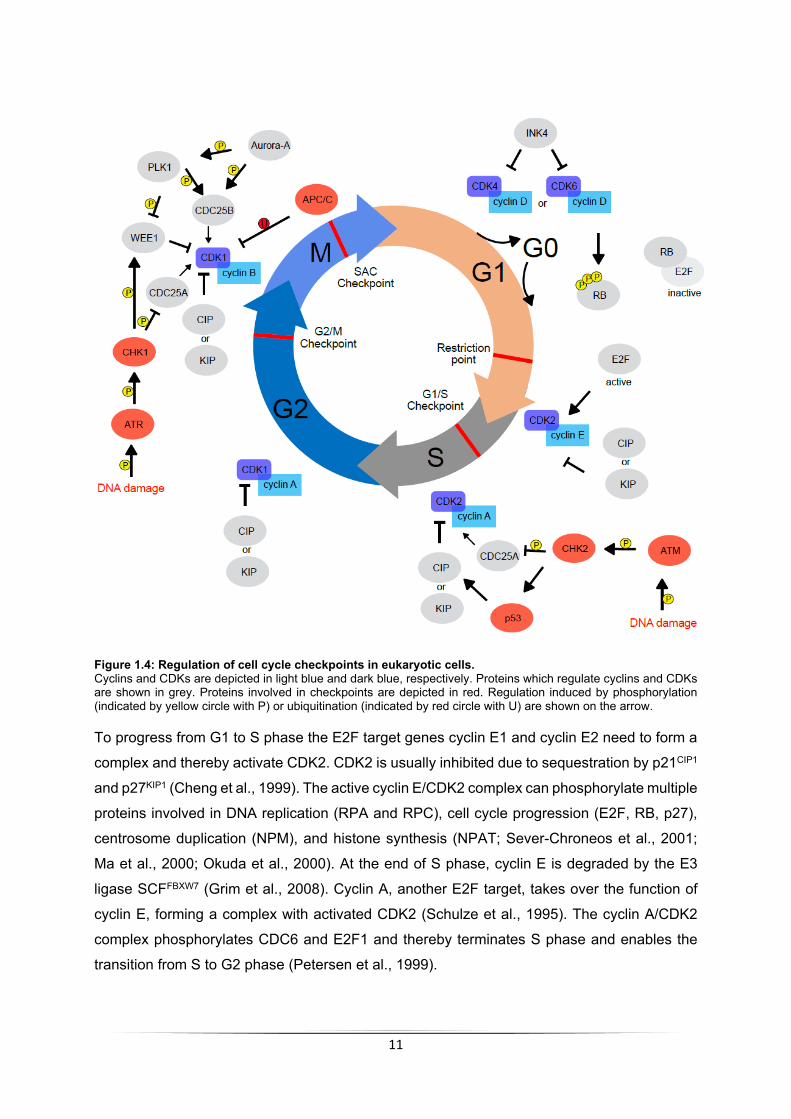
(Otto & Sicinski, 2017). The regulation possibilities of the cell cycle checkpoints are illustrated
in Figure 1.4.
The transition from G0 or G1 phase into S phase is regulated by activation of CDK4 or CDK6.
These CDKs can be activated by cyclin D proteins (cyclin D1, cyclin D2, or cyclin D3) and
repressed by interaction with proteins of the INK4 family (p15, p16, p18, or p19; Malumbres &
Barbacid, 2001). The activated cyclin D/CDK4 or CDK6 complex hyper-phosphorylates the RB
protein RB1 as well as two closely related proteins RBL1 and RBL2. When unphosphorylated,
RB proteins interact with the E2F transcription factors and thereby keep them inactive. Upon
phosphorylation this interaction is abolished, releasing E2F proteins, and enabling transcription
of their targets (Asghar et al., 2015).
11
Figure 1.4: Regulation of cell cycle checkpoints in eukaryotic cells. Cyclins and CDKs are depicted in light blue and dark blue, respectively. Proteins which regulate cyclins and CDKs are shown in grey. Proteins involved in checkpoints are depicted in red. Regulation induced by phosphorylation (indicated by yellow circle with P) or ubiquitination (indicated by red circle with U) are shown on the arrow.
To progress from G1 to S phase the E2F target genes cyclin E1 and cyclin E2 need to form a
complex and thereby activate CDK2. CDK2 is usually inhibited due to sequestration by p21CIP1
and p27KIP1 (Cheng et al., 1999). The active cyclin E/CDK2 complex can phosphorylate multiple
proteins involved in DNA replication (RPA and RPC), cell cycle progression (E2F, RB, p27),
centrosome duplication (NPM), and histone synthesis (NPAT; Sever-Chroneos et al., 2001;
Ma et al., 2000; Okuda et al., 2000). At the end of S phase, cyclin E is degraded by the E3
ligase SCFFBXW7 (Grim et al., 2008). Cyclin A, another E2F target, takes over the function of
cyclin E, forming a complex with activated CDK2 (Schulze et al., 1995). The cyclin A/CDK2
complex phosphorylates CDC6 and E2F1 and thereby terminates S phase and enables the
transition from S to G2 phase (Petersen et al., 1999).
12
To transit between G2 and M phase, an active complex between cyclin B/CDK1 needs to form.
CDK1 is inhibited due to phosphorylation on T14 and T15 by the kinase WEE1 (Watanabe et
al., 2005). The phosphatase CDC25B can dephosphorylate and reactivate cyclin B/CDK1,
therefore promoting cell cycle progression (Izumi & Maller, 1993). Interestingly, the kinase
Aurora-A has a pivotal role in this as it can both activate CDC25B by phosphorylating S353
(Dutertre et al., 2004) and PLK1 by phosphorylating T210 (Seki et al., 2008; Jang et al., 2002).
Importantly, PLK1 also promotes cyclin B/CDK1 function by CDC25B activation due to
phosphorylation on several sides including S353 and WEE1 inhibition due to phosphorylation
on S53 (Sur & Agrawal, 2016; Watanabe et al., 2005). All in all, a lot of steps regulate the
activity of CDK1 to allow cells to enter mitosis. The active cyclin B/CDK1 complex
phosphorylates proteins required for nuclear envelope breakdown, condensation of
chromosomes, and the assembly of mitotic spindle. The spindle assembly checkpoint (SAC),
controlling the metaphase to anaphase transition, is activated upon the loss of cyclin B/CDK1
activity due to the degradation of cyclin B by the APC/C complex (reviewed in Gavet & Pines,
2010).
Cells can also arrest in the cell cycle mainly due to two checkpoints responding to DNA
damage. Prior and after DNA synthesis in G1 and G2 phase several kinases are involved in
arresting cells when sensing problems in DNA replication (Ding et al., 2020).
One sensor is the serine/threonine kinase Ataxia telangiectasia and Rad3-related (ATR). ATR
is activated upon DNA damage in S phase, can detect stalled replication forks, and thereby
induce a cell cycle arrest in S or G2 phase to ensure maintenance of genome integrity (Saldivar
et al., 2017). Upon activation, ATR establishes the block mainly by phosphorylating and
activating CHK1. CHK1 can phosphorylate and inactivate CDC25A, a related family member
of CDC25B with similar functions in cell cycle progression. This phosphorylation results in
proteasomal degradation of CDC25A, thereby inducing G2 arrest. Additionally, CHK1 can
stimulate WEE1, thereby facilitating the inhibitory phosphorylation on CDK2 and CDK1 also
resulting in G2 arrest (Otto & Sicinski, 2017).
Another factor which detects DNA damage is the serine/threonine kinase ATM, which can in
turn phosphorylate and thereby activate the checkpoint kinase 2 (CHK2; Matsuoka et al.,
2000). CHK2 can activate p53, inducing p53-dependent early G1 phase arrest allowing DNA
repair prior to DNA synthesis (Schwartz & Rotter, 1998). This arrest occurs due to the p53-
mediated transcription of p21CIP1, an inhibitor of cyclin E/CDK2 (Benson et al., 2014). When
repair cannot be successfully completed, cells undergo p53-induced apoptosis (Koniaras et
al., 2001).

13
1.2.2 Transcription, replication, and their coordination DNA replication takes place only in the S phase and its outcome is tightly controlled by the
systems described above. Another process using DNA as a template is transcription, which is
not restricted to a specific cell cycle phase. This poses a challenge to cells, considering that
DNA and RNA polymerases can interfere with each other during S phase. Therefore, the
basics concerning transcription and replication and how the two processes are coordinated
are described below.
1.2.2.1 Transcription Transcription is a process where information of the DNA is transcribed into messenger RNA
(mRNA). mRNA is subsequently processed, exported from the nucleus, and translated into
proteins by ribosomes. Transcription is mainly coordinated by a multiprotein complex generally
dubbed “transcription machinery” and is regulated by CDKs and cyclins.
Transcription by RNA Polymerase II (RNAPII) can be divided in three phases: initiation,
elongation, and termination. The various steps of RNAPII can be investigated by different
phosphorylation pattern of the heptameric repeat of the C-terminal domain (CTD) of the largest
subunit of RNAPII. The sequence of the CTD is conserved whereas the number of repeats
increases from yeast (26 repeats) to human (52 repeats; Eick & Geyer, 2013).
Figure 1.5: Different stages of transcription are associated with differential RNAPII phosphorylation patterns. Initiation is marked by phosphorylation on Ser5 by CDK7. Upon CDK9 phosphorylation on Ser2, RNAPII is elongating and termination of RNAPII results in an unphosphorylated RNAPII. Nascent RNA is depicted in red.

14
Transcription initiation starts with the assembly of the pre-initiation complex (pre-IC) which
consists of general transcription factors, co-regulators and the RNAPII complex (Grunberg &
Hahn, 2013). The general transcription factor TFIIH comprises ten subunits, including XPB and
CDK7 (Compe & Egly, 2012). XPB is a helicase which unwinds the double-stranded DNA
(dsDNA) a process referred as promoter melting, allowing the RNAPII to access the template
strand (Kim et al., 2000). CDK7 is the kinase phosphorylating the CTD on Ser5 (Akhtar et al.,
2009; Glover-Cutter et al., 2009). The phosphorylation on Ser5 is established during initiation
and is gradually removed as productive elongation proceeds (Harlen & Churchman, 2017). It
is used as a marker for promoter-proximal pausing of RNAPII. This phosphorylation is also
needed to recruit RNA capping enzymes, which are regulating the capping of the 5´end of
nascent RNA (Bentley, 2014).
After transcription initiation, most genes undergo a regulatory step called promoter-proximal
pausing (Muse et al., 2007), which happens 50 – 70 nucleotides downstream of the
transcription start site (TSS). Negative elongation factor (NELF) and DRB-sensitive induced
factor (DSIF) are factors contributing to the pausing of RNAPII (Yamaguchi et al., 1999). CDK9
- a kinase which is part of the positive transcription elongation factor B (pTEFB) - is then
required to release RNAPII from promoter-proximal pausing (Peng et al., 1998). CDK9
phosphorylates NELF, DSIF and the CTD of RNAPII on Ser2 (Sanso et al., 2016). Upon
phosphorylation, NELF is dissociated from chromatin and replaced by the elongation factor
RNA Polymerase II-associated factor 1 (PAF1; Vos et al., 2018; Fujinaga et al., 2004). DSIF
in contrast remains on chromatin upon phosphorylation and switches functions from being a
pausing factor to a positive elongation factor (Yamada et al., 2006). The Ser2 phosphorylation
of RNAPII (RNAPII pSer2) is considered as the elongating form of RNAPII.
For transcription termination, the polyadenylation signal (PAS) is needed. Up to 30 nucleotides
downstream of the PAS the cleavage and polyadenylation specific factor (CPSF) complex cuts
the nascent RNA. Polyadenylation of the 3´ end of the nascent transcript occurs favoring the
export to the cytoplasm. The 5´end of the nascent RNA which is still transcribed by RNAPII is
processed by XRN2, a 5´ to 3´ endonuclease, resulting in the dissociation of RNAPII from
chromatin (reviewed in Porrua & Libri, 2015).
1.2.2.2 Replication DNA replication is a conserved mechanism throughout evolution and has the aim to duplicate
the genetic information of a cell. The dsDNA is duplicated by unwinding the double helix and
using each strand as a template for a new, complementary DNA strand. The replication
process after origin licensing can be as transcription divided in three different phases: initiation,

15
elongation, and termination. The basic factors involved in origin licensing, initiation, and
elongation of replication are shown in Figure 1.6.
Figure 1.6: Schematic overview of origin licensing, initiation, and elongation of replication in eukaryotic cells.
The initiation of DNA replication starts with the pre-replication complex (pre-RCs) formation at
thousands of origins (Marahrens & Stillman, 1992). The pre-RCs are formed by association of
the origin of replication (ORC) complex to the origins, followed by recruitment of CDT1 and
CDC6. Those two proteins load the inactive mini-chromosome maintenance (MCM) complex
to DNA, which is composed of six subunits. This process is called origin licensing and already
takes place in G1 phase of the cell cycle. Activation of origins, which is also called origin firing,
is not happening on all licensed origins (DePamphilis, 1993). This enables to distinguish three
classes of origins: frequent, flexible, and dormant origins (Callan, 1974).
Inactive MCM is phosphorylated by DDK and CDKs, resulting in two activated MCM complexes
within two bidirectional functioning replisomes (Abid Ali et al., 2017; Heller et al., 2011). This
phosphorylation additionally recruits GINS, Treslin, TOPBP1, and CDC45, resulting in the
formation of the pre-IC. MCM has a DNA helicase activity and forms together with GINS and
CDC45 the CMG complex required to unwind the dsDNA (Ilves et al., 2010; Masai et al., 2010).
CMG complex formation enables the assembly of the replisome and bidirectional DNA
synthesis can occur (Boos et al., 2012). The replisome consists of the CMG complex, the
primase polymerase α, DNA polymerase δ or ε, the sliding clamp PCNA (proliferating cell
nuclear antigen), the clamp loader RFC, and single strand binding protein RPA as well as
several not yet characterized factors (Waga & Stillman, 1998).
16
The unwinding of the DNA results in strands with different orientations. Only one DNA strand
will be continuously synthesized (leading strand) whereas the other strand is synthesized in
short fragments (Okazaki fragments) in the direction opposing the fork movement (lagging
strand; reviewed in Zheng & Shen, 2011).
The replisome of the leading strand is composed by the CMG helicase associated with Pol ε
(Langston et al., 2014).
The lagging strand instead needs to be primed by polymerase α, a primase creating RNA-DNA
primers (MacNeill, 2012), used as start for the replication by polymerase δ. The RNA primers
will be removed by nucleases like FEN1 (Harrington & Lieber, 1994), gaps will be filled with
nucleotides and the DNA ligase I joins the Okazaki fragments to achieve an intact lagging
strand.
The function of RFC is to load PCNA onto the DNA. The ring-shaped sliding clamp (PCNA)
minimizes the dissociation of the newly synthesized strand from the polymerases (Krishna et
al., 1994). Additionally, PCNA is a platform for the recruitment of FEN1, DNA ligase I, and to
coordinate sequential actions of the polymerases (Sporbert et al., 2005).
When two replication forks meet on the same DNA stretch, the DNA replication is terminated.
Therefore, the forks converge, all remaining gaps are filled, and the proteins involved in
replication are unloaded from DNA (reviewed in Dewar & Walter, 2017).
1.2.2.3 Transcription-replication coordination Replication and transcription are independent processes. However, in S phase where both
replication and transcription occur, they need to be regulated to protect genome stability. Ways
to regulate those processes is to control them in time or space.
The number and timing of fired origins is a way to regulate replication. Fired origins are usually
found in intergenic regions and not within genes (Gilbert et al., 2010). Origins can be activated
in early, middle, or late S phase (Dimitrova & Gilbert, 1999). Origin activation depends also on
the chromatin environment as nucleosome positioning has been implicated in the efficiency of
origin firing (Lipford & Bell, 2001). Additionally, replication from early activated origins
correlates with GC-rich regions, active chromatin marks, and gene expression, whereas
replication of late activated origins correlate with AT-rich regions, repressive chromatin marks,
and gene-poor regions, suggesting a mechanistic link (Lipford & Bell, 2001). Besides this, also
the three-dimensional localization of the chromosomes within the nucleus is crucial for timing
of replication. Replication of early activated origins occurs mainly within the inner part of the
nucleus, whereas activated origins in late S phase are usually found in the periphery of the
nucleus or close to nucleoli (Lipford & Bell, 2001).
It was shown that the timing of transcription and replication is coordinated, as early replicating
genes increase their transcription late in S phase and late replicating genes show increased

17
transcription early in S phase (Meryet-Figuiere et al., 2014). However, the exact mechanisms
and proteins accounting for that observations are yet unclear. Furthermore, active transcription
as well as the resulting topology at 3´ends of genes can displace ORC or other pre-RC complex
members and therefore abolish origin firing (Cadoret et al., 2008; Mori & Shirahige, 2007).
Additionally, active origins are often found close to promoters of actively transcribed genes.
This mechanism can allow the regulation of replication by transcription factors or chromatin
remodelers. Transcription factors or chromatin remodelers can regulate access, recruitment,
or sequestration of proteins involved in replication, thereby coordinating those processes
(Knott et al., 2009).
If those processes happen unregulated in S phase, RNAPII and the replication machinery can
collide, leading to transcription-replication conflicts (Hamperl & Cimprich, 2016). Two types of
transcription-replication conflicts can occur, depending on the orientation of transcription and
replication machinery when colliding. Head-on collisions occur when the two machineries
move into opposite direction. They lead to stalled replication forks, followed by the activation
of ATR, and showing the distinctive feature of accumulation of DNA/RNA hybrids called R-
loops. Co-directional collisions occur instead when the two machineries collide while moving
in the same direction. These conflicts result in fork progression, ATM activation, but no R-loops
(Hamperl et al., 2017).
18
1.3 The transcription factor MYC
The oncogene MYC and its related family members are overexpressed or amplified in many
human tumors (Nesbit et al., 1999). Amplification often occurs due to chromosomal
translocations or copy number changes of MYC. Overexpression of MYC is mainly caused by
deregulation of signaling pathways which result in elevated MYC expression. High MYC levels
often correlate with poor prognosis and survival outcome. Induction of MYC in vitro can change
a normal cell into a cell with tumor cell properties. Additionally, manipulation of MYC in vivo
changes incidence and development of tumors (Soucek et al., 2008). Therefore, MYC proteins
are considered as major drivers of tumorigenesis. And indeed, more than 70% of cancers show
MYC family member related amplification or overexpression. Patients with tumors of the
nervous system like neuroblastoma (25%) and medulloblastoma (10%) show MYCN-
amplification or overexpression (Massimino et al., 2016).
1.3.1 The family of MYC transcription factors The family of MYC proteins comprises the three members MYC, MYCN, and MYCL. MYC was
identified first as the cellular homolog of viral oncogenic protein v-myc promoting
myelocymatosis in chicken (Sheiness & Bishop, 1979). MYCN and MYCL were discovered
later in neuroblastoma (Kohl et al., 1983) and in small cell lung cancer (Nau et al., 1985),
respectively. Those three proteins have slightly different sizes: MYCN is with 464 amino acids
the largest family member, followed by MYC with 439 amino acids, and MYCL which is the
smallest family member with 364 amino acids. They share very conserved sequences, named
MYC-boxes (MB) and basic region helix-loop-helix-leucine zipper (BR-HLH-LZ). More details
about these regions are provided below (see 1.3.2).
As shown in mouse embryos, MYC proteins have different expression patterns depending on
developmental stage and investigated tissue and typically responding to different
developmental cues (Zimmerman et al., 1986).
MYCN is mainly expressed during early stages of development in the forebrain, kidney, and
hindbrain, whereas it is absent in adults. MYCN was found to be essential for the development
of the central nervous system (Knoepfler et al., 2002).
MYC is ubiquitously expressed throughout the body of a mouse, but most abundant in thymus,
spleen, and liver in early development and in the adrenal glands and the thymus in late
development (Zimmerman et al., 1986).
MYCN and MYC are required for maintaining hematopoietic stem cells (Trumpp et al., 2001)
and for development of early organogenesis. Deletion of both showed embryonic lethality in
midgestation at E10.5 (Davis et al., 1993; Charron et al., 1992; Stanton et al., 1992), most
19
probably due to placental insufficiency (Dubois et al., 2008). MYC was shown to be necessary
for development and growth of crypt progenitor cells in the intestine (Muncan et al., 2006), skin
keratinocytes, and other cell lines where it is expressed. Besides the essentiality of MYC
proteins, it could be shown that replacing MYC by MYCN can rescue the growth and
development phenotypes observed with knockdown of MYC (Malynn et al., 2000). This
indicates that, despite the relevant differences among the homologs, the essential protein
functions could be similar.
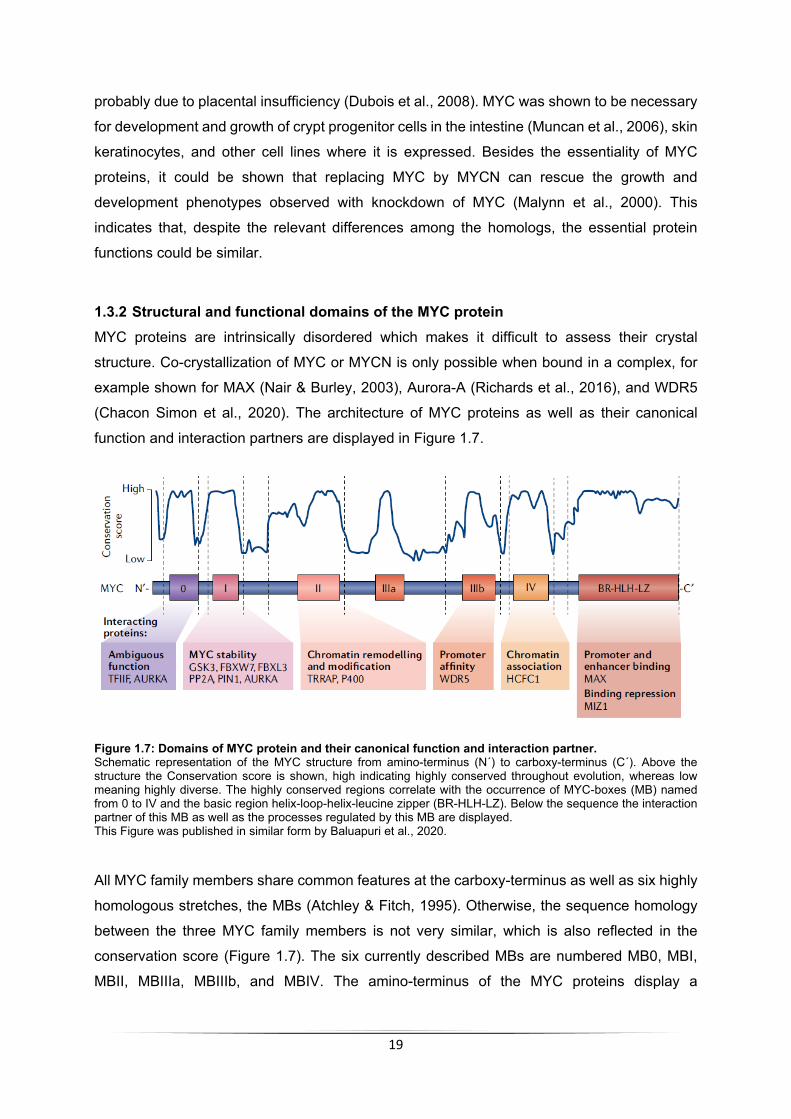
1.3.2 Structural and functional domains of the MYC protein MYC proteins are intrinsically disordered which makes it difficult to assess their crystal
structure. Co-crystallization of MYC or MYCN is only possible when bound in a complex, for
example shown for MAX (Nair & Burley, 2003), Aurora-A (Richards et al., 2016), and WDR5
(Chacon Simon et al., 2020). The architecture of MYC proteins as well as their canonical
function and interaction partners are displayed in Figure 1.7.
Figure 1.7: Domains of MYC protein and their canonical function and interaction partner. Schematic representation of the MYC structure from amino-terminus (N´) to carboxy-terminus (C´). Above the structure the Conservation score is shown, high indicating highly conserved throughout evolution, whereas low meaning highly diverse. The highly conserved regions correlate with the occurrence of MYC-boxes (MB) named from 0 to IV and the basic region helix-loop-helix-leucine zipper (BR-HLH-LZ). Below the sequence the interaction partner of this MB as well as the processes regulated by this MB are displayed. This Figure was published in similar form by Baluapuri et al., 2020.
All MYC family members share common features at the carboxy-terminus as well as six highly
homologous stretches, the MBs (Atchley & Fitch, 1995). Otherwise, the sequence homology
between the three MYC family members is not very similar, which is also reflected in the
conservation score (Figure 1.7). The six currently described MBs are numbered MB0, MBI,
MBII, MBIIIa, MBIIIb, and MBIV. The amino-terminus of the MYC proteins display a

20
transcriptional activation domain (Kato et al., 1990) spanning the MB0 and MBI (Zhang et al.,
2017).
MB0 has ambiguous functions. It could be shown that it interacts with the transcription factor
II F (TFIIF; Kalkat et al., 2018). Additionally, it harbors a sequence allowing – at least partially
- the interaction required for association with Aurora-A (Büchel et al., 2017). Another function
of MB0 is the MYC-induced p53-independent function in apoptosis, although the exact
mechanisms of MB0 in this context remains elusive (Zhang et al., 2017).
MBI is the most studied of the MYC-boxes and known for its regulation of proteasome-
dependent MYC degradation. It harbors several serine/threonine residues which are known to
serve as a phosphodegron. The phosphorylation of those residues – namely T58 and S62 - is
required for recruitment of the E3 ligases SCFFBXW7 and SCFFBXL3, leading to MYC degradation
(Fujii et al., 2006), as in more detailed described below (see 1.3.4). This MYC-dependent
degradation by E3 ligases can be antagonized by binding of Aurora-A (Dauch et al., 2016;
Richards et al., 2016). MBI is also associated with pTEFb interaction (Eberhardy & Farnham,
2001) which is a positive elongation factor of RNAPII (see 1.2.2.1).
The MBII contains a stretch required for interaction with the MYC-coactivator
transformation/transcription domain-associated protein (TRRAP; McMahon et al., 1998).
TRRAP is the scaffolding subunit for several large multi-protein complexes including NuA4
complex involved in histone acetylation to remodel chromatin (Zhang et al., 2014) enabling
euchromatin formation (McMahon et al., 2000). Ultimately, euchromatin formation promotes
transcription of MYC target genes (Frank et al., 2003).
MBIIIb is known to regulate promoter affinity by interaction with WDR5 (Lorenzin et al., 2016).
The interaction of WDR5 with MYC is essential for H3K4 tri-methylation. WDR5 is a presenter
of H3K4 methylation (Thomas et al., 2015) and can serve as platform for the recruitment of
chromatin remodelers, transcription factors, and long non-coding RNAs (Lu et al., 2018). H3K4
methylation can be found on all open and active promoters (Bernstein et al., 2002), enhancing
the affinity of MYC for its promoters (Nie et al., 2012).
MBIV was shown to interact with host cell factor 1 (HCF-1). The disruption of MYC-HCF-1
interaction results in a decreased tumorigenesis in mice (Thomas et al., 2016). Other
interaction partners for this MB are not described yet, although functions for MBIV have been
discovered. Loss of MBIV results in a G2 arrest, whereas cells show a reduction in MYC-
induced apoptosis as well as transformation ability. Additionally, loss of MBIV results in a
decreased DNA binding ability which is not as prominent as seen for loss of MBIII (Cowling et
al., 2006).
At the CTD MYC proteins have a BR-HLH-LZ serving as DNA-binding domain (Blackwell et
al., 1990). Necessary for the DNA binding of MYC is its interaction and thereby formation of a
21
heterodimer for example with MYC associated factor X (MAX). When MYC and MAX are in a
complex, they can bind to consensus sequences CAC(G/A)TG on DNA called Enhancer-boxes
(E-boxes; Blackwell et al., 1990). Although, E-boxes are enriched where MYC-binding occur,
this motif is not mutually exclusive (Guo et al., 2014). Therefore, it is suggested that other
interaction factors could influence the association with chromatin. Another factor which can
interact with the CTD of MYC at the BR-HLH-LZ is the zinc finger protein MIZ1. MIZ1/MYC
heterodimers form repressive complexes (Vo et al., 2016), preventing MYC-dependent
transcription and thereby also enabling a regulation step (Walz et al., 2014).
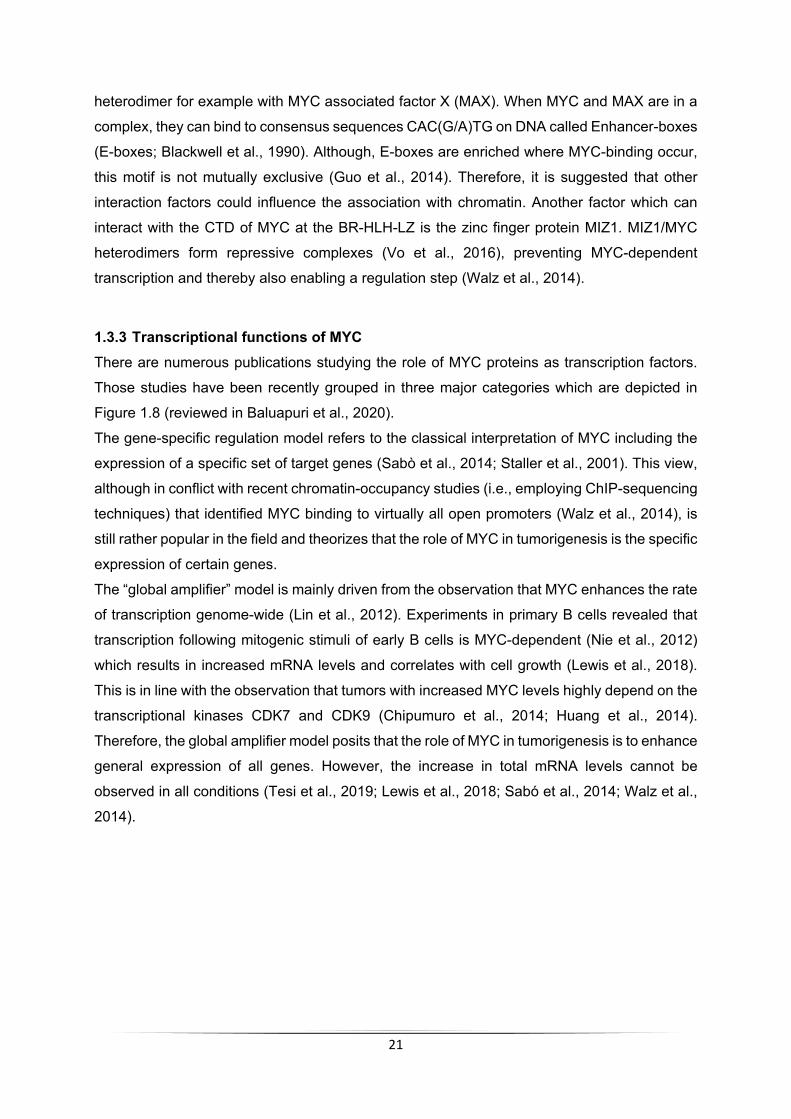
1.3.3 Transcriptional functions of MYC There are numerous publications studying the role of MYC proteins as transcription factors.
Those studies have been recently grouped in three major categories which are depicted in
Figure 1.8 (reviewed in Baluapuri et al., 2020).
The gene-specific regulation model refers to the classical interpretation of MYC including the
expression of a specific set of target genes (Sabò et al., 2014; Staller et al., 2001). This view,
although in conflict with recent chromatin-occupancy studies (i.e., employing ChIP-sequencing
techniques) that identified MYC binding to virtually all open promoters (Walz et al., 2014), is
still rather popular in the field and theorizes that the role of MYC in tumorigenesis is the specific
expression of certain genes.
The “global amplifier” model is mainly driven from the observation that MYC enhances the rate
of transcription genome-wide (Lin et al., 2012). Experiments in primary B cells revealed that
transcription following mitogenic stimuli of early B cells is MYC-dependent (Nie et al., 2012)
which results in increased mRNA levels and correlates with cell growth (Lewis et al., 2018).
This is in line with the observation that tumors with increased MYC levels highly depend on the
transcriptional kinases CDK7 and CDK9 (Chipumuro et al., 2014; Huang et al., 2014).
Therefore, the global amplifier model posits that the role of MYC in tumorigenesis is to enhance
general expression of all genes. However, the increase in total mRNA levels cannot be
observed in all conditions (Tesi et al., 2019; Lewis et al., 2018; Sabó et al., 2014; Walz et al.,
2014).
22
Figure 1.8: Scheme of different models how MYC regulate transcription. Three different models can be distinguished: (a) gene-specific regulation, (b) global amplification, and (c) level-dependent regulation. This Figure was published in similar form by Baluapuri et al., 2020.
The third model reported is the gene-specific affinity model. This model is based on the
observations that cells show different expression patterns depending on the amount of MYC
(Staller et al., 2001). Therefore, high-affinity and low-affinity targets can be distinguished. High-
affinity targets show MYC binding already under physiological MYC levels, whereas low-affinity
target genes show MYC binding only upon oncogenic expression of MYC (Lorenzin et al.,
2016). According to this view tumorigenesis is driven by oncogenic, elevated MYC levels
through the transforming expression of low-affinity target genes.
These postulated models highly depend on the experiment performed and the cellular context
(Lewis et al., 2018). An additional difference might be the normalization algorithm used for
23
high-throughput sequencing methods like RNA-sequencing. Therefore, global increase in
mRNA levels could be underestimated according on the algorithms used (Lovén et al., 2012).
Several other possibilities like direct and indirect effects are additionally under debate. Whether
one of the models is correct, a mixture of all, or each model in certain cells or under specific
conditions remains elusive and needs to be further investigated.
However, recent publications also indicate that MYC might context-dependently change the
recruitment of accessory proteins and/or stress responders and thereby modulating the
RNAPII behavior which might account for the changes in gene expression (Herold et al., 2019).
1.3.4 Regulation of MYC Since MYC is a key regulator of transcription, it needs to be tightly regulated under
physiological conditions. Therefore, MYC binding to chromatin as well as MYC protein stability
are under constant control of several independent proteins. To understand this regulation is
also beneficial to disturb oncogenic functions of MYC and thereby target MYC-driven tumors.
One possibility to regulate MYC is the dependence on its interaction partners which are needed
for DNA binding. Since MYC is not able to homo-dimerize at physiological concentrations
(Prendergast & Ziff, 1991), it needs a partner protein for DNA binding, for example MAX. MAX
can also form homodimers as well as hetero-dimerize with one of the four MAX dimerization
(MXD) proteins. MAX interaction with MGA1 or MNT suppresses cell growth (Hurlin et al.,
2003). Since all the interactions within this network are mediated via the BR-HLH-LZ region,
this enables a variety of mechanisms to control MYC-dependent transcription in untransformed
cells which is frequently perturbed in cells with oncogenic MYC level (Schaub et al., 2018).
Another means of MYC regulation is its degradation which is controlled by the ubiquitin
proteasome system (UPS). The UPS primes proteins for degradation by the addition of
ubiquitin molecules. The specificity of the system is ensured by E3 ligases which are required
for substrate selectivity. One E3 ligase known to degrade MYC is SCFFBXW7. For the recognition
by this E3 ligase, MBI of MYC needs to be post-translationally modified by cyclin B/CDK1,
which phosphorylates MYC on S62 (Sjostrom et al., 2005), subsequently, GSK3-β targets T58
(Pulverer et al., 1994); later protein phosphatase 2A (PP2A) dephosphorylates S62 (Arnold &
Sears, 2006), finally SCFFBXW7 recognizes the protein phosphorylated on T58 only (Welcker et
al., 2004a; Welcker et al., 2004b) and this leads to MYC proteasomal degradation (Otto et al.,
2009).
Phosphorylation-independent degradation pathways have also been observed. TRUSS has
been shown to interact with the BR-HLH-LZ and with amino acids close to the amino terminus
of MYC proteins, resulting in their ubiquitination and degradation (Choi et al., 2010). Another
E3 ligase which is known to ubiquitinate MYC followed by proteasomal degradation is UBR5
24
(Schukur et al., 2020). Additionally, SCFSKP2 was shown to interact with MBII and BR-HLH-LZ
motif and to ubiquitinate MYC, leading to its proteasomal degradation (Kim et al., 2013; von
der Lehr et al., 2003).
MYC function is key for both normal and oncogenic tissues. This renders the protein a difficult
target, as MYC-driven therapies were expected to yield massive side-effects. This was
suggested in vivo for mice in which deletion of either MYCN or MYC was lethal at embryonic
day 10.5 due to consequences of organ and tissue growth failure (Soucek & Evan, 2010).
In addition, MYC proteins have no active site and their surface does not allow the binding of
small molecules. Therefore, MYC proteins are considered as “undruggable” (Gustafson et al.,
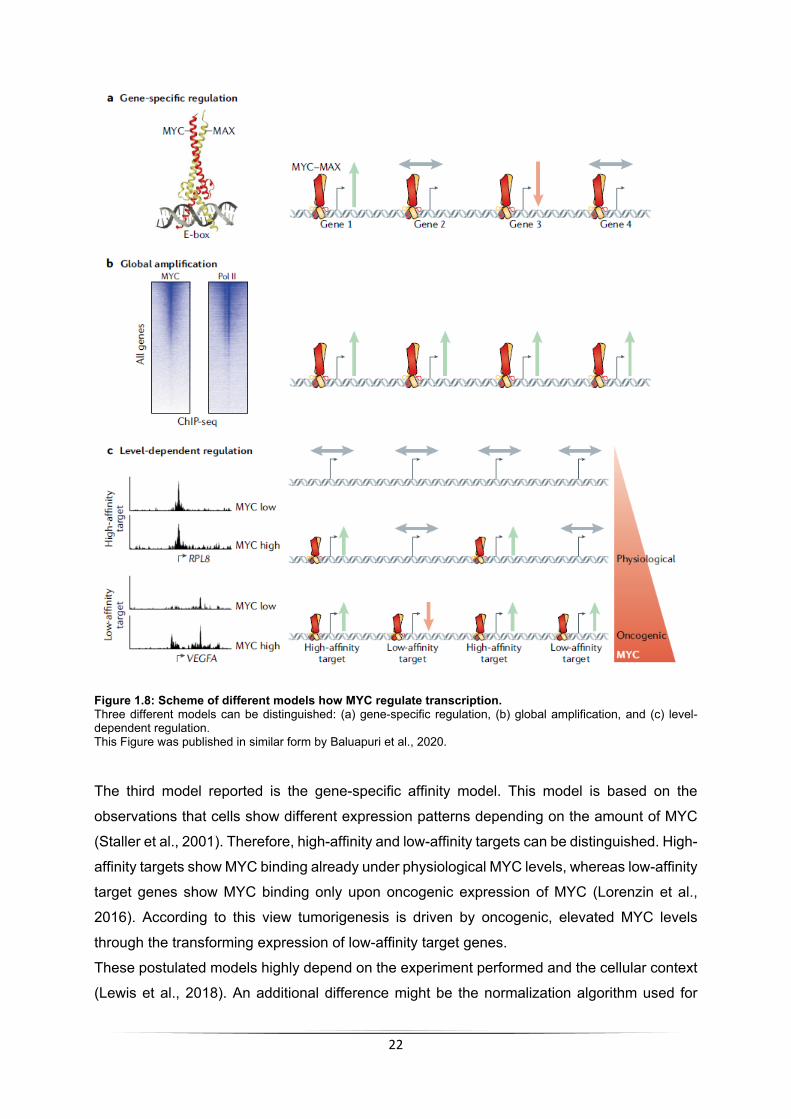
2014) and direct targeting of MYC remains difficult. However, several strategies have been
identified to target MYC proteins indirectly, as summarized in Figure 1.9.
Figure 1.9: Approaches to target MYC proteins. This Figure was published in similar form and is modified from Chen et al., 2018.
It is possible to target MYC function at different levels, as the transcription of MYC mRNA, the
translation of MYC protein, the stability of MYC protein, or the ability of MYC to bind to
chromatin.
The inhibition of transcription of MYC mRNA can be pursued by targeting key regulatory
transcriptional proteins like CDK7, CDK9, or BRD4. For example, the JQ1 compound
competes with BRD4 for the binding to acetylated lysine and thereby displaces BRD4 from
super-enhancers regulating the expression of MYC (Delmore et al., 2011; Filippakopoulos et
al., 2010). However, this strategy is not specific for MYC mRNA but interferes with the
transcription of all (e.g., CDK7 or CDK9 inhibition) or a lot (e.g., BRD4 inhibition) of genes (Shi
& Vakoc, 2014).

25
The same is true for the targeting of MYC translation by inhibiting the PI3K/AKT/mTOR
pathway. Inactivation of this pathway reduces the transcription of RNAPI and RNAPIII target
genes. RNAPI and RNAPIII regulate the transcription of components of the protein-synthesis
machinery and are therefore required for the translation of all proteins in a cell (Martin et al.,
2004; Mahajan, 1994).
More specific targeting approaches for MYC proteins have been proposed through the
identification of proteins that lead to the stabilization of MYC proteins. Therefore, discovering
MYC-interaction partner as potential targets for drug treatment of MYC-driven tumors is still an
approach to treat these cancer types. Several pathways have been identified as competing
with or inactivating the MYC-targeting E3 ligases. Aurora-A was shown to stabilize MYC by
competing with SCFFBXW7 and thereby preventing the proteasomal degradation (Otto et al.,
2009). Inhibition of Aurora-A results in a decrease in MYC protein levels (see 1.4.5). PLK1
phosphorylates the E3 Ligase SCFFBXW7 and thereby inactivates it, which also leads to the
stabilization of MYC (Xiao et al., 2016).
Finally, two approaches have successfully in reducing the ability of MYC to associate with
chromatin. The strategies are the inhibitor 10058-F4 and Omomyc. 10058-F4 blocks the
hetero-dimerization of MYC and MAX and thereby prevents MYC´s association with chromatin
(Follis et al., 2009; Yin et al., 2003). However, since the blocking in hetero-dimerization also
prevents other BR-HLH-LZ proteins to dimerize, also this approach can yield side-effects and
high doses of the inhibitor are needed.
Omomyc is a dominant negative variant of MYC that forms heterodimers with MYC, thereby
preventing its interaction to MAX and their DNA-binding (Soucek et al., 2002; Soucek et al.,
1998). Omomyc induction does not show any side-effects in healthy tissues, whereas it
reduces tumor burden in several tested MYC-driven cancers (Jung et al., 2017; Soucek et al.,
2013; Soucek et al., 2008; Soucek et al., 2004), suggesting the existence of a therapeutic
window.
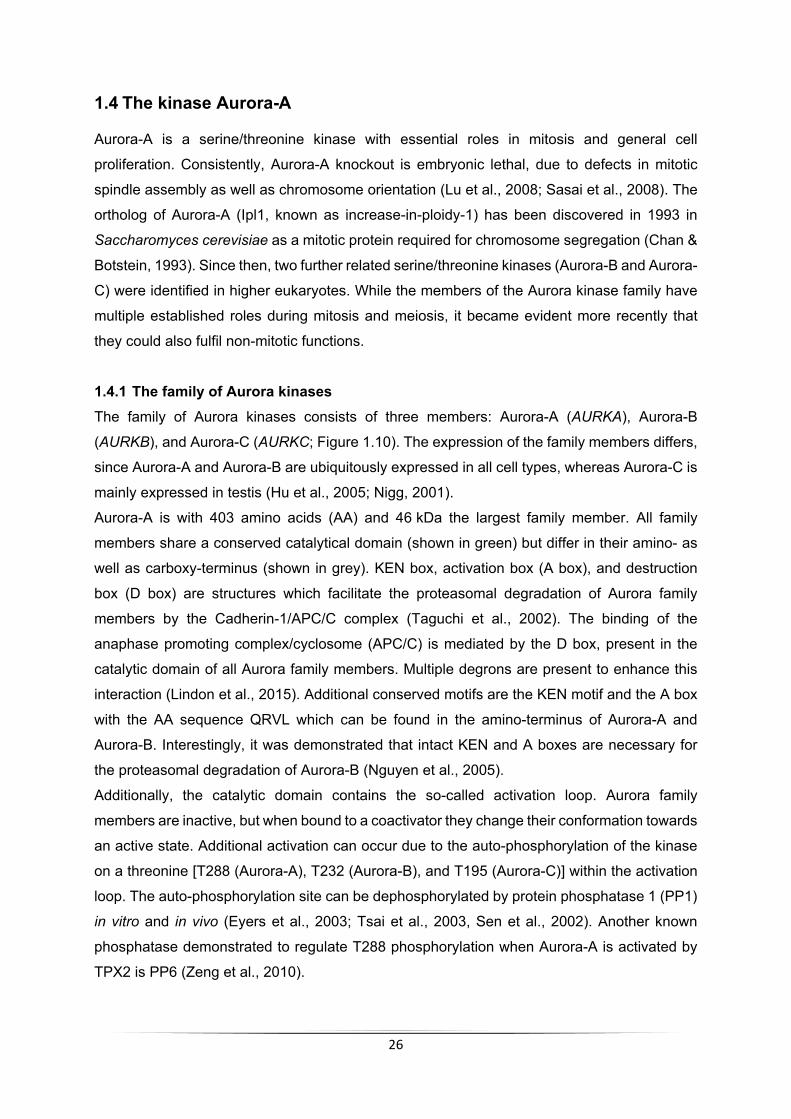
26
1.4 The kinase Aurora-A
Aurora-A is a serine/threonine kinase with essential roles in mitosis and general cell
proliferation. Consistently, Aurora-A knockout is embryonic lethal, due to defects in mitotic
spindle assembly as well as chromosome orientation (Lu et al., 2008; Sasai et al., 2008). The
ortholog of Aurora-A (Ipl1, known as increase-in-ploidy-1) has been discovered in 1993 in
Saccharomyces cerevisiae as a mitotic protein required for chromosome segregation (Chan &
Botstein, 1993). Since then, two further related serine/threonine kinases (Aurora-B and Aurora-
C) were identified in higher eukaryotes. While the members of the Aurora kinase family have
multiple established roles during mitosis and meiosis, it became evident more recently that
they could also fulfil non-mitotic functions.
1.4.1 The family of Aurora kinases The family of Aurora kinases consists of three members: Aurora-A (AURKA), Aurora-B
(AURKB), and Aurora-C (AURKC; Figure 1.10). The expression of the family members differs,
since Aurora-A and Aurora-B are ubiquitously expressed in all cell types, whereas Aurora-C is
mainly expressed in testis (Hu et al., 2005; Nigg, 2001).
Aurora-A is with 403 amino acids (AA) and 46 kDa the largest family member. All family
members share a conserved catalytical domain (shown in green) but differ in their amino- as
well as carboxy-terminus (shown in grey). KEN box, activation box (A box), and destruction
box (D box) are structures which facilitate the proteasomal degradation of Aurora family
members by the Cadherin-1/APC/C complex (Taguchi et al., 2002). The binding of the
anaphase promoting complex/cyclosome (APC/C) is mediated by the D box, present in the
catalytic domain of all Aurora family members. Multiple degrons are present to enhance this
interaction (Lindon et al., 2015). Additional conserved motifs are the KEN motif and the A box
with the AA sequence QRVL which can be found in the amino-terminus of Aurora-A and
Aurora-B. Interestingly, it was demonstrated that intact KEN and A boxes are necessary for
the proteasomal degradation of Aurora-B (Nguyen et al., 2005).
Additionally, the catalytic domain contains the so-called activation loop. Aurora family
members are inactive, but when bound to a coactivator they change their conformation towards
an active state. Additional activation can occur due to the auto-phosphorylation of the kinase
on a threonine [T288 (Aurora-A), T232 (Aurora-B), and T195 (Aurora-C)] within the activation
loop. The auto-phosphorylation site can be dephosphorylated by protein phosphatase 1 (PP1)
in vitro and in vivo (Eyers et al., 2003; Tsai et al., 2003, Sen et al., 2002). Another known
phosphatase demonstrated to regulate T288 phosphorylation when Aurora-A is activated by
TPX2 is PP6 (Zeng et al., 2010).
27
Figure 1.10: Schematic view of Aurora family members. The structure of Aurora-A (AURKA), Aurora-B (AURKB), and Aurora-C (AURKC) including their amino acid (AA) length and their molecular weight is depicted. Conserved regions as catalytic domain (green), KEN box (red), A box (yellow) and D box (blue) are shown (modified from Tang et al., 2017).
The function of Aurora family members is tightly controlled and correlated with their distribution
throughout the cell cycle. Aurora-A is required for centrosome maturation, separation, bipolar
spindle assembly, and entry into mitosis. Aurora-B localizes to kinetochore and the spindle
midzone, where it is required for chromosome condensation, alignment, segregation, and
cytokinesis. Aurora-C is expressed in meiosis and is thought to have analogous functions to
Aurora-B in mitosis, still its function is least understood (Marumoto et al., 2005).
Aurora-A harbors a mitochondrial targeting sequence (MTS) at the amino-terminus. This MTS
allows the targeting and import into the mitochondrial matrix independently of cell cycle phases
(Bertolin et al., 2018). The kinase is considered to play important roles in maintenance of
mitochondrial morphology as well as mitochondrial dynamics (Bertolin et al., 2018; Grant et
al., 2018; Kashatus et al., 2011).
Aurora-A and Aurora-B share parts of their consensus motif which is the favored sequence to
be phosphorylated on their target proteins. The Aurora-A motif has a positively charged amino
acid on -2 and/or -3 positions in front of the serine or threonine (R/K R/K X S/T). The Aurora-
B motif instead has a positively charged residue on -2 position in front of the serine or threonine
(R/K X S/T). Additional positive residues on -1 or -5 positions are enriched in Aurora-B
consensus motifs. Both kinases prefer no proline after the phosphorylated amino acid
(Kettenbach et al., 2011).
1.4.2 Canonical, mitotic functions of Aurora-A The function of Aurora-A is regulated by its protein level as well as its subcellular localization
and both parameters change throughout the cell cycle. At the end of S phase, Aurora-A
localizes to duplicated centrosomes. Its localization shifts to the bipolar spindle during mitosis.

28
At the end of mitosis, Aurora-A moves to the perinuclear material of the daughter cell
(Sugimoto et al., 2002). Concomitantly, Aurora-A expression increases during late G2 phase
and peaks at the transition from G2 to M phase. At the end of mitosis Aurora-A is degraded by
the APC/C complex (Taguchi et al., 2002) and its coactivator subunits CDC20 and CDH1
(Alfieri et al., 2017).
Aurora-A controls and regulates several processes like centrosome maturation, centrosome
separation, mitotic entry, bipolar spindle assembly, chromosome alignment on metaphase
plates as well as cytokinesis (Hirota et al., 2003; Marumoto et al., 2003; Roghi et al., 1998).
Centrosome maturation
Aurora-A activity at centrosomes is regulated by the LIM protein AJUBA (Hirota et al., 2003).
Centrosome maturation is a step where large amounts of pericentriolar material (PCM) is
recruited to centrosomes. The PCM consists of an interaction network of many proteins with
high molecular weight building a platform to anchor γ-tubulin (Reboutier et al., 2012; Muller et
al., 2010). Active Aurora-A can recruit γ-tubulin, NDEL1 as well as TACC/MAP215 to
microtubule organizing centers (MTOCs; Mori et al., 2007; Bellanger & Gonczy, 2003; Giet et
al., 2002). MTOCs facilitate the maturation of centrosomes as well as enhance the nucleation
of microtubules required to ensure bipolarization as well as correct mitotic spindle assembly
(Tillery et al., 2018; Pinyol et al., 2013).
Centrosome separation
The centrosome separation happens before the breakdown of the nuclear envelope (Hannak
et al., 2001). Aurora-A localizes to the unseparated centrosome asters during spindle
assembly (Marumoto et al., 2003). In Xenopus laevis the Aurora-A homologue phosphorylates
the kinesin-like protein XIEg5 (Eg5 in human). This protein has an essential role in separation
of centrosomes after nuclear-envelope breakdown (Giet et al., 1999).
Mitotic entry
Aurora-A also regulates the mitotic entry by phosphorylating CDK1, as further discussed above
(see 1.2.1).
Bipolar spindle formation
Aurora-A localizes to the mitotic spindle, as soon as spindle assembly starts to coordinate
bipolar spindle formation. At the spindle Aurora-A is activated by TPX2 (Wittmann et al., 2000;
Wittmann et al., 1998). Active Aurora-A phosphorylates NEDD1, which is required for the
targeting of centrosomes to the mitotic spindle as well as for microtubule nucleation, overall
regulating bipolar spindle formation (Haren et al., 2006; Luders et al., 2006).
Chromosome alignment on metaphase plates
Aurora-A and Aurora-B work cooperatively to define chromosome alignment on metaphase
plates. Aurora-A as well as Aurora-B are shown to phosphorylate the kinetochore-specific

29
histone H3 variant CENP-A on S7 (Marumoto et al., 2003; Zeitlin et al., 2001). Aurora-A
performs this phosphorylation during prophase, which enables the localization of Aurora-B to
the inner centromere (Kunitoku et al., 2003). Aurora-B maintains this phosphorylation from late
prophase through metaphase. This phosphorylation enables proper attachment of
microtubules to kinetochores and is therefore required for kinetochore structure and the
regulation of proper chromosome alignment and segregation (Cheung et al., 2000).
Cytokinesis
Aurora-A levels affect cytokinesis, as suggested by the injection of Aurora-A antibodies as well
as overexpression of Aurora-A, which impaired cytokinesis by leading to multinucleated or
binucleated cells, respectively (Marumoto et al., 2003; Meraldi et al., 2002). This indicates that
the timing of activation and subsequential inactivation is crucial for proper cytokinesis.
1.4.3 Aurora-A in cancer The Aurora-A gene is localized on the fragile chromosome region 20q13.2 (Isola et al., 1995).
This region is amplified in a great number of epithelial cancers (Nikonova et al., 2013) as well
as haematological malignancies (Farag, 2011). Besides amplification, also overexpression of
Aurora-A is found in several cancers including ovarian, skin, pancreatic, and breast cancer
(Vader & Lens, 2008; Zhang et al., 2004; Meraldi et al., 2002; Isola et al., 1995). The
amplification or overexpression can lead to checkpoint disruption (Marumoto et al., 2002),
tetra-ploidy due to cytokinesis failure (Meraldi et al., 2002) and abnormal spindle formation
(Minn et al., 1996).
In cancer cells, it was observed that overexpression of Aurora-A negatively correlates with
DNA damage response genes, indicating a role in DNA repair. In urothelial cell carcinoma
samples or ovarian cancer cells Aurora-A expression correlates with Breast Cancer 1 (BRCA1)
and CHK2 or BRCA2 levels, respectively (Yang et al., 2010; Veerakumarasivam et al., 2008).
Additionally, Aurora-A regulates the activity of poly (ADP-ribose) polymerase 1 (PARP1), an
enzyme controlling the balance between non-homologous end joining (NHEJ) and homologous
recombination (Du et al., 2016). Aurora-A inhibition regulates PARP1 activity and results in an
increased double-strand break repair with NHEJ which is the more error prone form of DNA
repair. Therefore, Aurora-A has an additional role in DNA repair in cancer cells by controlling
the expression of BRCA1 (mainly in G1 and S phase) and the activation of PARP1-dependent
NHEJ (mainly in G1 phase; Ray Chaudhuri & Nussenzweig, 2017; Ruffner & Verma, 1997;
Vaughn et al., 1996).
Additionally, Aurora-A was shown to interact with the RAS effector RALA, thereby enhancing
oncogenesis utilizing the RAS pathway (Lim et al., 2010; Wu et al., 2005).
30
1.4.4 Mechanisms of regulation As mentioned above, Aurora-A is amplified or overexpressed in a great number of tumors
leading to genomic instability. This suggests the need for a tight regulation of Aurora-A activity
and expression during cell cycle under physiological circumstances.
Aurora-A activity and expression is regulated by three distinct mechanisms illustrated in Figure
1.11.
Transcription is enhanced by MYC family members and suppressed by p53 (Figure 1.11 a). In
cancer cells MYC as well as MYCN are often overexpressed, leading to an increase in Aurora-
A transcription (den Hollander et al., 2010; Shang et al., 2009). Consistently, the tumor
suppressor p53 is often lost in tumor cells, leading to an increase in Aurora-A transcription (Liu
et al., 2004). Additionally, Aurora-A can auto-regulate its transcription by phosphorylation of
p53 on S215 and S315 (Katayama et al., 2004; Liu et al., 2004). These phosphorylations lead
to an inhibition of p53 transcriptional activity as well as MDM2-mediated degradation of p53.
Besides transcriptional regulation, Aurora-A protein stability is tightly regulated (Figure 1.11 b).
Degradation of Aurora-A is taking place at the end of mitosis through the APC/C complex
(Taguchi et al., 2002) and its coactivator subunits CDC20 and CDH1 (Alfieri et al., 2017).
Whether Aurora-A degradation is ubiquitin-dependent is currently a matter of debate. On one
hand, it is known that the E3 ligase CHFR is interacting with the amino-terminus thereby
ubiquitinating Aurora-A (Yu et al., 2005). Aurora-A degradation mainly relies on ubiquitination
on K5 (Min et al., 2013). Additionally, Aurora-A is dephosphorylated on S51 by the
phosphatase PP2A (Littlepage et al., 2002), an event considered a hallmark of mitotic exit.
These steps allow the APC/C complex to degrade Aurora-A. On the other hand, the Aurora-A
kinase interacting protein 1 enhances binding of Aurora-A with Antizyme 1 (AZ1; Lim &
Gopalan, 2007b). AZ1 is an enzyme involved in polyamine biosynthesis pathway but has also
a function in regulating ubiquitin-independent protein degradation pathways (Qiu et al., 2017).
Therefore, AZ1 could promote the degradation of Aurora-A in a ubiquitin-independent manner
(Lim & Gopalan, 2007a).

31
Figure 1.11: Mechanisms illustrating the regulation of Aurora-A expression and activity. a. Aurora-A transcription is enhanced by MYC or MYCN and repressed by p53. b. Post-transcriptional regulation of Aurora-A either depends on protein degradation or regulation of the kinase activity.
A further regulation point aims at balancing Aurora-A kinase activity which structurally relies
on the orientation of the so-called DFG motif at the beginning of the T-loop. Depending on the
DFG motif direction towards the ATP binding pocket, Aurora-A can exist in two states, named
DFG-in or DFG-out state. The function of the DFG motif is the stabilization and coordination of
the Mg2+ ion, required for the ATP-dependent phosphorylation of the substrate. If the T-loop is
in a DFG-out state, the kinase can be considered as inactive, since Mg2+ is not stabilized.
When bound to a coactivator, Aurora-A can change its conformation towards an DFG-in state.
When in the DFG-in state, Aurora-A can auto-phosphorylate itself which further enhances its
activity (Gilburt et al., 2017). The best characterized coactivator is TPX2 (Eyers et al., 2003)
but also other coactivators like MYCN (Richards et al., 2016), AJUBA (Hirota et al., 2003), and
PIFO (Kinzel et al., 2010) were identified. Additionally, calmodulin can activate Aurora-A in a
Ca2+-dependent manner (Plotnikova et al., 2012; Plotnikova et al., 2010). Protein kinase C was
reported to phosphorylate T287, thereby enhancing Aurora-A´s interaction with TPX2 which
can in turn activate Aurora-A (Mori et al., 2009).

32
1.4.5 Aurora-A and MYCN Aurora-A was identified in a synthetic lethality screen as a protein required for the growth of
MYCN-amplified neuroblastoma cells (Otto et al., 2009). Neuroblastoma have increased
expression of Aurora-A protein, due to MYCN-mediated transcription (Shang et al., 2009). One
possible explanation for the synthetic lethality could be that Aurora-A leads to the stabilization
of MYCN (Figure 1.12).
Figure 1.12 Model of the stabilization of MYCN by Aurora-A in neuroblastoma cells. On the left, MYCN degradation under physiological conditions in a neuroblast is shown. On the right, it is shown that in neuroblastoma cells high Aurora-A level prevents MYCN from proteasomal degradation (as Otto et al., 2009).
During normal development MYCN is degraded in G2/M phase after the subsequent
phosphorylation by cyclin B/CDK1 and GSK3-β. The phosphorylation on its degron primes it
for the recognition by the ubiquitin ligase SCFFBXW7. The ubiquitination of the E3-ligase leads
to proteasomal degradation and to differentiation and development of the nervous system. In
MYCN-amplified neuroblastoma cells the high level of Aurora-A leads to an association with
MYCN and prevents its proteasomal degradation. Therefore, cycling neuroblasts always have
high MYCN levels which allow them to remain in a proliferative state regardless of external
signals (Otto et al., 2009).
Interestingly, while the kinase domain of Aurora-A is required for the dimerization with MYCN
(Dodson et al., 2010), Aurora-A does not need to be catalytically active for the association to
occur (Otto et al., 2009).
A peptide of MYCN spanning the residues 28 – 89 is sufficient to induce the auto-
phosphorylation of Aurora-A in vitro, indicating a role of MYCN as coactivator of Aurora-A
(Richards et al., 2016). Additionally, using proximity ligation assay (PLA), it was possible to
33
determine that the proximity between Aurora-A and MYCN is cell cycle-regulated and occurs
in S phase (Büchel et al., 2017). This finding indicates that the Aurora-A/MYCN interaction in
S phase is not only required for the stabilization of MYCN, but also leads to an activation of
Aurora-A, suggesting the existence of a novel role for Aurora-A in S phase.
1.4.6 Inhibition of Aurora-A Considering the role of Aurora-A in cancer, a lot of medicinal chemistry efforts aimed at the
development of Aurora-A inhibitors. Currently, there is a broad range of Aurora-A inhibitors
available that generally exploit three different targeting strategies. Catalytic inhibitors,
conformation-disrupting (CD) drugs, or inhibitors performing both tasks are available.
MK5108 belongs to the class of catalytic Aurora-A inhibitors without any CD activity. This
inhibitor has a 220-fold higher selectivity for Aurora-A (IC50 = 0.064 nM) compared to Aurora-
B. MK5108 induces cell cycle arrest in G2/M phase (Shimomura et al., 2010). It was already
used in Phase I clinical trial in patients with solid tumors showing a remarkably low toxicity
(Amin et al., 2016).
Since it was considered that the conformation of Aurora-A is important for the stabilization of
MYCN, Gustafson et al. analyzed 32 drugs with CD activity, among which CD532 was
identified to be the most potent Aurora-A inhibitor. Treatment with CD532 leads to a
stabilization of Aurora-A in an inactive conformation, unable to associate with MYCN.
Therefore, MYCN is degraded by the proteasome. Treatment with CD532 leads to a cell cycle
arrest in S phase and can be used to indirectly target MYCN. However, the pharmacological
properties of the inhibitor are not suitable for clinical use and therefore still need to be optimized
(Gustafson et al., 2014). So far, no clinical trial using CD532 was conducted.
MLN8237 (Alisertib) is the most studied Aurora-A inhibitor (Hong et al., 2014). MLN8237 is a
partly CD compound and is also a catalytic inhibitor of Aurora-A. It has a 200-fold higher
selectivity for Aurora-A (1.2 nM) compared to Aurora-B. Additionally, MLN8237 has negligible
off-target effects towards other structurally related kinases (Manfredi et al., 2011). However,
MLN8237 is not as effective as CD532 in reducing MYCN protein level. Cancer cells treated
with MLN8237 show an accumulation in G2/M phase (Brockmann et al., 2013). Treating cells
with 100 nM MLN8237 results in a catalytic inhibition of Aurora-A whereas it has no impact on
the complex formation of Aurora-A and MYCN. Increasing doses of Aurora-A inhibitor (e.g.,
1 µM or more) results in an abolishment of the catalytic activity as well as in a reduced complex
formation of Aurora-A with MYCN (Brockmann et al., 2013).
Several Aurora-A inhibitors are already used in clinical trials for breast cancer, prostate cancer,
leukemia, neuroblastoma, and other malignancies (Mosse et al., 2019; Bavetsias &
Linardopoulos, 2015; Kollareddy et al., 2012). MLN8237 is the only Aurora-A inhibitor included

34
in a Phase III clinical trial (Barr et al., 2015; Melichar et al., 2015). This clinical trial was
interrupted due to non-significant survival effects on patients with relapsed or refractory
peripheral T-cell lymphoma (Bertolin & Tramier, 2020). Additionally, treating patients with
MLN8237 showed dose-limiting toxicities (DLTs) as neutropenia, nausea and fatigue appears
as side-effects after treatment (Durlacher et al., 2016).
Aurora-A inhibitors are not only used as monotherapies. A combination with a microtubule
targeting agent (docetaxel) showed a significant increased survival of mice xenograft for
mantle cell lymphoma. Therefore, this combination could be a beneficial treatment of B cell
non-Hodgkin lymphomas (Qi et al., 2011). Besides this, also a combination with the
proteasome inhibitor bortezomib was used in clinical trials for the treatment of multiple
myeloma and showed a beneficial outcome (Rosenthal et al., 2016).
Aurora-A was also suggested to contribute to cisplatin-based chemotherapy resistance in non-
small cell lung cancer (Xu et al., 2014). Therefore, simultaneous inhibition could enhance anti-
tumor effects as well as overcome drug resistance (Tang et al., 2017).
All in all, it can be concluded that Aurora-A is a promising target in cancer treatment. However,
the treatment needs to be further improved.
Besides the use of inhibitors, recently also a PROTAC has been designed which is able to
target Aurora-A (Adhikari et al., 2020). PROTACs have two moieties; one binding to a certain
protein of interest and the other one, which is able to recruit an E3 ligase that is able to degrade
the protein (Winter et al., 2015). Treating cells with an Aurora-A PROTAC resulted in a cell
cycle arrest in S phase. Together with the identified novel interaction partner involved in RNA
metabolism, indicating a non-catalytic scaffolding function for Aurora-A in S phase (Adhikari et
al., 2020).

35
1.5 Aim of the thesis
The role of Aurora-A in mitosis is extensively studied under physiological conditions as well as
in the cancer situation. However, little is known regarding the role and function of Aurora-A in
other cell cycle phases, although Aurora-A is expressed and can be activated also beyond
mitosis.
The aim of this project was to elucidate and understand the role of Aurora-A in S phase of
MYCN-amplified neuroblastoma cells.
Therefore, the localization of the complex formation as well as the substrates phosphorylated
by Aurora-A upon activation by MYCN were investigated. Furthermore, downstream processes
regulated by Aurora-A activity in S phase were assessed.
From our previous results, we suggested to combine low doses of Aurora-A inhibitors with ATR
inhibitors. This new therapeutic approach was tested by a collaboration partner, revealing a
therapeutic window for MYCN-amplified neuroblastoma. Therefore, the underlying mechanism
for this therapeutic window was elucidated in vitro.

36
2 Materials 2.1 Cell lines and bacterial strains
2.1.1 Human cell lines Cell lines were validated using STR analysis and routinely tested for mycoplasma
contamination.
Name Description (Source) HEK293T Human embryonic kidney cell line, derived from HEK293 cells but stable
expressing SV40 large T antigen (ATCC) IMR-5 Human MYCN-amplified neuroblastoma cell line (Angelika Eggert) IMR-32 Human MYCN-amplified neuroblastoma cell line (Manfred Schwab) NGP Human MYCN-amplified neuroblastoma cell line (Angelika Eggert) SH-EP Human MYCN non-amplified neuroblastoma cell line (Manfred Schwab) SH-SY5Y Human MYCN non-amplified neuroblastoma cell line (Angelika Eggert) SK-NAS Human MYCN non-amplified neuroblastoma cell line (Angelika Eggert)
2.1.2 Murine cell lines Cell lines were validated using STR analysis and routinely tested for mycoplasma
contamination.
Name Description (Source) NIH-3T3 Murine embryonic fibroblasts (ATCC)
2.1.3 Bacterial strains Name Description DH5α Escherichia coli, genotype: F-, Φ80lacZ∆M15, ∆(lacZYA-argF) U169, recA1,
endA1, hsdR17 (rK-, mK+), phoA, supE44, λ-, thi-1, gyrA96, relA1 XL1 blue Escherichia coli, genotype: recA1, endA1, gyrA96, thi-1, hsdR17, supE44,
relA1 lac [F´proAB lacIqZ∆M15 Tn10 (Tetr)]
2.2 Cultivation media and supplements
All chemicals were obtained from Sigma-Aldrich and Roth, changes in company are indicated.
2.2.1 Cultivation media for cell culture For cultivation of human neuroblastoma cell lines RPMI-1640 (Thermo Fisher Scientific) and
for HEK293T and murine cells DMEM (Thermo Fisher Scientific) was used and supplemented
with:
10% (v/v) heat-inactivated (30 min, 56 °C) fetal calf serum (FCS; Biochrom) 1% (v/v) Penicillin/Streptomycin (100,000 U/ml, PAA)
37
Freezing medium 90% FCS 10% DMSO
Transfection medium DMEM/RPMI-1640 2% (v/v) heat-inactivated FCS
Trypsin/EDTA 0.25% Trypsin (Thermo Fisher Scientific) 5 mM EDTA 22.3 mM Tris, pH 7.4 125 mM NaCl
2.2.2 Supplements and inhibitors for cell lines Following supplements were used in cell culture by directly adding to the media.
Compound (Source) Stock concentration Final concentration Doxycycline 1 mg/ml in EtOH; stored
at -20 °C 1 µg/ml
Thymidine 200 µM 200 nM (Cell cycle synchronization) Nocodazole 0.1 mg/ml in medium 0.1 µg/ml (Cell cycle synchronization)
The following inhibitors were used in cell culture by directly adding to the media. All inhibitors
were diluted in DMSO and the stock solutions were kept at -20°C.
Compound (Source) Inhibitor Stock concentration
Final concentration
MLN8237 (Selleckchem) Aurora-A 10 mM 100 – 10,000 nM MK5108 (Selleckchem) Aurora-A 10 mM 1 µM 10058-F4 (Sigma-Aldrich)
MYC/MAX hetero-dimerization
100 mM 100 µM
AZD6738 (Hycultec) ATR 10 mM 100 nM Pladienolide B (PlaB; Santa Cruz)
Splicing 1 mM 1 µM
AZD1152 (Selleckchem) Aurora-B 10 mM 1 µM CHIR-124 (Selleckchem) CHK1 10 mM 1 µM NVP-2 (Tocris) CDK9 1 mM 200 nM Flavopiridol (FP; Sigma-Aldrich)
Multiple CDKs 1 mM 200 nM
2.2.3 Cultivation media for bacterial strains Medium Composition Lysogeny broth (LB) medium
10% (w/v) Bacto tryptone 0.5% (w/v) Yeast extract 1% (w/v) NaCl
LB agar LB medium with 1.2% (w/v) Bacto agar autoclaved, then heated in a microwave, cooled down to 50 °C; antibiotics were added, and a 10 cm dish was filled with 20 ml.

38
2.2.4 Supplements for bacterial strains Supplements were obtained from Roth in powder formulations. Stock solutions were prepared
in ddH2O and sterile filtered before use.
Antibiotic Concentration Ampicillin 100 µg/ml Carbenicillin 100 µg/ml Kanamycin 30 µg/ml
2.3 Buffers and solutions
Buffers and solutions were prepared in ddH2O and stored at room temperature (RT). All
chemicals were obtained from Sigma-Aldrich and Roth. All changes in dissolving solution,
storage temperature and company are indicated.
Buffers and solutions Composition Ammonium persulfate (APS; 10%) 100 mg/ml; aliquots stored at -20 °C Annexin V binding buffer 10 mM HEPES, pH 7.4
140 mM NaCl 2.5 mM CaCl2
BCA buffer A 1% (w/v) BCA-Na2
2% (w/v) Na2CO3 x H2O BCA buffer B 4% (w/v) CuSO4 x 5 H2O Bis-Tris (3.5 x) 1.25 M Bis-Tris Bis-Tris stacking gel 4% (v/v) acrylamide/bisacrylamide
1 x Bis-Tris 0.03% (v/v) APS 0.05% (v/v) TEMED
Bis-Tris separation gel 8 – 10% (v/v) acrylamide/bisacrylamide 1 x Bis-Tris 0.03% (v/v) APS 0.05% (v/v) TEMED
Blocking solution for ChIP 5 mg/ml BSA in PBS; sterile filtered with 0.45 µm vacuum filter, stored at 4 °C
Bradford reagent 0.01% (w/v) Coomassie Brilliant Blue G250 8.5% (v/v) phosphoric acid 4.75% (v/v) EtOH
ChIP elution buffer 50 mM Tris, pH 8.0 1 mM EDTA 1% SDS 50 mM NaHCO3; prepared immediately before use
ChIP swelling buffer 5 mM PIPES, pH 8.0 85 mM KCl 0.5% NP-40, stored at 4°C
39
ChIP wash buffer I 20 mM Tris/HCl, pH 8.0 150 mM NaCl 2 mM EDTA 0.1% SDS 1% Triton X-100, stored at 4 °C
ChIP wash buffer II 20 mM Tris/HCl, pH 8.0 500 mM NaCl 2 mM EDTA 0.1% SDS 1% Triton X-100, stored at 4 °C
ChIP wash buffer III
10 mM Tris/HCl, pH 8.0 250 mM LiCl 1 mM EDTA 1% NP-40 1% deoxycholic acid sodium salt, stored at 4 °C
Crystal violet solution 0.1% (w/v) crystal violet 20% (v/v) EtOH
Digestion buffer 10% TFA in 100 mM ammonium bicarbonate DNA loading buffer (6 x) 10 mM EDTA, pH 8.0
0.2% (w/v) Orange G 40% (w/v) sucrose, stored at -20 °C
Mini lysis buffer 0.2 M NaOH 1% SDS
Mini neutralization buffer 3 M NaOAc, pH 4.8 Mini resuspension buffer 50 mM Tris, pH 8.0
10 mM EDTA 10 µg RNase A
MOPS running buffer (20 x) 1 M MOPS 1 M Tris 20 mM EDTA 2% (w/v) SDS
MOPS running buffer (ready to use) 1 x MOPS running buffer 5 mM sodium bisulfite
Nucleoplasmic lysis buffer 20 mM HEPES, pH 7.9 3 mM EDTA 10% glycerol 150 mM potassium acetate 1.5 mM MgCl2
NuPAGE transfer buffer (20 x) 500 mM Bis-Tris 500 mM bicine 20.5 mM EDTA 0.1 mM Chlorobutanol, stored at 4 °C
NuPAGE buffer (ready to use) 1 x NuPAGE transfer buffer 20% (v/v) Methanol
Phosphatase inhibitor cocktail Ser/Thr phosphatase inhibitor (Sigma-Aldrich, P0044) Tyr phosphatase inhibitor (Sigma-Aldrich, P5726)
40
used 1:1,000, aliquots stored at -20 °C Phosphate buffered saline (PBS; 1 x) 137 mM NaCl
2.7 mM KCl 10.1 mM Na2HPO4 1.76 mM KH2PO4 Solution was autoclaved
Polybrene stock 200 mg dissolved in 50 ml H2O; sterile filtered with 0.2 µM syringe filter, aliquots stored at -20 °C
Propidium iodide (PI) stock solution 1 mg/ml in PBS Protease inhibitor cocktail Protease inhibitor cocktail (Sigma-Aldrich, P8340)
used 1:1,000, aliquots stored at -20 °C Proteinase K 10 mg/ml in ddH2O, aliquots stored at -20 °C RIPA lysis buffer 50 mM HEPES, pH 7.9
140 mM NaCl 1% (v/v) Triton X-100 0.1% (w/v) SDS 0.1% (w/v) sodium deoxycholate 10 mM sodium fluoride 10 mM sodium pyrophosphate 10 mM β-glycerophosphate
Sucrose buffer 10 mM HEPES, pH 7.9 0.34 M sucrose 3 mM CaCl2 2 mM magnesium acetate 0.1 mM EDTA
Sample buffer (6 x) 1.2 g SDS 6 mg bromophenol blue 4.7 ml 100% (v/v) glycerol 1.2 ml 0.5 M Tris, pH 6.8 2.1 ml ddH2O 0.93 g DTT
Tris-Acetate-EDTA (TAE) buffer (50 x) 2 M Tris, pH 8.0 5.7% (v/v) acetic acid 50 mM EDTA
Tris buffered saline (TBS; 20 x) 500 mM Tris 2.8 M NaCl pH 7.4
TBS with Tween 20 (TBS-T) 1 x TBS 0.2% (v/v) Tween-20
TE 10 mM Tris, pH 7.0 1 mM EDTA, pH 8.0
41
2.4 Standards, Enzymes, and Kits
2.4.1 Standards DNA marker Gene Ruler 1 kb Plus DNA ladder (Thermo Fisher Scientific) Protein marker PageRuler Prestained Protein Ladder (Thermo Fisher Scientific)
2.4.2 Enzymes Benzonase nuclease Merck DNase I Thermo Fisher Scientific Gateway BP clonase II Life Technologies Gateway LR clonase II Life Technologies M-MLV Reverse Transcriptase Promega Phusion Hot Start II HF DNA polymerase Thermo Fisher Scientific Proteinase K Roth Restriction enzymes Thermo Fisher Scientific RNase A Roth SYBR®Green qPCR Mastermix Thermo Fisher Scientific T4 DNA Ligase Thermo Fisher Scientific Trypsine (sequencing-grade modified) Promega
2.4.3 Kits Click-iT EdU Alexa Fluor Imaging Kit Themo Fisher Scientific CloneJET™ PCR Cloning Kit Thermo Fisher Scientific Duolink® In Situ PLA® Probe Anti-Rabbit PLUS Sigma-Aldrich Duolink® In Situ PLA® Probe Anti-Mouse MINUS Sigma-Aldrich Duolink® In Situ Detection Reagents Green Sigma-Aldrich GeneJET Gel Extraction Kit Thermo Fisher Scientific Immobilon Western HRP Substrate Sigma-Aldrich NEBNext® ChIP-Seq Library Prep Master Mix Set for Illumina®
NEB
NEBNext Multiplex Oligos for Illumina (Dual Index Set 1) NEB NEBNext® Poly(A) mRNA Magnetic Isolation Module NEB NEBNext® rRNA Depletion Kit NEB NEBNext® Ultra™ II Directional RNA Library Prep with Beads NEB NEBNext® Ultra™ II DNA Library Prep with Beads NEB NEBNext® Ultra™ RNA Library Prep Kit NEB MiniElute PCR Purification Kit Qiagen miRNeasy® MiniKit Qiagen PureLink™ HiPure Plasmid Maxiprep Kit Thermo Fisher Scientific QIAquick Gel Extraction Kit Qiagen QIAquick PCR Purification Kit Qiagen Quant-iT™ PicoGreen dsDNA Assay Kit Life Technologies Quant-iT™ RiboGreen RNA Assay Kit Life Technologies RNeasy® MinElute® cleanup kit Qiagen
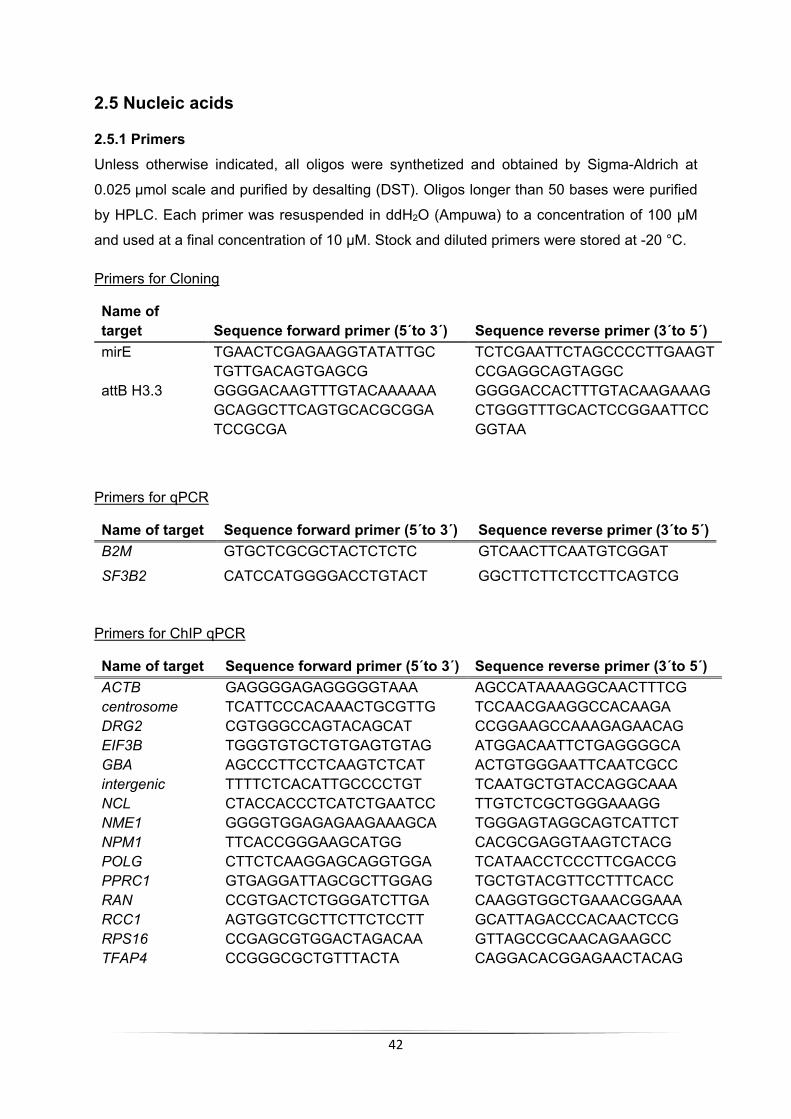
42
2.5 Nucleic acids
2.5.1 Primers Unless otherwise indicated, all oligos were synthetized and obtained by Sigma-Aldrich at
0.025 µmol scale and purified by desalting (DST). Oligos longer than 50 bases were purified
by HPLC. Each primer was resuspended in ddH2O (Ampuwa) to a concentration of 100 µM
and used at a final concentration of 10 µM. Stock and diluted primers were stored at -20 °C.
Primers for Cloning
Name of target Sequence forward primer (5´to 3´) Sequence reverse primer (3´to 5´) mirE TGAACTCGAGAAGGTATATTGC
TGTTGACAGTGAGCG TCTCGAATTCTAGCCCCTTGAAGT CCGAGGCAGTAGGC
attB H3.3 GGGGACAAGTTTGTACAAAAAA GCAGGCTTCAGTGCACGCGGA TCCGCGA
GGGGACCACTTTGTACAAGAAAG CTGGGTTTGCACTCCGGAATTCC GGTAA
Primers for qPCR
Name of target Sequence forward primer (5´to 3´) Sequence reverse primer (3´to 5´) B2M GTGCTCGCGCTACTCTCTC GTCAACTTCAATGTCGGAT SF3B2 CATCCATGGGGACCTGTACT GGCTTCTTCTCCTTCAGTCG
Primers for ChIP qPCR
Name of target Sequence forward primer (5´to 3´) Sequence reverse primer (3´to 5´) ACTB GAGGGGAGAGGGGGTAAA AGCCATAAAAGGCAACTTTCG centrosome TCATTCCCACAAACTGCGTTG TCCAACGAAGGCCACAAGA DRG2 CGTGGGCCAGTACAGCAT CCGGAAGCCAAAGAGAACAG EIF3B TGGGTGTGCTGTGAGTGTAG ATGGACAATTCTGAGGGGCA GBA AGCCCTTCCTCAAGTCTCAT ACTGTGGGAATTCAATCGCC intergenic TTTTCTCACATTGCCCCTGT TCAATGCTGTACCAGGCAAA NCL CTACCACCCTCATCTGAATCC TTGTCTCGCTGGGAAAGG NME1 GGGGTGGAGAGAAGAAAGCA TGGGAGTAGGCAGTCATTCT NPM1 TTCACCGGGAAGCATGG CACGCGAGGTAAGTCTACG POLG CTTCTCAAGGAGCAGGTGGA TCATAACCTCCCTTCGACCG PPRC1 GTGAGGATTAGCGCTTGGAG TGCTGTACGTTCCTTTCACC RAN CCGTGACTCTGGGATCTTGA CAAGGTGGCTGAAACGGAAA RCC1 AGTGGTCGCTTCTTCTCCTT GCATTAGACCCACAACTCCG RPS16 CCGAGCGTGGACTAGACAA GTTAGCCGCAACAGAAGCC TFAP4 CCGGGCGCTGTTTACTA CAGGACACGGAGAACTACAG

43
2.5.2 shRNAs Name Sequence 5´to 3´ shSF3B2 #1 CAAGGAAAGAGATGAATATTTA shSF3B2 #2 AACAGAAGACCATGAAGTCAAA shDEK #1 CCAGCTTCACGATTATGACTAA shDEK #2 AACCGATGAACTTAGAAATCTA shDEK #3 CCAGGCACTGTGTCCTCATTAA shATAD2 #1 TGCCGATGTTGATCCAATGCAA shATAD2 #2 AAAGGTGCTGATTGTCTAAGTA shATRX #1 TCAGGAAGTTCCACAAGATAAA shATRX #2 GAAGACAGAAGATAAAGATAAA shATRX #3 GCAGCTAGACTACATTAGCAAA shMSH6 #1 CTCCGAAGTTGTAGAGCTTCTA shMSH6 #2 TAAGAGTGAAGAAGATAATGAA shSMARCAD1 #1 GAAGGGTGATAGAGTTGTGTTA shSMARCAD1 #2 CCAAGAAAGAGATGTAGTTATA shDHX9 #1 AAACGATGTTGTTTATGTCATT shDHX9 #2 AAAGGAAGAACAAGAAGTGCAA shDHX9 #3 TCAGCTGCAAAACATCATTCAA shCDK12 #1 TCAGCGACAAAGTGGTGTTGTA shCDK12 #2 CCCGGGACTTACTAAAAGCTAA shCDK12 #3 GAAGGAAATTGTCACAGATAAA shCDK12 #4 CTCCGAGAAGCATCTTGTTAAA shCDK12 #5 TAAAGAGAATAGTGTTCACAAA shCCNK #1 ATCCATACCAGTTCCTACTAAA shCCNK #2 TCCCGGTCGACGTTTTGGAAGA shCCNK #3 GCCCTTGCAGTCTGACTGTGTA shCCNK #4 CTGGATCTTTACTCACAAGGAA shSUPT16H #1 GCAGAAGAGTCAGACTATTCTA shSUPT16H #2 TTACGAGGAAGAAGAAGAACAA shSUPT16H #3 GCAAGTCTAATGTGTCCTATAA shSUPT16H #4 CAAGAAGTTCAAGAAAATTATA shSSRP1 #1 TAAGCGAGAGCTTCAAGAGCAA shSSRP1 #2 GCCGAGAGAAGATCAAGTCAGA shSSRP1 #3 AAAGGTAAAGATGGAAAAGAAA shSSRP1 #4 CAAAGAAGAAGAAGAAAGTAAA shSSRP1 #5 ACAAGTCAAAGAAGAAGAAGAA shORC6 #1 CTAGCTGTACAGTTTAGCTGTA shORC6 #2 GAGCGAGACTTATAGATAGATA shORC6 #3 TTAGCTGTATAGAAGCAGTGAA shPCF11 #1 ACAGGTTGATGAACATAGTAAA shPCF11 #2 ACAGGAAAGAATTTCTAATGAA shPCF11 #3 AGACGTTGGTACTACAGTTTAA shPCF11 #4 AAAGCTGCTGTTGGATCTAGAA shPCF11 #5 GAGCGACCACAAGAAACTACAA

44
2.5.3 siRNAs siNTC SMART pool RNAi library, Dharmacon; non-targeting control (NTC) siSF3B2 SMART pool RNAi library, Dharmacon; cat. No 026599
2.5.4 Plasmids All sequences cloned into the vectors refer to human sequences.
Verification of constructs by Sanger sequencing was carried out by LCG Genomics.
Empty vectors
pDONR221 Vector for generating entry clones for Gateway cloning pInducer21 Doxycycline-inducible cDNA expression vector with IRES GFP (Meerbrey et
al., 2011) pJET2.1 Blunt cloning vector with T7-promoter (CloneJET™PCR Cloning Kit, Thermo
Fisher Scientific) pLT3GEPIR pRRL vector backbone expressing Tet-ON mirE-based RNAi
Packaging vectors for lentiviral production
psPAX.2 Plasmid encoding virion packaging system pMD2G Plasmin encoding virion envelope
Plasmids available in the laboratory of Martin Eilers
pcDNA3.0 MYCN pcDNA3.0 vector with coding sequence (CDS) of human MYCN WT; cloned by Tobias Otto
pcDNA3.0 MYCN T58A pcDNA3.0 vector with CDS of human MYCN harboring a T58A mutation; cloned by Tobias Otto
pInd21 HA-RNase H1 pInducer21 vector with CDS of human RNase H1 tagged with HA, cloned by Jacqueline Kalb
pTRE2pur AURKA pTRE2pur vector with CDS of human Aurora-A WT; cloned by Markus Brockmann
pTRE2pur AURKA T217D pTRE2pur vector with CDS of human Aurora-A harboring a T217D mutation; cloned by Markus Brockmann
Plasmids generated during this study
pInd21 H3.3-HA pInducer21 vector with CDS of human H3.3 tagged with HA
pInd21 H3.3 pInducer21 vector with CDS of human H3.3 pJET2.1 Repair template H3 WT
pJET2.1 vector with repair template of human H3 WT
pJET2.1 Repair template H3S10A
pJET2.1 vector with repair template of human H3 introducing a H3S10A mutation
pJET2.1 Repair template H3S10D
pJET2.1 vector with repair template of human H3 introducing a H3S10D mutation
pLT3GEPIR shSF3B2 #1 pLT3GEPIR shRNA targeting SF3B2 #1

45
pLT3GEPIR shSF3B2 #2 pLT3GEPIR shRNA targeting SF3B2 #2 pLT3GEPIR shDEK #1 pLT3GEPIR shRNA targeting DEK #1 pLT3GEPIR shDEK #2 pLT3GEPIR shRNA targeting DEK #2 pLT3GEPIR shDEK #3 pLT3GEPIR shRNA targeting DEK #3 pLT3GEPIR shATAD2 #1 pLT3GEPIR shRNA targeting ATAD2 #1 pLT3GEPIR shATAD2 #2 pLT3GEPIR shRNA targeting ATAD2 #2 pLT3GEPIR shATRX #1 pLT3GEPIR shRNA targeting ATRX #1 pLT3GEPIR shATRX #2 pLT3GEPIR shRNA targeting ATRX #2 pLT3GEPIR shATRX #3 pLT3GEPIR shRNA targeting ATRX #3 pLT3GEPIR shMSH6 #1 pLT3GEPIR shRNA targeting MSH6 #1 pLT3GEPIR shMSH6 #2 pLT3GEPIR shRNA targeting MSH6 #2 pLT3GEPIR shSMARCAD1 #1 pLT3GEPIR shRNA targeting SMARCAD1 #1 pLT3GEPIR shSMARCAD1 #2 pLT3GEPIR shRNA targeting SMARCAD1 #2 pLT3GEPIR shDHX9 #1 pLT3GEPIR shRNA targeting DHX9 #1 pLT3GEPIR shDHX9 #2 pLT3GEPIR shRNA targeting DHX9 #2 pLT3GEPIR shDHX9 #3 pLT3GEPIR shRNA targeting DHX9 #3 pLT3GEPIR shCDK12 #1 pLT3GEPIR shRNA targeting CDK12 #1 pLT3GEPIR shCDK12 #2 pLT3GEPIR shRNA targeting CDK12 #2 pLT3GEPIR shCDK12 #3 pLT3GEPIR shRNA targeting CDK12 #3 pLT3GEPIR shCDK12 #4 pLT3GEPIR shRNA targeting CDK12 #4 pLT3GEPIR shCDK12 #5 pLT3GEPIR shRNA targeting CDK12 #5 pLT3GEPIR shCCNK #1 pLT3GEPIR shRNA targeting CCNK #1 pLT3GEPIR shCCNK #2 pLT3GEPIR shRNA targeting CCNK #2 pLT3GEPIR shCCNK #3 pLT3GEPIR shRNA targeting CCNK #3 pLT3GEPIR shCCNK #4 pLT3GEPIR shRNA targeting CCNK #4 pLT3GEPIR shSUPT16H #1 pLT3GEPIR shRNA targeting SUPT16H #1 pLT3GEPIR shSUPT16H #2 pLT3GEPIR shRNA targeting SUPT16H #2 pLT3GEPIR shSUPT16H #3 pLT3GEPIR shRNA targeting SUPT16H #3 pLT3GEPIR shSUPT16H #4 pLT3GEPIR shRNA targeting SUPT16H #4 pLT3GEPIR shSSRP1 #1 pLT3GEPIR shRNA targeting SSRP1 #1 pLT3GEPIR shSSRP1 #2 pLT3GEPIR shRNA targeting SSRP1 #2 pLT3GEPIR shSSRP1 #3 pLT3GEPIR shRNA targeting SSRP1 #3 pLT3GEPIR shSSRP1 #4 pLT3GEPIR shRNA targeting SSRP1 #4 pLT3GEPIR shSSRP1 #5 pLT3GEPIR shRNA targeting SSRP1 #5 pLT3GEPIR shORC6 #1 pLT3GEPIR shRNA targeting ORC6 #1 pLT3GEPIR shORC6 #2 pLT3GEPIR shRNA targeting ORC6 #2 pLT3GEPIR shORC6 #3 pLT3GEPIR shRNA targeting ORC6 #3 pLT3GEPIR shPCF11 #1 pLT3GEPIR shRNA targeting PCF11 #1 pLT3GEPIR shPCF11 #2 pLT3GEPIR shRNA targeting PCF11 #2 pLT3GEPIR shPCF11 #3 pLT3GEPIR shRNA targeting PCF11#3 pLT3GEPIR shPCF11 #4 pLT3GEPIR shRNA targeting PCF11 #4 pLT3GEPIR shPCF11 #5 pLT3GEPIR shRNA targeting PCF11 #5
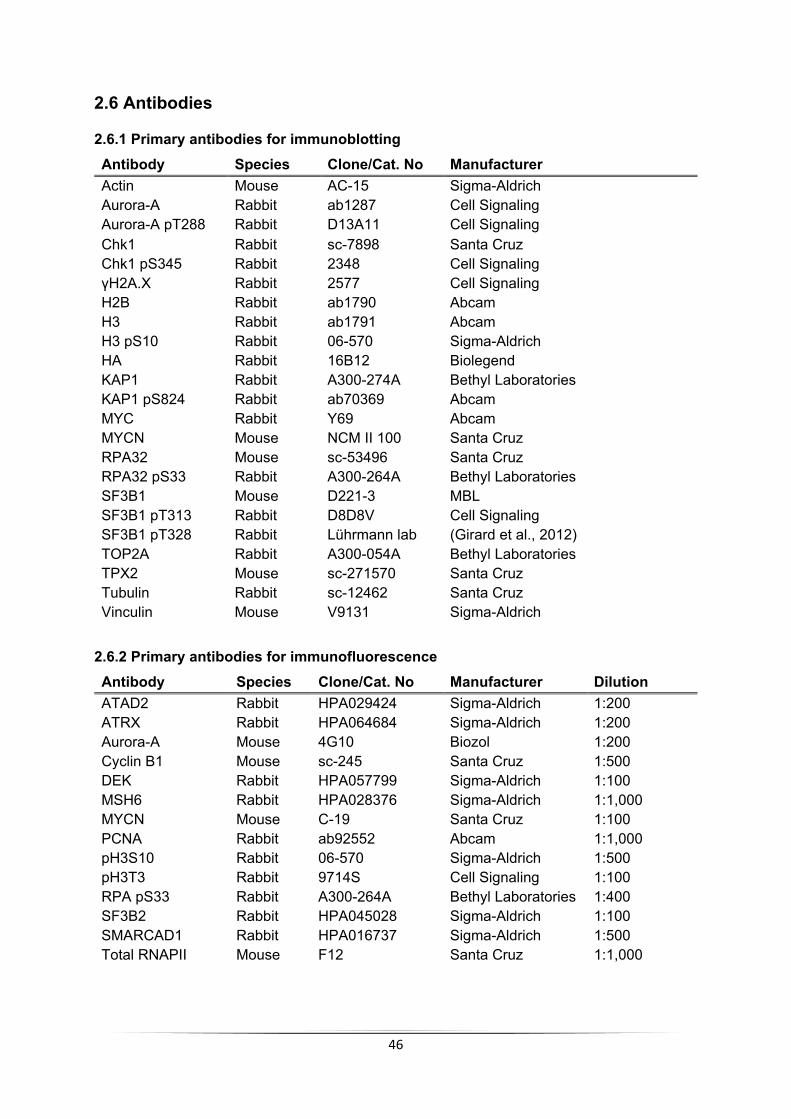
46
2.6 Antibodies
2.6.1 Primary antibodies for immunoblotting Antibody Species Clone/Cat. No Manufacturer Actin Mouse AC-15 Sigma-Aldrich Aurora-A Rabbit ab1287 Cell Signaling Aurora-A pT288 Rabbit D13A11 Cell Signaling Chk1 Rabbit sc-7898 Santa Cruz Chk1 pS345 Rabbit 2348 Cell Signaling γH2A.X Rabbit 2577 Cell Signaling H2B Rabbit ab1790 Abcam H3 Rabbit ab1791 Abcam H3 pS10 Rabbit 06-570 Sigma-Aldrich HA Rabbit 16B12 Biolegend KAP1 Rabbit A300-274A Bethyl Laboratories KAP1 pS824 Rabbit ab70369 Abcam MYC Rabbit Y69 Abcam MYCN Mouse NCM II 100 Santa Cruz RPA32 Mouse sc-53496 Santa Cruz RPA32 pS33 Rabbit A300-264A Bethyl Laboratories SF3B1 Mouse D221-3 MBL SF3B1 pT313 Rabbit D8D8V Cell Signaling SF3B1 pT328 Rabbit Lührmann lab (Girard et al., 2012) TOP2A Rabbit A300-054A Bethyl Laboratories TPX2 Mouse sc-271570 Santa Cruz Tubulin Rabbit sc-12462 Santa Cruz Vinculin Mouse V9131 Sigma-Aldrich
2.6.2 Primary antibodies for immunofluorescence Antibody Species Clone/Cat. No Manufacturer Dilution ATAD2 Rabbit HPA029424 Sigma-Aldrich 1:200 ATRX Rabbit HPA064684 Sigma-Aldrich 1:200 Aurora-A Mouse 4G10 Biozol 1:200 Cyclin B1 Mouse sc-245 Santa Cruz 1:500 DEK Rabbit HPA057799 Sigma-Aldrich 1:100 MSH6 Rabbit HPA028376 Sigma-Aldrich 1:1,000 MYCN Mouse C-19 Santa Cruz 1:100 PCNA Rabbit ab92552 Abcam 1:1,000 pH3S10 Rabbit 06-570 Sigma-Aldrich 1:500 pH3T3 Rabbit 9714S Cell Signaling 1:100 RPA pS33 Rabbit A300-264A Bethyl Laboratories 1:400 SF3B2 Rabbit HPA045028 Sigma-Aldrich 1:100 SMARCAD1 Rabbit HPA016737 Sigma-Aldrich 1:500 Total RNAPII Mouse F12 Santa Cruz 1:1,000

47
2.6.3 Antibodies for ChIP Antibody Species Clone/Cat. No Manufacturer H3 Rabbit ab1791 Abcam H3.3 Rabbit ab176840 Abcam H3 pS10 Rabbit ab177218 Abcam MYCN Mouse B8.4.B Santa Cruz RNAPII total Mouse A10 Santa Cruz RNAPII pS2 Rabbit ab5095 Abcam
2.6.4 Secondary antibodies for immunoblotting Antibody Species Clone/Cat. No Manufacturer Anti-mouse IgG-HRP Goat sc-2314 Santa Cruz Anti-rabbit IgG-HRP Goat sc-2313 Santa Cruz IRDye® 800CW anti-Mouse Goat C30109-03 LI-COR IRDye® 800CW anti-Rabbit Goat C30409-07 LI-COR
2.6.5 Secondary antibodies for Immunofluorescence Antibody Species Clone/Cat. No Manufacturer Alexa Fluor®488 anti-Mouse Goat A11017 Invitrogen Alexa Fluor®568 anti-Rabbit Goat A11036 Invitrogen
2.7 Consumables
Consumables were purchased from Eppendorf, Greiner, Nunc, Sarstedt, Ibidi, Waters,
GLScience, Thermo Scientific, and VWR and included disposable plastic items such as cell
culture dishes, reaction tubes, cryotubes, syringes, cuvettes, pipettes, plates for
Immunofluorescence or Proximity-Ligation Assay.
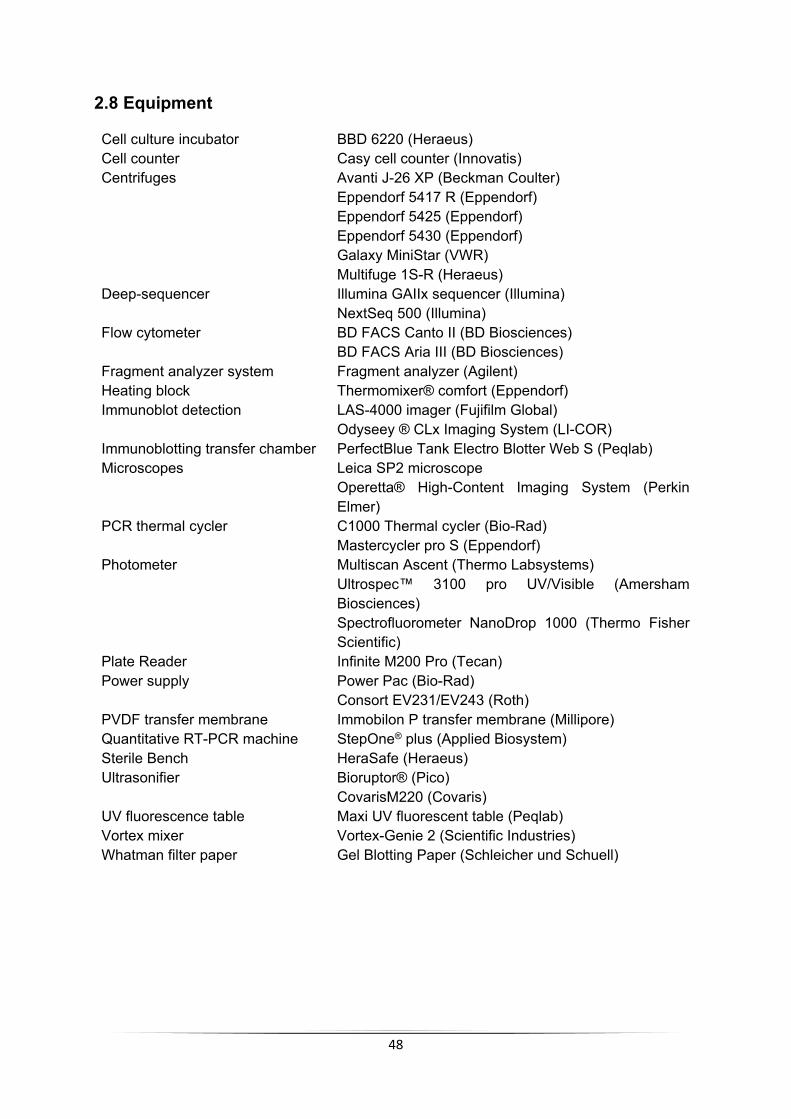
48
2.8 Equipment
Cell culture incubator BBD 6220 (Heraeus) Cell counter Casy cell counter (Innovatis) Centrifuges Avanti J-26 XP (Beckman Coulter)
Eppendorf 5417 R (Eppendorf) Eppendorf 5425 (Eppendorf) Eppendorf 5430 (Eppendorf) Galaxy MiniStar (VWR) Multifuge 1S-R (Heraeus)
Deep-sequencer Illumina GAIIx sequencer (Illumina) NextSeq 500 (Illumina)
Flow cytometer BD FACS Canto II (BD Biosciences) BD FACS Aria III (BD Biosciences)
Fragment analyzer system Fragment analyzer (Agilent) Heating block Thermomixer® comfort (Eppendorf) Immunoblot detection LAS-4000 imager (Fujifilm Global)
Odyseey ® CLx Imaging System (LI-COR) Immunoblotting transfer chamber PerfectBlue Tank Electro Blotter Web S (Peqlab) Microscopes Leica SP2 microscope
Operetta® High-Content Imaging System (Perkin Elmer)
PCR thermal cycler C1000 Thermal cycler (Bio-Rad) Mastercycler pro S (Eppendorf)
Photometer Multiscan Ascent (Thermo Labsystems) Ultrospec™ 3100 pro UV/Visible (Amersham Biosciences) Spectrofluorometer NanoDrop 1000 (Thermo Fisher Scientific)
Plate Reader Infinite M200 Pro (Tecan) Power supply Power Pac (Bio-Rad)
Consort EV231/EV243 (Roth) PVDF transfer membrane Immobilon P transfer membrane (Millipore) Quantitative RT-PCR machine StepOne® plus (Applied Biosystem) Sterile Bench HeraSafe (Heraeus) Ultrasonifier Bioruptor® (Pico)
CovarisM220 (Covaris) UV fluorescence table Maxi UV fluorescent table (Peqlab) Vortex mixer Vortex-Genie 2 (Scientific Industries) Whatman filter paper Gel Blotting Paper (Schleicher und Schuell)

49
2.9 Software and online programs Acrobat Adobe Inc. Affinity Serif Ascent Thermo Labsystem ApE plasmid editor By M. Wayne Davis BD FACSDiva 6.1.2 BD Biosciences hermo (Chen et al., 2013) EndNote X7 Clarivate Analytics EnrichR (Huang da et al., 2009) Harmony® High-Content Analysis software version 4.6 Perkin Elmer Image J By Wayne Rasband Image Studio™ version 5.2.5 LI-COR Integrated Genome Browser (Nicol et al., 2009) LAS AF 2.0 Leica MaxQuant version 1.5.7.4 and 1.5.2.8 MaxQuant Multi Gauge Fujifilm Global Multiscan Ascent Thermo Labsystems NanoDrop 1000 3.8.1 Thermo Fisher Scientific Office 2011 Mac Microsoft Inc. Prism6 GraphPad Software Inc. Spotfire data visualization software TIBCO Stepone software v2.3 Applied Biosystem UCSC Genome Bioinformatics http://genome.ucsc.edu

50
3 Methods 3.1 Cell-biological methods
3.1.1 Cultivation of eukaryotic cell lines The human neuroblastoma cell lines IMR-5, IMR-32, NGP, SH-EP, SH-SY5Y, and SK-NAS
cells were cultivated in RPMI-1640. HEK293T and NIH-3T3 mouse cells were cultivated in
DMEM. 10% FCS and 1% Penicillin/Streptomycin was added to RPMI-1640 or DMEM (from
here on “medium”) and the cells were incubated at 37 °C with 5% CO2.
3.1.1.1 Passaging of cells To passage the cells, the medium was removed, and the cells were washed with PBS.
Trypsin/EDTA was added to detach the cells. After 1 - 5 min incubation at 37 °C, medium was
added to stop the reaction. The cells were individualized and split in an appropriate ratio for
further cultivation. For seeding a specific number of cells, cells were counted using the CASY
cell counter.
3.1.1.2 Freezing of cells Cells were trypsinized, centrifuged for 5 min at 300 g and room temperature (RT), and
resuspended in freezing medium. Cells were transferred into cryogenic vials and stored
at -80 °C in a freezing container that ensures slow cell freezing (1 °C per min). For short-term
storage, frozen cells were kept at -80 °C, for long-term storage cells were transferred to liquid
nitrogen storage tanks.
3.1.1.3 Thawing of cells Frozen cells were quickly thawed and transferred into a tube filled with medium. To remove
residual traces of DMSO, the cells were centrifuged for 5 min with 300 g at RT. The cell pellet
was resuspended in fresh medium and plated on a cell culture dish.
3.1.2 Transfection of cells Transfection is a method to bring nucleic acids into mammalian cells. For the transfection of
plasmids, the transfection reagents Lipofectamine 2000 or polyethylenimine (PEI) were used.
For transfection of siRNA the transfection reagent RNAiMax was used.
3.1.2.1 Transfection of plasmids Cells were seeded the day before. Shortly before transfection, cells were washed once with
PBS and transfection medium was added. Two reaction tubes were prepared containing each
500 µl Opti-MEM. One was mixed with 30 µl Lipofectamine 2000 or PEI and the other one with
appropriate amount of plasmid DNA (5 - 15 µg). After incubation for 5 min at RT separately,
reactions were mixed and incubated for 20 min at RT. The mix was added dropwise to the
cells.

51
3.1.2.2 Transfection of siRNA Cells were seeded the day before and shortly before transfection, washed once with PBS and
medium was changed to transfection medium. Two reaction tubes were prepared containing
each 500 µl Opti-MEM. One was mixed with 10 µl RNAiMax and the other one with appropriate
amount of siRNA. After incubation for 5 min at RT separately, reactions were mixed and
incubated for 20 min at RT. The mix was added dropwise to the cells, leading to a final
concentration of 20 nM siRNA and 0.2% RNAiMax. 12 - 16 h later the medium was removed,
and cells were supplied with fresh medium.
3.1.3 Lentivirus production 5x10⁶ HEK293T cells were seeded on a 10 cm cell culture dish. On the next day cells were
transfected using PEI (see 3.1.2.1) Therefore, 10 µg of packaging vector psPAX2, 2.5 µg of
the envelope vector pMD2G and 10 µg of the lentiviral expression plasmid (e.g., pInducer21)
were used for transfection. 16 h after transfection, the medium was removed, and 6 ml fresh
medium was added. Virus containing supernatant was harvested 48 h, 60 h, and 72 h after
transfection. The pooled supernatant containing the virus was filtered with 0.45 µm filter using
a syringe. For long-term storage, the virus was stored in aliquots at -80 °C or directly used for
lentiviral infection of cells (see 3.1.4).
3.1.4 Lentiviral infection For lentiviral infection, 4 ml transfection medium, 2 ml filtered virus and polybrene to a final
concentration of 6 µg/ml were used to infect IMR-5 cells growing on a 10 cm cell culture dish.
16 h after infection, cells were washed with PBS and fresh medium was added. 48 h after
infection cells were selected dependent on the used vector by appropriate antibiotics or at a
FACSAria™III by color due to expression of a fluorescent protein.
3.1.5 Cell cycle synchronization of cells To analyze processes in certain cell cycle phases, cells were synchronized using double
thymidine block or nocodazole. To determine that cell populations accumulate in distinct cell
cycle phases, cells were analyzed using PI FACS (see 3.1.8.1).
3.1.5.1 Cell cycle synchronization using thymidine Thymidine in large excess causes an arrest of the cells at the border between G1 and S phase
due to inhibition of DNA synthesis (Schvartzman et al., 1984). Cells were treated with 2 mM
thymidine. After 16 h, the cells were released by washing with PBS and renewing the medium.
After 8 h the thymidine block was repeated to improve efficiency of cell cycle synchronization.

52
16 h later the cells were released and harvested after different timepoints. IMR-5 cells were
released for 4 h, 8 h, and 12 h - 14 h to harvest S, G2/M, and G1 phase, respectively.
3.1.5.2 Cell cycle synchronization using nocodazole Nocodazole blocks cells in mitosis by preventing microtubule assembly (Ho et al., 2001). One
day after seeding, cells were treated with 1 µg/ml nocodazole. After 16 h incubation cells were
harvested.
3.1.6 Harvesting and lysis of cells For immunoblotting analysis cell lysates were prepared. First, cells were washed with PBS and
afterwards harvested in 1 x RIPA lysis buffer containing 1:1,000 protease- and phosphatase-
inhibitor cocktail. The cells were scraped from the dish and transferred into a reaction tube.
After 30 min incubation on ice the lysates were centrifuged for 5 min with 14,000 rpm at 4 °C
to remove cell debris and insoluble cell components. Protein concentration in the lysate was
measured using either Bradford assay (see 3.3.1.1) or BCA assay (see 3.3.1.2).
3.1.7 Fractionation of cells Fractionation of cells was used to obtain proteins localized in cytoplasm, nucleoplasm, or
bound to chromatin in separated fractions. The samples were prepared as previously
described (Aygun et al., 2008). Briefly, cells were seeded and treated as indicated. Before
harvest, cells were washed with TBS containing 1:1,000 protease- and phosphatase-inhibitor
cocktails and harvested by scraping. Cells were pelleted by centrifugation (300 g, 20 min, 4
°C). Lysis was carried out in sucrose buffer containing 0.5% NP-40 for 20 min at 4 °C while
rotating. Nuclei were pelleted by centrifugation for 20 min with 3,900 g at 4 °C and washed
once with sucrose buffer. Lysis of nuclei was carried out in nucleoplasmic lysis buffer by
performing 20 strokes with a dounce-homogenizer on ice. Lysed nuclei were incubated 30 min
on ice and homogenized by performing 30 strokes using a dounce-homogenizer. Benzonase
(25 U) was added to each sample and incubated for 1 h at 16 °C. Unsolubilized chromatin was
pelleted by centrifugation for 30 min at 18,000 g and 4 °C, resuspended in 1 x Sample buffer
containing 5 U Benzonase to release chromatin-bound proteins, incubated at RT for 1 h, and
heated for 15 min at 95 °C.
3.1.8 FACS analyses FACS analysis was used to investigate cell cycle (PI FACS) as well as measuring apoptosis
of cells (Annexin V/PI FACS). All samples were measured with FACSCantoII. The measured
data was analyzed with the software BD FACSDiva 6.1.2.
53
3.1.8.1 PI FACS DNA content changes during cell cycle due to the duplication of DNA in the S phase. The
intercalating agent propidium iodide (PI) is therefore measured by FACS to quantify the amount
of cellular DNA and infer cell cycle distribution.
PI FACS samples were washed with PBS, trypsinized for 5 min, and transferred to a 15 ml
tube. After centrifugation for 10 min at 1,500 rpm and 4 °C, the cells were washed with 10 ml
ice cold PBS, and centrifuged again for 5 min with 1,500 rpm at 4 °C. To fix the cells, the pellet
was resuspended in 1 ml of ice-cold PBS and added drop wise to 4 ml ice cold 100% ethanol,
while vortexing. Samples were kept at -20 °C for at least 10 h. At the day of FACS
measurement the samples were centrifuged for 5 min at 1,500 rpm and 4 °C. The supernatant
was discarded, and the pellet was washed with 10 ml of ice-cold PBS. The cells were
centrifuged 5 min at 1,500 rpm and 4 °C and the supernatant was discarded. The pellet was
resuspended in 400 µl PBS containing 36 µg/ml PI and 24 µg/ml RNase A and incubated for
30 min at 37 °C or overnight at 4 °C in the dark. Prior measurement, the samples were
transferred to a FACS tube.
3.1.8.2 Annexin V/PI FACS Cell apoptosis can be investigated by staining of cells with Annexin V and PI.
Phosphatidylserine is a component of cell membranes that almost exclusively resides in the
inner part of the cell membrane (i.e., facing towards the cytoplasm) under physiological
conditions. Upon apoptotic induction, phosphatidylserine is exposed to the outside and can be
bound by the ligand Annexin V. Additionally, in a late apoptotic stage, the membrane is
disrupted allowing PI to enter cells and stain the DNA (Koopman et al., 1994).
Therefore, supernatant including floating cells was collected from the cell culture dish,
adherent cells were trypsinized 5 min to ensure complete detachment and added to the
supernatant. Cells were centrifuged for 5 min at 1,500 rpm and 4 °C. Pellet was washed with
ice cold PBS and again centrifuged. The pellet was resuspended in 100 µl Annexin V binding
buffer and incubated with 5 µl Pacific Blue-conjugated Annexin V (25 µg/ml). After incubation
for 15 min at RT in the dark, 400 µl of Annexin V binding buffer was added. Samples were
transferred to FACS tubes and 5 µl of PI (1 mg/ml) was added to each sample before the
measurement.
3.1.9 Crystal violet staining Crystal violet staining is a method to visualize the density of cells plated on a cell culture dish.
Therefore, cells were seeded on 6-well dishes and subjected to different treatments. Upon
treatment end, medium was removed, and cells were washed with PBS once. Crystal violet

54
stain solution was added for 1 h at RT. Afterwards, excess of dye was washed from the cell
culture dish with desalted water. The plates were air dried overnight at RT.
3.2 Molecular biology methods 3.2.1 Transformation of competent bacteria with plasmid DNA and plasmid amplification Transformation of chemically competent bacteria with plasmid DNA was used following ligation
(see 3.2.6) or for plasmid amplification. Therefore, competent bacteria were thawed on ice.
The ligation mix or 1 µg plasmid DNA was added. After incubation for 30 min on ice, a heat-
shock was performed for 45 s at 42 °C. Afterwards, the mix was kept on ice for 2 min, followed
by addition of 700 µl prewarmed Lysogeny broth (LB) medium without antibiotics and
incubation for up to 1 h at 37 °C. The suspension was centrifuged and resuspended in 100 µl
of LB medium and plated on LB agar plates containing the appropriate antibiotic for selection.
The plate was incubated overnight at 37 °C.
3.2.2 Isolation of plasmid DNA from bacteria 3.2.2.1 Small-scale isolation of plasmid DNA from bacteria (mini-preparation) Plasmid DNA isolation in small-scale was performed using alkaline lysis. 1.4 ml overnight
culture was centrifuged, and the pellet resuspended in 150 µl Mini resuspension buffer. To
denaturate protein components, 150 µl of Mini lysis buffer was subsequently added, inverted
several times, and incubated at RT. The lysis was stopped after 5 min by addition of 150 µl
Mini neutralization buffer. Samples were centrifuged for 5 min at 14,000 rpm at RT, the
supernatant containing the DNA was incubated with 500 µl isopropanol to precipitate DNA.
After incubation for 30 min at -20 °C, the precipitate was pelleted by centrifugation for 10 min
with 14,000 rpm at 4 °C. The pellet was washed once with 1 ml 80% ethanol, air-dried, and
solubilized in 20 µl TE buffer.
3.2.2.2 Large-scale isolation of plasmid DNA from bacteria (maxi-preparation) For large-scale isolation of plasmid DNA from bacteria, 200 ml overnight culture was processed
using the PureLink™ HiPure Plasmid Maxiprep Kit according to manufacturer´s protocol. The
purified DNA was solubilized in TE buffer and the DNA concentration was adjusted to 1 µg/µl
using the NanoDrop 1000 system.
3.2.3 Restriction analysis of DNA Restriction analysis of DNA was used for analytical and preparative reasons. Sequence-
specific hydrolysis of DNA was performed using restriction endonucleases from Thermo Fisher
Scientific or New England Biolabs according to manufacturer´s protocol.
Analytical digestion was set up as follows and incubated for 1 h at 37 °C.

55
1 µg plasmid DNA 0.5 µl restriction endonuclease 1 0.5 µl restriction endonuclease 2 1 µl 10 x reaction buffer Ad 10 µl ddH2O
For preparative digestion, the amount of DNA and restriction endonucleases, digestion time,
and reaction volume were adjusted.
3.2.4 Gel electrophoresis separating DNA fragments Gel electrophoresis is a method to analyze the molecular weight of nucleic acids. According to
the expected size of the DNA fragment, agarose gels between 1 - 2% were prepared.
Therefore, agarose was dissolved by boiling in TAE buffer. After the solution cooled down to
60 °C, ethidium bromide was added to a final concentration of 0.3 µg/ml, and mixed. The
solution was poured in a horizontal gel chamber with a comb. DNA loading dye was added to
each sample, before loading to the well of the gel. To determine the size of the DNA fragments,
the Gene Ruler 1 kb Plus DNA ladder was used. The separation of DNA according to size was
performed at 120 V for 1 h. Ethidium bromide intercalates DNA, which makes it possible to
detect DNA-bands in the gel with UV light (254/365 nm) at a UV transilluminator. For
documentation, ImageJ was used.
3.2.5 Extraction and purification of DNA fragments The DNA fragments of interest were cut out of the agarose gel and extracted, using either
QIAquick PCR Purification Kit or GeneJET Gel Extraction Kit according to manufacturer’s
protocol.
3.2.6 Ligation of DNA fragments into plasmids To clone DNA fragments into linearized vectors, the T4 DNA ligase was used. The insert was
added in 3 x molar excess to the vector. A ligation control with water instead of insert was used
as a negative control.
100 ng linearized vector x ng insert 1 µl T4 DNA ligase 2 µl 10 x ligation buffer Ad 20 µl ddH2O
The reaction mix was incubated up to 1 h at RT and then transformed into competent bacteria
(see 3.2.1).

56
3.2.7 Cloning 3.2.7.1 Cloning of shRNAs into pLT3GEPIR Short hairpin RNAs (shRNAs) are used to knock down a protein of interest. Therefore,
constructs to generate shRNAs targeting the protein of interest were cloned into pLT3GEPIR,
which harbors a miR-E based backbone. Sequences optimized for the protein of interest were
obtained from Fellmann et al., 2013.
As a first step the oligos were amplified by a polymerase chain reaction (PCR).
1 µl miR-E primer 50 ng oligo 10 mM dNTPs 2% DMSO 10 µl 5 x HF buffer 0.5 µl Phusion DNA polymerase Ad 50 µl ddH2O
This mix was heated for 3 min at 98 °C. Afterwards, the mix was denaturated (25 s, 98 °C),
annealed (30 s, 54 °C), and elongated (60 s, 72 °C) for 25 cycles, followed by a final elongation
step for 5 min at 72 °C. 5 µl of the PCR mix was loaded to a 2% agarose gel (see 3.2.4) to
investigate the success of the amplification, verified by a band at 150 bp. Amplified DNA was
purified (see 3.2.5) and eluted in 20 µl TE-buffer.
To clone the shRNA oligo into the pLT3GEPIR, both the pLT3GEPIR vector and the amplified
shRNA sequence were digested with the restriction enzymes EcoRI and XhoI (see 3.2.3),
loaded onto a 1% agarose gel, cut out, and purified (see 3.2.5), followed by ligation (see 3.2.6)
and transformation into competent bacteria (see 3.2.1). Clones were picked and a mini-
preparation was performed (see 3.2.2.1), followed by a restriction digestion with MluI and XhoI,
to investigate if the oligo was inserted into the vector. If a band at 250 bp could be detected,
the plasmid DNA was sequenced (LGC Genomics) to confirm the correct orientation of the
inserted oligo. Positive clones were amplified with a maxi-preparation (see 3.2.2.2).
3.2.7.2 Gateway cloning To clone cDNA into the pINDUCER21 vector, the Gateway® cloning technology was used.
The attB1 and attB2 sequences were inserted, flanking the cDNA by PCR with specific primers.
The cDNA was first cloned using the BP clonase enzyme into the pDONOR221 vector
according to manufacturer´s protocol. After transformation (see 3.2.1) and mini-preparation
(see 3.2.2.1), clones were sequenced (LGC genomics). The positive entry clone was
transferred into pINDUCER21 according to manufacturer´s protocol using the LR clonase
enzyme. A positive clone was verified by sequencing (LGC genomics) and amplified by maxi-
preparation (see 3.2.2.2).
57
3.2.8 Concentration measurement of nucleic acids Different methods were accessed for measuring concentration of nucleic acids. Usually,
concentration of plasmid DNA or RNA was measured with Nanodrop system (see 3.2.8.1), low
amount of DNA or RNA, usually before library preparation was measured with either Pico- or
RiboGreen (see 3.2.8.2), and all DNA and RNA used for sequencing e.g., prepared libraries
were measured with Fragment analyzer (see 3.2.8.3).
3.2.8.1 NanoDrop The concentration of isolated plasmid DNA or RNA was measured at the NanoDrop 1000. The
NanoDrop is a spectrophotometer, which measures the absorption at 260 nm, directly
correlated to nucleic acid concentration. The aromatic rings of the bases contribute to the
absorption. The purity of the sample was determined by the ratio between the absorption at
260 nm to 280 nm.
3.2.8.2 PicoGreen and RiboGreen Concentration measurements of double-stranded DNA (dsDNA) were performed with the
Quant-iT™ PicoGreen dsDNA reagent. Concentration measurements of RNA were performed
with the Quant-iT™ RiboGreen RNA reagent. Both PicoGreen as well as RiboGreen
intercalate into their respective nucleic acid and the fluorescence can be determined at a
wavelength of 485/535 nm. The samples were measured at a Tecan Infinite M200 Pro plate
reader. The preparation of the samples was performed according to the manufacturer´s
protocol. Quantification with PicoGreen was used to determine DNA concentration of ChIP
samples, that were used as input material for library preparation of ChIP-sequencing.
Quantification with RiboGreen was used to determine RNA concentration of samples
containing pulled-down 4-thio-uridine RNA. These samples were then used as input material
for library preparation of 4sU-sequencing.
3.2.8.3 Fragment analyzer Isolated RNA, used as input material for RNA-sequencing (see 3.4.2) as well as DNA-libraries
for RNA-, 4-thio-uridine-, and ChIP-sequencing were quantified on the Fragment analyzer
according to manufacturer´s protocol.
3.2.9 Nucleic acid isolation 3.2.9.1 RNA isolation with TriFAST For total RNA isolation the medium was removed from the cells. 1 ml TriFast™ was added to
each dish and the cells were scraped and transferred into a reaction tube. After incubation for
5 min at RT 200 µl chloroform was added, the suspension was thoroughly vortexed, and
incubated for 3 min at RT. After centrifugation for 5 min at 14,000 rpm and 4 °C, the aqueous
phase was transferred into a new tube. 1 µl GlycoBlue and 500 µl isopropanol were added.
58
After vortexing, the mix was incubated for 15 min at -20 °C and afterwards centrifuged for
10 min at 4 °C and 14,000 rpm. The supernatant was removed, and the RNA pellet was
washed twice with 1 ml 75% ethanol. After centrifugation for 10 min at 14,000 rpm and 4 °C,
the supernatant was removed, and the pellet was dissolved in 25 µl RNase-free water. The
concentration was determined with the Nanodrop 1000. The samples were further used for
cDNA synthesis (see 3.2.10) and stored at -80 °C.
3.2.9.2 RNA isolation with the RNeasy® Mini For RNA-sequencing (see 3.4.2), the RNA isolation was performed using the RNeasy®
MinElute® cleanup kit according to manufacturer´s protocol, including a DNase I digestion
step.
3.2.9.3 RNA isolation with the miRNeasy® Mini Kit For labelled, nascent RNA, which was further used for 4-thio-uridine-sequencing (see 3.4.3),
the isolation of RNA was performed using the miRNeasy® Mini Kit according to manufacturer´s
protocol.
3.2.9.4 DNA isolation with phenol-chloroform DNA within the process of Chromatin immunoprecipitation (ChIP; see 3.2.8.2) was isolated
using phenol-chloroform. Therefore, one volume phenol-chloroform-isoamyl alcohol (25:14:1)
was added to the samples and mixed thoroughly by vortexing. Samples were centrifuged for
5 min at 14,000 rpm and RT. The upper phase containing the DNA was transferred into a new
reaction tube and mixed with 1 ml 100% ethanol, 30 µl NaAc with pH 5.2, and 2 µl GlycoBlue.
To precipitate the DNA, the sample was vortexed and incubated for at least 30 min at -20 °C,
followed by a centrifugation for 30 min at 14,000 rpm and 4 °C. The pellet was washed twice
with 80% ethanol, air-dried, and resuspended in TE buffer or ddH2O.
3.2.10 Complementary DNA (cDNA) synthesis For the expression analysis of individual genes, the extracted total RNA (see 3.2.9.1.) was
reverse transcribed into cDNA. For cDNA synthesis, 0.5 - 2 µg RNA was added to a final
volume of 10 µl with water and incubated for 1 min at 65 °C. After a short incubation on ice,
40 µl of the master mix was added containing component as followed:
10 µl 5 x first strand buffer 1.25 µl 10 mM dNTPs 2 µl random hexanucleotide primer 0.2 µl RiboLock RNase inhibitor 1 µl M-MLV reverse transcriptase Ad 50 µl ddH2O
The mix was incubated for 10 min at RT, followed by an incubation for 50 min at 37 °C, and a
15 min incubation at 70 °C. 200 µl ddH2O was added and the cDNA was stored at -20 °C. 10 µl
were used for qPCR analysis (see 3.2.11).
59
3.2.11 Quantitative PCR (qPCR) qPCR is used to analyze gene expression by measuring the abundance of the corresponding
mRNA or to analyze enrichment of DNA fragments after ChIP (see 3.3.4). Therefore, a
fluorescent dye which intercalates into newly synthesized DNA during the amplification step
was used. In this study, SYBR® Green was employed as a fluorescent dye which is already
present in the SYBR® Green Master Mix.
10 µl of DNA were added to 3 µl H2O, 5 µl 2 x SYBR® Green Master Mix, and 2 µl of forward
and reverse primer (10 µM). The samples were pipetted with the master mix into a 96 well
plate and initially denaturated for 15 min at 95 °C. Afterwards 38 cycles of 30 s denaturation
at 95 °C, 20 s annealing at 60 °C, and 15 s extension at 72 °C were performed to amplify the
cDNA on the StepOne® plus machine.
The comparative Ct method described by Schmittgen and Livak in 2008 was applied to
compare the amounts of nucleic acids in different samples. First, every well associated to a
threshold cycle (“Ct”) and every Ct was subtracted to the respective Ct of a housekeeping
gene, thus obtaining a ∆Ct value. Per definition, a housekeeping gene is expected not to
change upon the tested experimental conditions. In this study ß-2-microglobulin (B2M) was
used as housekeeping gene. Secondly, ∆Ct values were subtracted to the respective ∆Ct value
of the untreated control (thus obtaining the ∆∆Ct value). Finally, a fold change (FC) value was
obtained through the formula FC = 2-∆∆Ct. For all DNA fragments after ChIP, 1% input was used
to normalize the samples. For each sample, the average and standard deviation of technical
triplicates was calculated and reported.
3.3 Protein biochemical methods 3.3.1 Quantification of protein using colorimetric methods Colorimetric methods were used to determine the protein concentration in a sample after lysis
of cells (see 3.1.6).
3.3.1.1 Bradford assay Bradford assay uses the binding of the Coomassie-brilliant blue G250-dye to unpolar,
hydrophobic, and cationic side chains of amino acids. The binding leads to a shift of the
absorbent maxima from 465 nm to 595 nm.
To determine the protein concentration, 1 µl of each lysate was mixed with 1 ml Bradford
reagent and incubated for 5 min at RT. The absorption of the samples was measured at
595 nm using the Ultrospec™ 3100 pro. Protein concentration was then calculated using a
standard curve, defined by known, increasing concentrations of BSA.
60
3.3.1.2 Bicinchoninic acid (BCA) assay BCA uses the ability of peptide bonds in proteins to reduce Cu2+ ions to Cu+ ions. The amount
of Cu+ is proportional to the protein amount in the sample. Additionally, two BCA molecules
build purple colored chelate complexes with each Cu+ ion, leading to absorption at a
wavelength of 562 nm.
A bovine serum albumin (BSA) standard curve was pipetted using 0 mg/ml, 0.5 mg/ml,
1 mg/ml, 2 mg/ml, 4 mg/ml, 6 mg/ml, and 8 mg/ml BSA, to calculate the protein concentration
of the sample. 4 µl of standards and samples were added to 150 µl BCA solution (BCA buffer
A and B were mixed in a 50:1 ratio) to a flat bottom 96 well plate. After incubation for 30 min
at 37 °C in the dark the 96 well plate was measured with the Multiscan Ascent plate reader at
550 nm.
3.3.2 Bis-Tris gel electrophoresis With Bis-Tris gel electrophoresis proteins are separated according to their molecular weight,
and therefore used to analyze the composition of protein lysates. 6 x sample buffer was added,
and the samples were denaturated for 5 min at 95 °C. The temperature and the detergent
properties of SDS disrupt secondary and tertiary structures of the proteins. Due to DTT in the
sample buffer, disulfide-bonds are reduced and thereby disrupted. After applying a voltage
between 80 - 120 V, proteins run through the gel in the direction of the anode. Due to the
mesh-like structures of the gels, there is a size-dependent separation of the proteins. Large
proteins run slower through the gel than small proteins do. Mesh-like structures can be
changed according to the amount of acrylamide.
Equal protein amounts (15 - 30 µg) were loaded into wells of a Bis-Tris gel consisting of a
separation gel overlaid with a stacking gel. To estimate the size of a protein, 3 µl of the
PageRuler Prestained Protein Ladder, which has a distinct pattern at specific molecular
weights, was also loaded.
3.3.3 Immunoblotting Afterwards, proteins were transferred onto a PVDF membrane using a wet blotting system.
The PVDF membrane was activated for 5 min in 100% methanol, then washed for 5 min in
water and subsequently incubated in 1 x NuPAGE transfer buffer. The gel, two sponges and
8 Whatman filter papers were also equilibrated in the transfer buffer.
The gel was laid on the PVDF membrane covered by four Whatman filter papers and a sponge
on each side and fixed in the transfer chamber, filled with 1 x NuPAGE transfer buffer. Due to
the positive charge of the membrane, the negatively charged proteins are transferred from the
gel to the membrane after applying 300 mA at 4 °C for 2.5 h. Afterwards the membrane was

61
incubated for 1 h with 1:5 blocking solution in TBS to block unspecific binding. Subsequently,
the membrane was cut into pieces according to the size of the proteins of interest and the
pieces were incubated with the respective primary antibodies overnight at 4 °C. To wash away
unspecifically bound antibody, the membranes were washed 3 times with TBS-T for 5 min.
Afterwards the membranes were incubated for 1 h with the secondary antibody coupled to an
infra-red fluorophore or horseradish peroxidase (HRP). The membranes were washed again
3 times for 5 min with TBS-T. The infra-red signal was detected by Odyseey ® CLx Imaging
System. The HRP-coupled secondary antibodies were visualized by chemiluminescence using
the Immobilon Western Substrates according to manufacturer´s instruction and detected with
the LAS-4000 imager.
3.3.4 Chromatin Immunoprecipitation (ChIP) ChIP is used to investigate protein binding on DNA. At the end of treatment, formaldehyde was
directly added to the medium to crosslink proteins with DNA. Formaldehyde had a final
concentration of 1% and was incubated for 5 min at RT while shaking. The reaction was
stopped by addition of 1 ml 1 M glycine and incubated for 5 min at RT while shaking.
Afterwards, the medium was removed, and cells were washed twice with ice-cold PBS. Cells
were scraped in 1 ml ice-cold PBS containing 1:1,000 protease- and phosphatase-inhibitor
cocktails and collected in falcon tubes. Cells were centrifuged for 5 min at 4 °C and 1,500 rpm
and pellets were lysed in ChIP swelling buffer. After incubation on ice for 20 min, nuclei were
pelleted for 5 min at 4 °C and 1,500 rpm. The pellets were resuspended in RIPA buffer and
incubated for 10 min on ice.
After cell lysis, the DNA was fragmented using the Covaris M220 (Peak Power = 75.0;
Cycles/Burst = 200; Duty Factor = 10.0; Duration = 1800 s). Samples were kept at 4 °C while
fragment size was verified. To investigate sample size 15 µl of sonicated samples were
incubated with 15 µl 5 M NaCl, 2 µl RNase A (1 mg/ml), and brought to a final volume of 300 µl
with TE buffer. The mix was incubated for 1 h at 37 °C to degrade RNA, followed by overnight
incubation at 65 °C while shaking to revert the crosslink. On the next day 2 µl Proteinase K
(1 mg/ml) was added and the mix was incubated for 2 h at 45 °C while shaking to degrade all
proteins. DNA was isolated by phenol-chloroform purification (see 3.2.9.4), the pellets were
resuspended in 20 µl TE, and DNA separation was performed on a 2% agarose gel (see 3.2.4).
When verified that fragment size of chromatin is smaller than 500 bp, chromatin was cleared
by centrifugation for 30 min at 4 °C and 14,000 rpm. The samples were distributed equally for
immunoprecipitation (IP) and IgG control. 1% input samples were kept as a control reference.
The primary antibody was coupled to a 50:50 Protein A:G Dynabeads mixture overnight at
4 °C on the rotating wheel. Therefore, 30 µl of beads per sample and number of IP were

62
washed 3 times with 1 ml 0.5% BSA in PBS. All washing steps were performed using the
magnetic rack. After the last washing step, beads were resuspended in 1 ml 0.5% BSA in PBS
and 3 µg antibody per IP were added. At the next day residual unbound antibody was washed
away by washing the beads again 3 times with 0.5% BSA in PBS. After the last washing step,
beads were resuspended in 30 µl per IP and added to the distributed chromatin. The mix was
incubated overnight on the rotating wheel at 4 °C. The immunoprecipitated chromatin was
washed 3 times with 1 ml ChIP washing buffer I, ChIP washing buffer II, and ChIP washing
buffer III each. The beads were then washed once with TE and transferred into a new reaction
tube. The DNA was eluted by adding 150 µl elution buffer and incubated 15 min on the rotating
wheel at RT. The elution was performed twice, and the eluates were merged. 300 µl elution
buffer was added to the input samples and chromatin decrosslinking was performed for all
samples as described above. The DNA was purified using phenol-chloroform (see 3.2.9.4), the
pellet was resuspended in 500 µl ddH2O, and 10 µl were used for qPCR (see 3.2.11).
3.3.5 Immunofluorescence Immunofluorescence enables the visualization of proteins to investigate amount and
localization of the proteins of interest within the cell. Cells were plated in 18-well ibidi slides or
on 96-well plates. Inhibitor treatment was performed for 8 h. For pulsed 5-ethynyl-2’-
deoxyuridine (EdU) incorporation, cells were incubated for 30 min in medium containing 10 µM
EdU. Upon EdU incorporation and inhibitor treatment, cells were fixed and permeabilized with
ice-cold methanol for 20 min at RT. After removing the methanol, cells were blocked for 30 min
with 5% BSA in PBS at RT to reduce unspecific binding of the primary antibody. The Click-iT
EdU Alexa Fluor 647 Imaging Kit was used according to manufacturer´s protocol for
visualization of EdU. After 30 min incubation, the samples were washed 3 times with PBS. The
primary antibody was diluted to the desired concentration in 5% BSA in PBS and added to the
sample overnight at 4 °C. At the next day, the sample was washed 3 times with PBS and then
incubated for 1 h at RT with the secondary antibody. Nuclei were counterstained using
Hoechst 33342. Afterwards the samples were again washed 3 times with PBS to remove
residual unspecific bound secondary antibody or Hoechst 33342. The samples were analyzed
with the Leica SP2 microscope (18-well ibidi slides) or with the Operetta® High-Content
Imaging System (96-well plates).
3.3.6 Proximity ligation assay (PLA) Cells were plated one day before the treatment in 384-well plates or 18-well ibidi slides. The
cells were treated for 8 h with the indicated inhibitors. For pulsed EdU incorporation, cells were
incubated in medium containing 10 µM EdU. After 30 min, cells were fixed and permeabilized

63
with ice-cold methanol for 20 min at RT. After removing the methanol, cells were blocked for
30 min with 5% BSA in PBS at RT to reduce unspecific binding of the primary antibody. The
Click-iT EdU Alexa Fluor 647 Imaging Kit was used according to manufacturer´s protocol for
EdU detection. After 30 min incubation the samples were washed for 3 times with PBS. The
primary antibody was diluted to the used concentration in 5% BSA in PBS and added to the
sample overnight at 4 °C. PLA was performed using Duolink® In Situ Kit according to the
manufacturer´s protocol. Nuclei were counterstained using Hoechst 33342. Pictures from 384-
well plates were taken with an Operetta® High-Content Imaging System and pictures from 18-
well ibidi slides were taken with Leica SP2 microscope.
3.3.7 Phosphoproteomic analysis Phosphoproteomic analysis and sample preparation was performed as previously described
(Cossa et al., 2020). Phosphoproteomic analysis using mass-spectrometry (MS) is a method
to investigate global changes in the phosphorylation status of proteins. Measurement of
proteomic and phosphoproteomic data by MS was performed by Andreas Schlosser (Rudolf-
Virchow-Center, Wuerzburg) and data analysis was carried out by Andreas Schlosser and
Petra Beli (Institute of Molecular Biology, Mainz).
3.3.7.1 Sample preparation The samples for phosphoproteomic analysis were cell cycle synchronized using double
thymidine block (see 3.1.5.1) and treated for 4 h with indicated inhibitors. Proteins of chromatin-
bound fraction were isolated (see 3.1.7). Samples were incubated for 10 min at 70 °C, 120 mM
iodacetamide was added, and incubated for 30 min at RT in the dark. After adding 50 µl 1 M
ABC buffer, 4 x acetone was added, and proteins were precipitated overnight. After
centrifugation at 2,000 g for 15 min, pellets were washed 3 times with ice-cold acetone, and
dried up. Pellets were resuspended in 750 µl digestion buffer and sonified in a Bioruptor®
(5 cycles of 30 s). 1:100 LysC was added to each sample and incubated 1 h at 37 °C, followed
by addition of 10 µg sequencing-grade modified trypsin, and incubation overnight at 37 °C
upon shaking. Digested samples were centrifuged at 16,000 g for 20 min and lyophilized
overnight. Samples were dissolved in 2% acetonitrile, 0.5% formic acid with the help 3 x 30 s
Bioruptor cycles and 20 min shaking. After centrifugation for 5 min at 5,000 g, samples were
cleaned up with Sep Pak C18 cartridges. 10 µl sample was collected for proteomic
measurement, while the rest was used for lyophilization. Phosphopeptides were enriched with
PhosphTio tips 3 mg/200 µl and eluted in 150 µl 15% acetonitrile, 5% ammonium hydroxide.
After overnight lyophilization, samples were re-dissolved in a mixture of 100 µl 200 mM citric
acid with 20 µl acetonitrile, and 1 µl formic acid shortly before NanoLC-MS/MS measurement.

64
3.3.7.2 Data analysis NanoLC-MS/MS analyses were performed on an Orbitrap Fusion equipped with a PicoView
Ion Source and coupled to an EASY-nLC 1000. Peptides were loaded onto self-packed
capillary columns (PicoFrit, 30 cm x 150 µm ID) with ReproSil-Pur 120 C18-AQ, 1.9 µm and
separated with a 90-min linear gradient from 3% to 40% acetonitrile and 0.1% formic acid and
a flow rate of 500 nl/min.
An Orbitrap analyzer with a resolution of 60,000 for MS scans and 15,000 for MS/MS scans
was used. HCD fragmentation with 35% normalized collision energy was applied. A top speed
data-dependent MS/MS method with a fixed cycle time of 3 s was used. Dynamic exclusion
was applied with an exclusion duration of 45 s and a repeat count of 1; single charged
precursors were excluded from selection. Minimum signal threshold for precursor selection
was set to 50,000.
Raw MS data files were analyzed with MaxQuant version 1.5.7.4 and 1.5.2.8. Andromeda,
which is integrated in the utilized version of MaxQuant, was used to perform database search
against the UniProt Human database. Additionally, a database containing common
contaminants was used. The search was performed with tryptic cleavage specificity with
3 allowed miscleavages. Protein identification was under control of the false-discovery rate
(1% false discovery rate (FDR) on protein and peptide level). The search was performed
against following variable modifications: oxidation (Met), Gln to pyro-Glu formation (N-term.
Gln), and Phospho (STY), in addition to MaxQuant default settings. Carbamidomethyl (Cys)
was set as fixed modification. For protein quantitation, the LFQ intensities were used (Cox et
al., 2014). Proteins with less than two identified razor/unique peptides were dismissed.
Intensities from MaxQuant Phospho (STY) table were used for relative quantitation of
phosphorylation sites. For Phosphoproteomics upon Aurora-A inhibition intensities from the
MaxQuant Phospho (STY) table were quantile normalized and subsequently a moderate t-test
(limma algorithm) was applied to identify significantly regulated phosphorylation sites (Ritchie
et al., 2015; Bolstad et al., 2003).
3.4 Next generation sequencing The libraries of all next generation sequencing experiments were sequenced on an Illumina
NextSeq 500 system by Carsten Ade. The data analysis of ChIP-sequencing and RNA-
sequencing was done by Peter Gallant. The data analysis of the 4sU-sequencing was done by
Susanne Walz and the p-value was calculated by Peter Gallant. Carsten Ade, Peter Gallant,
and Susanne Walz are employed at Theodor Boveri Institute, Department for Biochemistry and
Molecular Biology, University of Wuerzburg.
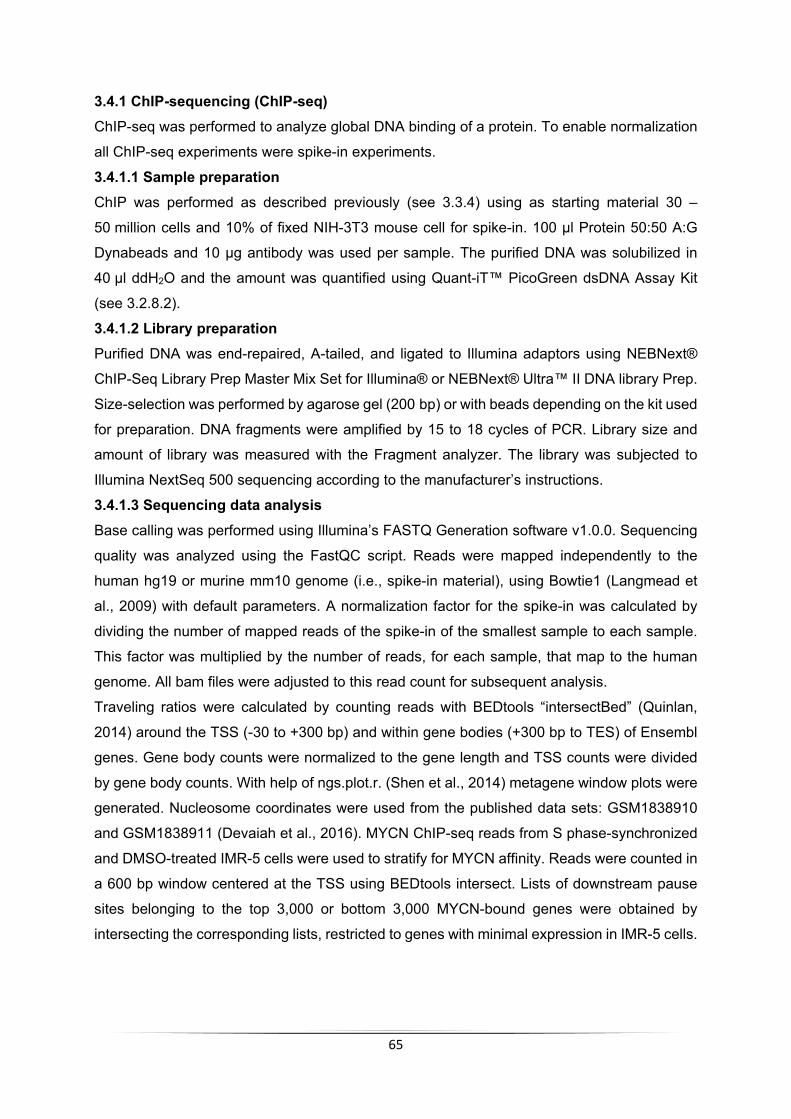
65
3.4.1 ChIP-sequencing (ChIP-seq) ChIP-seq was performed to analyze global DNA binding of a protein. To enable normalization
all ChIP-seq experiments were spike-in experiments.
3.4.1.1 Sample preparation ChIP was performed as described previously (see 3.3.4) using as starting material 30 –
50 million cells and 10% of fixed NIH-3T3 mouse cell for spike-in. 100 µl Protein 50:50 A:G
Dynabeads and 10 µg antibody was used per sample. The purified DNA was solubilized in
40 µl ddH2O and the amount was quantified using Quant-iT™ PicoGreen dsDNA Assay Kit
(see 3.2.8.2).
3.4.1.2 Library preparation Purified DNA was end-repaired, A-tailed, and ligated to Illumina adaptors using NEBNext®
ChIP-Seq Library Prep Master Mix Set for Illumina® or NEBNext® Ultra™ II DNA library Prep.
Size-selection was performed by agarose gel (200 bp) or with beads depending on the kit used
for preparation. DNA fragments were amplified by 15 to 18 cycles of PCR. Library size and
amount of library was measured with the Fragment analyzer. The library was subjected to
Illumina NextSeq 500 sequencing according to the manufacturer’s instructions.
3.4.1.3 Sequencing data analysis Base calling was performed using Illumina’s FASTQ Generation software v1.0.0. Sequencing
quality was analyzed using the FastQC script. Reads were mapped independently to the
human hg19 or murine mm10 genome (i.e., spike-in material), using Bowtie1 (Langmead et
al., 2009) with default parameters. A normalization factor for the spike-in was calculated by
dividing the number of mapped reads of the spike-in of the smallest sample to each sample.
This factor was multiplied by the number of reads, for each sample, that map to the human
genome. All bam files were adjusted to this read count for subsequent analysis.
Traveling ratios were calculated by counting reads with BEDtools “intersectBed” (Quinlan,
2014) around the TSS (-30 to +300 bp) and within gene bodies (+300 bp to TES) of Ensembl
genes. Gene body counts were normalized to the gene length and TSS counts were divided
by gene body counts. With help of ngs.plot.r. (Shen et al., 2014) metagene window plots were
generated. Nucleosome coordinates were used from the published data sets: GSM1838910
and GSM1838911 (Devaiah et al., 2016). MYCN ChIP-seq reads from S phase-synchronized
and DMSO-treated IMR-5 cells were used to stratify for MYCN affinity. Reads were counted in
a 600 bp window centered at the TSS using BEDtools intersect. Lists of downstream pause
sites belonging to the top 3,000 or bottom 3,000 MYCN-bound genes were obtained by
intersecting the corresponding lists, restricted to genes with minimal expression in IMR-5 cells.
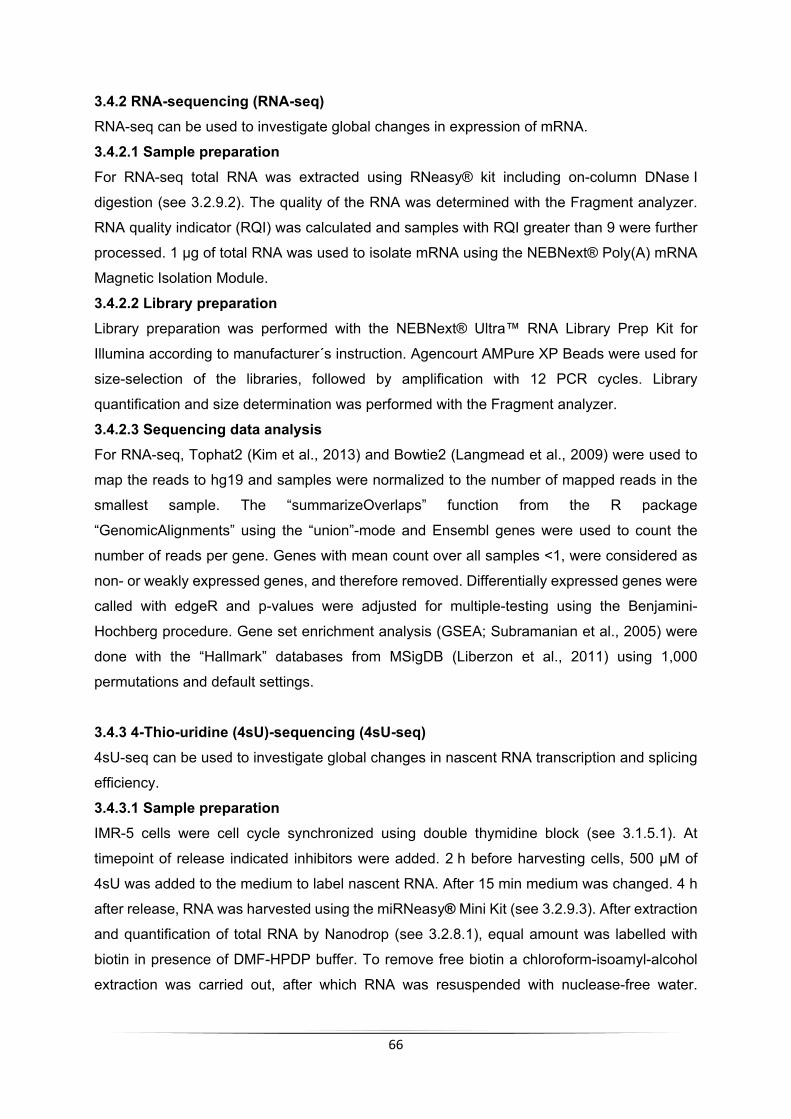
66
3.4.2 RNA-sequencing (RNA-seq) RNA-seq can be used to investigate global changes in expression of mRNA.
3.4.2.1 Sample preparation For RNA-seq total RNA was extracted using RNeasy® kit including on-column DNase I
digestion (see 3.2.9.2). The quality of the RNA was determined with the Fragment analyzer.
RNA quality indicator (RQI) was calculated and samples with RQI greater than 9 were further
processed. 1 µg of total RNA was used to isolate mRNA using the NEBNext® Poly(A) mRNA
Magnetic Isolation Module.
3.4.2.2 Library preparation Library preparation was performed with the NEBNext® Ultra™ RNA Library Prep Kit for
Illumina according to manufacturer´s instruction. Agencourt AMPure XP Beads were used for
size-selection of the libraries, followed by amplification with 12 PCR cycles. Library
quantification and size determination was performed with the Fragment analyzer.
3.4.2.3 Sequencing data analysis For RNA-seq, Tophat2 (Kim et al., 2013) and Bowtie2 (Langmead et al., 2009) were used to
map the reads to hg19 and samples were normalized to the number of mapped reads in the
smallest sample. The “summarizeOverlaps” function from the R package
“GenomicAlignments” using the “union”-mode and Ensembl genes were used to count the
number of reads per gene. Genes with mean count over all samples <1, were considered as
non- or weakly expressed genes, and therefore removed. Differentially expressed genes were
called with edgeR and p-values were adjusted for multiple-testing using the Benjamini-
Hochberg procedure. Gene set enrichment analysis (GSEA; Subramanian et al., 2005) were
done with the “Hallmark” databases from MSigDB (Liberzon et al., 2011) using 1,000
permutations and default settings.
3.4.3 4-Thio-uridine (4sU)-sequencing (4sU-seq) 4sU-seq can be used to investigate global changes in nascent RNA transcription and splicing
efficiency.
3.4.3.1 Sample preparation IMR-5 cells were cell cycle synchronized using double thymidine block (see 3.1.5.1). At
timepoint of release indicated inhibitors were added. 2 h before harvesting cells, 500 µM of
4sU was added to the medium to label nascent RNA. After 15 min medium was changed. 4 h
after release, RNA was harvested using the miRNeasy® Mini Kit (see 3.2.9.3). After extraction
and quantification of total RNA by Nanodrop (see 3.2.8.1), equal amount was labelled with
biotin in presence of DMF-HPDP buffer. To remove free biotin a chloroform-isoamyl-alcohol
extraction was carried out, after which RNA was resuspended with nuclease-free water.

67
DynabeadsTM MyOneTM Streptavidin C1 beads were used to enrich biotinylated RNA, which
was then eluted by 100 mM DTT and cleaned by RNeasy® MinElute® cleanup kit. The
concentration of nascent RNA was then measured using RiboGreen RNA assay kit (see
3.2.8.2) and equal amounts were used for library preparation.
3.4.3.2 Library preparation Before library preparation, rRNA was depleted using NEBNext® rRNA Depletion Kit and then
all eluted material was used for NEBNext® Ultra™ II Directional RNA Library Prep. Library was
amplified using 14 PCR cycles and sequenced for 75 cycles using Illumina NextSeq 500
system.
3.4.3.3 Sequencing data analysis 4sU-seq was performed as previously described (Cossa et al., 2020). Briefly, reads were
mapped using Tophat2 (Kim et al., 2013) and Bowtie2 (Langmead et al., 2009) to human
genome hg19. Ribosomal reads, which were defined by UCSCs Repeat Masked table filtered
for rRNA, were mapped, and removed. All samples were normalized to the sample with the
smallest number of mapped reads. UCSC hg 19 RefGene table was used for filtering reads,
which belong to certain regions of a gene. The following regions were defined: exons, the first
intron of a gene, all introns, intron-spanning (‘‘spliced’’), exon-intron-overlapping, TES (defined
as annotated transcriptional end site (TES) to TES+20kb), and TES overlapping (‘‘TES-RT’’).
Reads falling into introns were normalized by the intron length and ‘‘spliced’’ reads were
normalized for the number of exons per gene. For each gene and region analyzed, the mean
from three replicates was calculated. To determine the significance of drug treatment on
splicing efficiency, for each condition all biological replicates were combined, and for each
gene the fraction of spliced reads relative to total reads was calculated. Each treatment was
then compared to the DMSO control using both t-test and Wilcoxon matched-pairs signed rank
test in GraphPad Prism.

68
4 Results 4.1 Binding of Aurora-A to chromatin in S phase is MYCN-dependent Previous data showed that Aurora-A stabilizes MYCN and prevents it from proteasomal
degradation (Otto et al., 2009), the interaction of the two proteins is S phase-specific (Büchel
et al., 2017), and MYCN is able to activate Aurora-A in vitro (Richards et al., 2016). To
understand the function of the Aurora-A/MYCN complex, the localization of this complex as
well as the phosphorylation status of Aurora-A in S phase were investigated.
4.1.1 Binding of Aurora-A to chromatin changes during cell cycle To investigate the localization of Aurora-A within the cell cycle, IMR-5 cells were synchronized
using double thymidine block and released into different cell cycle phases. The efficacy of the
thymidine block was assessed by PI FACS. Since during replication the DNA content is
duplicated, G1 phase (2n), S phase (2n – 4n), and G2 or early stages of mitosis (M; 4n) can
be robustly distinguished.
Asynchronous growing cells show a distribution of cells with mainly 2n DNA content, indicating
that most cells are in G1 phase. Upon synchronization with thymidine (T0) cells are blocked at
the border between G1 and S phase leading to an increase in cells with 2n content. Timepoints
4 h, 8 h, and 14 h after release (T4, T8, and T14, respectively) were carefully chosen to obtain
a large fraction of cells in either S, G2/M, and G1 phase, which is also reflected in PI FACS
analysis (Figure 4.1 a).
Synchronized cells were fractionated in cytoplasmic, nucleoplasmic, and chromatin-bound
fraction [Figure 4.1 b (left)]. Vinculin was used as a cytoplasmic marker, whereas histone 2 B
(H2B) and TOP2A were used as markers for chromatin-bound proteins. MYCN is mainly bound
to chromatin. Additionally, Aurora-A levels were investigated, showing that total Aurora-A level
increase throughout the cell cycle, with least Aurora-A in G1 phase and most in G2/M phase.
Besides this, the percentage of cytoplasmic, nucleoplasmic, and chromatin-bound Aurora-A
within a cell cycle phase was calculated [Figure 4.1 b (right)]. In G1 phase roughly 50% of
Aurora-A is cytoplasmic, whereas in S phase most Aurora-A is bound to chromatin. The
fraction of Aurora-A bound to chromatin is lower in G2/M and more Aurora-A is cytoplasmic
compared to S phase. This observation also reflects the amount of Aurora-A shown in the
immunoblot. Since TPX2 is the best characterized partner protein for Aurora-A and is known
to recruit Aurora-A to chromatin in mitosis (Kufer et al., 2002), the amount of TPX2 throughout
the cell cycle was analyzed. TPX2 is completely absent in G1 phase and in S phase there is
only a faint band visible. TPX2 level increases in the chromatin-bound fraction in G2/M phase.
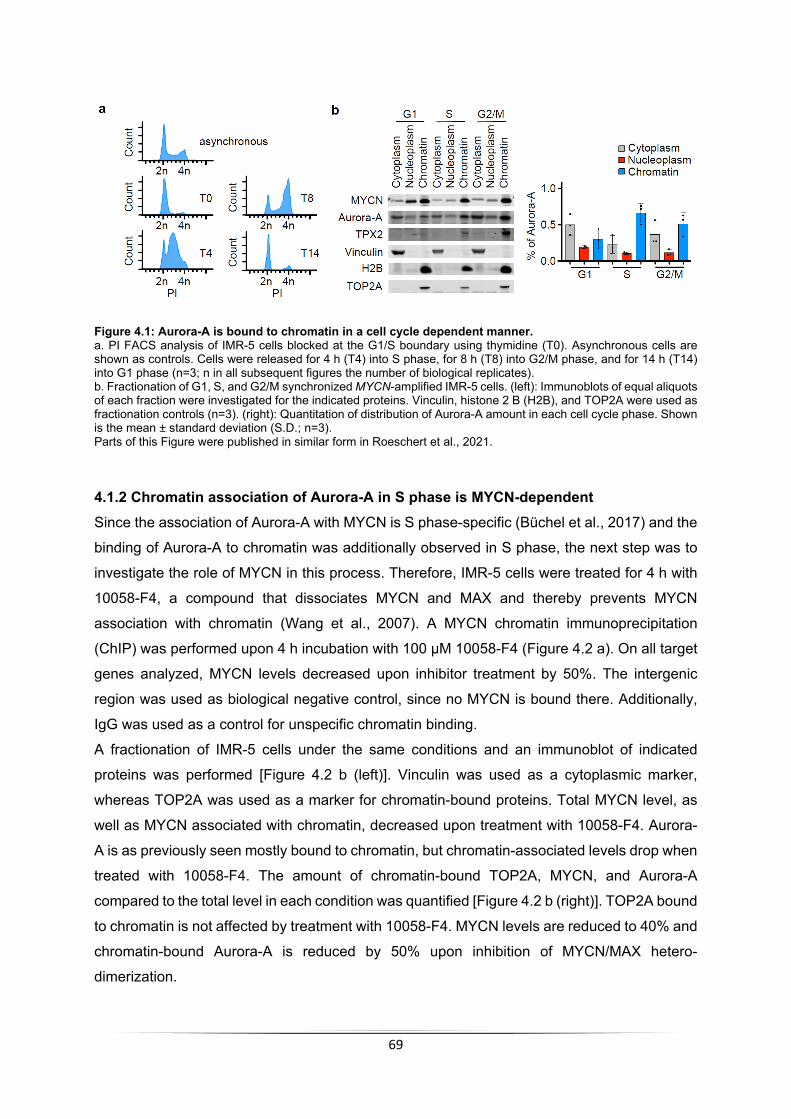
69
Figure 4.1: Aurora-A is bound to chromatin in a cell cycle dependent manner. a. PI FACS analysis of IMR-5 cells blocked at the G1/S boundary using thymidine (T0). Asynchronous cells are shown as controls. Cells were released for 4 h (T4) into S phase, for 8 h (T8) into G2/M phase, and for 14 h (T14) into G1 phase (n=3; n in all subsequent figures the number of biological replicates). b. Fractionation of G1, S, and G2/M synchronized MYCN-amplified IMR-5 cells. (left): Immunoblots of equal aliquots of each fraction were investigated for the indicated proteins. Vinculin, histone 2 B (H2B), and TOP2A were used as fractionation controls (n=3). (right): Quantitation of distribution of Aurora-A amount in each cell cycle phase. Shown is the mean ± standard deviation (S.D.; n=3). Parts of this Figure were published in similar form in Roeschert et al., 2021.
4.1.2 Chromatin association of Aurora-A in S phase is MYCN-dependent Since the association of Aurora-A with MYCN is S phase-specific (Büchel et al., 2017) and the
binding of Aurora-A to chromatin was additionally observed in S phase, the next step was to
investigate the role of MYCN in this process. Therefore, IMR-5 cells were treated for 4 h with
10058-F4, a compound that dissociates MYCN and MAX and thereby prevents MYCN
association with chromatin (Wang et al., 2007). A MYCN chromatin immunoprecipitation
(ChIP) was performed upon 4 h incubation with 100 µM 10058-F4 (Figure 4.2 a). On all target
genes analyzed, MYCN levels decreased upon inhibitor treatment by 50%. The intergenic
region was used as biological negative control, since no MYCN is bound there. Additionally,
IgG was used as a control for unspecific chromatin binding.
A fractionation of IMR-5 cells under the same conditions and an immunoblot of indicated
proteins was performed [Figure 4.2 b (left)]. Vinculin was used as a cytoplasmic marker,
whereas TOP2A was used as a marker for chromatin-bound proteins. Total MYCN level, as
well as MYCN associated with chromatin, decreased upon treatment with 10058-F4. Aurora-
A is as previously seen mostly bound to chromatin, but chromatin-associated levels drop when
treated with 10058-F4. The amount of chromatin-bound TOP2A, MYCN, and Aurora-A
compared to the total level in each condition was quantified [Figure 4.2 b (right)]. TOP2A bound
to chromatin is not affected by treatment with 10058-F4. MYCN levels are reduced to 40% and
chromatin-bound Aurora-A is reduced by 50% upon inhibition of MYCN/MAX hetero-
dimerization.

70
Figure 4.2: Aurora-A association with chromatin is MYCN-dependent. a. MYCN ChIP at indicated loci treated for 4 h with 100 µM 10058-F4 in asynchronous IMR-5 cells. IgG was used as control for antibody specificity. Error bars indicate S.D. of technical triplicates from a representative experiment (n=3). b. Fractionation of IMR-5 cells synchronized in S phase and treated for 4 h with 100 µM 10058-F4. (left): Immunoblots of indicated proteins. Vinculin and TOP2A were used as fractionation controls (n=3). (right): Quantitation of relative levels of chromatin-bound proteins. Shown is the mean ± S.D., p-values were calculated using paired two-tailed t-test relative to DMSO (n=3). Parts of this Figure were published in similar form in Roeschert et al., 2021.
4.1.3 Aurora-A is unphosphorylated in S phase The phosphorylation status of Aurora-A on T288, usually associated with the activation of its
kinase activity, was next assessed in different cell cycle phases. Cells were synchronized using
double thymidine block as described before, adding one sample that was treated with
nocodazole to enrich for mitotic cells. Synchronization efficiency was analyzed using PI FACS
(Figure 4.3 a).
Cells were harvested in different cell cycle phases and phosphorylation of Aurora-A on T288
was determined by immunoblotting (Figure 4.3 b). S10 phosphorylated of histone H3
(pH3S10), a marker for cells in mitosis (Goto et al., 1999), drastically increased in cells treated
with nocodazole, which is in line with the robust enrichment in G2/M phase shown by the PI
FACS profile. Total Aurora-A levels increase throughout the cell cycle phases analyzed,
phosphorylation of T288 on Aurora-A changes during cell cycle. In S phase this
phosphorylation could not be detected. This phosphorylation mark is increasing in G2 phase
and peaks in mitosis.

71
Figure 4.3: Aurora-A is unphosphorylated in S phase. a. PI FACS analysis of IMR-5 cells. Asynchronous cells as well as cells synchronized using double thymidine block and released for 4 h into S phase, for 8 h into G2/M phase, or using nocodazole in mitosis were assessed (n=2). b. Immunoblots of indicated proteins from RIPA lysates of asynchronous or synchronized IMR-5 cells in indicated cell cycle phase. Vinculin was used as loading control (n=2). Parts of this Figure were published in similar form in Roeschert et al., 2021.
Collectively, the results illustrate that Aurora-A is mainly localized to chromatin in S phase and
this association is stabilized by MYCN. Additionally, it could be shown that Aurora-A is not
phosphorylated on T288 in S phase which is usually considered as a sign for the activity of the
kinase.
72
4.2 Identification of MYCN-dependent Aurora-A substrates in S phase
Previous work showed that MYCN can lead to an activation of Aurora-A (Richards et al., 2016).
Considering that the interaction between the two proteins takes place in S phase and that no
Aurora-A S phase-specific substrates have been identified so far, an unbiased
phosphoproteomic analysis was performed using two Aurora-A inhibitors in S phase-
synchronized cells. Additionally, the phosphoproteomic analysis was also performed upon
dissociation of MYCN from chromatin in S phase to identify MYCN-dependent substrates.
Finally, the role of pH3S10, already described as Aurora-A substrate, in S phase was further
investigated.
4.2.1 Identification of Aurora-A substrates in S phase To identify substrates of Aurora-A in S phase, the chromatin-bound fraction of IMR-5 cells
synchronized in S phase, treated with different Aurora-A inhibitors were analyzed by mass-
spectrometry (MS). Proteomic and phosphoproteomic analysis was performed to analyze
changes on protein level or phosphorylation status upon inhibition of Aurora-A in S phase.
Therefore, IMR-5 cells were synchronized using double thymidine block. At the timepoint of
release, cells were treated with 1 µM MLN8237, 1 µM MK5108, or DMSO as control. MK5108
is a pure catalytic inhibitor of Aurora-A, whereas MLN8237 is partially disrupting the
conformation and additionally inhibiting the catalytic activity (further explained in 1.4.6). After
4 h, when most IMR-5 cells reached S phase, cells were harvested and fractionated. Equal
amount of each fraction was loaded on a Bis-Tris gel and immunoblotting was performed
(Figure 4.4 a). Tubulin alpha chain (Tubulin), TFIIIC2, and topoisomerase II a (TOP2A) were
used as fractionation controls. Tubulin is mainly present in the cytoplasm, TFIIIC2 is present
in all fractions, and TOP2A is mainly bound to chromatin in all samples. Aurora-A is present in
the nucleoplasm and fractions of proteins bound to chromatin, whereas MYCN can be found
in all fractions, but mainly in cytoplasm and chromatin-bound. Interestingly, inhibition of Aurora-
A does not influence neither the level nor the localization of these proteins.
Proteomic analysis of chromatin-bound samples revealed 3193 proteins found at least in two
out of three replicates in all conditions (Figure 4.4 b). The volcano plot shows the mean of log2
fold change (FC) of the three replicates treated with MLN8237 and the three replicates treated
with MK5108 both compared to DMSO stratified to the p-value. On the left side, all proteins
are displayed which are less abundant bound to chromatin upon treatment. The majority of
proteins do not change abundance significantly. Proteins considered as hits were chosen by
log2 FC, p-value < 0.05, and found in at least two out of three replicates of each condition. Less
abundant proteins were defined as having a log2 FC < -2.0, whereas more abundant proteins
had a log2 FC >2.0.

73
The Venn diagrams summarize all hits of proteins found less (Figure 4.4 c) or more (Figure
4.4 d) abundant upon Aurora-A inhibition.
Figure 4.4: Proteomics upon Aurora-A inhibition using two different inhibitors. a. Immunoblot of S phase-synchronized IMR-5 cells treated for 4 h with 1 µM MLN8237, 1 µM MK5108, or DMSO as control. After harvesting, cells were fractionated, and equal amounts of fractions were loaded to Bis-Tris gel. Immunoblot was performed and indicated proteins were analyzed. Tubulin, TFIIIC2, and TOP2A were used as loading controls (n=3). b. Volcano plot showing the mean of all proteins found in at least two out of three replicates for each condition. Samples were treated as described in (a). p-value and log2 fold change (FC) was calculated between DMSO-treated and MLN8237- or MK5108-treated samples. Mean of p-value and mean log2 FC was calculated by the mean of both individual values. Blue dots represent all proteins, which show a p-value < 0.05 with both inhibitors, all other proteins are shown as grey dots. The black line represents p-value of 0.05 (n=3). c. Venn diagram depicting the overlap between proteins less abundant on chromatin upon treatment with MLN8237 and MK5108. Proteins were chosen, when found in at least two out of three replicates for all conditions, p-value < 0.05, and log2 FC compared to DMSO < -2.0. d. Venn diagram depicting the overlap between proteins more abundant on chromatin upon treatment with MLN8237 and MK5108. Proteins were chosen, when found in at least two out of three replicates for all conditions, p-value < 0.05, and log2 FC compared to DMSO > 2.0. Treatment with MLN8237 revealed 11 proteins whereas treatment with MK5108 resulted in
16 proteins significantly less abundant bound to chromatin. Two proteins were found to be less
abundant with both inhibitors and are therefore marked in blue on the left side of the volcano
plot (Figure 4.4 b).

74
On the right side of the volcano plot (Figure 4.4 b) proteins are shown in blue, which are found
to be significantly more abundant when Aurora-A is inhibited on chromatin. 39 proteins were
found more abundant bound to chromatin upon MLN8237-treatment, 41 proteins were found
more abundant bound to chromatin upon MK5108-treatment, with an overlap of 15 proteins.
Additionally, phosphoproteomic analysis of chromatin-bound proteins in S phase-synchronized
IMR-5 cells treated for 4 h with MLN8237 (Figure 4.5 a) or MK5108 (Figure 4.5 b) were
performed. Phosphosites were filtered, according to the localization probability of the identified
phosphosite. Phosphosites with localization probabilities > 0.75 were considered. Shown is
the mean of all phosphosites, found in at least two out of three replicates. Within the volcano
plot the x-axis displays the log2 FC of MLN8237 compared to DMSO ranging from -1.0 to 1.0.
All sites in the negative range of the fold change are less phosphorylated when Aurora-A is
inhibited, representing putative targets. Grey dots represent phosphosites (p-value > 0.15)
displaying a non-statistically significant change in MLN8237- and MK5108-treated samples
compared to DMSO. Blue dots depicted instead statistically significant changes (p-value <
0.15) with both inhibitors compared to DMSO.
Figure 4.5 c shows the comparison between the phosphoproteomics using MLN8237 and
MK5108. Each dot represents one phosphosite found in both analysis in at least two out of
three replicates. The color of the dot indicates the amino acid which got phosphorylated (blue:
serine, green: threonine, red: tyrosine). The black line depicts the diagonal, where all
phosphosites are found regulated by both inhibitors similarly. Except for a few outlier
phosphosites, the majority of all phosphosites are in proximity to this line, suggesting that both
inhibitors regulate phosphorylation of a similar sets of phosphosites.
To identify putative Aurora-A targets, the phosphosites which were less phosphorylated using
both Aurora-A inhibitors were compared (Figure 4.5 d). The cut-off for less phosphorylated
was arbitrarily set to log2 FC < -0.2 with both inhibitors. 205 phosphosites were less
phosphorylated (p-value < 0.15) when treated with MLN8237 and 196 phosphosites showed
less phosphorylation (p-value < 0.15) upon treatment with MK5108. The two inhibitors share
73 phosphosites showing less phosphorylation (Figure 4.5 d). Table 7.1 summarizes important
information about the 73 phosphosites, which were found on 60 different proteins.

75
Figure 4.5: Phosphoproteomics upon Aurora-A inhibition. a. Volcano plot showing the mean of all phosphosites found at least in two out of three replicates for each condition. Phosphosites were investigated from chromatin-bound fraction of S phase-synchronized IMR-5 cells, treated for 4 h with 1 µM MLN8237 and DMSO as control. Log2 FC was calculated between DMSO- and MLN8237-treated samples. Blue dots represent all phosphosites, which show a p-value < 0.15 in samples treated with MLN8237 and in samples treated with MK5108, all other phosphosites are shown in grey (n=3). b. Volcano plot similar to (a) of cells treated with 1 µM MK5108 (n=3). c. Dot plot showing the comparison between the phosphoproteomic analysis of MLN8237- and MK5108-treated samples. Blue, green, and red dots represent phosphorylation on serine, threonine, and tyrosine, respectively. The black line represents the diagonal. d. Venn diagram depicting the overlap between the phosphosites less phosphorylated upon treatment with MLN8237 and MK5108. Phosphosites were chosen, when found in at least two out of three replicates for each condition, p-value < 0.15, and log2 FC compared to DMSO < -0.15.
To characterize the pathways in which the 60 putative Aurora-A substrates are involved, a GO
Term analysis using DAVID was performed (Figure 4.6 a). The web-based program
investigates the enrichment of the potential substrates over all proteins identified as chromatin-
bound in the proteomic analysis. Seven GO Terms were significantly (p < 0.06) enriched for
putative Aurora-A substrates. Four GO Terms are related to mRNA processing or splicing (#1,
#2, #3, and #5), two GO Terms to chromatin organization (#4 and #6), and one GO Term to

76
transcription (#7). Indicating that splicing, chromatin organization, and transcription might be
impacted by Aurora-A in S phase.
Figure 4.6 b shows to which significant enriched GO Term the putative Aurora-A substrates
belong. 32 of the 60 proteins phosphorylated depending on Aurora-A activity in S phase can
be found in one or more of the seven significantly enriched GO Terms. All other proteins were
not annotated or the GO Term to which they belong was not significantly enriched. 20 of the
32 proteins are found in GO Term #7 (regulation of transcription). Some proteins like RBM15B
or DDX20 are found in five out of seven GO Terms, whereas others like ATAD2 or ATRX are
just found in one GO Term.
Figure 4.6: Aurora-A substrates in S phase show a strong connection to splicing, chromatin organization, and transcription. a. Significant GO Terms analyzed by DAVID. 73 phosphosites which are less phosphorylated upon Aurora-A inhibition, were investigated compared to the whole proteome found chromatin-bound in all replicates. GO Terms with Benjamini < 0.06 are shown. b. Proteins having a phosphosite less phosphorylated upon Aurora-A inhibition which are found in one of the 7 GO Terms from (a). Gene names as well as in which GO Term they were found is depicted. Parts of this Figure were published in similar form in Roeschert et al., 2021.
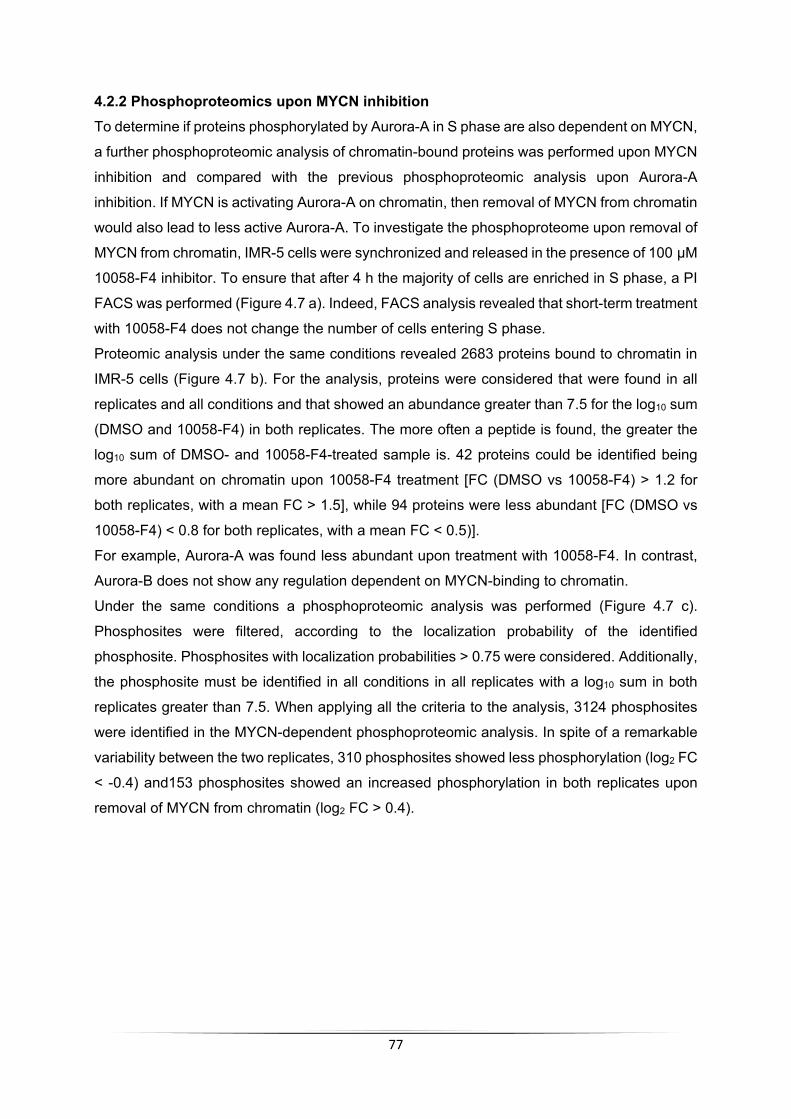
77
4.2.2 Phosphoproteomics upon MYCN inhibition To determine if proteins phosphorylated by Aurora-A in S phase are also dependent on MYCN,
a further phosphoproteomic analysis of chromatin-bound proteins was performed upon MYCN
inhibition and compared with the previous phosphoproteomic analysis upon Aurora-A
inhibition. If MYCN is activating Aurora-A on chromatin, then removal of MYCN from chromatin
would also lead to less active Aurora-A. To investigate the phosphoproteome upon removal of
MYCN from chromatin, IMR-5 cells were synchronized and released in the presence of 100 µM
10058-F4 inhibitor. To ensure that after 4 h the majority of cells are enriched in S phase, a PI
FACS was performed (Figure 4.7 a). Indeed, FACS analysis revealed that short-term treatment
with 10058-F4 does not change the number of cells entering S phase.
Proteomic analysis under the same conditions revealed 2683 proteins bound to chromatin in
IMR-5 cells (Figure 4.7 b). For the analysis, proteins were considered that were found in all
replicates and all conditions and that showed an abundance greater than 7.5 for the log10 sum
(DMSO and 10058-F4) in both replicates. The more often a peptide is found, the greater the
log10 sum of DMSO- and 10058-F4-treated sample is. 42 proteins could be identified being
more abundant on chromatin upon 10058-F4 treatment [FC (DMSO vs 10058-F4) > 1.2 for
both replicates, with a mean FC > 1.5], while 94 proteins were less abundant [FC (DMSO vs
10058-F4) < 0.8 for both replicates, with a mean FC < 0.5)].
For example, Aurora-A was found less abundant upon treatment with 10058-F4. In contrast,
Aurora-B does not show any regulation dependent on MYCN-binding to chromatin.
Under the same conditions a phosphoproteomic analysis was performed (Figure 4.7 c).
Phosphosites were filtered, according to the localization probability of the identified
phosphosite. Phosphosites with localization probabilities > 0.75 were considered. Additionally,
the phosphosite must be identified in all conditions in all replicates with a log10 sum in both
replicates greater than 7.5. When applying all the criteria to the analysis, 3124 phosphosites
were identified in the MYCN-dependent phosphoproteomic analysis. In spite of a remarkable
variability between the two replicates, 310 phosphosites showed less phosphorylation (log2 FC
< -0.4) and153 phosphosites showed an increased phosphorylation in both replicates upon
removal of MYCN from chromatin (log2 FC > 0.4).

78
Figure 4.7: Proteomic and phosphoproteomics upon removal of MYCN from chromatin. a. PI FACS analysis of IMR-5 cells. Asynchronous cells are shown as controls. IMR-5 cells were synchronized at the G1/S boundary by a double thymidine block (T0) and released from the block for 4 h in S phase while treatment with 100 µM 10058-F4 or DMSO as control (n=3). b. Volcano plot showing proteomic analysis of S phase-synchronized chromatin-bound proteins upon treatment for 4 h with 100 µM 10058-F4. IMR-5 cells were synchronized using double thymidine block and upon release treated for 4 h with 100 µM 10058-F4. The samples were fractionated, and chromatin-bound fraction was assessed for proteomic analysis. The volcano plot displays the mean log2 FC (10058-F4 compared to DMSO) of both replicates and the mean log10 sum of 10058-F4 and DMSO for two replicates. The proteins which were shown are found in all replicates. One grey dot represents one protein, colored dots are Aurora-A (light red) and Aurora-B (dark red;n=2). c. Dot plot of phosphoproteomic analysis of S phase-synchronized chromatin-bound proteins upon treatment for 4 h with 100 µM 10058-F4. IMR-5 cells were synchronized using double thymidine block and upon release treated for 4 h with 100 µM 10058-F4. The samples were fractionated, and chromatin-bound fraction was assessed for phosphoproteomic analysis. The plot shows the comparison between log2 FC of 10058-F4 with DMSO from one replicate (rep1) compared to the other replicate (rep2). Each dot represents one phosphosite, the color indicates which phosphosite is phosphorylated. Serine, threonine, and tyrosine are shown in blue, green, and red, respectively (n=2).
To investigate MYCN-dependent Aurora-A substrates, an overlap of phosphosites between
Aurora-A inhibition and removal of MYCN from chromatin was performed (Figure 4.8 a). 310
phosphosites were found less phosphorylated when samples were treated with 10058-F4
(Figure 4.7). 73 phosphosites were found less phosphorylated upon treatment with both
Aurora-A inhibitors (Figure 4.5, Table 7.1). 8 phosphosites were found to be less
phosphorylated in all conditions.
Figure 4.8 b summarizes the common hits. Within the sequence the bold amino acid (AA) is
the phosphorylated site. Since the consensus sequence for Aurora-A substrates in mitosis is
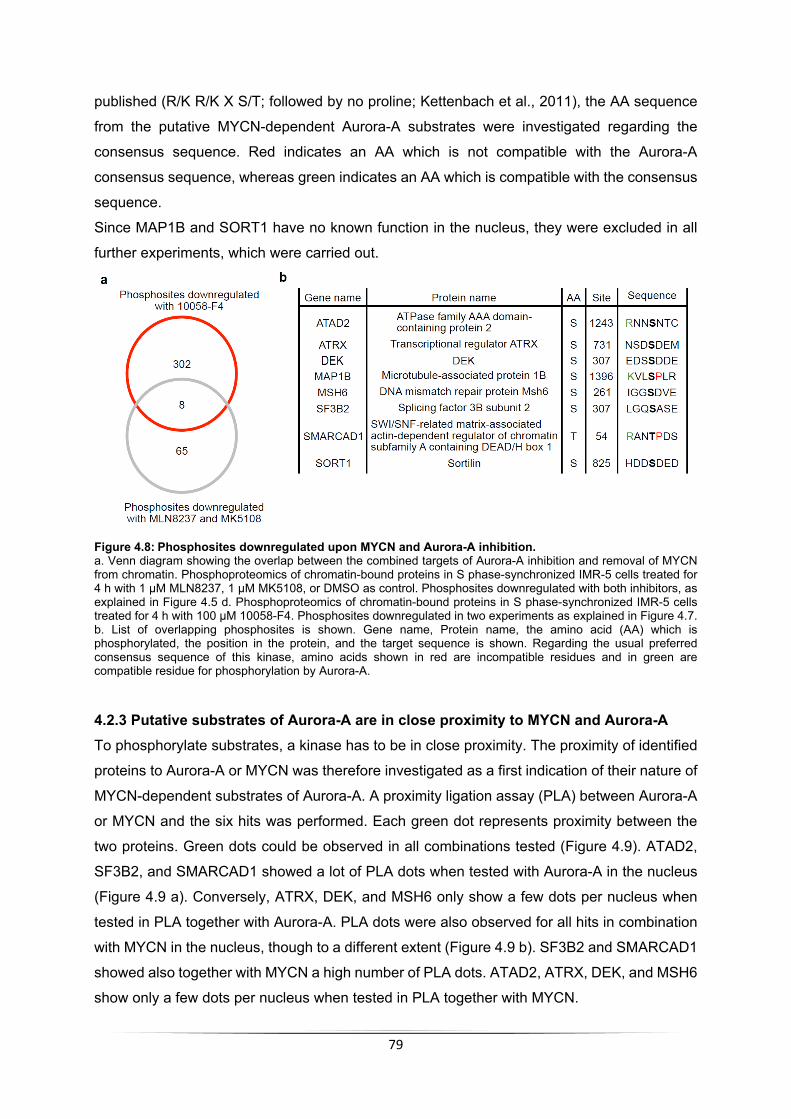
79
published (R/K R/K X S/T; followed by no proline; Kettenbach et al., 2011), the AA sequence
from the putative MYCN-dependent Aurora-A substrates were investigated regarding the
consensus sequence. Red indicates an AA which is not compatible with the Aurora-A
consensus sequence, whereas green indicates an AA which is compatible with the consensus
sequence.
Since MAP1B and SORT1 have no known function in the nucleus, they were excluded in all
further experiments, which were carried out.
Figure 4.8: Phosphosites downregulated upon MYCN and Aurora-A inhibition. a. Venn diagram showing the overlap between the combined targets of Aurora-A inhibition and removal of MYCN from chromatin. Phosphoproteomics of chromatin-bound proteins in S phase-synchronized IMR-5 cells treated for 4 h with 1 µM MLN8237, 1 µM MK5108, or DMSO as control. Phosphosites downregulated with both inhibitors, as explained in Figure 4.5 d. Phosphoproteomics of chromatin-bound proteins in S phase-synchronized IMR-5 cells treated for 4 h with 100 µM 10058-F4. Phosphosites downregulated in two experiments as explained in Figure 4.7. b. List of overlapping phosphosites is shown. Gene name, Protein name, the amino acid (AA) which is phosphorylated, the position in the protein, and the target sequence is shown. Regarding the usual preferred consensus sequence of this kinase, amino acids shown in red are incompatible residues and in green are compatible residue for phosphorylation by Aurora-A.
4.2.3 Putative substrates of Aurora-A are in close proximity to MYCN and Aurora-A To phosphorylate substrates, a kinase has to be in close proximity. The proximity of identified
proteins to Aurora-A or MYCN was therefore investigated as a first indication of their nature of
MYCN-dependent substrates of Aurora-A. A proximity ligation assay (PLA) between Aurora-A
or MYCN and the six hits was performed. Each green dot represents proximity between the
two proteins. Green dots could be observed in all combinations tested (Figure 4.9). ATAD2,
SF3B2, and SMARCAD1 showed a lot of PLA dots when tested with Aurora-A in the nucleus
(Figure 4.9 a). Conversely, ATRX, DEK, and MSH6 only show a few dots per nucleus when
tested in PLA together with Aurora-A. PLA dots were also observed for all hits in combination
with MYCN in the nucleus, though to a different extent (Figure 4.9 b). SF3B2 and SMARCAD1
showed also together with MYCN a high number of PLA dots. ATAD2, ATRX, DEK, and MSH6
show only a few dots per nucleus when tested in PLA together with MYCN.

80
Figure 4.9: Aurora-A and MYCN are in proximity to putative substrates in IMR-5 cells. a. Pictures of PLA performed with Aurora-A in combination with ATAD2, ATRX, DEK, MSH6, SF3B2, and SMARCAD1. Untreated IMR-5 cells were fixed, PLA was performed, and pictures were analyzed using the SP2 Leica microscope. Representative pictures are shown (n=3). b. Pictures of PLA performed with MYCN in combination with ATAD2, ATRX, DEK, MSH6, SF3B2, and SMARCAD1. Untreated IMR-5 cells were fixed, PLA was performed, and pictures were analyzed using the SP2 Leica microscope. Representative pictures are shown (n=3). 4.2.4 Aurora-A phosphorylates histone 3 in S phase One published target for Aurora kinases in mitosis is pH3S10 (Crosio et al., 2002). Since
histone tails are not covered by phosphoproteomic analysis upon tryptic digestion, none of
those modifications were found in the phosphoproteomic analysis (Figure 4.5). Thus, H3S10
phosphorylation was further investigated using immunofluorescence. To distinguish S phase
cells, EdU – which is incorporated into duplicating DNA and therefore specific for S phase cells
-was added to IMR-5 cells 30 min prior fixation. Cells were stained with pH3S10 and nuclei
were counterstained with Hoechst (Figure 4.10 a). EdU incorporation shows that all cells are
in different stages of S phase. Interestingly, pH3S10 staining in S phase appears spot-like.
The picture suggests that the number of spots increases during S phase. In the merge picture
one can see, that pH3S10 spots are not close to areas of EdU incorporation, indicating that
those are two distinct events.
To evaluate the influence of Aurora-A on pH3S10, IMR-5 cells were treated with 100 nM
MLN8237 for 8 h or DMSO as a control. To gain information about pH3S10 throughout the cell
cycle, cells were incubated with EdU 30 min before harvesting, later stained for cyclin B1, and
finally counterstained with Hoechst (Figure 4.10 b). G1 phase cells display negative staining
for EdU (red staining) and cyclin B1 (orange staining). S phase cells are EdU-positive. G2
phase cells display cytoplasmic cyclin B1. Mitotic cells display nuclear cyclin B1 (Heald et al.,

81
1993). Different mitotic phases were differentiated by Hoechst staining. Example pictures for
each cell cycle phase are shown in Figure 4.10 b (top panel).
While G1 phase cells show no staining for pH3S10 (green staining), S phase cells show
pH3S10 spots, as already seen in Figure 4.10 a. Upon treatment with Aurora-A inhibitor
pH3S10 spots disappear. As S phase cells, G2 phase cells show pH3S10 spots which
decrease upon inhibition of Aurora-A. Cells in Pro-, Meta-, and Anaphase show a strong
pH3S10 staining without indication of a spot-like structure. The quantitation of pH3S10 in
different cell cycle phases is shown in Figure 4.10 b (lower panel).
In S and G2 phase, spots were counted using the Harmony® High-Content Analysis software.
pH3S10 spots disappear in S phase upon inhibition with Aurora-A. Also, G2 phase cells show
a reduction in pH3S10 spots, albeit the effect is not as strong as in S phase. Since mitotic cells
show a staining of pH3S10 throughout the nucleus and no dots, the pH3S10 intensity was
used as measure to calculate differences. Inhibition of Aurora-A did not change the intensity
of the pH3S10 staining in any mitotic cell cycle phase.
Low doses of MLN8237 inhibit the catalytic functions of Aurora-A, whereas increasing amounts
disrupts the Aurora-A/MYCN complex formation, leading to a degradation of MYCN (Otto et
al., 2009). To further investigate whether the kinase activity alone is required for H3S10
phosphorylation or the Aurora-A/MYCN complex has any impact on pH3S10 staining the same
experiment was performed using 1 µM MLN8237 (Figure 4.10 c). The quantitation shows
pH3S10 spots in S and G2 phase and pH3S10 intensity in mitotic cell cycle phases. The
pH3S10 spots are reduced upon Aurora-A inhibition in S and G2 phase, whereas intensity of
pH3S10 does not change in any mitotic cell phase, mirroring the treatment with 100 nM
MLN8237 (Figure 4.10 b).
Additionally, IMR-5 cells were treated with the catalytic Aurora-A inhibitor MK5108 (1 µM).
Figure 4.10 d shows the quantitation of pH3S10 spots in S phase comparing inhibition with
MK5108 (1 µM) and MLN8237 (100 nM). Inhibition of Aurora-A with MK5108 also reduces the
amount of pH3S10 spots, albeit much weaker than inhibition with MLN8237.
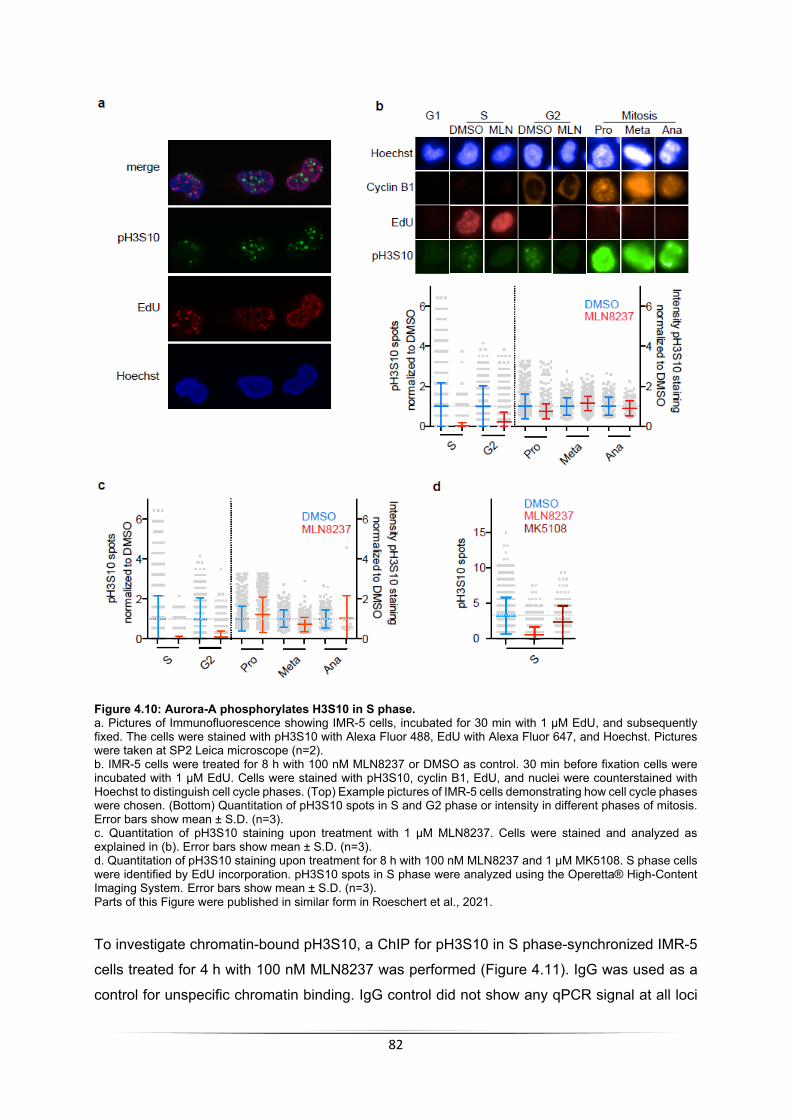
82
Figure 4.10: Aurora-A phosphorylates H3S10 in S phase. a. Pictures of Immunofluorescence showing IMR-5 cells, incubated for 30 min with 1 µM EdU, and subsequently fixed. The cells were stained with pH3S10 with Alexa Fluor 488, EdU with Alexa Fluor 647, and Hoechst. Pictures were taken at SP2 Leica microscope (n=2). b. IMR-5 cells were treated for 8 h with 100 nM MLN8237 or DMSO as control. 30 min before fixation cells were incubated with 1 µM EdU. Cells were stained with pH3S10, cyclin B1, EdU, and nuclei were counterstained with Hoechst to distinguish cell cycle phases. (Top) Example pictures of IMR-5 cells demonstrating how cell cycle phases were chosen. (Bottom) Quantitation of pH3S10 spots in S and G2 phase or intensity in different phases of mitosis. Error bars show mean ± S.D. (n=3). c. Quantitation of pH3S10 staining upon treatment with 1 µM MLN8237. Cells were stained and analyzed as explained in (b). Error bars show mean ± S.D. (n=3). d. Quantitation of pH3S10 staining upon treatment for 8 h with 100 nM MLN8237 and 1 µM MK5108. S phase cells were identified by EdU incorporation. pH3S10 spots in S phase were analyzed using the Operetta® High-Content Imaging System. Error bars show mean ± S.D. (n=3). Parts of this Figure were published in similar form in Roeschert et al., 2021.
To investigate chromatin-bound pH3S10, a ChIP for pH3S10 in S phase-synchronized IMR-5
cells treated for 4 h with 100 nM MLN8237 was performed (Figure 4.11). IgG was used as a
control for unspecific chromatin binding. IgG control did not show any qPCR signal at all loci

83
tested. DMSO-treated cells show an increase in pH3S10 signal on promoters as well as in the
intergenic and centrosomal region. When Aurora-A is inhibited the pH3S10 signal is drastically
decreased on all loci tested.
Figure 4.11: Aurora-A phosphorylates H3S10 on chromatin in S phase. ChIP of pH3S10 from S phase-synchronized IMR-5 cells treated for 4 h with 1 µM MLN8237 or DMSO as control at indicated loci. IgG was used as negative control. Error bars indicate S.D. of technical triplicates from a representative experiment (n=3). This Figure was published in similar form in Roeschert et al., 2021. To genetically investigate the relationship between Aurora-A and pH3S10, we used IMR-5 cells
expressing a doxycycline-inducible construct harboring either Aurora-A WT or Aurora-A T217D
mutant. The empty vector (EV) was used as a control. The T217D mutant is resistant to
MLN8237-treatment (Brockmann et al., 2013). Upon 24 h of Aurora-A expression, cells were
treated for 8 h with 100 nM MLN8237. EdU was incorporated for 30 min and cells were stained
with pH3S10, EdU, cyclin B1, and Hoechst. Example pictures are shown in Figure 4.12 a. The
spot-like structure of S phase cells is not visible anymore upon treatment with MLN8237. When
Aurora-A WT is overexpressed, the intensity of the pH3S10 signal is increased but is still
completely abolished upon treatment with MLN8237. Overexpression of Aurora-A T217D
results in an increased pH3S10 signal, which results in a pan-staining all over the nucleus
compared to IMR-5 cells expressing EV. The signal is reduced but still strongly present upon
MLN8237-treatment.
The quantitation of EdU-positive S phase cells is depicted in Figure 4.12 b, reflecting the
observation in the example pictures. The intensity of pH3S10 signal increases when Aurora-A
is overexpressed and further increases upon expression of Aurora-A T217D. Upon challenging
the cells with MLN8237, the cells expressing Aurora-A WT reduce the pH3S10 intensity to
levels seen with IMR-5 EV. Aurora-A T217D cells, show a reduction in pH3S10 intensity, albeit
the intensity is still stronger than seen with overexpression of Aurora-A WT.
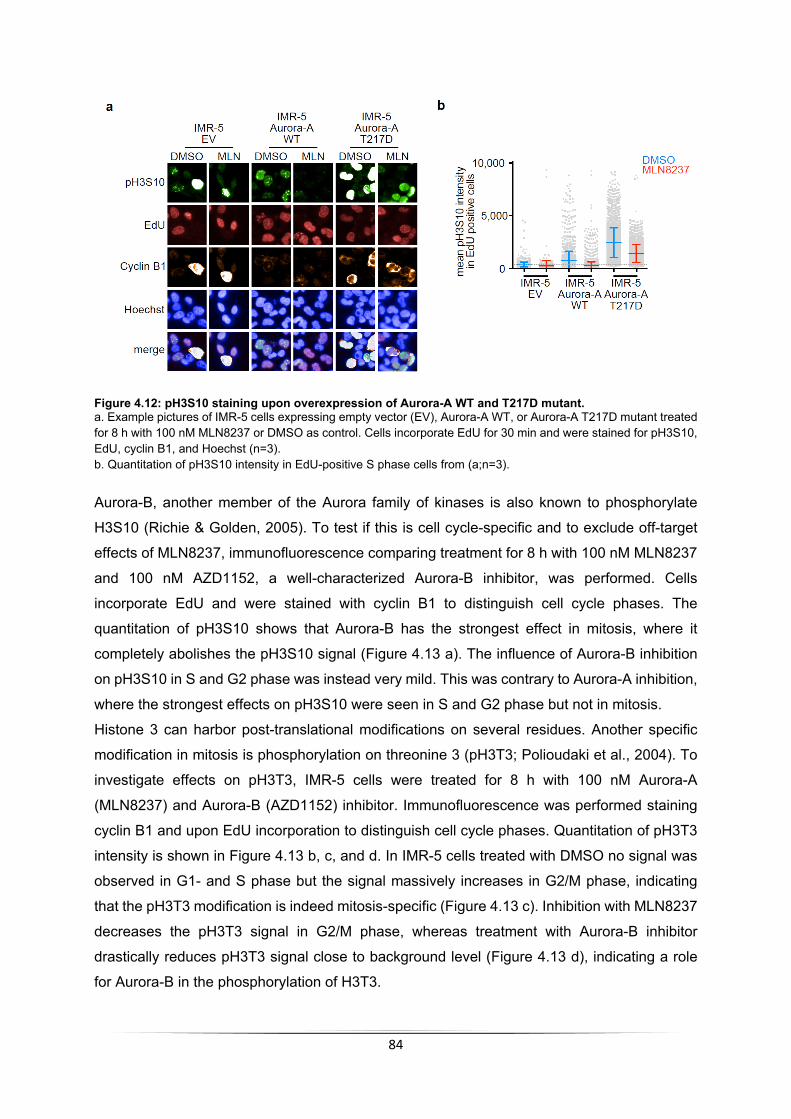
84
Figure 4.12: pH3S10 staining upon overexpression of Aurora-A WT and T217D mutant. a. Example pictures of IMR-5 cells expressing empty vector (EV), Aurora-A WT, or Aurora-A T217D mutant treated for 8 h with 100 nM MLN8237 or DMSO as control. Cells incorporate EdU for 30 min and were stained for pH3S10, EdU, cyclin B1, and Hoechst (n=3). b. Quantitation of pH3S10 intensity in EdU-positive S phase cells from (a;n=3). Aurora-B, another member of the Aurora family of kinases is also known to phosphorylate
H3S10 (Richie & Golden, 2005). To test if this is cell cycle-specific and to exclude off-target
effects of MLN8237, immunofluorescence comparing treatment for 8 h with 100 nM MLN8237
and 100 nM AZD1152, a well-characterized Aurora-B inhibitor, was performed. Cells
incorporate EdU and were stained with cyclin B1 to distinguish cell cycle phases. The
quantitation of pH3S10 shows that Aurora-B has the strongest effect in mitosis, where it
completely abolishes the pH3S10 signal (Figure 4.13 a). The influence of Aurora-B inhibition
on pH3S10 in S and G2 phase was instead very mild. This was contrary to Aurora-A inhibition,
where the strongest effects on pH3S10 were seen in S and G2 phase but not in mitosis.
Histone 3 can harbor post-translational modifications on several residues. Another specific
modification in mitosis is phosphorylation on threonine 3 (pH3T3; Polioudaki et al., 2004). To
investigate effects on pH3T3, IMR-5 cells were treated for 8 h with 100 nM Aurora-A
(MLN8237) and Aurora-B (AZD1152) inhibitor. Immunofluorescence was performed staining
cyclin B1 and upon EdU incorporation to distinguish cell cycle phases. Quantitation of pH3T3
intensity is shown in Figure 4.13 b, c, and d. In IMR-5 cells treated with DMSO no signal was
observed in G1- and S phase but the signal massively increases in G2/M phase, indicating
that the pH3T3 modification is indeed mitosis-specific (Figure 4.13 c). Inhibition with MLN8237
decreases the pH3T3 signal in G2/M phase, whereas treatment with Aurora-B inhibitor
drastically reduces pH3T3 signal close to background level (Figure 4.13 d), indicating a role
for Aurora-B in the phosphorylation of H3T3.

85
Figure 4.13: Aurora-B does not contribute to H3S10 phosphorylation in S phase, neither is H3T3 phosphorylation affected by Aurora kinases in S phase. a. Quantitation of pH3S10 immunofluorescence staining. IMR-5 cells were treated for 8 h with 100 nM MLN8237, 100 nM AZD1152, or DMSO as control. 1 µM EdU was incorporated for 30 min before fixation. Cells were stained for pH3S10, further counterstained for cyclin B1, and EdU incorporated to distinguish cell cycle phases. pH3S10 spots were counted in S and G2 phase cells and pH3S10 intensity was calculated in mitotic cells. Values from different experiments were normalized to DMSO control. Each grey dot represents one cell. Shown is the mean ± S.D. (n=3). b. Quantitation of pH3T3 immunofluorescence staining. IMR-5 cells were treated for 8 h with 100 nM MLN8237, 100 nM AZD1152, or DMSO as control. 1 µM EdU was incorporated for 30 min before fixation. Cells were stained for cyclin B1, EdU incorporation to distinguish cell cycle phases, and pH3T3. pH3T3 intensity was analyzed using the Harmony® High-Content Analysis software, each dot represents one cell. Shown is the mean ± S.D. (n=3). c. Quantitation of pH3T3 immunofluorescence staining. IMR-5 cells were stained for cyclin B1, EdU incorporation to distinguish cell cycle phases, and pH3T3. pH3T3 intensity was analyzed using the Harmony® High-Content Analysis software, each dot represents one cell. Shown is the mean ± S.D. (n=3). d. Quantitation pf pH3T3 immunofluorescence staining. IMR-5 cells were treated for 8 h with 100 nM MLN8237, 100 nM AZD1152, or DMSO as control. G2/M phase cells were identified by cyclin B1 staining. pH3T3 intensity was analyzed using Harmony® High-Content Analysis software, each dot represents one cell. Shown is the mean ± S.D. (n=3). Parts of this Figure were published in similar form in Roeschert et al., 2021.

86
4.2.5 pH3S10 is also regulated MYCN-dependent To investigate whether pH3S10 is also regulated by MYCN in S phase, SH-EP cells were used.
SH-EP cells are neuroblastoma cells which express MYC instead of MYCN endogenously.
Upon stable expression or acute induction of MYCN, SH-EP cells switch their expression from
MYC to MYCN, as shown previously (Herold et al., 2019) and in Figure 4.14 a. Interestingly,
MYC-to-MYCN switch takes place both upon stable expression of MYCN wild type (WT) or a
MYCN T58A mutant. The MYCN mutant cannot get phosphorylated by GSK3 on this modified
residue and can thereby not be recognized by the E3 ligase SCFFBXW7, rendering MYCN
resistant to proteasomal degradation (Sjostrom et al., 2005).
To analyze pH3S10 signal in S phase, SH-EP cells expressing MYCN WT or T58A mutant
were treated for 8 h with 100 nM MLN8237 or DMSO as control. Cells were EdU-incorporated
and pH3S10-stained as described above. pH3S10 intensity was quantified using the
Harmony® High-Content Analysis software (Figure 4.14 b). pH3S10 staining intensity was
increased upon expression of MYCN WT and, to a greater extent, of MYCN T58A. Upon
inhibition of Aurora-A in all cell lines there is a decrease of pH3S10 staining in S phase.
However, the decrease is much stronger for SH-EP cells expressing MYCN WT or T58A
mutant.
Figure 4.14: MYCN levels influence pH3S10. a. Immunoblots of indicated proteins from MYC-amplified neuroblastoma cell line SH-EP with and without a plasmid that stably expresses MYCN WT or T58A mutant. Vinculin was used as a loading control (n=3). b. Quantitation of pH3S10 IF in EdU positive SH-EP cells expressing no plasmid, MYCN wild-type (WT) or MYCN T58A mutant. Cells were treated for 8 h with 100 nM MLN8237 or DMSO as control. Mean intensity of pH3S10 was quantified using the Operetta® High-Content Imaging System. Shown is the mean ± S.D. (n=3). Parts of this Figure were published in similar form in Roeschert et al., 2021.

87
Taken together, the results indicate that Aurora-A - albeit being unphosphorylated at T288 – is
active in S phase. 73 phosphosites of chromatin-bound proteins were found to be regulated by
Aurora-A. Those putative targets in S phase are involved in processes like splicing, chromatin
modification, and transcription. 8 phosphosites were found to be regulated by MYCN-activated
Aurora-A. All putative substrates tested show PLA signals with MYCN and Aurora-A.
Additionally, genetic and pharmacological interference with Aurora-A revealed that catalytic
activity of Aurora-A is required to phosphorylate H3S10 in S phase. This residue is
phosphorylated in a MYCN-dependent manner. Off-target effects regarding Aurora-B can be
ruled out and additional mitotic modifications tested (pH3T3) do not play a role in S phase.
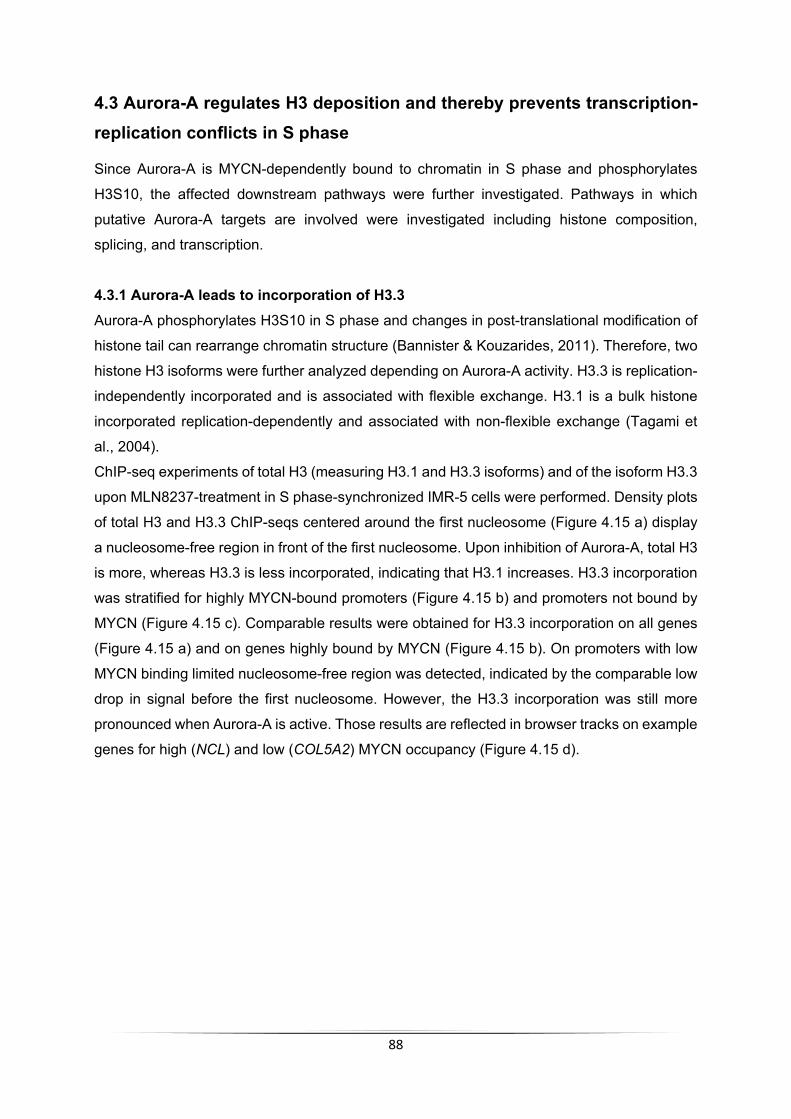
88
4.3 Aurora-A regulates H3 deposition and thereby prevents transcription-replication conflicts in S phase
Since Aurora-A is MYCN-dependently bound to chromatin in S phase and phosphorylates
H3S10, the affected downstream pathways were further investigated. Pathways in which
putative Aurora-A targets are involved were investigated including histone composition,
splicing, and transcription.
4.3.1 Aurora-A leads to incorporation of H3.3 Aurora-A phosphorylates H3S10 in S phase and changes in post-translational modification of
histone tail can rearrange chromatin structure (Bannister & Kouzarides, 2011). Therefore, two
histone H3 isoforms were further analyzed depending on Aurora-A activity. H3.3 is replication-
independently incorporated and is associated with flexible exchange. H3.1 is a bulk histone
incorporated replication-dependently and associated with non-flexible exchange (Tagami et
al., 2004).
ChIP-seq experiments of total H3 (measuring H3.1 and H3.3 isoforms) and of the isoform H3.3
upon MLN8237-treatment in S phase-synchronized IMR-5 cells were performed. Density plots
of total H3 and H3.3 ChIP-seqs centered around the first nucleosome (Figure 4.15 a) display
a nucleosome-free region in front of the first nucleosome. Upon inhibition of Aurora-A, total H3
is more, whereas H3.3 is less incorporated, indicating that H3.1 increases. H3.3 incorporation
was stratified for highly MYCN-bound promoters (Figure 4.15 b) and promoters not bound by
MYCN (Figure 4.15 c). Comparable results were obtained for H3.3 incorporation on all genes
(Figure 4.15 a) and on genes highly bound by MYCN (Figure 4.15 b). On promoters with low
MYCN binding limited nucleosome-free region was detected, indicated by the comparable low
drop in signal before the first nucleosome. However, the H3.3 incorporation was still more
pronounced when Aurora-A is active. Those results are reflected in browser tracks on example
genes for high (NCL) and low (COL5A2) MYCN occupancy (Figure 4.15 d).

89
Figure 4.15: Aurora-A favors incorporation of H3.3. a. Density plot of H3 and H3.3 ChIP-seqs in S phase-synchronized IMR-5 cells treated for 4 h with 1 µM MLN8237. The signal is centered on the first nucleosome (“+1 dyad”) located downstream of the TSS (n=14,340 genes; n=2). H3 ChIP-seq was performed by Dr. Gabriele Büchel. b. Density plot as in (a) for histone H3.3 for 3,000 expressed genes with highest MYCN promoter occupancy. Shading is ± Standard error of the mean (S.E.M.; n=2). c. Density plot as in (b) for histone H3.3 for 3,000 expressed genes with lowest MYCN promoter occupancy. Shading is ± S.E.M.. d. Browser tracks of H3.3 ChIP-seq (a) on genes with high (NCL) and low (COL5A2) MYCN occupancy. Grey bar represents nucleosome free region. Parts of this Figure were published in similar form in Roeschert et al., 2021. 4.3.2 Aurora-A inhibition impairs RNAPII function Incorporation of different histone isoforms and changes in post-translational modifications of
histones are often associated with changes in transcription. Therefore, transcription by RNA
polymerase II (RNAPII) upon Aurora-A inhibition was investigated. Different stages of
transcription are characterized by different phosphorylation patterns of the heptameric repeat
of the C-terminal domain (CTD) of RNAPII. For example, elongating RNAPII can be identified
by its serine 2 phosphorylation (RNAPII pSer2). First, ChIP-seq of total RNAPII was performed
in S phase-synchronized cells treated with Aurora-A inhibitors. The metagene analysis over
the whole gene showed the characteristic distribution for RNAPII (Figure 4.16 a). Total RNAPII

90
peaks around the TSS and remains stable throughout the gene. When comparing DMSO- and
MLN8237-treated samples, the RNAPII peak at the TSS is nearly the same whereas less
RNAPII is found in the gene body upon Aurora-A inhibition using MLN8237. MK5108-treatment
shows an increase in RNAPII at the TSS and displays the same amount of RNAPII throughout
the gene body.
The traveling ratio, defined as occupancy at the TSS + 300 bp divided by the occupancy
throughout the whole gene (Reppas et al., 2006), was then calculated to determine the impact
of Aurora-A inhibition on transcription. The ratio indicates whether RNAPII moves slower or
faster upon treatment. The traveling ratio of every gene was calculated for MLN8237- (Figure
4.16 b) and MK5108- (Figure 4.16 c) treated samples compared to DMSO and shown in a
kernel density plot. In this plot, every dot represents one gene: the more the dots divert from
the diagonal (dashed line), the more the traveling ratio changes between the samples.
Samples treated with MLN8237 showed a shift of the blue cloud of dots towards the y-axis,
indicating slower transcription upon Aurora-A inhibition. The same can be observed when
investigating the samples treated with MK5108. This result demonstrated that Aurora-A is
required for proper transcription in S phase.
Figure 4.16: Aurora-A inhibition impairs RNAPII functionality. a. Metagene plot illustrating distribution of the total RNAPII ChIP-seq signal within transcribed regions of all expressed genes (n=17,533) in S phase-synchronized IMR-5 cells treated for 4 h with 1 µM MLN8237, 1µM MK5108, or DMSO as control (n=2). b. 2D Kernel density plot showing RNAPII traveling ratio in S phase-synchronized cells treated for 4 h with 1 µM MLN8237 or DMSO as control (n=2). c. 2D Kernel density plot showing RNAPII traveling ratio in S phase-synchronized cells treated for 4 h with 1 µM MK5108 or DMSO as control (n=2). Parts of this Figure were published in similar form in Roeschert et al., 2021. To better investigate the effect of Aurora-A on elongating RNAPII, a ChIP-seq of RNAPII pSer2
in IMR-5 cells treated as indicated before was performed. A metagene analysis performed on
all expressed genes shows characteristic occupancy throughout the gene body with an
increase at the TES (Figure 4.17 a). A massive increase around the TSS in samples treated
with MLN8237, and a clear but weaker increase in samples treated with MK5108 compared to
DMSO was observed. For samples treated with MLN8237, an increase in occupancy is also

91
observed throughout the gene body. This finding indicates that Aurora-A inhibition leads to a
stalling or slowing down of RNAPII when phosphorylated on Ser2. To identify whether this
phenotype is MYCN-dependent the genes were stratified by MYCN occupancy on promoters.
This revealed that accumulation of RNAPII pSer2 correlates with MYCN occupancy (Figure
4.17 b). The more MYCN is bound the more RNAPII pSer2 is observed.
Figure 4.17: Aurora-A prevents elongation defects of RNAPII. a. Metagene plot illustrating distribution of RNAPII pSer2 ChIP-seq signal within transcribed regions of all expressed genes (n=17,533) in S phase-synchronized IMR-5 cells treated for 4 h with 1 µM MLN8237, 1 µM MK5108, or DMSO as control (n=2). b. Bin plots of average RNAPII pSer2 ChIP-seq occupancy downstream of the TSS from S phase-synchronized IMR-5 cells treated for 2 h with 1 µM MLN8237 or DMSO. Genes were ordered by MYCN occupancy. Bins contain 3,000 genes each. c. Data set of (a) is filtered for the 3,000 expressed genes with highest MYCN promoter occupancy. The signal is centered on the first nucleosome (“+1 dyad”) located within 300 nt downstream of the TSS. Shading is ± S.E.M.. d. Data set of (a) is filtered for the 3,000 expressed genes with lowest MYCN promoter occupancy. The signal is centered on the first nucleosome (“+1 dyad”) located within 300 nt downstream of the TSS. Shading is ± S.E.M.. e. Browser tracks of RNAPII pSer2 ChIP-seq (a) at MYCN target gene FASN. Parts of this Figure were published in similar form in Roeschert et al., 2021.
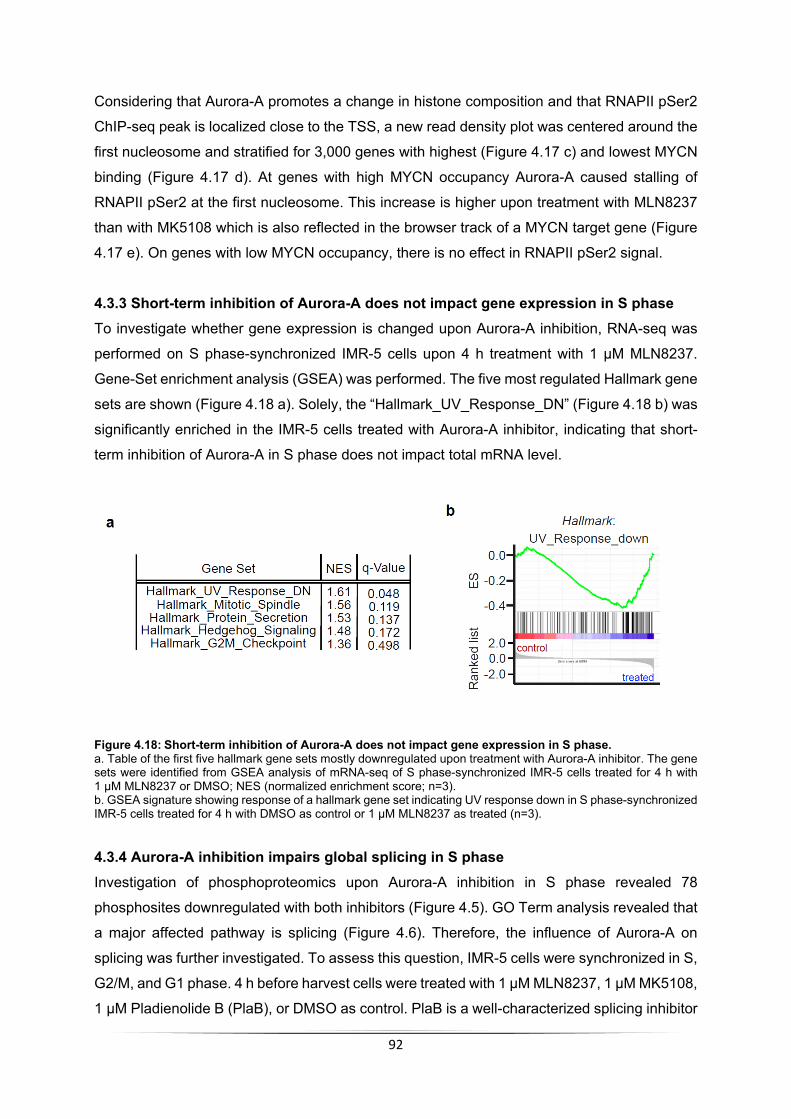
92
Considering that Aurora-A promotes a change in histone composition and that RNAPII pSer2
ChIP-seq peak is localized close to the TSS, a new read density plot was centered around the
first nucleosome and stratified for 3,000 genes with highest (Figure 4.17 c) and lowest MYCN
binding (Figure 4.17 d). At genes with high MYCN occupancy Aurora-A caused stalling of
RNAPII pSer2 at the first nucleosome. This increase is higher upon treatment with MLN8237
than with MK5108 which is also reflected in the browser track of a MYCN target gene (Figure
4.17 e). On genes with low MYCN occupancy, there is no effect in RNAPII pSer2 signal.
4.3.3 Short-term inhibition of Aurora-A does not impact gene expression in S phase To investigate whether gene expression is changed upon Aurora-A inhibition, RNA-seq was
performed on S phase-synchronized IMR-5 cells upon 4 h treatment with 1 µM MLN8237.
Gene-Set enrichment analysis (GSEA) was performed. The five most regulated Hallmark gene
sets are shown (Figure 4.18 a). Solely, the “Hallmark_UV_Response_DN” (Figure 4.18 b) was
significantly enriched in the IMR-5 cells treated with Aurora-A inhibitor, indicating that short-
term inhibition of Aurora-A in S phase does not impact total mRNA level.
Figure 4.18: Short-term inhibition of Aurora-A does not impact gene expression in S phase. a. Table of the first five hallmark gene sets mostly downregulated upon treatment with Aurora-A inhibitor. The gene sets were identified from GSEA analysis of mRNA-seq of S phase-synchronized IMR-5 cells treated for 4 h with 1 µM MLN8237 or DMSO; NES (normalized enrichment score; n=3). b. GSEA signature showing response of a hallmark gene set indicating UV response down in S phase-synchronized IMR-5 cells treated for 4 h with DMSO as control or 1 µM MLN8237 as treated (n=3).
4.3.4 Aurora-A inhibition impairs global splicing in S phase Investigation of phosphoproteomics upon Aurora-A inhibition in S phase revealed 78
phosphosites downregulated with both inhibitors (Figure 4.5). GO Term analysis revealed that
a major affected pathway is splicing (Figure 4.6). Therefore, the influence of Aurora-A on
splicing was further investigated. To assess this question, IMR-5 cells were synchronized in S,
G2/M, and G1 phase. 4 h before harvest cells were treated with 1 µM MLN8237, 1 µM MK5108,
1 µM Pladienolide B (PlaB), or DMSO as control. PlaB is a well-characterized splicing inhibitor

93
that acts by sequestering the SF3B1 protein (Effenberger et al., 2014). Unbound SF3B1 is part
of the U2 spliceosomal subunit and gets hyperphosphorylated upon splicing activation. SF3B1
hyperphosphorylation can be considered as a marker for productive splicing (Girard et al.,
2012). Total level and two phosphorylation-specific sites of SF3B1 were investigated by
immunoblotting (Figure 4.19 a). Total SF3B1 does not change throughout cell cycle or upon
treatment with any inhibitor. The phosphorylation of T313 and T328 is especially high in G1
and G2 phase, when investigating DMSO-treated cells. Upon treatment with PlaB, regardless
of the cell cycle the phosphorylation of T313 and T328 is completely abolished. The effect of
PlaB is in line with the literature. Treatment with MLN8237 and MK5108 has no influence on
phosphorylated SF3B1 in G1 and G2/M phase but reduces phosphorylation of SF3B1 in S
phase. The quantitation of total, pT313, and pT328 SF3B1 level in S phase is shown in Figure
4.19 b reveals the same results already observed by representative immunoblot.
Figure 4.19: Aurora-A is needed for splicing in S phase. a. Immunoblots of synchronized IMR-5 cells that were treated for 4 h with 1 µM MLN8237, 1 µM MK5108, 1 µM PlaB, or DMSO as control. Cells were synchronized by double thymidine block and released for 4 h, 8 h, or 14 h into S, G2/M, or G1 phase, respectively, harvested by scraping and lysed using RIPA buffer. Actin was used as loading control. Total protein level of SF3B1 as well as phosphorylation on T313 and T328 were investigated (n=3). b. Quantitation of total SF3B1 or SF3B1 phosphorylated on T313 or T328 in S phase-synchronized IMR-5 cells, treated for 4 h with 1 µM MLN8237, 1 µM MK5108, 1 µM PlaB, or DMSO as control. Error bars indicate mean ± S.D. (n=3). Parts of this Figure were published in similar form in Roeschert et al., 2021.
To further assess whether global splicing is impaired a 4-thio-uridine-sequencing (4sU-seq)
was performed. IMR-5 cells were synchronized and treated with 1 µM MLN8237, 1 µM
MK5108, 1 µM PlaB, or DMSO as control at the timepoint of release. After 2 h a 15 min pulse
with 500 µM 4sU was performed (Figure 4.20 a). One sample (pulse) was harvested directly
after the pulse. This enables an overview on actively transcribed gene loci (that incorporate
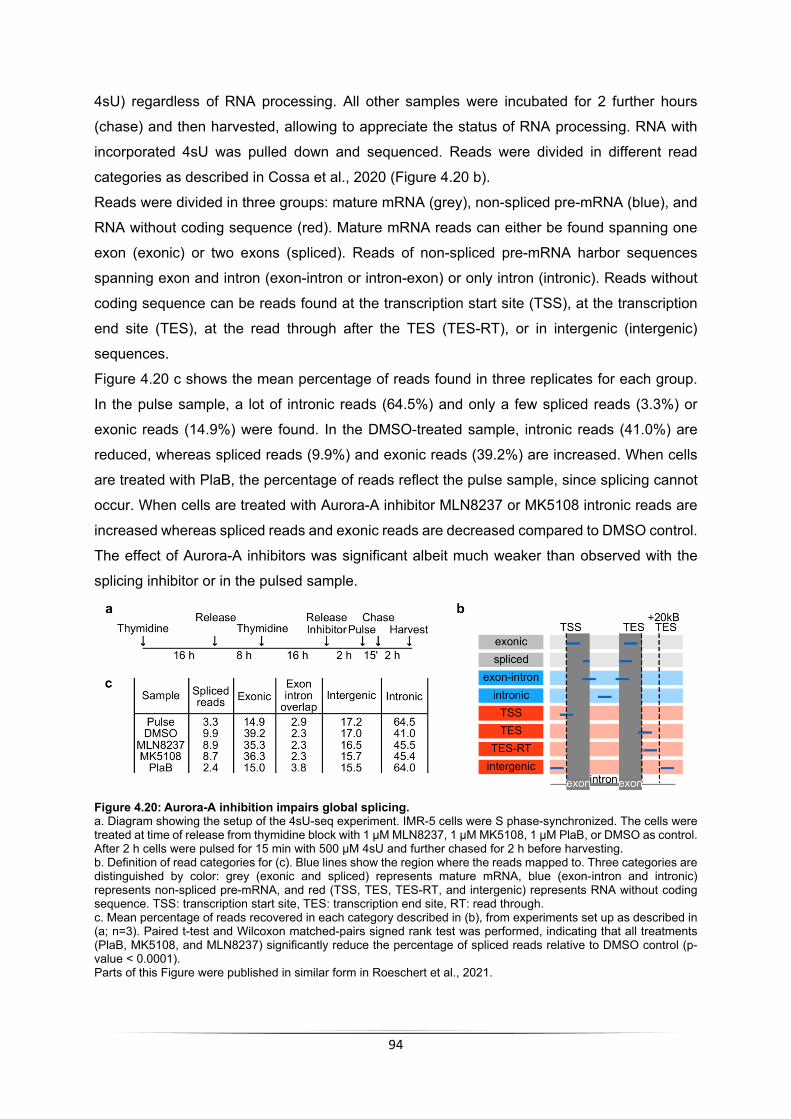
94
4sU) regardless of RNA processing. All other samples were incubated for 2 further hours
(chase) and then harvested, allowing to appreciate the status of RNA processing. RNA with
incorporated 4sU was pulled down and sequenced. Reads were divided in different read
categories as described in Cossa et al., 2020 (Figure 4.20 b).
Reads were divided in three groups: mature mRNA (grey), non-spliced pre-mRNA (blue), and
RNA without coding sequence (red). Mature mRNA reads can either be found spanning one
exon (exonic) or two exons (spliced). Reads of non-spliced pre-mRNA harbor sequences
spanning exon and intron (exon-intron or intron-exon) or only intron (intronic). Reads without
coding sequence can be reads found at the transcription start site (TSS), at the transcription
end site (TES), at the read through after the TES (TES-RT), or in intergenic (intergenic)
sequences.
Figure 4.20 c shows the mean percentage of reads found in three replicates for each group.
In the pulse sample, a lot of intronic reads (64.5%) and only a few spliced reads (3.3%) or
exonic reads (14.9%) were found. In the DMSO-treated sample, intronic reads (41.0%) are
reduced, whereas spliced reads (9.9%) and exonic reads (39.2%) are increased. When cells
are treated with PlaB, the percentage of reads reflect the pulse sample, since splicing cannot
occur. When cells are treated with Aurora-A inhibitor MLN8237 or MK5108 intronic reads are
increased whereas spliced reads and exonic reads are decreased compared to DMSO control.
The effect of Aurora-A inhibitors was significant albeit much weaker than observed with the
splicing inhibitor or in the pulsed sample.
Figure 4.20: Aurora-A inhibition impairs global splicing. a. Diagram showing the setup of the 4sU-seq experiment. IMR-5 cells were S phase-synchronized. The cells were treated at time of release from thymidine block with 1 µM MLN8237, 1 µM MK5108, 1 µM PlaB, or DMSO as control. After 2 h cells were pulsed for 15 min with 500 µM 4sU and further chased for 2 h before harvesting. b. Definition of read categories for (c). Blue lines show the region where the reads mapped to. Three categories are distinguished by color: grey (exonic and spliced) represents mature mRNA, blue (exon-intron and intronic) represents non-spliced pre-mRNA, and red (TSS, TES, TES-RT, and intergenic) represents RNA without coding sequence. TSS: transcription start site, TES: transcription end site, RT: read through. c. Mean percentage of reads recovered in each category described in (b), from experiments set up as described in (a; n=3). Paired t-test and Wilcoxon matched-pairs signed rank test was performed, indicating that all treatments (PlaB, MK5108, and MLN8237) significantly reduce the percentage of spliced reads relative to DMSO control (p-value < 0.0001). Parts of this Figure were published in similar form in Roeschert et al., 2021.

95
4.3.5 Aurora-A prevents transcription-replication conflicts Results presented so far indicate that Aurora-A inhibition causes stalling of elongating RNAPII
in S phase. Considering the concomitant DNA replication, it is therefore conceivable that one
of the functions of Aurora-A in S phase is to prevent transcription-replication conflicts in S
phase, as already proposed (Büchel et al., 2017). Therefore, a PLA was performed,
investigating the proximity between proliferating cell nuclear antigen (PCNA), the DNA clamp
behind the replication machinery and RNAPII (Figure 4.21 a). IMR-5 cells were incubated for
8 h with indicated inhibitors and PLA was performed. Nuclei were counterstained with Hoechst.
Green dots represent proximity between PCNA and RNAPII. Number of PLA spots increases
when cells are treated with Aurora-A inhibitors as compared to DMSO. Additionally, cells were
treated with two different transcription inhibitors, NVP-2 and flavopiridol (FP). When
transcription is inhibited very few PLA spots were detected. Quantification of the PLA signal
reveals an increase by 1.5-fold upon treatment with 100 nM MLN8237 and 2-fold upon 1 µM
MLN8237-treatment compared to DMSO control (Figure 4.21 b). When IMR-5 cells are treated
with MK5108, PLA signal increases to 1.5-fold, comparable to 100 nM MLN8237. NVP-2 and
FP treatment decreased the PLA signal to less than 0.5-fold. The technical control combining
only one antibody for both proteins showed no signal at all, indicating that the primary antibody
alone does not create a PLA signal.
Figure 4.21: Aurora-A prevents transcription-replication conflicts. a. Pictures of PLA between total RNAPII and PCNA. IMR-5 cells were treated for 8 h with 100 nM and 1 µM MLN8237, 1 µM MK5108, 200 nM NVP-2, 200 nM Flavopiridol (FP), and DMSO as control. IMR-5 cells were fixed, PLA was performed, and nuclei were counterstained with Hoechst. Control is a technical control for the reliability of the PLA signal, therefore only one primary antibody was used in cells treated for 8 h with 1 µM MLN8237, PLA was performed according to manufacturer´s protocol. Example pictures were taken with Operetta® High-Content Imaging System (n=3). b. Quantitation of results of PLA signal between RNAPII and PCNA in asynchronous IMR-5 cells shown in (a). Each dot represents mean PLA signal of all cells in one well compared to solvent control. Shown is the mean ± S.D., p-values were calculated using unpaired two-tailed t-test relative to DMSO (n=3). Parts of this Figure were published in similar form in Roeschert et al., 2021.

96
4.3.6 RNase H1 induction stabilizes Nucleosome +1 It was demonstrated that Aurora-A prevents the formation of DNA-RNA hybrids termed R-loops
(Roeschert et al., 2021). This is in keeping with the observations that Aurora-A inhibition
impairs splicing (Figure 4.19 and Figure 4.20), if considering that defective splicing induces
accumulation of nascent RNA that can bind DNA and form R-loops. This aspect was further
addressed by expressing a RNase H1 construct, an enzyme able to resolve R-loops, in a
doxycycline (Dox)-inducible manner (Figure 4.22 a). The HA antibody was used to specifically
detect HA-tagged overexpressed RNase H1. A clear band is detectable when cells were
treated with Dox, whereas no HA-signal was observed in EtOH-treated cells. The functionality
of the HA-RNase H1 activity was controlled by performing a DRIP (Roeschert et al., 2021).
Cells were synchronized after induction of RNase H1. PI FACS profiles reveal that
overexpression of RNase H1 has no influence on S phase-synchronization efficacy (Figure
4.22 b).
Since Aurora-A inhibition affects H3.3 occupancy, the consequences of removal of R-loops for
nucleosome composition were investigated. Therefore, H3.3 ChIP-seq was performed in S
phase-synchronized IMR-5 cells, pre-treated for 24 h with doxycycline to induce RNase H1 or
EtOH as control. A density plot was centered around the first nucleosome, showing an
increased incorporation of H3.3 around the first nucleosome upon overexpression of RNase
H1 (Figure 4.22 c). H3.3 deposition is promoted by Aurora-A and counteracted by R-loop
formation.
Figure 4.22: RNase H1 induction stabilizes Nucleosome +1. a. Immunoblot demonstrating induction of HA-RNase H1 in IMR-5 cells with doxycycline-inducible HA-RNase H1. IMR-5 cells were treated for 24 h with doxycycline (Dox) to induce HA-RNase H1 or EtOH to demonstrate no induction. Vinculin was used as loading control. HA was used to detect HA-RNase H1 (n=3). b. PI FACS analysis of IMR-5 cells expressing doxycycline-inducible RNase H1 synchronized by a double thymidine block (T0). Asynchronous cells are shown as controls. Cells were released from the block for 4 h into S phase. RNase H1 expression was induced 24 h before release from thymidine block due to the addition of Dox (n=3). c. Density plot of H3.3 ChIP-seq signal in S phase-synchronized RNase H1-IMR-5 cells treated for 24 h with Dox to induce expression of RNase H1 or EtOH (as control). The signal is centered on the first nucleosome (“+1 dyad”; n=14,340 genes) located within 300 nt downstream of the TSS (n=2). Parts of this Figure were published in similar form in Roeschert et al., 2021.

97
4.3.7 RNase H1 induction leads to stalling of RNAPII but does not increase transcription-replication conflicts
To analyze effects of RNase H1 expression on RNAPII, ChIP-seqs of total RNAPII and RNAPII
pSer2 were performed. Therefore, IMR-5 cells were S phase-synchronized using thymidine
block and pre-treated with doxycycline for 24 h to express RNase H1 or EtOH as control.
Density plots of total RNAPII ChIP-seq centered around the TSS (Figure 4.23 a) as well as
browser tracks of MYCN-bound genes (Figure 4.23 b) show normal RNAPII distribution in cells
treated with EtOH. Figure 4.23 c shows a density plot of RNAPII pSer2 ChIP-seq centered
around the first nucleosome. The density plots and browser tracks show that both forms of
RNAPII are highly enriched when RNase H1 is expressed. This indicates that removal of R-
loops results in stalling of RNAPII around the first nucleosome.
Figure 4.23: RNase H1 overexpression leads to stalling of RNAPII, which does not result in transcription-replication conflicts. a. Density plot of ChIP-seq signal for total RNAPII in IMR-5 cells inducible expressing RNase H1, synchronized by double thymidine block into S phase. The cells were treated for 24 h with 1 µg/µl doxycycline (Dox) to induce RNase H1 expression or EtOH (as control). The signal is centered on the first nucleosome (“+1 dyad”) located within 300 nt downstream of the TSS for 3,000 expressed genes with highest MYCN promoter occupancy (n=2). b. Browser tracks of total RNAPII ChIP-seqs from (a) at MYCN target genes FASN and NCL. c. Density plot of ChIP-seq signal for RNAPII pSer2 in IMR-5 cells inducible expressing RNase H1, synchronized by double thymidine block into S phase. The cells were treated for 24 h with 1 µg/µl Dox or EtOH. The signal is centered on the first nucleosome (“+1 dyad”) located within 300 nt downstream of the TSS (n=14,340 genes; n=2). d. Quantitation of RNAPII and PCNA PLA signals in asynchronous IMR-5 cells expressing inducible RNase H1, treated for 24 h with Dox or EtOH. Each dot represents mean PLA signal of all cells in one well compared to solvent control. Shown is the mean ± S.D., p-value was calculated using unpaired two-tailed t-test relative to DMSO control (n=3). Parts of this Figure were published in similar form in Roeschert et al., 2021.

98
Stalling of RNAPII can cause problems with ongoing replication. Therefore, PLA between
PCNA and total RNAPII in IMR-5 cells with overexpression of RNase H1 was performed to
investigate whether transcription-replication conflicts occur (Figure 4.23 d). Expression of
RNase H1 does not change the number of transcription-replication conflicts. Therefore, it can
be concluded that formation of R-loops does not contribute to transcription-replication conflicts.
Taken together the results indicate that Aurora-A promotes H3.3 incorporation into the first
nucleosome, whereas it prevents the incorporation of bulk histone H3.1. Inhibition of Aurora-A
leads to stalling of the elongating form of RNAPII, but short-term inhibition does not impact
mRNA levels measured by RNA-seq. Furthermore, the analyses of SF3B1 phosphorylation
and or nascent RNA suggest a role – direct or indirect – of Aurora-A in regulating splicing
activity. Additionally, Aurora-A prevents the formation of transcription-replication conflicts.
Finally, resolution of R-loops by overexpression of RNase H1 results in an increased
incorporation and therefore stabilization of the first nucleosome. Additionally, overexpression
of RNase H1 leads to a stalling of the total as well as the elongating form of RNAPII but has
no impact on the formation of transcription-replication conflicts.

99
4.4 Aurora-A inhibition activates ATR
4.4.1 Aurora-A inhibition induces ATR activation Previously published data indicated that Aurora-A inhibition induces the activation of ATR, as
measured by the phosphorylation of ATR targets S33 on RPA32 or S345 on CHK1 (Büchel et
al., 2017; Shiotani et al., 2013). Additionally, stalled replication forks which occur e.g., at
transcription-replication conflicts can activate ATR (Hamperl & Cimprich, 2016). To verify if
transcription-replication conflicts observed upon Aurora-A inhibition (Figure 4.21) are directly
inducing downstream activation of ATR, pS33 RPA32 upon Aurora-A inhibition in S phase was
investigated.
An immunofluorescence was performed on IMR-5 cells treated for 8 h with different
concentrations of MLN8237, ranging from 100 nM to 10 µM. The mean intensity of pS33 of
RPA32 of all EdU positive S phase cells is shown (Figure 4.24). This result indicates that
100 nM MLN8237 which is sufficient to inhibit the catalytic activity of Aurora-A does not induce
phosphorylation of RPA32. Increasing the concentration of MLN8237 results in
phosphorylation of RPA32. In line with literature, this shows that inhibition of Aurora-A induces
ATR activation in a dose-dependent manner.
Figure 4.24: Aurora-A inhibition induces ATR activation. IMR-5 cells were treated for 8 h with different concentrations of Aurora-A inhibitor MLN8237 (range from 100 nM to 10 µM) or DMSO as control. 30 min before fixation cells were incubated with 1 µM EdU, cells were fixed, stained for pRPA32 S33, and for EdU. Shown is the mean intensity in EdU positive cells in each condition ± S.D.; each dot represents one cell. Statistically significant differences to DMSO control are indicated in blue (p=0.0004) and red (p<0.0001; n=3). This Figure was published in similar form in Roeschert et al., 2021. 4.4.2 Aurora-A substrate SF3B2 prevents ATR activation Since it is known that Aurora-A inhibition causes activation of ATR and that inhibition of splicing
using PlaB can also enhance sensitivity of cells to ATR inhibition (Nguyen et al., 2018). One
identified substrate of MYCN-activated Aurora-A is SF3B2 which has a known function in
splicing. IMR-5 cells were transfected with a siRNA pool targeting SF3B2 for 24 h or 48 h and
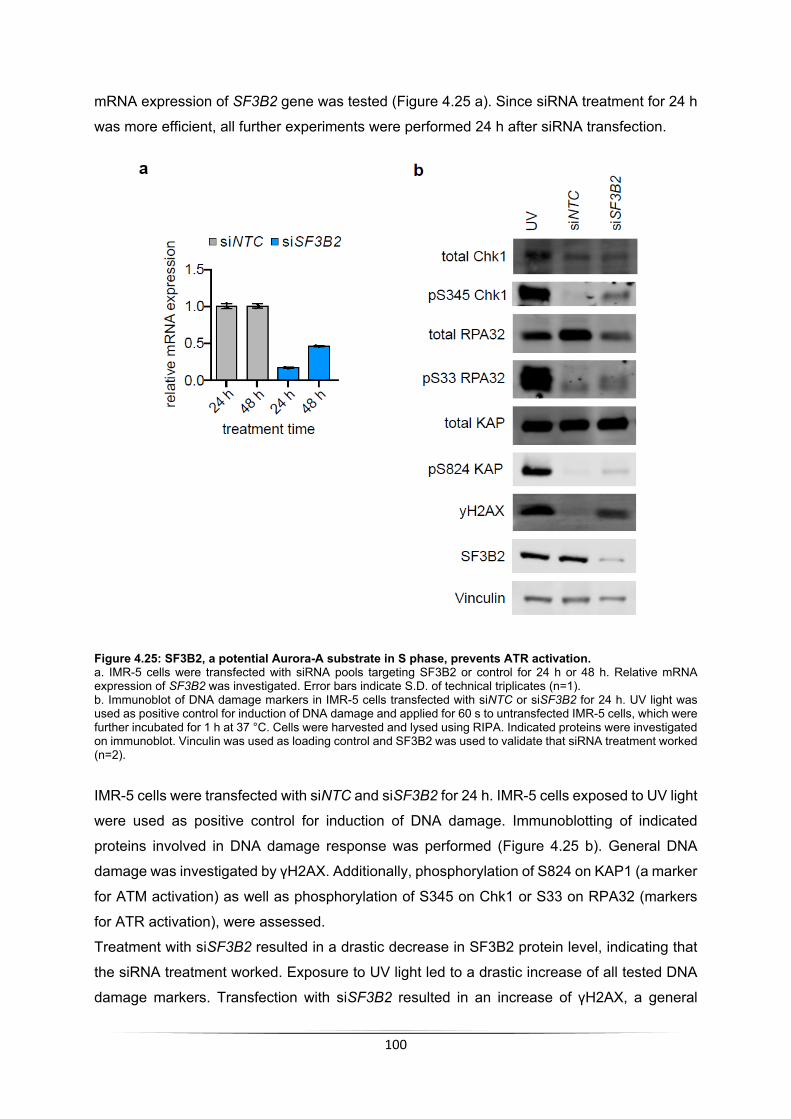
100
mRNA expression of SF3B2 gene was tested (Figure 4.25 a). Since siRNA treatment for 24 h
was more efficient, all further experiments were performed 24 h after siRNA transfection.
Figure 4.25: SF3B2, a potential Aurora-A substrate in S phase, prevents ATR activation. a. IMR-5 cells were transfected with siRNA pools targeting SF3B2 or control for 24 h or 48 h. Relative mRNA expression of SF3B2 was investigated. Error bars indicate S.D. of technical triplicates (n=1). b. Immunoblot of DNA damage markers in IMR-5 cells transfected with siNTC or siSF3B2 for 24 h. UV light was used as positive control for induction of DNA damage and applied for 60 s to untransfected IMR-5 cells, which were further incubated for 1 h at 37 °C. Cells were harvested and lysed using RIPA. Indicated proteins were investigated on immunoblot. Vinculin was used as loading control and SF3B2 was used to validate that siRNA treatment worked (n=2).
IMR-5 cells were transfected with siNTC and siSF3B2 for 24 h. IMR-5 cells exposed to UV light
were used as positive control for induction of DNA damage. Immunoblotting of indicated
proteins involved in DNA damage response was performed (Figure 4.25 b). General DNA
damage was investigated by γH2AX. Additionally, phosphorylation of S824 on KAP1 (a marker
for ATM activation) as well as phosphorylation of S345 on Chk1 or S33 on RPA32 (markers
for ATR activation), were assessed.
Treatment with siSF3B2 resulted in a drastic decrease in SF3B2 protein level, indicating that
the siRNA treatment worked. Exposure to UV light led to a drastic increase of all tested DNA
damage markers. Transfection with siSF3B2 resulted in an increase of γH2AX, a general
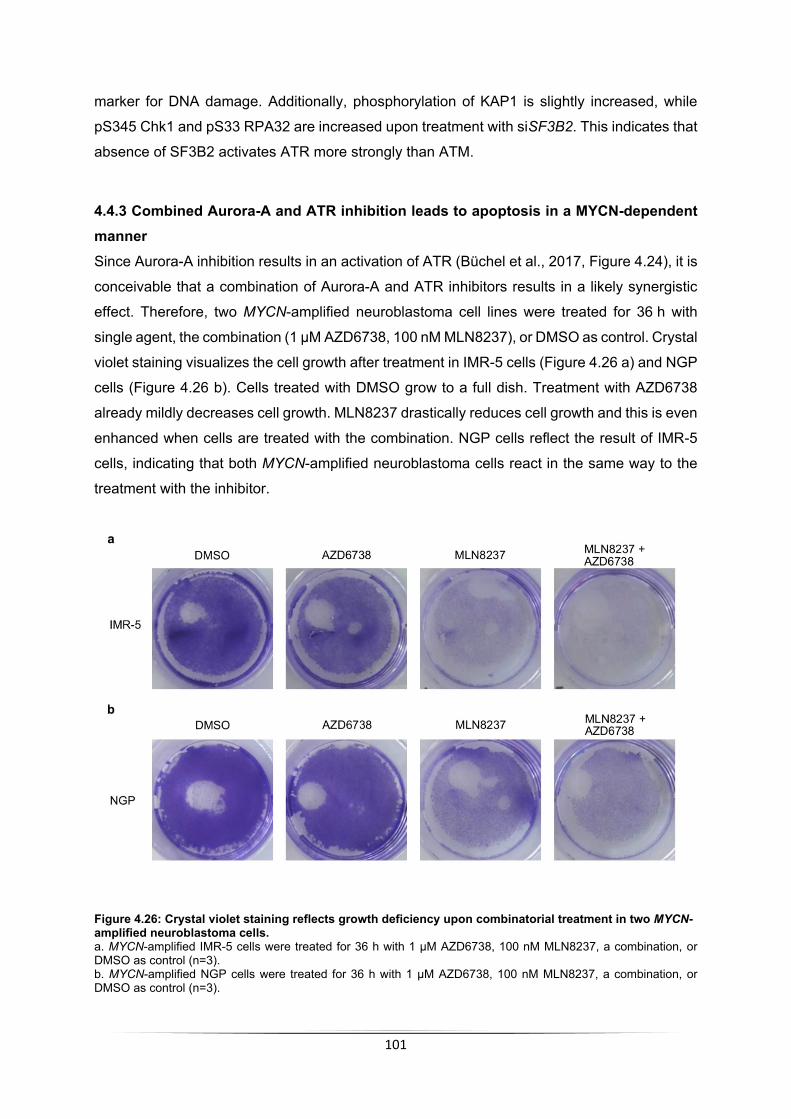
101
marker for DNA damage. Additionally, phosphorylation of KAP1 is slightly increased, while
pS345 Chk1 and pS33 RPA32 are increased upon treatment with siSF3B2. This indicates that
absence of SF3B2 activates ATR more strongly than ATM.
4.4.3 Combined Aurora-A and ATR inhibition leads to apoptosis in a MYCN-dependent manner Since Aurora-A inhibition results in an activation of ATR (Büchel et al., 2017, Figure 4.24), it is
conceivable that a combination of Aurora-A and ATR inhibitors results in a likely synergistic
effect. Therefore, two MYCN-amplified neuroblastoma cell lines were treated for 36 h with
single agent, the combination (1 µM AZD6738, 100 nM MLN8237), or DMSO as control. Crystal
violet staining visualizes the cell growth after treatment in IMR-5 cells (Figure 4.26 a) and NGP
cells (Figure 4.26 b). Cells treated with DMSO grow to a full dish. Treatment with AZD6738
already mildly decreases cell growth. MLN8237 drastically reduces cell growth and this is even
enhanced when cells are treated with the combination. NGP cells reflect the result of IMR-5
cells, indicating that both MYCN-amplified neuroblastoma cells react in the same way to the
treatment with the inhibitor.
Figure 4.26: Crystal violet staining reflects growth deficiency upon combinatorial treatment in two MYCN-amplified neuroblastoma cells. a. MYCN-amplified IMR-5 cells were treated for 36 h with 1 µM AZD6738, 100 nM MLN8237, a combination, or DMSO as control (n=3). b. MYCN-amplified NGP cells were treated for 36 h with 1 µM AZD6738, 100 nM MLN8237, a combination, or DMSO as control (n=3).

102
To better understand the reasons of the differential growth upon AZD6738- and MLN8237-
treatment, apoptosis and cell cycle behavior were assessed. Apoptosis was first investigated
using Annexin V/PI FACS in six different neuroblastoma cell lines. Three MYCN non-amplified
(SH-EP, SK-NAS, SH-SY5Y) and three MYCN-amplified (IMR-5, NGP, IMR-32)
neuroblastoma cell lines were treated with single inhibitor or combination (100 nM MLN8237,
1 µM AZD6738) or DMSO for 48 h (Figure 4.27 a). MYCN non-amplified cells are not affected
by treatment with inhibitors or combination. IMR-5 and NGP cells show the same pattern. They
display nearly no apoptosis when treated with DMSO or AZD6738, while treatment with
MLN8237 induces apoptosis and the combination of both inhibitors further increases
apoptosis. IMR-32 cells show a similar trend, although a relatively high number of apoptotic
cells is already present upon DMSO- or AZD6738-treatment. Still, treatment of IMR-32 cells
with MLN8237 increased apoptosis and this further increased upon combinatorial treatment.
Upon investigation of synergism, MYCN non-amplified cell lines show no synergistic effect
upon combinatorial treatment, whereas two MYCN-amplified cell lines showed synergism
(Table 7.2).
To test if Aurora-A catalytic function is important for this apoptotic phenotype upon combination
treatment the experiment was repeated using MK5108 (Figure 4.27 b). IMR-5 cells treated with
MK5108 show an increase in apoptosis, albeit weaker than upon treatment with 100 nM
MLN8237. Consistently with the MLN8237 result in IMR-5 cells, there is a further increase of
apoptosis when treated with MK5108 and AZD6738, indicating synergism (Table 7.2).
To test that it is an Aurora-A-specific effect, IMR-5 cells which express doxycycline-inducible
Aurora-A WT or T217D mutant (which is not affected by treatment with MLN8237) were
employed (Brockmann et al., 2013). Doxycycline was added 24 h before inhibitor treatment.
The results of the Annexin V/PI FACS revealed that without expression of Aurora-A, cells
behave comparable as seen before (Figure 4.27 c). When Aurora-A WT is overexpressed,
Aurora-A inhibition results in less apoptosis, whereas the increase in apoptotic cells is still
present, when combinatorial treatment was applied. When Aurora-A T217D mutant is
overexpressed, there is no increased apoptosis observable upon MLN8237 and only mild
increase upon combinatorial treatment, which indicates no synergism (Table 7.2).
The Chk1 kinase is a downstream target of ATR. Therefore, it was tested if inhibiting Chk1
together with Aurora-A has similar effects. IMR-5 cells were treated for 24 h and 48 h with 1 µM
CHIR-124, a selective Chk1 inhibitor, 100 nM MLN8237, combination of both, or DMSO as
control (Figure 4.27 d). DMSO treatment has no effect on apoptosis in IMR-5 cells. Inhibition
of Chk1 increases the amounts of apoptotic cells after 24 h. Inhibition of Aurora-A for 24 h is
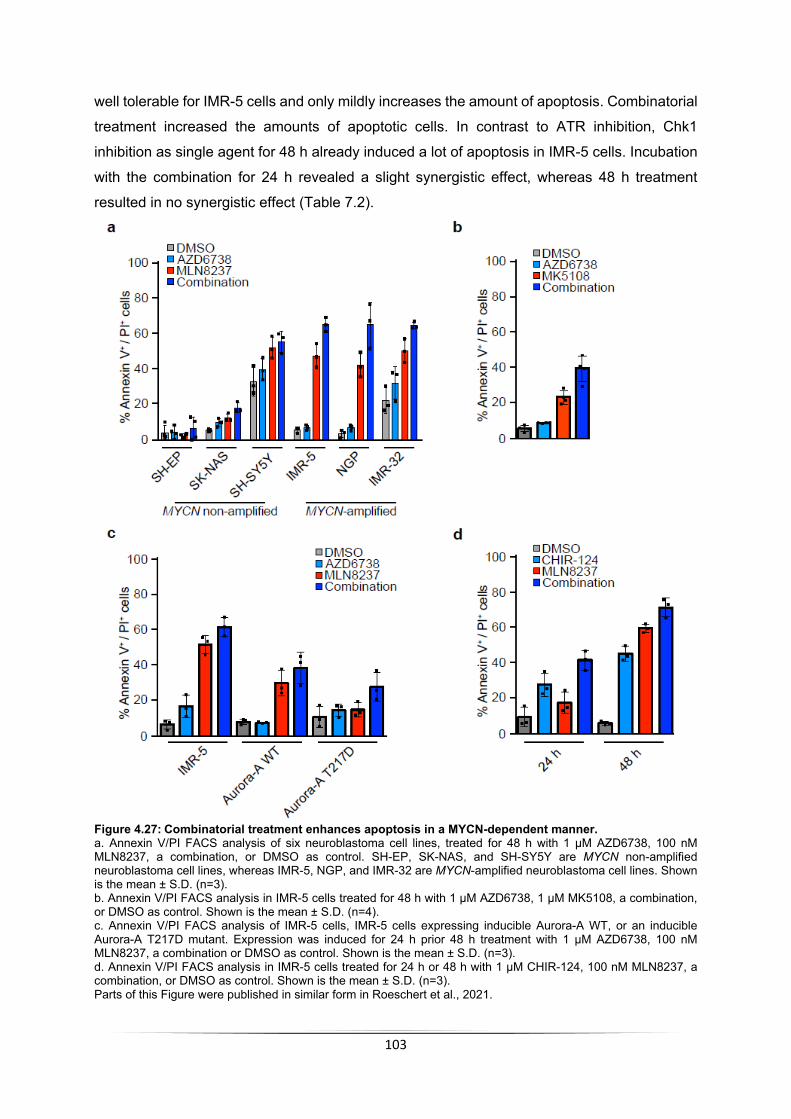
103
well tolerable for IMR-5 cells and only mildly increases the amount of apoptosis. Combinatorial
treatment increased the amounts of apoptotic cells. In contrast to ATR inhibition, Chk1
inhibition as single agent for 48 h already induced a lot of apoptosis in IMR-5 cells. Incubation
with the combination for 24 h revealed a slight synergistic effect, whereas 48 h treatment
resulted in no synergistic effect (Table 7.2).
Figure 4.27: Combinatorial treatment enhances apoptosis in a MYCN-dependent manner. a. Annexin V/PI FACS analysis of six neuroblastoma cell lines, treated for 48 h with 1 µM AZD6738, 100 nM MLN8237, a combination, or DMSO as control. SH-EP, SK-NAS, and SH-SY5Y are MYCN non-amplified neuroblastoma cell lines, whereas IMR-5, NGP, and IMR-32 are MYCN-amplified neuroblastoma cell lines. Shown is the mean ± S.D. (n=3). b. Annexin V/PI FACS analysis in IMR-5 cells treated for 48 h with 1 µM AZD6738, 1 µM MK5108, a combination, or DMSO as control. Shown is the mean ± S.D. (n=4). c. Annexin V/PI FACS analysis of IMR-5 cells, IMR-5 cells expressing inducible Aurora-A WT, or an inducible Aurora-A T217D mutant. Expression was induced for 24 h prior 48 h treatment with 1 µM AZD6738, 100 nM MLN8237, a combination or DMSO as control. Shown is the mean ± S.D. (n=3). d. Annexin V/PI FACS analysis in IMR-5 cells treated for 24 h or 48 h with 1 µM CHIR-124, 100 nM MLN8237, a combination, or DMSO as control. Shown is the mean ± S.D. (n=3). Parts of this Figure were published in similar form in Roeschert et al., 2021.
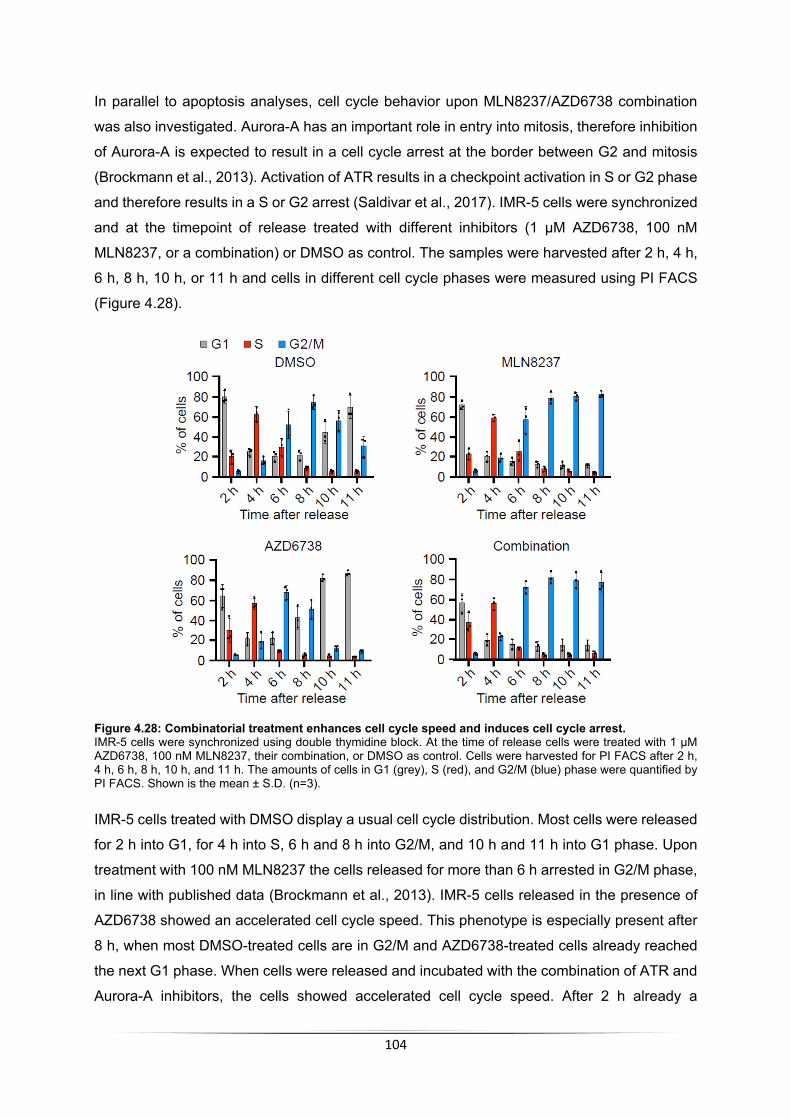
104
In parallel to apoptosis analyses, cell cycle behavior upon MLN8237/AZD6738 combination
was also investigated. Aurora-A has an important role in entry into mitosis, therefore inhibition
of Aurora-A is expected to result in a cell cycle arrest at the border between G2 and mitosis
(Brockmann et al., 2013). Activation of ATR results in a checkpoint activation in S or G2 phase
and therefore results in a S or G2 arrest (Saldivar et al., 2017). IMR-5 cells were synchronized
and at the timepoint of release treated with different inhibitors (1 µM AZD6738, 100 nM
MLN8237, or a combination) or DMSO as control. The samples were harvested after 2 h, 4 h,
6 h, 8 h, 10 h, or 11 h and cells in different cell cycle phases were measured using PI FACS
(Figure 4.28).
Figure 4.28: Combinatorial treatment enhances cell cycle speed and induces cell cycle arrest. IMR-5 cells were synchronized using double thymidine block. At the time of release cells were treated with 1 µM AZD6738, 100 nM MLN8237, their combination, or DMSO as control. Cells were harvested for PI FACS after 2 h, 4 h, 6 h, 8 h, 10 h, and 11 h. The amounts of cells in G1 (grey), S (red), and G2/M (blue) phase were quantified by PI FACS. Shown is the mean ± S.D. (n=3). IMR-5 cells treated with DMSO display a usual cell cycle distribution. Most cells were released
for 2 h into G1, for 4 h into S, 6 h and 8 h into G2/M, and 10 h and 11 h into G1 phase. Upon
treatment with 100 nM MLN8237 the cells released for more than 6 h arrested in G2/M phase,
in line with published data (Brockmann et al., 2013). IMR-5 cells released in the presence of
AZD6738 showed an accelerated cell cycle speed. This phenotype is especially present after
8 h, when most DMSO-treated cells are in G2/M and AZD6738-treated cells already reached
the next G1 phase. When cells were released and incubated with the combination of ATR and
Aurora-A inhibitors, the cells showed accelerated cell cycle speed. After 2 h already a

105
significant number of cells reached S phase and after 6 h most cells reached G2/M phase and
arrested in the cell cycle.
4.4.4 RNase H1 induction does not prevent apoptosis Upon simultaneous inhibition of Aurora-A and ATR, MYCN-amplified neuroblastoma cells
undergo apoptosis. To investigate the role of R-loops in this process, IMR-5 cells expressing
a doxycycline-inducible RNase H1 were used. As demonstrated in Figure 4.22, pre-treatment
for 24 h with doxycycline results in expression of RNase H1. IMR-5 cells pre-treated for 24 h
with EtOH or Dox, followed by 48 h treatment with 1 µM AZD6738, 100 nM MLN8237,
combination, or DMSO as control, were stained with Annexin V/PI (Figure 4.29 a). As
previously shown (Figure 4.27 a), DMSO and AZD6738-treatment does not influence levels of
apoptosis in IMR-5 cells. Apoptosis levels increase upon inhibition of Aurora-A and further
elevate when cells were co-treated with an ATR inhibitor. There was no difference in apoptosis
upon overexpression of RNase H1. Therefore, removal of R-loops does not impact apoptosis
levels upon inhibition of Aurora-A and ATR.
Additionally, a PI FACS analysis was performed to investigate the contribution of R-loops
resolution to the cell cycle phenotype observed upon combinatorial treatment (Figure 4.29 b).
Asynchronously growing IMR-5 cells with inducible RNase H1 were pre-treated for 24 h with
EtOH or Dox and treated for 8 h or 24 h with 1 µM AZD6738, 100 nM MLN8237, their
combination, or DMSO. Cells treated with DMSO show a majority of cells in G1 phase, as well
as an equal distribution of the non-G1 phase cells between S and G2/M phase. This distribution
neither change upon prolongation of DMSO treatment nor with overexpression of RNase H1.
Treatment for 8 h with AZD6738 increased the amounts of cells in G1 phase compared to
DMSO treatment. G1 phase cells increase even further upon 24 h treatment. Upon 8 h
treatment with MLN8237 most cells are in G2/M phase, which can also be observed upon 24 h
treatment. Upon treatment with the combination for 8 h an arrest of the majority of cells in G2/M
phase was observed, this arrest was enhanced when treatment was prolonged to 24 h. The
same percentages were measured when RNase H1 was overexpressed. The results indicate
that RNase H1 expression does not alter the cell cycle phenotype induced by Aurora-A or ATR
inhibition.

106
Figure 4.29: RNase H1 overexpression does not affect apoptosis or cell cycle. a. Annexin V/PI FACS of IMR-5 cells expressing doxycycline-inducible RNase H1. 1 µg/ml Dox or EtOH was added 24 h before start of the experiment. After pre-treatment, cells were incubated for 48 h with 1 µM AZD6738, 100 nM MLN8237, combination, or DMSO as control. Annexin V/PI FACS was performed and measured on FACSCantoII. Shown is the mean ± S.D. (n=3). b. PI FACS of IMR-5 cells expressing inducible RNase H1. 1 µg/ml Dox or EtOH was added 24 h before start of the experiment. After pre-treatment, cells were incubated with 1 µM AZD6738, 100 nM MLN8237, combination, or DMSO as control. Cells were treated for 8 h or 24 h and harvested for PI FACS. The amounts of cells in G1 (grey), S (red), and G2/M (blue) phase were quantified by FACS. Shown is the mean ± S.D. (n=3).
4.4.5 PARP1 prevents the formation of transcription-replication conflicts PARP1 is activated at stalled replication forks to stabilize them, similarly to ATR (Ronson et
al., 2018). To investigate whether PARP1 and ATR have similar functions in addition to Aurora-
A inhibition, the effect of PARP1 on transcription-replication conflicts as well as apoptosis in
MYCN-amplified neuroblastoma cells were investigated.
Therefore, transcription-replication conflicts were measured by PLA between PCNA and
RNAPII upon inhibition of PARP1 using 1 µM Olaparib for 8 h (Figure 4.30 a). The result shows
that transcription-replication conflicts occur more often upon PARP1 inhibition, comparably to
results obtained for Aurora-A inhibition (Figure 4.21).
As a next step the effect of combinatorial inhibition of PARP1 and Aurora-A on apoptosis of
MYCN-amplified neuroblastoma was investigated (Figure 4.30 b). 24 h treatment of any
inhibitor does not result in an increased apoptosis of IMR-5 cells. Treatment for 48 h increases
apoptosis for all single agents and even more cells undergo apoptosis when treated with both
inhibitors. Combinatorial treatment with Olaparib and MLN8237 does not result in a synergistic
effect in this experiment (Table 7.2).

107
Figure 4.30: Effect of PARP1 inhibition on transcription-replication conflicts and apoptosis. a. Quantitation of transcription-replication conflicts measured by PLA between PCNA and RNAPII. IMR-5 cells were treated for 8 h with 1 µM Olaparib or DMSO as control. PLA was performed and results were quantified with the Operetta® High-Content Imaging System. P-values analyzed using unpaired t-test (n=3). b. Annexin V/PI FACS of IMR-5 cells upon 24 h or 48 h treatment with 100 nM MLN8237, 1 µM Olaparib, or combination (n=3). Parts of this Figure were published in similar form in Roeschert et al., 2021.
Taken together, Aurora-A inhibition as well as knockdown of the putative Aurora-A target
SF3B2 in S phase result in the activation of ATR. Combinatorial treatment of Aurora-A and
ATR inhibitors results in a synergistic reduction of cell growth. This can be due to increased
apoptosis of MYCN-amplified neuroblastoma cells as well as an accelerated cell cycle speed
resulting in a G2/M arrest. The synergistic effect of apoptosis can be seen additionally by using
another inhibitor of Aurora-A and a slightly synergistic effect is also observable upon inhibition
of CHK1, the downstream kinase of ATR. The apoptotic phenotype can be rescued by
expression of a mutant Aurora-A which does not respond to inhibitor treatment.
Overexpression of RNase H1 does not rescue the apoptotic phenotype, neither impact the cell
cycle arrest.
PARP inhibition increased the number of transcription-replication conflicts but showed no
synergism on neuroblastoma cells when combined with Aurora-A inhibition.

108
5 Discussion 5.1 Aurora-A is MYCN-dependent bound to chromatin in S phase Aurora-A is a widely studied kinase in G2/M phase. However, recent literature suggested a
role for Aurora-A in S phase. Aurora-A mainly interacts with MYCN in S phase of the cell cycle
(Büchel et al., 2017) and MYCN induces auto-phosphorylation of Aurora-A in vitro, indicating
a coactivator function (Richards et al., 2016). However, nothing is known regarding the
subcellular localization of this complex.
The investigation of subcellular localization of Aurora-A throughout the cell cycle revealed that
total Aurora-A levels increased from G1 to G2/M phase (Figure 4.1 b), which is in line with
literature (Kimura et al., 1997). Additionally, the subcellular localization of Aurora-A changes
throughout the cell cycle. Aurora-A is mainly cytoplasmic in G1 phase, whereas in S phase it
is mainly chromatin-bound. G2/M phase revealed similar amounts of cytoplasmic and
chromatin-bound Aurora-A. TPX2 is the known chromatin anchor for Aurora-A (Kufer et al.,
2002), which is widely expressed in G2/M phase, while it is almost absent in G1 and S phase
(Hsu et al., 2017). This suggests that association of Aurora-A with chromatin in S phase cannot
be mediated by TPX2. Since Aurora-A needs a cofactor to bind chromatin, there has to be
another protein fulfilling this function in S phase. From previous work, it is known that MYCN
specifically interacts with Aurora-A in S phase (Büchel et al., 2017) and MYCN showed binding
to chromatin throughout the cell cycle.
To investigate the MYCN-dependency of Aurora-A association to chromatin in S phase, 10058-
F4 was used. 10058-F4 is a compound preventing the hetero-dimerization of MYCN with MAX
and thereby association to chromatin (Wang et al., 2007), as confirmed by a MYCN ChIP which
showed reduced MYCN binding (Figure 4.2 a).
A comparable result was also obtained from fractionation experiments (Figure 4.2 b). Besides
the reduction of MYCN binding to chromatin also total MYCN levels decreased upon 10058-
F4 treatment. This can be explained as stability of MYCN is regulated by chromatin binding,
since the loss of this association results in a proteasomal degradation (Mathsyaraja et al.,
2019). Upon 10058-F4 treatment also chromatin binding of Aurora-A was decreased, arguing
that Aurora-A was stabilized by MYCN on chromatin.
Since 10058-F4 interferes not only with MYCN/MAX but also with other BR-HLH-LZ proteins,
the specificity for MYCN using siRNA or shRNA is desirable. Nevertheless, this approach was
not pursued since MYCN also drives the transcription of Aurora-A (den Hollander et al., 2010;
Shang et al., 2009) and therefore long-term knockdown of MYCN would automatically result in
a reduction of levels of Aurora-A as well as other proteins. Therefore, interpretation of direct or
indirect effects would be impossible. Additionally, MYCN-amplified cell lines have 100 x fold
higher MYCN levels and therefore siRNA and shRNA only moderately reduce MYCN levels
109
(Schwab et al., 2003) and due to the MYCN-amplification also establishing an auxin inducible
degron system would be highly challenging.
5.2 Aurora-A is unphosphorylated in S phase Aurora-A is usually in an inactive conformation until the binding of a coactivator which enables
a conformational change resulting in kinase activation. The most studied coactivator for
Aurora-A is TPX2, which results in a hyperactivation of Aurora-A when localized to spindle
poles which can be assessed by the auto-phosphorylation of Aurora-A at T288 (Zeng et al.,
2010). MYCN was identified as a protein that can activate Aurora-A which leads to its auto-
phosphorylation in vitro (Richards et al., 2016).
By immunoblot, auto-phosphorylation of Aurora-A throughout cell cycle was investigated
(Figure 4.3 b). In mitosis, there is a massive increase of auto-phosphorylated Aurora-A which
is in line with published data, showing that complex formation with TPX2 at the spindle poles
results in auto-phosphorylation (Zheng et al., 2010). In S phase Aurora-A is unphosphorylated
which indicates that even though auto-phosphorylation of Aurora-A is visible when activated
by MYCN in vitro, this is not observed in cells.
However, auto-phosphorylation of Aurora-A cannot predict whether the kinase is active or not
but enhances the activity of the kinase two-fold (Dodson & Bayliss, 2012). Already other
publication showed that in mitosis Aurora-A is additionally active on the spindle itself but is only
auto-phosphorylated on T288 at the spindle poles. At the spindle, Aurora-A is kept
unphosphorylated by protein phosphatase 6 (PPP6) which prevents hyper-activation of
Aurora-A to ensure proper spindle assembly (Zeng et al., 2010). Therefore, the activity of
Aurora-A cannot be measured only by investigating the phosphorylation status.
Additionally, it is possible that cells need unphosphorylated Aurora-A which is less active to
balance kinase activity which might reflect a fine-tuning mechanism.
Collectively, the results suggest the activity of Aurora-A in a MYCN-dependent manner in S
phase. To gain further insights, a systematic analysis of putative Aurora-A targets was
pursued.

110
5.3 Investigation of MYCN-dependent Aurora-A substrates in S phase
Aurora-A substrates as well as the consensus sequence for preferred phosphorylation sites
have been already studied previously (Kettenbach et al., 2011). However, no studies focused
on Aurora-A substrates in S phase. Therefore, MYCN-dependent Aurora-A substrates in S
phase were further investigated.
5.3.1 Aurora-A substrates in S phase Approximately 3,200 chromatin-bound proteins were identified in S phase in a mass-
spectrometry (MS) analysis (Figure 4.4 b) which is in line with publications where 3,100
proteins bound to chromatin were identified (Ginno et al., 2018). Of the chromatin-bound
proteins only a very small subset changed abundance upon inhibition of Aurora-A. MYCN was
one of the proteins identified showing enhanced binding to chromatin. MLH1, PPIL2,
PSMC3IP, TRMT1L, and ZNF217 were also found more abundant and it is published that they
are MYC interaction partners (Heidelberger et al., 2018; Kalkat et al., 2018; Koch et al., 2007).
Therefore, it seems reasonable to believe that the effects are indirect due to elevated levels of
MYCN on chromatin. However, elevated protein levels of MYCN were not observed in
immunoblot analysis (Figure 4.4 a). This is possible, as MS analysis is more sensitive for small
changes whereas immunoblot needs a more robust change to identify differences in protein
amount. As the key question was the change in phosphorylated proteins, the results of the
proteomic analysis and the pathways in which the proteins are involved were not further
investigated.
To identify phosphorylation changes on proteins, phosphoproteomic analysis was performed
under the same conditions described for proteomic analysis (Figure 4.5). The two Aurora-A
inhibitors used show high correlation of the regulated phosphosites (Figure 4.5 c), although
the mode of action of the inhibitors is slightly different. MK5108 is a pure catalytic inhibitor,
whereas MLN8237 inhibits the catalytic activity and additionally disrupts the Aurora-A/MYCN
complex, when used in higher concentrations (Gustafson et al., 2014; Brockmann et al., 2013).
With MLN8237 treatment slightly more phosphosites are downregulated compared to MK5108
treatment, which is in line with publications, demonstrating that MLN8237 is the more potent
inhibitor (Brockmann et al., 2013). 73 phosphosites were downregulated with both inhibitors
and were therefore considered as putative Aurora-A targets in S phase (Table 7.1).
Interestingly, the proteins bearing these sites revealed enrichment in mediators of “mRNA
processing” and Aurora-A has been already implicated in processes related to splicing for
example in regulating alternative splicing, which results in the expression of isoforms that
prevent apoptosis (Moore et al., 2010). Additionally, recent literature demonstrated that
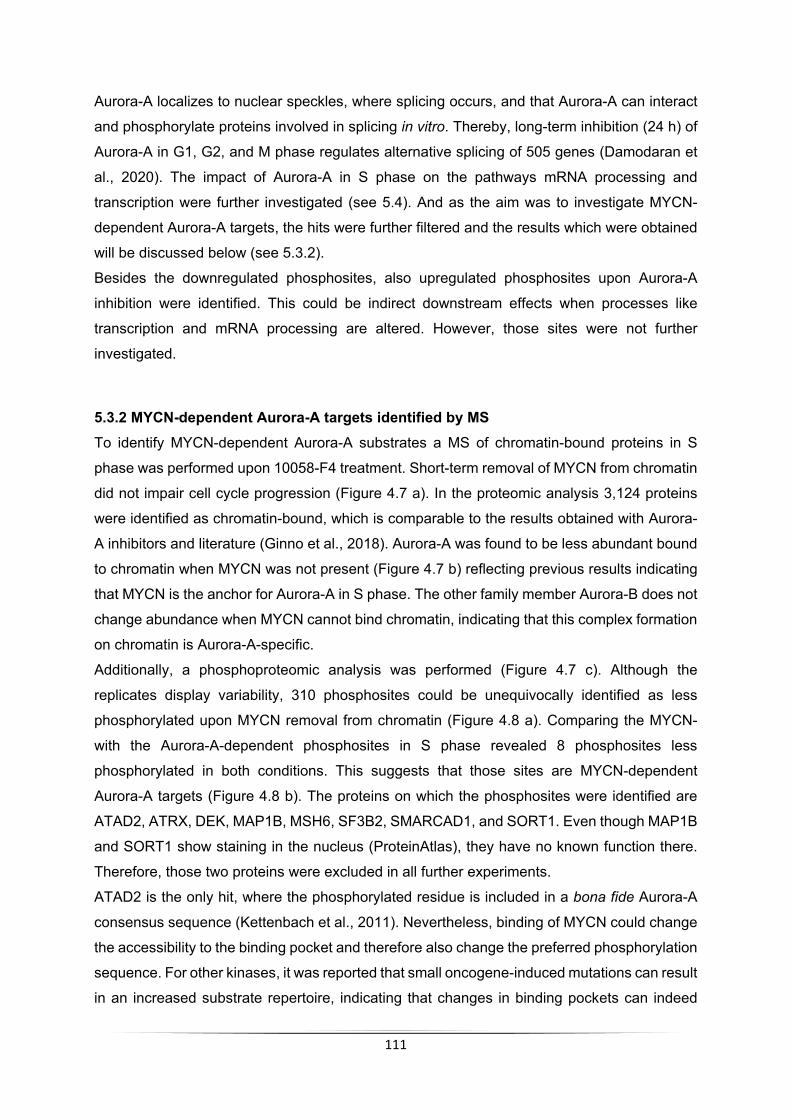
111
Aurora-A localizes to nuclear speckles, where splicing occurs, and that Aurora-A can interact
and phosphorylate proteins involved in splicing in vitro. Thereby, long-term inhibition (24 h) of
Aurora-A in G1, G2, and M phase regulates alternative splicing of 505 genes (Damodaran et
al., 2020). The impact of Aurora-A in S phase on the pathways mRNA processing and
transcription were further investigated (see 5.4). And as the aim was to investigate MYCN-
dependent Aurora-A targets, the hits were further filtered and the results which were obtained
will be discussed below (see 5.3.2).
Besides the downregulated phosphosites, also upregulated phosphosites upon Aurora-A
inhibition were identified. This could be indirect downstream effects when processes like
transcription and mRNA processing are altered. However, those sites were not further
investigated.
5.3.2 MYCN-dependent Aurora-A targets identified by MS To identify MYCN-dependent Aurora-A substrates a MS of chromatin-bound proteins in S
phase was performed upon 10058-F4 treatment. Short-term removal of MYCN from chromatin
did not impair cell cycle progression (Figure 4.7 a). In the proteomic analysis 3,124 proteins
were identified as chromatin-bound, which is comparable to the results obtained with Aurora-
A inhibitors and literature (Ginno et al., 2018). Aurora-A was found to be less abundant bound
to chromatin when MYCN was not present (Figure 4.7 b) reflecting previous results indicating
that MYCN is the anchor for Aurora-A in S phase. The other family member Aurora-B does not
change abundance when MYCN cannot bind chromatin, indicating that this complex formation
on chromatin is Aurora-A-specific.
Additionally, a phosphoproteomic analysis was performed (Figure 4.7 c). Although the
replicates display variability, 310 phosphosites could be unequivocally identified as less
phosphorylated upon MYCN removal from chromatin (Figure 4.8 a). Comparing the MYCN-
with the Aurora-A-dependent phosphosites in S phase revealed 8 phosphosites less
phosphorylated in both conditions. This suggests that those sites are MYCN-dependent
Aurora-A targets (Figure 4.8 b). The proteins on which the phosphosites were identified are
ATAD2, ATRX, DEK, MAP1B, MSH6, SF3B2, SMARCAD1, and SORT1. Even though MAP1B
and SORT1 show staining in the nucleus (ProteinAtlas), they have no known function there.
Therefore, those two proteins were excluded in all further experiments.
ATAD2 is the only hit, where the phosphorylated residue is included in a bona fide Aurora-A
consensus sequence (Kettenbach et al., 2011). Nevertheless, binding of MYCN could change
the accessibility to the binding pocket and therefore also change the preferred phosphorylation
sequence. For other kinases, it was reported that small oncogene-induced mutations can result
in an increased substrate repertoire, indicating that changes in binding pockets can indeed

112
result in a different preference for the phosphorylation sequence (Creixell et al., 2015).
Additionally, the consensus sequence is preferred by a kinase but does not exclude that other
sequences can be phosphorylated as well (Sardon et al., 2010). For all these reasons, also
other phosphosites could be indeed targeted by Aurora-A.
A further investigation revealed that all proteins show proximity to MYCN and Aurora-A. This
was more evident for ATAD2, SF3B2, and SMARCAD1 and weaker for ATRX, DEK, and MSH6
when tested with Aurora-A. Interestingly, ATRX was reported to interact with Aurora-A directly
in a reconstituted complex, corroborating the results observed in the PLA (Kamran et al., 2017).
When tested with MYCN, SF3B2 and SMARCAD1 showed a high number of PLA spots,
whereas ATAD2, ATRX, DEK, and MSH6 showed weaker signal. SF3B2, SMARCAD1,
ATAD2, and MSH6 have been identified in several high-throughput MS analyses as interaction
partner of MYC (Heidelberger et al., 2018; Ewing et al., 2007; Koch et al., 2007). SF3B2 was
additionally identified in a Proximity Label MS of MYC (Kalkat et al., 2018) and the interaction
with ATAD2 has been further studied by a reconstituted complex revealing that those proteins
indeed interact directly (Ciró et al., 2009). The overall interaction network has been
summarized in Figure 5.1.
Figure 5.1:Schematic network of protein interaction with MYCN and Aurora-A. Putative MYCN-dependent Aurora-A targets are depicted in blue. The color of the line indicates whether interaction was identified in PLA (black) high-throughput (HT; blue) or low-throughput (LT; red) data. Thickness of line indicates a lot (thick) or little (thin) PLA signal.
All proteins except for DEK have been implicated in either interacting with MYC or Aurora-A.
However, most MS studies from literature have investigated MYC- and not MYCN-interacting
proteins. As a kinase does not need a robust interaction with a protein to phosphorylate it, it is

113
also possible that those proteins would not be found in a high-throughput MS analysis.
Furthermore, some of the proteins have been identified to interact with each other e.g.,
SMARCAD1 showed interaction with SF3B2 and MSH6 (Rowbotham et al., 2011). How the
function of these proteins could be involved in the processes regulated by Aurora-A in S phase
will be discussed below (see 5.4).
Peptides spanning the found phosphorylation site on ATRX, MAP1B, and MSH6 were
incubated with purified Aurora-A and were assessed in an in vitro phosphorylation assay (data
not shown here, done by Mark Richards, Richard Bayliss Lab, Faculty of Biological Sciences,
University of Leeds, UK). The in vitro assay revealed that Aurora-A alone cannot phosphorylate
indicated phosphosites. It is possible, that Aurora-A in complex with MYCN is required to
phosphorylate those targets or that the phosphorylation is not a direct Aurora-A
phosphorylation site. Therefore, further experiments are needed.
5.3.3 H3S10 is a MYCN-dependent Aurora-A target Among the published Aurora-A targets is serine 10 of histone H3 (H3S10). Considering that
histone tails cannot be covered by MS analysis using tryptic digest (Liigand et al., 2019), the
effect of Aurora-A on pH3S10 was further investigated in small-scale experiments. The
phosphorylation of H3S10 has several published roles. It is a known mark for condensed
heterochromatin and thereby a marker for mitotic cells. Additionally, studies showed that
pH3S10 enhances transcription and thereby marks euchromatin (reviewed in Sawicka &
Seiser, 2012). One reason for this could be a difference in time during cell cycle and the kinase
which phosphorylates this residue. The published function of H3S10 phosphorylation by
Aurora-A is to prevent H3K9 di-methylation by G9a, a methyltransferase adding a methyl-
group on this residue and thereby inactivating gene expression (Kim et al., 2016).
Interestingly, besides the published mitotic high intensity staining, pH3S10 displays a spot-like
pattern in S and G2 phase (Figure 4.10 a, b). Aurora-A inhibition reduces the spot-like pattern,
suggesting that Aurora-A targets pH3S10 mainly in S phase. Thereby, MK5108 showed
reduced efficacy compared to MLN8237 as already discussed above.
To genetically validate this finding, a comparison between wild type (WT) and a MLN8237-
resistent Aurora-A mutant (T217D) was performed. Overexpression of the mutant does not
enhance Aurora-A levels compared to WT overexpression, but drastically enhances auto-
phosphorylation, indicating that the mutant is much more active than Aurora-A WT (Brockmann
et al., 2013). In line with this data, overexpression of Aurora-A WT results in increased pH3S10
in S phase, which is even further enhanced upon expression of Aurora-A T217D mutant.
Consistently, MLN8237 treatment abolished pH3S10 signal – but not in T217D expressing
cells (Figure 4.12). Further experiments with siRNA or shRNA experiments could not be

114
performed, because long-term treatment results in an arrest of cells in G2/M phase
(Brockmann et al., 2013). Still, the available results indicate that pH3S10 is a target of Aurora-
A in S phase.
Beyond Aurora-A, more than 10 kinases are known to phosphorylate H3S10, including Aurora-
B (Monier et al., 2007; Crosio et al., 2002). To rule out the contribution of Aurora-B to the
described phenotype, an Aurora-B inhibitor was used. Aurora-B regulates pH3S10 levels in
mitosis but does not influence its level in S or G2 phase (Figure 4.13 a). This finding is in
keeping with the literature were Aurora-B is reported as a mitotic kinase for pH3S10 (Crosio et
al., 2002).
Importantly, the decrease of pH3S10 immunofluorescence signal was also confirmed by ChIP
experiments (Figure 4.11), indicating additionally that the post-translational modification on the
histone is added while on chromatin. Global pH3S10 distribution was investigated by ChIP-
seq and revealed that the signal is drastically reduced globally upon Aurora-A inhibition in S
phase (Roeschert et al., 2021).
Furthermore, H3S10 phosphorylation is MYCN-dependent, as assessed by the comparison of
SH-EP cells which are MYCN non-amplified neuroblastoma cells and SH-EP cells expressing
MYCN WT or a non-degradable MYCN mutant (MYCN T58A; Sjostrom et al., 2005). Upon
stable expression of MYCN or MYCN T58A, the cells change their expression from MYC to
MYCN (Herold et al., 2019; Figure 4.14 a). Immunofluorescence revealed that MYCN
overexpression and to an even higher level MYCN T58A overexpression increased the
pH3S10 signal in S phase, while Aurora-A inhibition decreased it (Figure 4.14 b).
All these finding support the idea that MYCN recruits Aurora-A to chromatin, where it gets
activated and phosphorylates H3S10.
Mechanistically, this can also be mediated by the chromatin remodeler SMARCAD1 which was
one of the identified MYCN-dependent Aurora-A substrates. SMARCAD1 mediates gene
silencing by heterochromatin maintenance and can recruit G9a, a methyltransferase which can
di-methylate H3K9 (Yu et al., 2011). This recruitment is counteracted by Aurora-A activity (Kim
et al., 2016). In this perspective, the phosphorylation of the identified Aurora-A dependent
SMARCAD1 site could prevent its binding to DNA, reducing G9a recruitment and further
enhancing H3S10 phosphorylation (Figure 5.2). This model warrants further investigation.
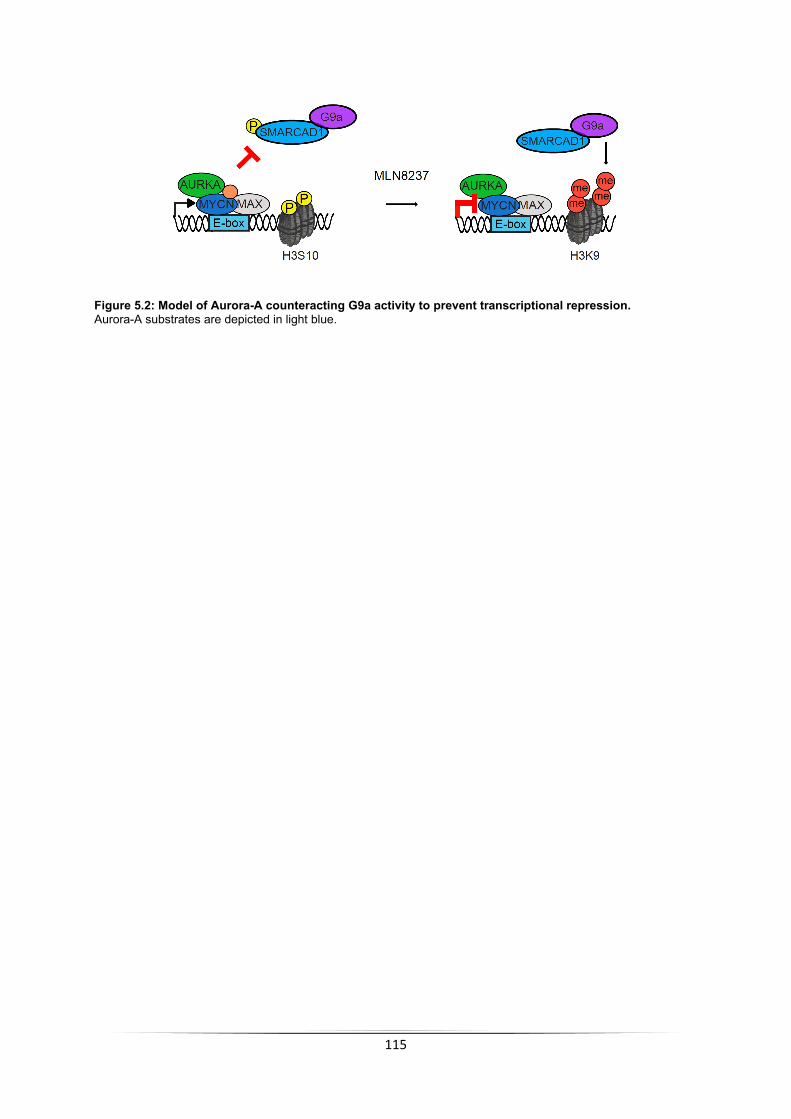
115
Figure 5.2: Model of Aurora-A counteracting G9a activity to prevent transcriptional repression. Aurora-A substrates are depicted in light blue.
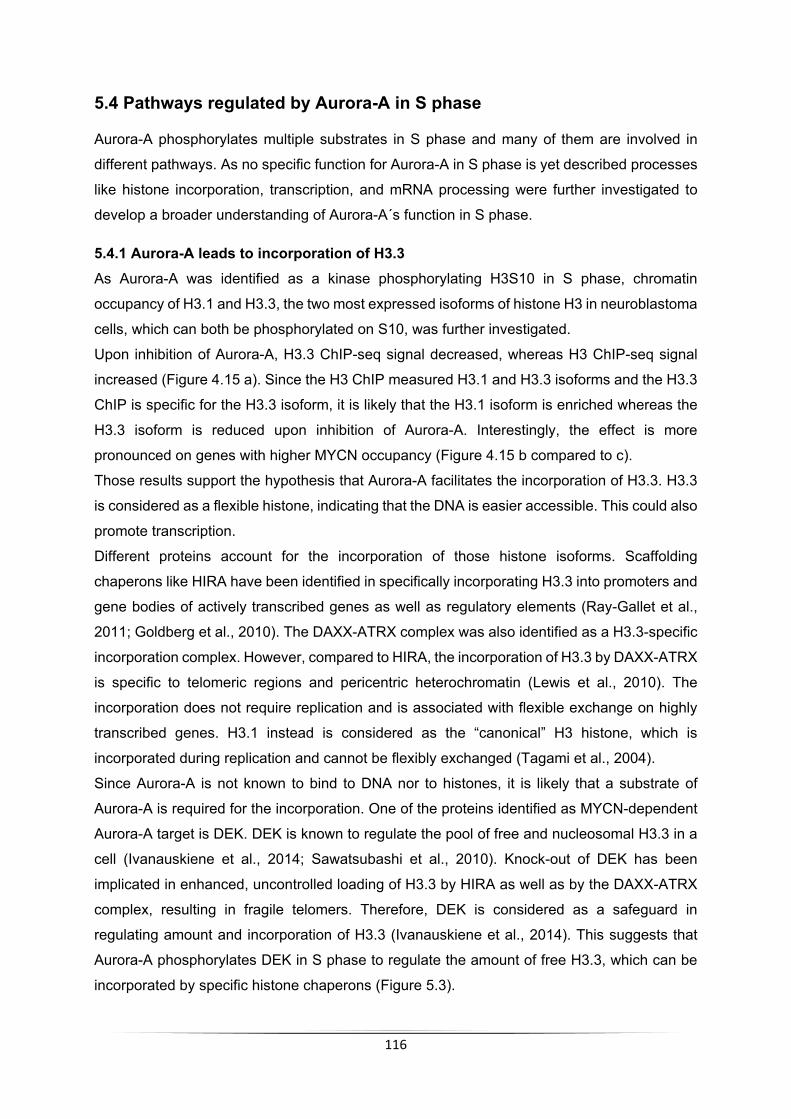
116
5.4 Pathways regulated by Aurora-A in S phase
Aurora-A phosphorylates multiple substrates in S phase and many of them are involved in
different pathways. As no specific function for Aurora-A in S phase is yet described processes
like histone incorporation, transcription, and mRNA processing were further investigated to
develop a broader understanding of Aurora-A´s function in S phase.
5.4.1 Aurora-A leads to incorporation of H3.3 As Aurora-A was identified as a kinase phosphorylating H3S10 in S phase, chromatin
occupancy of H3.1 and H3.3, the two most expressed isoforms of histone H3 in neuroblastoma
cells, which can both be phosphorylated on S10, was further investigated.
Upon inhibition of Aurora-A, H3.3 ChIP-seq signal decreased, whereas H3 ChIP-seq signal
increased (Figure 4.15 a). Since the H3 ChIP measured H3.1 and H3.3 isoforms and the H3.3
ChIP is specific for the H3.3 isoform, it is likely that the H3.1 isoform is enriched whereas the
H3.3 isoform is reduced upon inhibition of Aurora-A. Interestingly, the effect is more
pronounced on genes with higher MYCN occupancy (Figure 4.15 b compared to c).
Those results support the hypothesis that Aurora-A facilitates the incorporation of H3.3. H3.3
is considered as a flexible histone, indicating that the DNA is easier accessible. This could also
promote transcription.
Different proteins account for the incorporation of those histone isoforms. Scaffolding
chaperons like HIRA have been identified in specifically incorporating H3.3 into promoters and
gene bodies of actively transcribed genes as well as regulatory elements (Ray-Gallet et al.,
2011; Goldberg et al., 2010). The DAXX-ATRX complex was also identified as a H3.3-specific
incorporation complex. However, compared to HIRA, the incorporation of H3.3 by DAXX-ATRX
is specific to telomeric regions and pericentric heterochromatin (Lewis et al., 2010). The
incorporation does not require replication and is associated with flexible exchange on highly
transcribed genes. H3.1 instead is considered as the “canonical” H3 histone, which is
incorporated during replication and cannot be flexibly exchanged (Tagami et al., 2004).
Since Aurora-A is not known to bind to DNA nor to histones, it is likely that a substrate of
Aurora-A is required for the incorporation. One of the proteins identified as MYCN-dependent
Aurora-A target is DEK. DEK is known to regulate the pool of free and nucleosomal H3.3 in a
cell (Ivanauskiene et al., 2014; Sawatsubashi et al., 2010). Knock-out of DEK has been
implicated in enhanced, uncontrolled loading of H3.3 by HIRA as well as by the DAXX-ATRX
complex, resulting in fragile telomers. Therefore, DEK is considered as a safeguard in
regulating amount and incorporation of H3.3 (Ivanauskiene et al., 2014). This suggests that
Aurora-A phosphorylates DEK in S phase to regulate the amount of free H3.3, which can be
incorporated by specific histone chaperons (Figure 5.3).

117
The two MYCN-dependent Aurora-A substrates ATRX and ATAD2 have been identified as
histone chaperons. ATRX is a known H3.3 chaperone, but also ATAD2 was identified as a
histone chaperone for H3/H4 heterodimers (Cho et al., 2019). However, the preferred isoforms
for H3 or H4 were not further investigated. Therefore, phosphorylation of MYCN-activated
Aurora-A on ATAD2 or ATRX could contribute to the deposition of H3.3 to DNA (Figure 5.3).
All these hypotheses need further investigation.
Figure 5.3: Contribution of MYCN-activated Aurora-A substrates in H3.3 incorporation. Substrates are shown in light blue.
Besides this, ATRX is also a protein often found mutated in neuroblastoma (Cheung et al.,
2012). ATRX mutations almost-always lead to a truncation of the protein associated with loss
of function. Additionally, it was identified that ATRX mutations are mutually exclusive with
MYCN-amplification (Zeineldin et al., 2020), indicating a specific role for unperturbed ATRX
function upon high levels of MYCN.
ATRX positions H3.3 to prevent the formation of G-quadruplex (G4) structures, known to
interfere with transcription and replication (Clynes et al., 2013; Clynes & Gibbons, 2013). This
function of ATRX is specifically well reported at telomeres, which are associated with high G4
density (Clynes et al., 2015). However, G4 structures are also often found in promoters of
genes (Marsico et al., 2019). When transcription is enhanced by MYCN overexpression, it is
important to prevent the formation of those structures with could otherwise lead to problems
during transcription and replication. Therefore, the relevance of ATRX function upon MYCN-
amplification could very well fit to the model, that ATRX is a histone chaperone required to
deposit H3.3 into DNA after MYCN-dependent transcription.
5.4.2 Aurora-A inhibition impairs RNAPII function Another process in which some of the putative Aurora-A targets are involved is transcription.
Therefore, the influence of Aurora-A on the behavior of RNAPII in S phase was investigated.
To determine whether transcription is impacted a ChIP-seq of total RNAPII and elongating

118
RNAPII (RNAPII pSer2) upon Aurora-A inhibition was performed (Figure 4.16 and Figure 4.17).
Intriguingly, treatment with MLN8237 or MK5108 yielded slightly different results. MLN8237
induced a reduction of RNAPII occupancy throughout the gene body, whereas MK5108
increased the occupancy of RNAPII at the TSS and showed the comparable amount
throughout the gene body as the DMSO control. Importantly, both inhibitors resulted in a slower
transcription of RNAPII, indicated by the travelling ratio. H3S10 phosphorylation has been
implicated to promote pause-release of RNAPII (Jonkers & Lis, 2015; Ivaldi et al., 2007),
suggesting that the dynamics of phosphorylation of H3S10 by Aurora-A is linked to ongoing
transcription.
Aurora-A inhibition induced a re-distribution also of elongating RNAPII, with an increased
occupancy both at the TSS and throughout the gene body, indicating that elongating RNAPII
is stalling or slowing down. The accumulation at the TSS, correlates with a broad zone around
the first nucleosome, where the biggest effect is observed (Figure 4.17 c).
However, the TSS as well as the pause site, the first nucleosome, and the exon-intron
boundary are in proximity to each other, making distinction complicated (Cossa et al., 2020).
Since phosphorylated RNAPII was analyzed it is rather unlikely that the accumulation occurs
at the TSS. Additionally, the phosphorylation of RNAPII indicates that CDK9 is active ruling out
stalling at the pause site (Jonkers et al., 2014). Since there were effects on histone
incorporation as well as splicing observed it is also possible that the stalling or accumulation
of RNAPII occurs at the exon-intron boundary. However, the effects on global histone
incorporation were stronger than on global splicing and therefore it is reasonable to suggest
that the stalling occurs at the first nucleosome.
Furthermore, those effects were stratified by MYCN occupancy at the promoters. This analysis
revealed that on highly MYCN-bound genes the levels of RNAPII pSer2 increased and
consecutively the stalling effect is more pronounced. On genes with low MYCN occupancy,
there is no effect in RNAPII pSer2 signal. This is not surprising, as promoters bound by MYC
are also co-occupied by RNAPII and the genes are considered as highly transcribed (Walz et
al., 2014).
5.4.3 Aurora-A impacts RNA processing in S phase To investigate the impact of Aurora-A on gene expression in S phase, RNA-seq was
performed. Short-term treatment with Aurora-A inhibitor in S phase results in minor changes
in gene expression (Figure 4.18). RNA-seq measures the steady state level of mRNA
expression. Therefore, it is possible, that Aurora-A either does not influence expression of
genes or that the timepoint chosen was too short to investigate changes. mRNAs have a half-
life between 10 min and several hours (Shyu et al., 1989). Another information which can be

119
derived from RNA-seq data is whether alternative splicing occurs. Long-term inhibition of
Aurora-A has been implicated in regulating alternative splicing of proteins involved in apoptosis
(Moore et al., 2010). However, upon short-term Aurora-A inhibition no major changes in
alternative splicing occurred (data not shown).
Among the most affected phosphosites upon Aurora-A inhibition are several proteins involved
in RNA processing. Therefore, splicing activity upon Aurora-A inhibition was assessed.
The SF3B1 protein is hyper-phosphorylated during assembly of the active spliceosome and
phosphorylated SF3B1 is a marker for active splicing (Girard et al., 2012). Interestingly, Aurora-
A inhibition reduced SF3B1 phosphorylation by 50% in S phase (Figure 4.19). Other cell cycle
phases showed no change or a slight increase in spliceosome assembly upon Aurora-A
inhibition. To further elucidate whether spliceosome assembly is also functionally connected
to less spliced mRNA, nascent RNA was investigated upon Aurora-A inhibition. The positive
control PlaB showed the expected results, as splicing cannot occur and the PlaB-treated cells
mimic the pulse sample, which was also already previously described (Cossa et al., 2020).
Aurora-A inhibition results in a decrease of spliced and exonic reads and an increase in intronic
reads compared to the control. However, the result on global splicing was not as strong as
suggested by the results of phosphorylated SF3B1. Therefore, it is likely that Aurora-A does
not regulate all spliceosomes, indicating that not all genes are affected similarly.
So far, no stratification of genes which are most affected by Aurora-A inhibition was
determined. One possibility is that gene length plays a role whether or not the genes are
affected. Another option is that the gene function determines if the gene is still transcribed in
S phase and therefore affected by Aurora-A inhibition. It has been shown that in S phase two
main groups of genes are transcribed. The first group of genes is involved in DNA damage
response and the second group is required for progression of S phase (Meryet-Figuiere et al.,
2014). DNA damage genes are known to be long genes that have more exons and could be
therefore differently affected by Aurora-A inhibition (Krajewska et al., 2019). Besides this, the
longest genes have been shown to be transcribed throughout a whole cell cycle and harbor
hots spots of DNA breaks called common fragile sites, often associated with transcription-
replication conflicts and R-loop formation (Helmrich et al., 2011). So, stratification could indeed
reveal which genes are less spliced upon Aurora-A inhibition.
Splicing and transcription are processes which are coupled in a cell and splicing factors are
also known to directly interact with RNAPII (Lin et al., 2008). The majority of genes are at least
partially spliced already during transcription (Merkhofer et al., 2014). The two processes
regulate each other, as it is known that inhibition of transcription affects splicing but also that
impairment of splicing results in stalling of RNAPII at the first exon-intron boundary (Cossa et
al., 2020; Saldi et al., 2016). Additionally, knock-down of splicing factors results in reduced

120
transcription (Lin et al., 2008). Therefore, on the one hand Aurora-A´s impact on transcription
elongation indirectly accounts for the effects which were observed in splicing or on the other
hand it is also possible that Aurora-A directly regulates splicing. The latter possibility would be
supported by the observation that SF3B2 and DEK, two factors which were identified as
MYCN-dependent Aurora-A targets additionally have a strong implication to splicing.
DEK is known to interact with components of the spliceosome and is required for the proper
3´splice site choice (Kress & Guthrie, 2006). DEK could also regulate the observed phenotypes
in splicing. However, this is unlikely, as DEK has no role in spliceosome assembly, which is
disturbed upon inhibition of Aurora-A.
SF3B2 is part of the U2 spliceosomal subunit (Brosi et al., 1993) which is required for branch
point binding, assembly facilitation, and spliceosome activation (Sun, 2020). Recent work
showed that mutations in splicing factors result in stalled RNAPII and lead to the formation of
R-loops which as a consequence can activate ATR (Chen et al., 2018; Nguyen et al., 2018).
Knockdown of SF3B2 results in the activation of ATR more prominent than ATM (Figure 4.25).
Therefore, it is possible that MYCN-activated Aurora-A phosphorylates SF3B2 which results
in proper splicing and prevents stalling of RNAPII and R-loop formation. Therefore,
unphosphorylated SF3B2 could activate ATR. Indeed, inhibition of splicing using PlaB results
in stalling of RNAPII (Kindgren et al., 2019) as well as in increased R-loop formation (Roeschert
et al., 2021; Cossa et al., 2020). Whether these events could depend on SF3B2 will be subject
of further analyses (Figure 5.4).
Figure 5.4: Contribution of MYCN-activated Aurora-A substrates in splicing. Substrates are shown in light blue.
Besides the two putative targets of Aurora-A, Aurora-A itself can co-localize to nuclear
speckles, where splicing occurs. And several other factors like SRSF1, SRSF3, and SRSF7
which are also involved in splicing have been recently identified as Aurora-A targets in vitro
(Damodaran et al., 2020). Phosphosites of those proteins were also identified less
phosphorylated upon Aurora-A inhibition however not significantly downregulated with both
inhibitors (data not shown). A related protein SRSF5 was identified significantly less
phosphorylated with both Aurora-A inhibitors (Table 7.1). Therefore, it is also possible that

121
Aurora-A directly regulates splicing, which as consequence indirectly affects transcription
elongation.
Whether the effect of Aurora-A on splicing in S phase is direct or indirect remains elusive and
needs to be further investigated.
5.4.4 Aurora-A prevents transcription-replication conflicts Our previous work suggested that Aurora-A is involved in the establishment of transcription-
replication conflicts (Büchel et al., 2017). To prove this hypothesis, a PLA between PCNA and
total RNAPII, two major members of the replication and transcription machinery, respectively
was performed to investigate the occurrence of transcription-replication conflicts (Okamoto et
al., 2019). To ensure specificity, a technical control for this assay was conducted using only
single antibodies and this did not result in a measurable signal, indicating that the assay is
trustable.
Catalytic inhibition of Aurora-A using low doses of MLN8237 or MK5108 results in a 1.5-fold
increase in transcription-replication conflicts. Increasing MLN8237 concentrations (i.e., which
also leads to the disruption of the Aurora-A/MYCN complex) enhances the number of
transcription-replication conflicts, indicating that catalytic activity of Aurora-A is only partially
required for those conflicts. This is in line with the observation that the Aurora-A/MYCN
complex is required to recruit de-capping factors, leading to transcription termination
(Roeschert et al., 2021). Therefore, it is reasonable to suggest that disruption of the complex
formation enhances stalling of RNAPII which results in increased transcription-replication
conflicts.
As an internal control to show that transcription-replication conflicts need transcription to occur
two different CDK9 inhibitors were used. Flavopiridol which leads to a stalling of RNAPII on
nearly all genes (Chao & Price, 2001), as well as the more specific CDK9 inhibitor NVP-2
(Olson et al., 2018), result in a decreased number of transcription-replication conflicts. The
data indicate that active transcription is required to form those conflicts and that stalling of
RNAPII per se does not result in transcription-replication conflicts. However, it is also possible
that it is a stochiometric principle, since stalling of RNAPII upon inhibitor treatment, reduces
levels of RNAPII compared to unperturbed cells, the chance of a replication fork to collide with
a stalled RNAPII decreases. As seen with CRISPR knock-out of CDK9 results in stalling of
RNAPII and additionally prevents re-initiation of RNAPII, resulting in less RNAPII on chromatin
(Shao & Zeitlinger, 2017). This assay is therefore not able to clearly state whether active
transcription is needed to induce transcription-replication conflicts or not.
Recent work showed, that when the replication machinery is stalled, PCNA gets ubiquitinated
followed by its removal from chromatin by ATAD5 to initiate replication restart (Park et al.,
2019). The kinetics of this process remains to be elucidated. However, this can indicate that

122
the transcription-replication conflicts measured by PCNA with RNAPII underestimate the
number of conflicts that in fact occur. Since the attempt of solving the problem leads to the
removal of PCNA. One way of investigating this further, could be to perform the PLA between
other subunits of the replication machinery like RAD9 or RAD1 and RNAPII (Delacroix et al.,
2007).
Besides the observation of transcription-replication conflicts, Aurora-A inhibition also results in
the activation of ATR (Büchel et al., 2017; see 5.3.5) and the formation of R-loops (Roeschert
et al., 2021). Therefore, it is likely that the conflicts that occur are head-on collisions and not
co-transcriptional conflicts (Hamperl et al., 2017).
5.4.5 Aurora-A inhibition induces ATR activation It was already published that inhibition of Aurora-A induced ATR activation (Büchel et al.,
2017), but the underlying mechanisms remained elusive. Interestingly, ATR gets activated in
S phase only upon the addition of large amounts of Aurora-A inhibitor (Figure 4.21). As it is
known that low doses of MLN8237 are required to inhibit catalytic activity, whereas higher
doses are needed to disrupt the Aurora-A/MYCN complex (Brockmann et al., 2013), it is likely
that disruption of the Aurora-A/MYCN complex is required for the enhanced activation of ATR.
The function of ATR is to sense stressed and stalled replication forks (Saldivar et al., 2017).
Stalling of the replication fork can occur due to conflicts between transcription and replication
(Hamperl et al., 2017). Aurora-A inhibition induces transcription-replication conflicts (see 5.3.4)
and the number of conflicts increases using higher amounts of Aurora-A inhibitors which result
in disruption of the Aurora-A/MYCN complex.
Additionally, the requirement of high concentrations of Aurora-A inhibitor to activate ATR can
be explained by the basal activity of ATR in S phase, which is needed to quickly resolve
problems during replication that can occur mainly at common fragile sites (Casper et al., 2002).
Therefore, some stalled replication forks can easily be repaired by the already active ATR
kinases without resulting in measurable differences in ATR downstream targets (Cortez et al.,
2001). Only if the stalled replication forks exceed the capable number for already active ATR
kinases the difference is measurable. Therefore, it is likely that the effect is underestimated.
As Aurora-A/MYCN complex disruption also results in reduced fork progression, this could
explain why ATR activation is especially pronounced under these conditions (Roeschert et al.,
2021).
Additionally, two MYCN-dependent Aurora-A substrates ATAD2 and ATRX, have both been
shown to regulate replication. ATAD2 localizes to nascent DNA and is required for PCNA
loading (Koo et al., 2016). ATRX is involved in NHEJ as well as HR and prevents DNA damage
accompanied by replication fork progression (George et al., 2020; Huh et al., 2016;
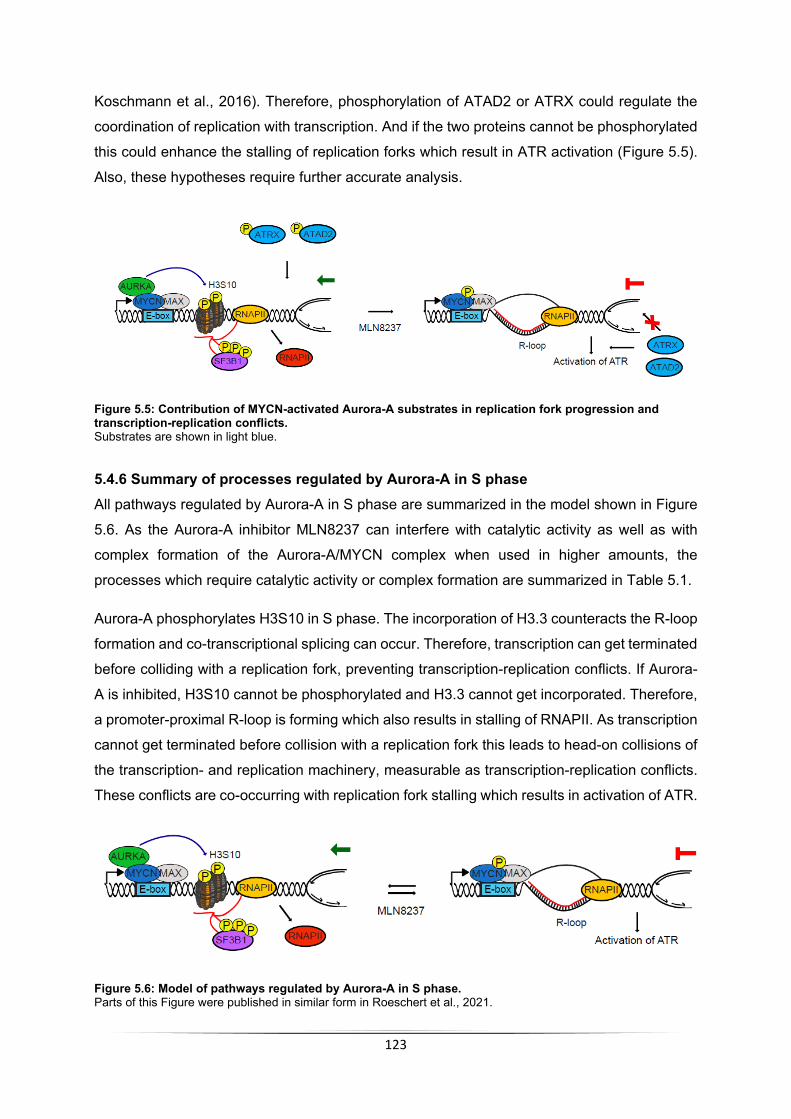
123
Koschmann et al., 2016). Therefore, phosphorylation of ATAD2 or ATRX could regulate the
coordination of replication with transcription. And if the two proteins cannot be phosphorylated
this could enhance the stalling of replication forks which result in ATR activation (Figure 5.5).
Also, these hypotheses require further accurate analysis.
Figure 5.5: Contribution of MYCN-activated Aurora-A substrates in replication fork progression and transcription-replication conflicts. Substrates are shown in light blue.
5.4.6 Summary of processes regulated by Aurora-A in S phase All pathways regulated by Aurora-A in S phase are summarized in the model shown in Figure
5.6. As the Aurora-A inhibitor MLN8237 can interfere with catalytic activity as well as with
complex formation of the Aurora-A/MYCN complex when used in higher amounts, the
processes which require catalytic activity or complex formation are summarized in Table 5.1.
Aurora-A phosphorylates H3S10 in S phase. The incorporation of H3.3 counteracts the R-loop
formation and co-transcriptional splicing can occur. Therefore, transcription can get terminated
before colliding with a replication fork, preventing transcription-replication conflicts. If Aurora-
A is inhibited, H3S10 cannot be phosphorylated and H3.3 cannot get incorporated. Therefore,
a promoter-proximal R-loop is forming which also results in stalling of RNAPII. As transcription
cannot get terminated before collision with a replication fork this leads to head-on collisions of
the transcription- and replication machinery, measurable as transcription-replication conflicts.
These conflicts are co-occurring with replication fork stalling which results in activation of ATR.
Figure 5.6: Model of pathways regulated by Aurora-A in S phase. Parts of this Figure were published in similar form in Roeschert et al., 2021.
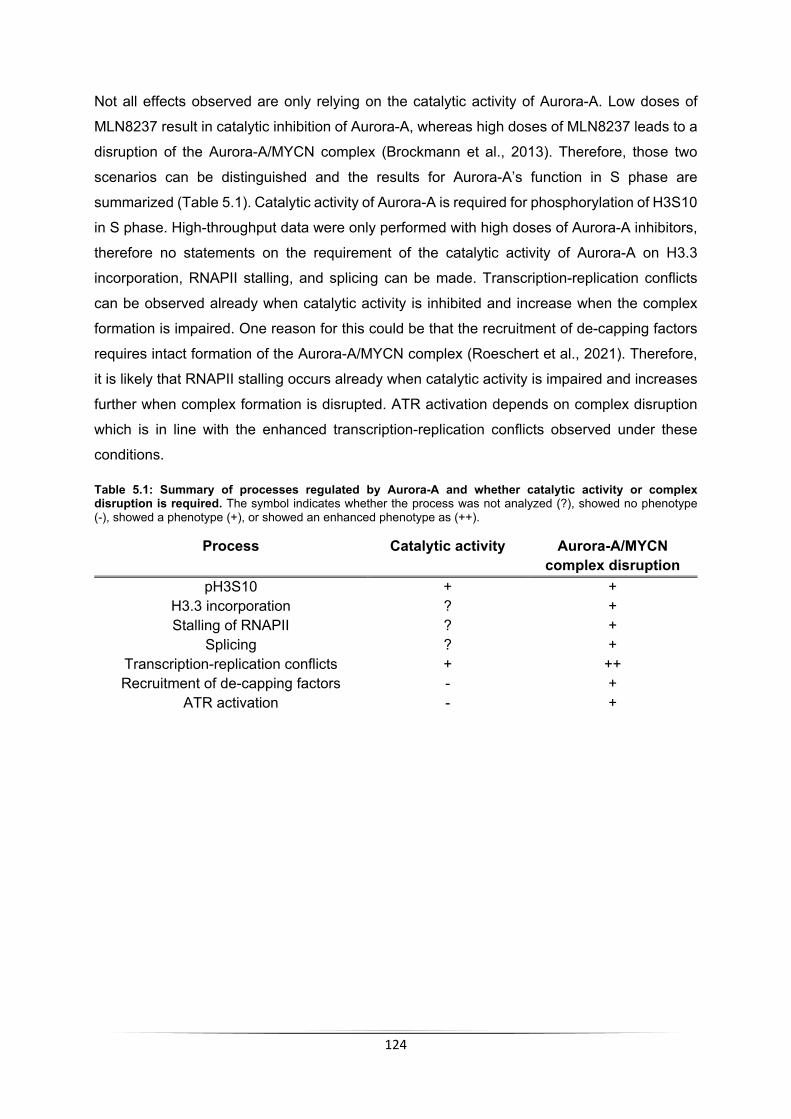
124
Not all effects observed are only relying on the catalytic activity of Aurora-A. Low doses of
MLN8237 result in catalytic inhibition of Aurora-A, whereas high doses of MLN8237 leads to a
disruption of the Aurora-A/MYCN complex (Brockmann et al., 2013). Therefore, those two
scenarios can be distinguished and the results for Aurora-A’s function in S phase are
summarized (Table 5.1). Catalytic activity of Aurora-A is required for phosphorylation of H3S10
in S phase. High-throughput data were only performed with high doses of Aurora-A inhibitors,
therefore no statements on the requirement of the catalytic activity of Aurora-A on H3.3
incorporation, RNAPII stalling, and splicing can be made. Transcription-replication conflicts
can be observed already when catalytic activity is inhibited and increase when the complex
formation is impaired. One reason for this could be that the recruitment of de-capping factors
requires intact formation of the Aurora-A/MYCN complex (Roeschert et al., 2021). Therefore,
it is likely that RNAPII stalling occurs already when catalytic activity is impaired and increases
further when complex formation is disrupted. ATR activation depends on complex disruption
which is in line with the enhanced transcription-replication conflicts observed under these
conditions.
Table 5.1: Summary of processes regulated by Aurora-A and whether catalytic activity or complex disruption is required. The symbol indicates whether the process was not analyzed (?), showed no phenotype (-), showed a phenotype (+), or showed an enhanced phenotype as (++).
Process Catalytic activity Aurora-A/MYCN complex disruption
pH3S10 + + H3.3 incorporation ? + Stalling of RNAPII ? +
Splicing ? + Transcription-replication conflicts + ++ Recruitment of de-capping factors - +
ATR activation - +

125
5.5 RNase H1 overexpression does not rescue Aurora-A inhibition
Aurora-A prevents head-on collisions of RNAPII and the replication machinery and interfering
with Aurora-A using siRNA as well as inhibitors results in an accumulation of R-loops at actively
transcribed genes (Roeschert et al., 2021). R-loops are RNA/DNA hybrids that can be
“unscheduled” which are potential genomic threats when not resolved or “regulatory” which
influence gene expression, transcription termination, DNA repair, and repair of short telomers
(Niehrs & Luke, 2020). R-loops can be resolved by helicases like SETX, DHX9, AQR, BLM
(reviewed in Crossley et al., 2019), or nucleases like RNase H1 that specifically degrades the
RNA in this hybrid (Nowotny et al., 2008).
Interestingly, expression of an inducible RNase H1 construct indicated that resolved R-loops
in S phase result in an increased incorporation of the histone H3.3, as measured by ChIP-seq
(Figure 4.22 c). Furthermore, ChIP-seqs of total RNAPII and RNAPII pSer2 revealed that
overexpression of RNase H1 results in the accumulation of total RNAPII as well as of RNAPII
pSer2 (Figure 4.23 a, c). While Aurora-A inhibition results in stalling of elongating RNAPII,
overexpression of RNase H1 mainly leads to accumulation of unphosphorylated RNAPII.
Therefore, the stalling upon R-loop removal occurs at the TSS, pause-site, exon-intron
boundary, or as suggested at the first nucleosome, as all those elements are in proximity to
each other (Cossa et al., 2020).
Aurora-A promotes, whereas R-loops counteract the deposition of H3.3. However, stabilization
of the first nucleosome can lead to stalling of RNAPII. In this view, Aurora-A can balance these
processes and its regulation has to be finely controlled. This could also explain why Aurora-A
is not phosphorylated in S phase (Figure 5.7).
Figure 5.7: Model how resolved R-loops interfere with pathways regulated by Aurora-A in S phase.

126
Additionally, overexpression of RNase H1 has no impact on the formation of transcription-
replication conflicts (Figure 4.23 d). Therefore, R-loops which can be removed by RNase H1
do not result in transcription-replication conflicts. Since RNase H1 does not remove all R-loop
structures it is possible that the helicases like SETX play a role in this process. SUMOylated
SETX can interact with the exosome facilitating the termination of nascent transcripts (Richard
et al., 2013). Additionally, recent data suggested that SETX is recruited by BRCA1 to DNA,
where the complex is required to resolve R-loop mediated DNA damage. This indicates a
regulatory function of SETX in transcription termination (Hatchi et al., 2015). To fully exclude
that R-loops play a role in transcription-replication conflicts, SETX and the other helicases
would need to be tested.
Considering that the combinatorial treatment results in an increase of apoptotic cells, the
dependence of the phenotype on R-loops was assessed (Figure 4.29 a). RNase H1
overexpression did not result in a decreased amount of apoptosis. Therefore, R-loops seem
not to be the driving force for cells to undergo apoptosis. Additionally, no change in cell cycle
speed or arrest was observed upon induction of R-loops, indicating that R-loop formation
resolved by RNase H1 does also not change cell cycle speed (Figure 4.29 b).

127
5.6 Improved therapeutic options for MYCN-amplified neuroblastoma
Aurora-A was originally found in a synthetic lethality screen of MYCN-amplified neuroblastoma,
where it is required to maintain MYCN levels (Otto et al., 2009), indicating a critical role for
Aurora-A in neuroblastoma. Treatment of neuroblastoma in mice with MLN8237 showed
reduced tumor growth and an increase in overall survival (Brockmann et al., 2013). However,
due to the dose-limiting toxicity the treatment had massive side-effects. Therefore, an
improved therapy using synergistic drugs would be beneficial, as side-effects and drug toxicity
could be reduced.
5.6.1 Combined Aurora-A and ATR inhibition As Aurora-A inhibition results in transcription-replication conflicts which activate the kinase
ATR, MYCN-amplified neuroblastoma cells were treated with Aurora-A and ATR inhibitors
(Figure 4.26). This treatment resulted in a decreased cell number and correlated both to G2/M
phase arrest and apoptosis potentiation upon combinatorial treatment.
The apoptosis assay was performed in three MYCN non-amplified and three MYCN-amplified
cell lines, revealing that the observed apoptosis upon Aurora-A and combinatorial inhibition is
MYCN-specific (Figure 4.27 a). Consistently, synergism (according to the Bliss method)
between Aurora-A and ATR inhibitor could only be seen in MYCN-amplified neuroblastoma
cell lines (Table 7.2). This was verified with another Aurora-A inhibitor, MK5108 (Figure 4.27
b). The combination of MK5108 with AZD6738 also significantly increased the number of
apoptotic cells, revealing that both Aurora-A inhibitors together with ATR inhibitor resulted in
synergism in MYCN-amplified neuroblastoma. To further validate that this effect is Aurora-A-
specific, genetic validation experiments were performed (Figure 4.27 d). Aurora-A WT
overexpression resulted in decreased apoptosis upon Aurora-A inhibition, while Aurora-A
T217D mutant was resistant to MLN8237-treatment (Brockmann et al., 2013). Therefore,
inhibition with MLN8237 did not show any apoptosis and only a slight increase in apoptosis
upon combinatorial treatment. However, this slight increase does not reflect synergism.
To further validate that this effect is ATR-dependent, CHK1 (a downstream target of ATR) was
inhibited (Liu et al., 2000). CHK1 inhibition resulted in an increased apoptosis after 48 h. The
combinatorial inhibition after 24 h resulted in a synergistic increase in apoptosis. After 48 h no
synergism was observed, which is possible due to the high amounts of apoptosis in the single
agent treatment. To verify that this is a synergistic effect more experiments with different
concentration of both inhibitors would be needed. As for 24 h a slightly synergistic effect could
be observed it is likely that with optimization the two inhibitors show synergism.
Together, the results indicate that the combination of Aurora-A and ATR inhibitor, showed
synergism in MYCN-amplified neuroblastoma cells. This synergism is Aurora-A- and ATR-

128
specific, as different inhibitors, genetic interference, and downstream targets revealed similar
results. However, the molecular mechanism for the apoptosis induction remains unclear. It is
conceivable that cells accumulate damage during S phase, due to the transcription-replication
conflicts, which are usually repaired by the function of ATR. It is possible, that if both proteins
cannot fulfill their jobs, this can induce pro-apoptotic proteins which result in the increased
apoptosis observed.
This indicates that indeed this combination enables a therapeutic window. As shown in
Roeschert et al. (2021), the combinatorial therapy results in a decreased tumor burden and a
prolonged survival of all treated mice. Additionally, 25% of the mice were cured from
neuroblastoma.
5.6.2 Combined Aurora-A and PARP1 inhibition Similarly to ATR, PARP1 is activated at stalled replication forks to stabilize them in response
to replication stress (Ronson et al., 2018). PARP1 is active during S phase and interacts with
the replication machinery (Dantzer et al., 1998). To investigate whether PARP1 and ATR have
similar functions also in addition to Aurora-A inhibition the effect of PARP1 inhibition on MYCN-
amplified neuroblastoma cells was further assessed.
Like MLN8237 (Figure 4.27), the PARP1 inhibitor Olaparib results in an increased number of
transcription-replication conflicts (Figure 4.30 a). As PARP1 is implicated in regulating
transcription as well as replication, it is not surprising that inhibition of this protein may result
in unregulated transcription and replication which leads to the formation of such conflicts
(Kraus & Lis, 2003).
As a next step the effect of combinatorial inhibition of PARP1 and Aurora-A on apoptosis of
MYCN-amplified neuroblastoma cells was investigated (Figure 4.30 b). Even though there is
no synergistic effect in this experiment (Table 7.2), treatment for 48 h increases apoptosis for
all single agents, which is in line with literature (King et al., 2020) and even more cells undergo
apoptosis when treated with both inhibitors. To clearly investigate synergism, both inhibitors
need to be tested with various concentrations.
The combination was also tested in TH-MYCN mice and revealed a decrease in tumor growth
and increased number of apoptotic cells (Roeschert et al., 2021). This indicated that also
combinatorial inhibition of Aurora-A and PARP1 could constitute a therapeutic window for
MYCN-amplified neuroblastoma.
PARP1 inhibitors are already in clinical trials for several types of cancer, including prostate,
pancreatic, and breast cancer (reviewed in Slade, 2020). PARP1 inhibition is especially
beneficial in cancers with elevated replication stress as seen for cancer types with mutated
proteins in DNA repair pathways (e.g., BRCA1 or BRCA2). As Aurora-A leads to increased
129
replication stress, which synergizes with PARP1 inhibition, this is in line with published data
that it enables benefits for tumor therapy (Pillay et al., 2019).
5.6.3 Clinical relevance of findings on therapy of neuroblastoma patients So far, the standard of care therapy for neuroblastoma is chemotherapy using a mix of several
chemotherapeutics (American Cancer Society). Targeted cancer therapy could be beneficial
for patients for the following reasons:
First, there is genomic evidence that targeting Aurora-A could be beneficial for tumor treatment
since overexpression of Aurora-A correlates with a poor prognosis of neuroblastoma patients
(Shang et al., 2009). Thus, elevated Aurora-A levels contribute to several non-mitotic roles of
the kinase not observed under physiological conditions (Pugacheva et al., 2007). This would
indicate that targeting non-physiological functions of Aurora-A could reduce the off-target
effects for non-cancer cells.
Second, Aurora-A was identified in a synthetic lethality screen for MYCN-amplified tumors
(Otto et al., 2009), indicating that Aurora-A is especially important for the survival of MYCN-
amplified cells. As MYCN is even in children usually not expressed in most tissues (Knoepfler
et al., 2002), this is an additional hint that mainly cancer cells would be affected by the
treatment.
Third, the side-effects for chemotherapy are enormous (American Cancer Society). Especially,
fast proliferating cells are targeted by chemotherapy like immune cells. Besides this fact,
neuroblastoma patients are very young and most of their stem cells from different origins are
proliferating in order to organize organ or body growth (Williams et al., 2006). Besides the side-
effects in targeting also other fast proliferating cells, it is also very well reported that
chemotherapy is able to induce new mutations which could further lead to other types of cancer
or malignancies (Fruman & O'Brien, 2017).
Fourth, using a synergistic approach enables the reduction of amount of inhibitor used to a
degree, where side-effects from single agent treatment is minimized (Roeschert et al., 2021).
Fifth, the combinatorial treatment resulted in an arrest of cells in G2/M phase. Problems during
replication can accumulate mutations which lead to chromosomal instability. Chromosomal
instability as well as the ability to exit mitosis can result in massive chromosome
rearrangements which lead to genomic complexity of a tumor (Umbreit et al., 2020). Thus, the
arrest of cells in G2/M phase is beneficial since chromosome instability cannot result in
heterogeneity of tumors which enable tolerance to anti-cancer treatments.
Therefore, targeted therapy for neuroblastoma patients using Aurora-A and ATR or PARP1
inhibitors is a valuable new approach which could be beneficial for patients.

130
6 Bibliography Abid Ali, F., Douglas, M. E., Locke, J., Pye, V. E., Nans, A., Diffley, J. F. X., & Costa, A. (2017).
Cryo-EM structure of a licensed DNA replication origin. Nat Commun, 8(1), 2241. doi:10.1038/s41467-017-02389-0
Adhikari, B., Bozilovic, J., Diebold, M., Schwarz, J. D., Hofstetter, J., Schroder, M., . . . Wolf, E. (2020). PROTAC-mediated degradation reveals a non-catalytic function of AURORA-A kinase. Nat Chem Biol. doi:10.1038/s41589-020-00652-y
Akhtar, M. S., Heidemann, M., Tietjen, J. R., Zhang, D. W., Chapman, R. D., Eick, D., & Ansari, A. Z. (2009). TFIIH kinase places bivalent marks on the carboxy-terminal domain of RNA polymerase II. Mol Cell, 34(3), 387-393. doi:10.1016/j.molcel.2009.04.016
Alfieri, C., Zhang, S., & Barford, D. (2017). Visualizing the complex functions and mechanisms of the anaphase promoting complex/cyclosome (APC/C). Open Biol, 7(11). doi:10.1098/rsob.170204
American Cancer Society: URL: http//www.cancer.org/ : (01.12.2020) American Cancer Society (2014): Special Section: Cancer in Children & Adolescents. Cancer
Facts & Figures 2014, pp 25-42. Amin, M., Minton, S. E., LoRusso, P. M., Krishnamurthi, S. S., Pickett, C. A., Lunceford, J., . .
. Lockhart, A. C. (2016). A phase I study of MK-5108, an oral aurora a kinase inhibitor, administered both as monotherapy and in combination with docetaxel, in patients with advanced or refractory solid tumors. Invest New Drugs, 34(1), 84-95. doi:10.1007/s10637-015-0306-7
Arnold, H. K., & Sears, R. C. (2006). Protein phosphatase 2A regulatory subunit B56alpha associates with c-myc and negatively regulates c-myc accumulation. Mol Cell Biol, 26(7), 2832-2844. doi:10.1128/MCB.26.7.2832-2844.2006
Asghar, U., Witkiewicz, A. K., Turner, N. C., & Knudsen, E. S. (2015). The history and future of targeting cyclin-dependent kinases in cancer therapy. Nat Rev Drug Discov, 14(2), 130-146. doi:10.1038/nrd4504
Atchley, W. R., & Fitch, W. M. (1995). Myc and Max: molecular evolution of a family of proto-oncogene products and their dimerization partner. Proc Natl Acad Sci U S A, 92(22), 10217-10221. doi:10.1073/pnas.92.22.10217
Aygun, O., Svejstrup, J., & Liu, Y. (2008). A RECQ5-RNA polymerase II association identified by targeted proteomic analysis of human chromatin. Proc Natl Acad Sci U S A, 105(25), 8580-8584. doi:10.1073/pnas.0804424105
Bachetti, T., Di Paolo, D., Di Lascio, S., Mirisola, V., Brignole, C., Bellotti, M., . . . Perri, P. (2010). PHOX2B-mediated regulation of ALK expression: in vitro identification of a functional relationship between two genes involved in neuroblastoma. PLoS One, 5(10). doi:10.1371/journal.pone.0013108
Baluapuri, A., Wolf, E., & Eilers, M. (2020). Target gene-independent functions of MYC oncoproteins. Nat Rev Mol Cell Biol, 21(5), 255-267. doi:10.1038/s41580-020-0215-2
Bannister, A. J., & Kouzarides, T. (2011). Regulation of chromatin by histone modifications. Cell Res, 21(3), 381-395. doi:10.1038/cr.2011.22
Barr, P. M., Li, H., Spier, C., Mahadevan, D., LeBlanc, M., Ul Haq, M., . . . Friedberg, J. W. (2015). Phase II Intergroup Trial of Alisertib in Relapsed and Refractory Peripheral T-Cell Lymphoma and Transformed Mycosis Fungoides: SWOG 1108. J Clin Oncol, 33(21), 2399-2404. doi:10.1200/JCO.2014.60.6327
Batty, P., & Gerlich, D. W. (2019). Mitotic Chromosome Mechanics: How Cells Segregate Their Genome. Trends Cell Biol, 29(9), 717-726. doi:10.1016/j.tcb.2019.05.007
Bavetsias, V., & Linardopoulos, S. (2015). Aurora Kinase Inhibitors: Current Status and Outlook. Front Oncol, 5, 278. doi:10.3389/fonc.2015.00278
Bellanger, J. M., & Gonczy, P. (2003). TAC-1 and ZYG-9 form a complex that promotes microtubule assembly in C. elegans embryos. Curr Biol, 13(17), 1488-1498. doi:10.1016/s0960-9822(03)00582-7
131
Benson, E. K., Mungamuri, S. K., Attie, O., Kracikova, M., Sachidanandam, R., Manfredi, J. J., & Aaronson, S. A. (2014). p53-dependent gene repression through p21 is mediated by recruitment of E2F4 repression complexes. Oncogene, 33(30), 3959-3969. doi:10.1038/onc.2013.378
Bentley, D. L. (2014). Coupling mRNA processing with transcription in time and space. Nat Rev Genet, 15(3), 163-175. doi:10.1038/nrg3662
Bernstein, B. E., Humphrey, E. L., Erlich, R. L., Schneider, R., Bouman, P., Liu, J. S., . . . Schreiber, S. L. (2002). Methylation of histone H3 Lys 4 in coding regions of active genes. Proc Natl Acad Sci U S A, 99(13), 8695-8700. doi:10.1073/pnas.082249499
Bertolin, G., Bulteau, A. L., Alves-Guerra, M. C., Burel, A., Lavault, M. T., Gavard, O., . . . Tramier, M. (2018). Aurora kinase A localises to mitochondria to control organelle dynamics and energy production. Elife, 7. doi:10.7554/eLife.38111
Bertolin, G., & Tramier, M. (2020). Insights into the non-mitotic functions of Aurora kinase A: more than just cell division. Cell Mol Life Sci, 77(6), 1031-1047. doi:10.1007/s00018-019-03310-2
Blackwell, T. K., Kretzner, L., Blackwood, E. M., Eisenman, R. N., & Weintraub, H. (1990). Sequence-specific DNA binding by the c-Myc protein. Science, 250(4984), 1149-1151. doi:10.1126/science.2251503
Boeva, V., Louis-Brennetot, C., Peltier, A., Durand, S., Pierre-Eugene, C., Raynal, V., . . . Janoueix-Lerosey, I. (2017). Heterogeneity of neuroblastoma cell identity defined by transcriptional circuitries. Nat Genet, 49(9), 1408-1413. doi:10.1038/ng.3921
Bolstad, B. M., Irizarry, R. A., Astrand, M., & Speed, T. P. (2003). A comparison of normalization methods for high density oligonucleotide array data based on variance and bias. Bioinformatics, 19(2), 185-193. doi:10.1093/bioinformatics/19.2.185
Boos, D., Frigola, J., & Diffley, J. F. (2012). Activation of the replicative DNA helicase: breaking up is hard to do. Curr Opin Cell Biol, 24(3), 423-430. doi:10.1016/j.ceb.2012.01.011
Bourdeaut, F., Trochet, D., Janoueix-Lerosey, I., Ribeiro, A., Deville, A., Coz, C., . . . Delattre, O. (2005). Germline mutations of the paired-like homeobox 2B (PHOX2B) gene in neuroblastoma. Cancer Lett, 228(1-2), 51-58. doi:10.1016/j.canlet.2005.01.055
Bown, N., Cotterill, S., Lastowska, M., O'Neill, S., Pearson, A. D., Plantaz, D., . . . Van Roy, N. (1999). Gain of chromosome arm 17q and adverse outcome in patients with neuroblastoma. N Engl J Med, 340(25), 1954-1961. doi:10.1056/NEJM199906243402504
Brockmann, M., Poon, E., Berry, T., Carstensen, A., Deubzer, H. E., Rycak, L., . . . Eilers, M. (2013). Small molecule inhibitors of aurora-a induce proteasomal degradation of N-myc in childhood neuroblastoma. Cancer Cell, 24(1), 75-89. doi:10.1016/j.ccr.2013.05.005
Brosi, R., Gröning, K., Behrens, S. E., Lührmann, R., & Krämer, A. (1993). Interaction of mammalian splicing factor SF3a with U2 snRNP and relation of its 60-kD subunit to yeast PRP9. Science, 262(5130), 102-105. doi:10.1126/science.8211112
Büchel, G., Carstensen, A., Mak, K. Y., Roeschert, I., Leen, E., Sumara, O., . . . Eilers, M. (2017). Association with Aurora-A Controls N-MYC-Dependent Promoter Escape and Pause Release of RNA Polymerase II during the Cell Cycle. Cell Rep, 21(12), 3483-3497. doi:10.1016/j.celrep.2017.11.090
Cadoret, J. C., Meisch, F., Hassan-Zadeh, V., Luyten, I., Guillet, C., Duret, L., . . . Prioleau, M. N. (2008). Genome-wide studies highlight indirect links between human replication origins and gene regulation. Proc Natl Acad Sci U S A, 105(41), 15837-15842. doi:10.1073/pnas.0805208105
Callan, H. G. (1974). DNA replication in the chromosomes of eukaryotes. Cold Spring Harb Symp Quant Biol, 38, 195-203. doi:10.1101/sqb.1974.038.01.023
Caren, H., Kryh, H., Nethander, M., Sjoberg, R. M., Trager, C., Nilsson, S., . . . Martinsson, T. (2010). High-risk neuroblastoma tumors with 11q-deletion display a poor prognostic, chromosome instability phenotype with later onset. Proc Natl Acad Sci U S A, 107(9), 4323-4328. doi:10.1073/pnas.0910684107
132
Carlsen, N. L. (1990). The new International Neuroblastoma Staging System: some critical notes. J Clin Oncol, 8(5), 935-936. doi:10.1200/JCO.1990.8.5.935
Casper, A. M., Nghiem, P., Arlt, M. F., & Glover, T. W. (2002). ATR regulates fragile site stability. Cell, 111(6), 779-789. doi:10.1016/s0092-8674(02)01113-3
Chacon Simon, S., Wang, F., Thomas, L. R., Phan, J., Zhao, B., Olejniczak, E. T., . . . Fesik, S. W. (2020). Discovery of WD Repeat-Containing Protein 5 (WDR5)-MYC Inhibitors Using Fragment-Based Methods and Structure-Based Design. J Med Chem, 63(8), 4315-4333. doi:10.1021/acs.jmedchem.0c00224
Chan, C. S., & Botstein, D. (1993). Isolation and characterization of chromosome-gain and increase-in-ploidy mutants in yeast. Genetics, 135(3), 677-691. Retrieved from https://www.ncbi.nlm.nih.gov/pubmed/8293973
Chao, S. H., & Price, D. H. (2001). Flavopiridol inactivates P-TEFb and blocks most RNA polymerase II transcription in vivo. J Biol Chem, 276(34), 31793-31799. doi:10.1074/jbc.M102306200
Charron, J., Malynn, B. A., Fisher, P., Stewart, V., Jeannotte, L., Goff, S. P., . . . Alt, F. W. (1992). Embryonic lethality in mice homozygous for a targeted disruption of the N-myc gene. Genes Dev, 6(12A), 2248-2257. doi:10.1101/gad.6.12a.2248
Chen, E. Y., Tan, C. M., Kou, Y., Duan, Q., Wang, Z., Meirelles, G. V., . . . Ma'ayan, A. (2013). Enrichr: interactive and collaborative HTML5 gene list enrichment analysis tool. BMC Bioinformatics, 14, 128. doi:10.1186/1471-2105-14-128
Chen, H., Liu, H., & Qing, G. (2018). Targeting oncogenic Myc as a strategy for cancer treatment. Signal Transduct Target Ther, 3, 5. doi:10.1038/s41392-018-0008-7
Chen, L., Chen, J. Y., Huang, Y. J., Gu, Y., Qiu, J., Qian, H., . . . Fu, X. D. (2018). The Augmented R-Loop Is a Unifying Mechanism for Myelodysplastic Syndromes Induced by High-Risk Splicing Factor Mutations. Mol Cell, 69(3), 412-425.e416. doi:10.1016/j.molcel.2017.12.029
Chen, Y., Takita, J., Choi, Y. L., Kato, M., Ohira, M., Sanada, M., . . . Ogawa, S. (2008). Oncogenic mutations of ALK kinase in neuroblastoma. Nature, 455(7215), 971-974. doi:10.1038/nature07399
Cheng, M., Olivier, P., Diehl, J. A., Fero, M., Roussel, M. F., Roberts, J. M., & Sherr, C. J. (1999). The p21(Cip1) and p27(Kip1) CDK 'inhibitors' are essential activators of cyclin D-dependent kinases in murine fibroblasts. EMBO J, 18(6), 1571-1583. doi:10.1093/emboj/18.6.1571
Cheung, N. K., Zhang, J., Lu, C., Parker, M., Bahrami, A., Tickoo, S. K., . . . St Jude Children's Research Hospital-Washington University Pediatric Cancer Genome, P. (2012). Association of age at diagnosis and genetic mutations in patients with neuroblastoma. JAMA, 307(10), 1062-1071. doi:10.1001/jama.2012.228
Cheung, P., Allis, C. D., & Sassone-Corsi, P. (2000). Signaling to chromatin through histone modifications. Cell, 103(2), 263-271. doi:10.1016/s0092-8674(00)00118-5
Chipumuro, E., Marco, E., Christensen, C. L., Kwiatkowski, N., Zhang, T., Hatheway, C. M., . . . George, R. E. (2014). CDK7 inhibition suppresses super-enhancer-linked oncogenic transcription in MYCN-driven cancer. Cell, 159(5), 1126-1139. doi:10.1016/j.cell.2014.10.024
Cho, C., Jang, J., Kang, Y., Watanabe, H., Uchihashi, T., Kim, S. J., . . . Song, J. J. (2019). Structural basis of nucleosome assembly by the Abo1 AAA+ ATPase histone chaperone. Nat Commun, 10(1), 5764. doi:10.1038/s41467-019-13743-9
Choi, S. H., Wright, J. B., Gerber, S. A., & Cole, M. D. (2010). Myc protein is stabilized by suppression of a novel E3 ligase complex in cancer cells. Genes Dev, 24(12), 1236-1241. doi:10.1101/gad.1920310
Ciró, M., Prosperini, E., Quarto, M., Grazini, U., Walfridsson, J., McBlane, F., . . . Helin, K. (2009). ATAD2 is a novel cofactor for MYC, overexpressed and amplified in aggressive tumors. Cancer Res, 69(21), 8491-8498. doi:10.1158/0008-5472.Can-09-2131
133
Clynes, D., Jelinska, C., Xella, B., Ayyub, H., Scott, C., Mitson, M., . . . Gibbons, R. J. (2015). Suppression of the alternative lengthening of telomere pathway by the chromatin remodelling factor ATRX. Nat Commun, 6, 7538. doi:10.1038/ncomms8538
Clynes, D., & Gibbons, R. J. (2013). ATRX and the replication of structured DNA. Curr Opin Genet Dev, 23(3), 289-294. doi:10.1016/j.gde.2013.01.005
Clynes, D., Higgs, D. R., & Gibbons, R. J. (2013). The chromatin remodeller ATRX: a repeat offender in human disease. Trends Biochem Sci, 38(9), 461-466. doi:10.1016/j.tibs.2013.06.011
Cohn, S. L., Pearson, A. D., London, W. B., Monclair, T., Ambros, P. F., Brodeur, G. M., . . . Force, I. T. (2009). The International Neuroblastoma Risk Group (INRG) classification system: an INRG Task Force report. J Clin Oncol, 27(2), 289-297. doi:10.1200/JCO.2008.16.6785
Compe, E., & Egly, J. M. (2012). TFIIH: when transcription met DNA repair. Nat Rev Mol Cell Biol, 13(6), 343-354. doi:10.1038/nrm3350
Cortez, D., Guntuku, S., Qin, J., & Elledge, S. J. (2001). ATR and ATRIP: partners in checkpoint signaling. Science, 294(5547), 1713-1716. doi:10.1126/science.1065521
Cowling, V. H., Chandriani, S., Whitfield, M. L., & Cole, M. D. (2006). A conserved Myc protein domain, MBIV, regulates DNA binding, apoptosis, transformation, and G2 arrest. Mol Cell Biol, 26(11), 4226-4239. doi:10.1128/MCB.01959-05
Cossa, G., Roeschert, I., Prinz, F., Baluapuri, A., Silveira Vidal, R., Schulein-Volk, C., . . . Eilers, M. (2020). Localized Inhibition of Protein Phosphatase 1 by NUAK1 Promotes Spliceosome Activity and Reveals a MYC-Sensitive Feedback Control of Transcription. Mol Cell, 77(6), 1322-1339 e1311. doi:10.1016/j.molcel.2020.01.008
Cox, J., Hein, M. Y., Luber, C. A., Paron, I., Nagaraj, N., & Mann, M. (2014). Accurate proteome-wide label-free quantification by delayed normalization and maximal peptide ratio extraction, termed MaxLFQ. Mol Cell Proteomics, 13(9), 2513-2526. doi:10.1074/mcp.M113.031591
Creixell, P., Schoof, E. M., Simpson, C. D., Longden, J., Miller, C. J., Lou, H. J., . . . Linding, R. (2015). Kinome-wide decoding of network-attacking mutations rewiring cancer signaling. Cell, 163(1), 202-217. doi:10.1016/j.cell.2015.08.056
Crosio, C., Fimia, G. M., Loury, R., Kimura, M., Okano, Y., Zhou, H., . . . Sassone-Corsi, P. (2002). Mitotic phosphorylation of histone H3: spatio-temporal regulation by mammalian Aurora kinases. Mol Cell Biol, 22(3), 874-885. doi:10.1128/mcb.22.3.874-885.2002
Crossley, M. P., Bocek, M., & Cimprich, K. A. (2019). R-Loops as Cellular Regulators and Genomic Threats. Mol Cell, 73(3), 398-411. doi:10.1016/j.molcel.2019.01.024
Damodaran, A. P., Gavard, O., Gagné, J.-P., Rogalska, M. E., Mancini, E., Courtheoux, T., . . . Prigent, C. (2020). Aurora-A phosphorylates splicing factors and regulates alternative splicing. In: bioRxiv.
Dantzer, F., Nasheuer, H. P., Vonesch, J. L., de Murcia, G., & Ménissier-de Murcia, J. (1998). Functional association of poly(ADP-ribose) polymerase with DNA polymerase alpha-primase complex: a link between DNA strand break detection and DNA replication. Nucleic Acids Res, 26(8), 1891-1898. doi:10.1093/nar/26.8.1891
Dauch, D., Rudalska, R., Cossa, G., Nault, J. C., Kang, T. W., Wuestefeld, T., . . . Zender, L. (2016). A MYC-aurora kinase A protein complex represents an actionable drug target in p53-altered liver cancer. Nat Med, 22(7), 744-753. doi:10.1038/nm.4107
Davis, A. C., Wims, M., Spotts, G. D., Hann, S. R., & Bradley, A. (1993). A null c-myc mutation causes lethality before 10.5 days of gestation in homozygotes and reduced fertility in heterozygous female mice. Genes Dev, 7(4), 671-682. doi:10.1101/gad.7.4.671
Delacroix, S., Wagner, J. M., Kobayashi, M., Yamamoto, K., & Karnitz, L. M. (2007). The Rad9-Hus1-Rad1 (9-1-1) clamp activates checkpoint signaling via TopBP1. Genes Dev, 21(12), 1472-1477. doi:10.1101/gad.1547007

134
Delmore, J. E., Issa, G. C., Lemieux, M. E., Rahl, P. B., Shi, J., Jacobs, H. M., . . . Mitsiades, C. S. (2011). BET bromodomain inhibition as a therapeutic strategy to target c-Myc. Cell, 146(6), 904-917. doi:10.1016/j.cell.2011.08.017
den Hollander, J., Rimpi, S., Doherty, J. R., Rudelius, M., Buck, A., Hoellein, A., . . . Keller, U. (2010). Aurora kinases A and B are up-regulated by Myc and are essential for maintenance of the malignant state. Blood, 116(9), 1498-1505. doi:10.1182/blood-2009-11-251074
DePamphilis, M. L. (1993). Origins of DNA replication in metazoan chromosomes. J Biol Chem, 268(1), 1-4. Retrieved from https://www.ncbi.nlm.nih.gov/pubmed/8416916
Devaiah, B. N., Case-Borden, C., Gegonne, A., Hsu, C. H., Chen, Q., Meerzaman, D., . . . Singer, D. S. (2016). BRD4 is a histone acetyltransferase that evicts nucleosomes from chromatin. Nat Struct Mol Biol, 23(6), 540-548. doi:10.1038/nsmb.3228
Dewar, J. M., & Walter, J. C. (2017). Mechanisms of DNA replication termination. Nat Rev Mol Cell Biol, 18(8), 507-516. doi:10.1038/nrm.2017.42
Dimitrova, D. S., & Gilbert, D. M. (1999). The spatial position and replication timing of chromosomal domains are both established in early G1 phase. Mol Cell, 4(6), 983-993. doi:10.1016/s1097-2765(00)80227-0
Ding, L., Cao, J., Lin, W., Chen, H., Xiong, X., Ao, H., . . . Cui, Q. (2020). The Roles of Cyclin-Dependent Kinases in Cell-Cycle Progression and Therapeutic Strategies in Human Breast Cancer. Int J Mol Sci, 21(6). doi:10.3390/ijms21061960
Dodson, C. A., & Bayliss, R. (2012). Activation of Aurora-A kinase by protein partner binding and phosphorylation are independent and synergistic. J Biol Chem, 287(2), 1150-1157. doi:10.1074/jbc.M111.312090
Dodson, C. A., Kosmopoulou, M., Richards, M. W., Atrash, B., Bavetsias, V., Blagg, J., & Bayliss, R. (2010). Crystal structure of an Aurora-A mutant that mimics Aurora-B bound to MLN8054: insights into selectivity and drug design. Biochem J, 427(1), 19-28. doi:10.1042/BJ20091530
Du, W., Amarachintha, S., Wilson, A. F., & Pang, Q. (2016). Hyper-active non-homologous end joining selects for synthetic lethality resistant and pathological Fanconi anemia hematopoietic stem and progenitor cells. Sci Rep, 6, 22167. doi:10.1038/srep22167
Dubois, N. C., Adolphe, C., Ehninger, A., Wang, R. A., Robertson, E. J., & Trumpp, A. (2008). Placental rescue reveals a sole requirement for c-Myc in embryonic erythroblast survival and hematopoietic stem cell function. Development, 135(14), 2455-2465. doi:10.1242/dev.022707
DuBois, S. G., Kalika, Y., Lukens, J. N., Brodeur, G. M., Seeger, R. C., Atkinson, J. B., . . . Matthay, K. K. (1999). Metastatic sites in stage IV and IVS neuroblastoma correlate with age, tumor biology, and survival. J Pediatr Hematol Oncol, 21(3), 181-189. doi:10.1097/00043426-199905000-00005
Durlacher, C. T., Li, Z. L., Chen, X. W., He, Z. X., & Zhou, S. F. (2016). An update on the pharmacokinetics and pharmacodynamics of alisertib, a selective Aurora kinase A inhibitor. Clin Exp Pharmacol Physiol, 43(6), 585-601. doi:10.1111/1440-1681.12571
Dutertre, S., Cazales, M., Quaranta, M., Froment, C., Trabut, V., Dozier, C., . . . Ducommun, B. (2004). Phosphorylation of CDC25B by Aurora-A at the centrosome contributes to the G2-M transition. J Cell Sci, 117(Pt 12), 2523-2531. doi:10.1242/jcs.01108
Eberhardy, S. R., & Farnham, P. J. (2001). c-Myc mediates activation of the cad promoter via a post-RNA polymerase II recruitment mechanism. J Biol Chem, 276(51), 48562-48571. doi:10.1074/jbc.M109014200
Eckschlager, T., Pilat, D., Kodet, R., Dahbiova, R., Stankova, J., Jasinska, J., & Hrusak, O. (1996). DNA ploidy in neuroblastoma. Neoplasma, 43(1), 23-26. Retrieved from https://www.ncbi.nlm.nih.gov/pubmed/8843955
Effenberger, K. A., Anderson, D. D., Bray, W. M., Prichard, B. E., Ma, N., Adams, M. S., . . . Jurica, M. S. (2014). Coherence between cellular responses and in vitro splicing inhibition for the anti-tumor drug pladienolide B and its analogs. J Biol Chem, 289(4), 1938-1947. doi:10.1074/jbc.M113.515536
135
Eick, D., & Geyer, M. (2013). The RNA polymerase II carboxy-terminal domain (CTD) code. Chem Rev, 113(11), 8456-8490. doi:10.1021/cr400071f
Ewing, R. M., Chu, P., Elisma, F., Li, H., Taylor, P., Climie, S., . . . Figeys, D. (2007). Large-scale mapping of human protein-protein interactions by mass spectrometry. Mol Syst Biol, 3, 89. doi:10.1038/msb4100134
Eyers, P. A., Erikson, E., Chen, L. G., & Maller, J. L. (2003). A novel mechanism for activation of the protein kinase Aurora A. Curr Biol, 13(8), 691-697. doi:10.1016/s0960-9822(03)00166-0
Farag, S. S. (2011). The potential role of Aurora kinase inhibitors in haematological malignancies. Br J Haematol, 155(5), 561-579. doi:10.1111/j.1365-2141.2011.08898.x
Fellmann, C., Hoffmann, T., Sridhar, V., Hopfgartner, B., Muhar, M., Roth, M., . . . Zuber, J. (2013). An optimized microRNA backbone for effective single-copy RNAi. Cell Rep, 5(6), 1704-1713. doi:10.1016/j.celrep.2013.11.020
Filippakopoulos, P., Qi, J., Picaud, S., Shen, Y., Smith, W. B., Fedorov, O., . . . Bradner, J. E. (2010). Selective inhibition of BET bromodomains. Nature, 468(7327), 1067-1073. doi:10.1038/nature09504
Follis, A. V., Hammoudeh, D. I., Daab, A. T., & Metallo, S. J. (2009). Small-molecule perturbation of competing interactions between c-Myc and Max. Bioorg Med Chem Lett, 19(3), 807-810. doi:10.1016/j.bmcl.2008.12.025
Fong, C. T., Dracopoli, N. C., White, P. S., Merrill, P. T., Griffith, R. C., Housman, D. E., & Brodeur, G. M. (1989). Loss of heterozygosity for the short arm of chromosome 1 in human neuroblastomas: correlation with N-myc amplification. Proc Natl Acad Sci U S A, 86(10), 3753-3757. doi:10.1073/pnas.86.10.3753
Frank, S. R., Parisi, T., Taubert, S., Fernandez, P., Fuchs, M., Chan, H. M., . . . Amati, B. (2003). MYC recruits the TIP60 histone acetyltransferase complex to chromatin. EMBO Rep, 4(6), 575-580. doi:10.1038/sj.embor.embor861
Franks, L. M., Bollen, A., Seeger, R. C., Stram, D. O., & Matthay, K. K. (1997). Neuroblastoma in adults and adolescents: an indolent course with poor survival. Cancer, 79(10), 2028-2035. doi:10.1002/(sici)1097-0142(19970515)79:10<2028::aid-cncr26>3.0.co;2-v
Fruman, D. A., & O'Brien, S. (2017). A targeted treatment with off-target risks. Nature, 542(7642), 424-425. doi:10.1038/nature21504
Fujii, Y., Yada, M., Nishiyama, M., Kamura, T., Takahashi, H., Tsunematsu, R., . . . Nakayama, K. I. (2006). Fbxw7 contributes to tumor suppression by targeting multiple proteins for ubiquitin-dependent degradation. Cancer Sci, 97(8), 729-736. doi:10.1111/j.1349-7006.2006.00239.x
Fujinaga, K., Irwin, D., Huang, Y., Taube, R., Kurosu, T., & Peterlin, B. M. (2004). Dynamics of human immunodeficiency virus transcription: P-TEFb phosphorylates RD and dissociates negative effectors from the transactivation response element. Mol Cell Biol, 24(2), 787-795. doi:10.1128/mcb.24.2.787-795.2004
Fujita, T., Igarashi, J., Okawa, E. R., Gotoh, T., Manne, J., Kolla, V., . . . Brodeur, G. M. (2008). CHD5, a tumor suppressor gene deleted from 1p36.31 in neuroblastomas. J Natl Cancer Inst, 100(13), 940-949. doi:10.1093/jnci/djn176
Gartlgruber, M., Sharma, A. K., Quintero, A., Dreidax, D., Jansky, S., Park, Y.-G., . . . Westermann, F. (2020). Super enhancers define regulatory subtypes and cell identity in neuroblastoma. Nature Cancer. doi:10.1038/s43018-020-00145-w
Gavet, O., & Pines, J. (2010). Progressive activation of CyclinB1-Cdk1 coordinates entry to mitosis. Dev Cell, 18(4), 533-543. doi:10.1016/j.devcel.2010.02.013
George, R. E., Sanda, T., Hanna, M., Frohling, S., Luther, W., 2nd, Zhang, J., . . . Look, A. T. (2008). Activating mutations in ALK provide a therapeutic target in neuroblastoma. Nature, 455(7215), 975-978. doi:10.1038/nature07397
George, S. L., Lorenzi, F., King, D., Hartlieb, S., Campbell, J., Pemberton, H., . . . Chesler, L. (2020). Therapeutic vulnerabilities in the DNA damage response for the treatment of ATRX mutant neuroblastoma. EBioMedicine, 59, 102971-102971. doi:10.1016/j.ebiom.2020.102971

136
Giet, R., McLean, D., Descamps, S., Lee, M. J., Raff, J. W., Prigent, C., & Glover, D. M. (2002). Drosophila Aurora A kinase is required to localize D-TACC to centrosomes and to regulate astral microtubules. J Cell Biol, 156(3), 437-451. doi:10.1083/jcb.200108135
Giet, R., Uzbekov, R., Cubizolles, F., Le Guellec, K., & Prigent, C. (1999). The Xenopus laevis aurora-related protein kinase pEg2 associates with and phosphorylates the kinesin-related protein XlEg5. J Biol Chem, 274(21), 15005-15013. doi:10.1074/jbc.274.21.15005
Gilbert, D. M., Takebayashi, S. I., Ryba, T., Lu, J., Pope, B. D., Wilson, K. A., & Hiratani, I. (2010). Space and time in the nucleus: developmental control of replication timing and chromosome architecture. Cold Spring Harb Symp Quant Biol, 75, 143-153. doi:10.1101/sqb.2010.75.011
Gilburt, J. A. H., Sarkar, H., Sheldrake, P., Blagg, J., Ying, L., & Dodson, C. A. (2017). Dynamic Equilibrium of the Aurora A Kinase Activation Loop Revealed by Single-Molecule Spectroscopy. Angewandte Chemie (International ed. in English), 56(38), 11409-11414. doi:10.1002/anie.201704654
Ginno, P. A., Burger, L., Seebacher, J., Iesmantavicius, V., & Schübeler, D. (2018). Cell cycle-resolved chromatin proteomics reveals the extent of mitotic preservation of the genomic regulatory landscape. Nature Communications, 9(1), 4048. doi:10.1038/s41467-018-06007-5
Girard, C., Will, C. L., Peng, J., Makarov, E. M., Kastner, B., Lemm, I., . . . Luhrmann, R. (2012). Post-transcriptional spliceosomes are retained in nuclear speckles until splicing completion. Nat Commun, 3, 994. doi:10.1038/ncomms1998
Glover-Cutter, K., Larochelle, S., Erickson, B., Zhang, C., Shokat, K., Fisher, R. P., & Bentley, D. L. (2009). TFIIH-associated Cdk7 kinase functions in phosphorylation of C-terminal domain Ser7 residues, promoter-proximal pausing, and termination by RNA polymerase II. Mol Cell Biol, 29(20), 5455-5464. doi:10.1128/MCB.00637-09
Goldberg, A. D., Banaszynski, L. A., Noh, K. M., Lewis, P. W., Elsaesser, S. J., Stadler, S., . . . Allis, C. D. (2010). Distinct factors control histone variant H3.3 localization at specific genomic regions. Cell, 140(5), 678-691. doi:10.1016/j.cell.2010.01.003
Goto, H., Tomono, Y., Ajiro, K., Kosako, H., Fujita, M., Sakurai, M., . . . Inagaki, M. (1999). Identification of a novel phosphorylation site on histone H3 coupled with mitotic chromosome condensation. J Biol Chem, 274(36), 25543-25549. doi:10.1074/jbc.274.36.25543
Grant, R., Abdelbaki, A., Bertoldi, A., Gavilan, M. P., Mansfeld, J., Glover, D. M., & Lindon, C. (2018). Constitutive regulation of mitochondrial morphology by Aurora A kinase depends on a predicted cryptic targeting sequence at the N-terminus. Open Biol, 8(6). doi:10.1098/rsob.170272
Grim, J. E., Gustafson, M. P., Hirata, R. K., Hagar, A. C., Swanger, J., Welcker, M., . . . Clurman, B. E. (2008). Isoform- and cell cycle-dependent substrate degradation by the Fbw7 ubiquitin ligase. J Cell Biol, 181(6), 913-920. doi:10.1083/jcb.200802076
Grunberg, S., & Hahn, S. (2013). Structural insights into transcription initiation by RNA polymerase II. Trends Biochem Sci, 38(12), 603-611. doi:10.1016/j.tibs.2013.09.002
Guo, C., White, P. S., Weiss, M. J., Hogarty, M. D., Thompson, P. M., Stram, D. O., . . . Maris, J. M. (1999). Allelic deletion at 11q23 is common in MYCN single copy neuroblastomas. Oncogene, 18(35), 4948-4957. doi:10.1038/sj.onc.1202887
Guo, J., Li, T., Schipper, J., Nilson, K. A., Fordjour, F. K., Cooper, J. J., . . . Price, D. H. (2014). Sequence specificity incompletely defines the genome-wide occupancy of Myc. Genome Biol, 15(10), 482. doi:10.1186/s13059-014-0482-3
Gustafson, W. C., Meyerowitz, J. G., Nekritz, E. A., Chen, J., Benes, C., Charron, E., . . . Weiss, W. A. (2014). Drugging MYCN through an allosteric transition in Aurora kinase A. Cancer Cell, 26(3), 414-427. doi:10.1016/j.ccr.2014.07.015
Hallberg, B., & Palmer, R. H. (2016). The role of the ALK receptor in cancer biology. Annals of Oncology, 27, iii4-iii15. doi:https://doi.org/10.1093/annonc/mdw301
137
Hamperl, S., Bocek, M. J., Saldivar, J. C., Swigut, T., & Cimprich, K. A. (2017). Transcription-Replication Conflict Orientation Modulates R-Loop Levels and Activates Distinct DNA Damage Responses. Cell, 170(4), 774-786.e719. doi:10.1016/j.cell.2017.07.043
Hamperl, S., & Cimprich, K. A. (2016). Conflict Resolution in the Genome: How Transcription and Replication Make It Work. Cell, 167(6), 1455-1467. doi:10.1016/j.cell.2016.09.053
Hannak, E., Kirkham, M., Hyman, A. A., & Oegema, K. (2001). Aurora-A kinase is required for centrosome maturation in Caenorhabditis elegans. J Cell Biol, 155(7), 1109-1116. doi:10.1083/jcb.200108051
Haren, L., Remy, M. H., Bazin, I., Callebaut, I., Wright, M., & Merdes, A. (2006). NEDD1-dependent recruitment of the gamma-tubulin ring complex to the centrosome is necessary for centriole duplication and spindle assembly. J Cell Biol, 172(4), 505-515. doi:10.1083/jcb.200510028
Harlen, K. M., & Churchman, L. S. (2017). The code and beyond: transcription regulation by the RNA polymerase II carboxy-terminal domain. Nat Rev Mol Cell Biol, 18(4), 263-273. doi:10.1038/nrm.2017.10
Harrington, J. J., & Lieber, M. R. (1994). Functional domains within FEN-1 and RAD2 define a family of structure-specific endonucleases: implications for nucleotide excision repair. Genes Dev, 8(11), 1344-1355. doi:10.1101/gad.8.11.1344
Hartwell, L. H., & Weinert, T. A. (1989). Checkpoints: controls that ensure the order of cell cycle events. Science, 246(4930), 629-634. doi:10.1126/science.2683079
Hatchi, E., Skourti-Stathaki, K., Ventz, S., Pinello, L., Yen, A., Kamieniarz-Gdula, K., . . . Livingston, D. M. (2015). BRCA1 recruitment to transcriptional pause sites is required for R-loop-driven DNA damage repair. Mol Cell, 57(4), 636-647. doi:10.1016/j.molcel.2015.01.011
Heald, R., McLoughlin, M., & McKeon, F. (1993). Human wee1 maintains mitotic timing by protecting the nucleus from cytoplasmically activated Cdc2 kinase. Cell, 74(3), 463-474. doi:10.1016/0092-8674(93)80048-j
Heidelberger, J. B., Voigt, A., Borisova, M. E., Petrosino, G., Ruf, S., Wagner, S. A., & Beli, P. (2018). Proteomic profiling of VCP substrates links VCP to K6-linked ubiquitylation and c-Myc function. EMBO Rep, 19(4). doi:10.15252/embr.201744754
Heller, R. C., Kang, S., Lam, W. M., Chen, S., Chan, C. S., & Bell, S. P. (2011). Eukaryotic origin-dependent DNA replication in vitro reveals sequential action of DDK and S-CDK kinases. Cell, 146(1), 80-91. doi:10.1016/j.cell.2011.06.012
Helmrich, A., Ballarino, M., & Tora, L. (2011). Collisions between replication and transcription complexes cause common fragile site instability at the longest human genes. Mol Cell, 44(6), 966-977. doi:10.1016/j.molcel.2011.10.013
Herold, S., Kalb, J., Büchel, G., Ade, C. P., Baluapuri, A., Xu, J., . . . Eilers, M. (2019). Recruitment of BRCA1 limits MYCN-driven accumulation of stalled RNA polymerase. Nature, 567(7749), 545-549. doi:10.1038/s41586-019-1030-9
Hirota, T., Kunitoku, N., Sasayama, T., Marumoto, T., Zhang, D., Nitta, M., . . . Saya, H. (2003). Aurora-A and an interacting activator, the LIM protein Ajuba, are required for mitotic commitment in human cells. Cell, 114(5), 585-598. doi:10.1016/s0092-8674(03)00642-1
Ho, Y. S., Duh, J. S., Jeng, J. H., Wang, Y. J., Liang, Y. C., Lin, C. H., . . . Lin, J. K. (2001). Griseofulvin potentiates antitumorigenesis effects of nocodazole through induction of apoptosis and G2/M cell cycle arrest in human colorectal cancer cells. Int J Cancer, 91(3), 393-401. doi:10.1002/1097-0215(200002)9999:9999<::aid-ijc1070>3.0.co;2-#
Hoehner, J. C., Gestblom, C., Hedborg, F., Sandstedt, B., Olsen, L., & Pahlman, S. (1996). A developmental model of neuroblastoma: differentiating stroma-poor tumors' progress along an extra-adrenal chromaffin lineage. Lab Invest, 75(5), 659-675. Retrieved from https://www.ncbi.nlm.nih.gov/pubmed/8941212
Hong, X., O'Donnell, J. P., Salazar, C. R., Van Brocklyn, J. R., Barnett, K. D., Pearl, D. K., . . . Lehman, N. L. (2014). The selective Aurora-A kinase inhibitor MLN8237 (alisertib) potently inhibits proliferation of glioblastoma neurosphere tumor stem-like cells and
138
potentiates the effects of temozolomide and ionizing radiation. Cancer Chemother Pharmacol, 73(5), 983-990. doi:10.1007/s00280-014-2430-z
Hsu, C. W., Chen, Y. C., Su, H. H., Huang, G. J., Shu, C. W., Wu, T. T., & Pan, H. W. (2017). Targeting TPX2 Suppresses the Tumorigenesis of Hepatocellular Carcinoma Cells Resulting in Arrested Mitotic Phase Progression and Increased Genomic Instability. J Cancer, 8(8), 1378-1394. doi:10.7150/jca.17478
Hu, W., Kavanagh, J. J., Deaver, M., Johnston, D. A., Freedman, R. S., Verschraegen, C. F., & Sen, S. (2005). Frequent overexpression of STK15/Aurora-A/BTAK and chromosomal instability in tumorigenic cell cultures derived from human ovarian cancer. Oncol Res, 15(1), 49-57. doi:10.3727/096504005775082101
Huh, M. S., Ivanochko, D., Hashem, L. E., Curtin, M., Delorme, M., Goodall, E., . . . Picketts, D. J. (2016). Stalled replication forks within heterochromatin require ATRX for protection. Cell Death Dis, 7(5), e2220. doi:10.1038/cddis.2016.121
Huang, C. H., Lujambio, A., Zuber, J., Tschaharganeh, D. F., Doran, M. G., Evans, M. J., . . . Lowe, S. W. (2014). CDK9-mediated transcription elongation is required for MYC addiction in hepatocellular carcinoma. Genes Dev, 28(16), 1800-1814. doi:10.1101/gad.244368.114
Huang da, W., Sherman, B. T., & Lempicki, R. A. (2009). Systematic and integrative analysis of large gene lists using DAVID bioinformatics resources. Nat Protoc, 4(1), 44-57. doi:10.1038/nprot.2008.211
Huang, M., & Weiss, W. A. (2013). Neuroblastoma and MYCN. Cold Spring Harbor perspectives in medicine, 3(10), a014415. doi:10.1101/cshperspect.a014415
Hurlin, P. J., Zhou, Z. Q., Toyo-oka, K., Ota, S., Walker, W. L., Hirotsune, S., & Wynshaw-Boris, A. (2003). Deletion of Mnt leads to disrupted cell cycle control and tumorigenesis. EMBO J, 22(18), 4584-4596. doi:10.1093/emboj/cdg442
Ikegaki, N., Shimada, H., & International Neuroblastoma Pathology, C. (2019). Subgrouping of Unfavorable Histology Neuroblastomas With Immunohistochemistry Toward Precision Prognosis and Therapy Stratification. JCO Precis Oncol, 3. doi:10.1200/PO.18.00312
Ilves, I., Petojevic, T., Pesavento, J. J., & Botchan, M. R. (2010). Activation of the MCM2-7 helicase by association with Cdc45 and GINS proteins. Mol Cell, 37(2), 247-258. doi:10.1016/j.molcel.2009.12.030
Isola, J. J., Kallioniemi, O. P., Chu, L. W., Fuqua, S. A., Hilsenbeck, S. G., Osborne, C. K., & Waldman, F. M. (1995). Genetic aberrations detected by comparative genomic hybridization predict outcome in node-negative breast cancer. Am J Pathol, 147(4), 905-911. Retrieved from https://www.ncbi.nlm.nih.gov/pubmed/7573366
Ivaldi, M. S., Karam, C. S., & Corces, V. G. (2007). Phosphorylation of histone H3 at Ser10 facilitates RNA polymerase II release from promoter-proximal pausing in Drosophila. Genes & development, 21(21), 2818-2831. doi:10.1101/gad.1604007
Ivanauskiene, K., Delbarre, E., McGhie, J. D., Küntziger, T., Wong, L. H., & Collas, P. (2014). The PML-associated protein DEK regulates the balance of H3.3 loading on chromatin and is important for telomere integrity. Genome Res, 24(10), 1584-1594. doi:10.1101/gr.173831.114
Izumi, T., & Maller, J. L. (1993). Elimination of cdc2 phosphorylation sites in the cdc25 phosphatase blocks initiation of M-phase. Mol Biol Cell, 4(12), 1337-1350. doi:10.1091/mbc.4.12.1337
Jang, Y. J., Ma, S., Terada, Y., & Erikson, R. L. (2002). Phosphorylation of threonine 210 and the role of serine 137 in the regulation of mammalian polo-like kinase. J Biol Chem, 277(46), 44115-44120. doi:10.1074/jbc.M202172200
Janoueix-Lerosey, I., Lequin, D., Brugieres, L., Ribeiro, A., de Pontual, L., Combaret, V., . . . Delattre, O. (2008). Somatic and germline activating mutations of the ALK kinase receptor in neuroblastoma. Nature, 455(7215), 967-970. doi:10.1038/nature07398
139
Jonkers, I., Kwak, H., & Lis, J. T. (2014). Genome-wide dynamics of Pol II elongation and its interplay with promoter proximal pausing, chromatin, and exons. Elife, 3, e02407. doi:10.7554/eLife.02407
Jonkers, I., & Lis, J. T. (2015). Getting up to speed with transcription elongation by RNA polymerase II. Nat Rev Mol Cell Biol, 16(3), 167-177. doi:10.1038/nrm3953
Jung, L. A., Gebhardt, A., Koelmel, W., Ade, C. P., Walz, S., Kuper, J., . . . Eilers, M. (2017). OmoMYC blunts promoter invasion by oncogenic MYC to inhibit gene expression characteristic of MYC-dependent tumors. Oncogene, 36(14), 1911-1924. doi:10.1038/onc.2016.354
Kalkat, M., Resetca, D., Lourenco, C., Chan, P. K., Wei, Y., Shiah, Y. J., . . . Penn, L. Z. (2018). MYC Protein Interactome Profiling Reveals Functionally Distinct Regions that Cooperate to Drive Tumorigenesis. Mol Cell, 72(5), 836-848 e837. doi:10.1016/j.molcel.2018.09.031
Kamran, M., Long, Z. J., Xu, D., Lv, S. S., Liu, B., Wang, C. L., . . . Liu, Q. (2017). Aurora kinase A regulates Survivin stability through targeting FBXL7 in gastric cancer drug resistance and prognosis. Oncogenesis, 6(2), e298. doi:10.1038/oncsis.2016.80
Kashatus, D. F., Lim, K. H., Brady, D. C., Pershing, N. L., Cox, A. D., & Counter, C. M. (2011). RALA and RALBP1 regulate mitochondrial fission at mitosis. Nat Cell Biol, 13(9), 1108-1115. doi:10.1038/ncb2310
Katayama, H., Sasai, K., Kawai, H., Yuan, Z. M., Bondaruk, J., Suzuki, F., . . . Sen, S. (2004). Phosphorylation by aurora kinase A induces Mdm2-mediated destabilization and inhibition of p53. Nat Genet, 36(1), 55-62. doi:10.1038/ng1279
Kato, G. J., Barrett, J., Villa-Garcia, M., & Dang, C. V. (1990). An amino-terminal c-myc domain required for neoplastic transformation activates transcription. Mol Cell Biol, 10(11), 5914-5920. doi:10.1128/mcb.10.11.5914
Kettenbach, A. N., Schweppe, D. K., Faherty, B. K., Pechenick, D., Pletnev, A. A., & Gerber, S. A. (2011). Quantitative phosphoproteomics identifies substrates and functional modules of Aurora and Polo-like kinase activities in mitotic cells. Sci Signal, 4(179), rs5. doi:10.1126/scisignal.2001497
Kim, D., Pertea, G., Trapnell, C., Pimentel, H., Kelley, R., & Salzberg, S. L. (2013). TopHat2: accurate alignment of transcriptomes in the presence of insertions, deletions and gene fusions. Genome Biol, 14(4), R36. doi:10.1186/gb-2013-14-4-r36
Kim, S. R., Kim, K. B., Chae, Y. C., Park, J. W., & Seo, S. B. (2016). H3S10 phosphorylation-mediated transcriptional regulation by Aurora kinase A. Biochem Biophys Res Commun, 469(1), 22-28. doi:10.1016/j.bbrc.2015.11.063
Kim, T. K., Ebright, R. H., & Reinberg, D. (2000). Mechanism of ATP-dependent promoter melting by transcription factor IIH. Science, 288(5470), 1418-1422. doi:10.1126/science.288.5470.1418
Kimura, M., Kotani, S., Hattori, T., Sumi, N., Yoshioka, T., Todokoro, K., & Okano, Y. (1997). Cell cycle-dependent expression and spindle pole localization of a novel human protein kinase, Aik, related to Aurora of Drosophila and yeast Ipl1. J Biol Chem, 272(21), 13766-13771. doi:10.1074/jbc.272.21.13766
Kindgren, P., Ivanov, M., & Marquardt, S. (2019). Native elongation transcript sequencing reveals temperature dependent dynamics of nascent RNAPII transcription in Arabidopsis. Nucleic Acids Research, 48(5), 2332-2347. doi:10.1093/nar/gkz1189
King, D., Li, X. D., Almeida, G. S., Kwok, C., Gravells, P., Harrison, D., . . . Bryant, H. E. (2020). MYCN expression induces replication stress and sensitivity to PARP inhibition in neuroblastoma. Oncotarget, 11(23), 2141-2159. doi:10.18632/oncotarget.27329
Kinzel, D., Boldt, K., Davis, E. E., Burtscher, I., Trumbach, D., Diplas, B., . . . Lickert, H. (2010). Pitchfork regulates primary cilia disassembly and left-right asymmetry. Dev Cell, 19(1), 66-77. doi:10.1016/j.devcel.2010.06.005
Knoepfler, P. S., Cheng, P. F., & Eisenman, R. N. (2002). N-myc is essential during neurogenesis for the rapid expansion of progenitor cell populations and the inhibition of neuronal differentiation. Genes Dev, 16(20), 2699-2712. doi:10.1101/gad.1021202
140
Knott, S. R. V., Viggiani, C. J., & Aparicio, O. M. (2009). To promote and protect: Coordinating DNA replication and transcription for genome stability. Epigenetics, 4(6), 362-365. doi:10.4161/epi.4.6.9712
Koch, H. B., Zhang, R., Verdoodt, B., Bailey, A., Zhang, C. D., Yates, J. R., 3rd, . . . Hermeking, H. (2007). Large-scale identification of c-MYC-associated proteins using a combined TAP/MudPIT approach. Cell Cycle, 6(2), 205-217. doi:10.4161/cc.6.2.3742
Kohl, N. E., Kanda, N., Schreck, R. R., Bruns, G., Latt, S. A., Gilbert, F., & Alt, F. W. (1983). Transposition and amplification of oncogene-related sequences in human neuroblastomas. Cell, 35(2 Pt 1), 359-367. doi:10.1016/0092-8674(83)90169-1
Kollareddy, M., Zheleva, D., Dzubak, P., Brahmkshatriya, P. S., Lepsik, M., & Hajduch, M. (2012). Aurora kinase inhibitors: progress towards the clinic. Invest New Drugs, 30(6), 2411-2432. doi:10.1007/s10637-012-9798-6
Koniaras, K., Cuddihy, A. R., Christopoulos, H., Hogg, A., & O'Connell, M. J. (2001). Inhibition of Chk1-dependent G2 DNA damage checkpoint radiosensitizes p53 mutant human cells. Oncogene, 20(51), 7453-7463. doi:10.1038/sj.onc.1204942
Koo, S. J., Fernández-Montalván, A. E., Badock, V., Ott, C. J., Holton, S. J., von Ahsen, O., . . . Gorjánácz, M. (2016). ATAD2 is an epigenetic reader of newly synthesized histone marks during DNA replication. Oncotarget, 7(43), 70323-70335. doi:10.18632/oncotarget.11855
Koopman, G., Reutelingsperger, C. P., Kuijten, G. A., Keehnen, R. M., Pals, S. T., & van Oers, M. H. (1994). Annexin V for flow cytometric detection of phosphatidylserine expression on B cells undergoing apoptosis. Blood, 84(5), 1415-1420. Retrieved from https://www.ncbi.nlm.nih.gov/pubmed/8068938
Koschmann, C., Calinescu, A. A., Nunez, F. J., Mackay, A., Fazal-Salom, J., Thomas, D., . . . Castro, M. G. (2016). ATRX loss promotes tumor growth and impairs nonhomologous end joining DNA repair in glioma. Sci Transl Med, 8(328), 328ra328. doi:10.1126/scitranslmed.aac8228
Koyama, H., Zhuang, T., Light, J. E., Kolla, V., Higashi, M., McGrady, P. W., . . . Brodeur, G. M. (2012). Mechanisms of CHD5 Inactivation in neuroblastomas. Clin Cancer Res, 18(6), 1588-1597. doi:10.1158/1078-0432.CCR-11-2644
Krajewska, M., Dries, R., Grassetti, A. V., Dust, S., Gao, Y., Huang, H., . . . George, R. E. (2019). CDK12 loss in cancer cells affects DNA damage response genes through premature cleavage and polyadenylation. Nature Communications, 10(1), 1757. doi:10.1038/s41467-019-09703-y
Kraus, W. L., & Lis, J. T. (2003). PARP goes transcription. Cell, 113(6), 677-683. doi:10.1016/s0092-8674(03)00433-1
Kress, T. L., & Guthrie, C. (2006). Molecular biology. Accurate RNA siting and splicing gets help from a DEK-hand. Science, 312(5782), 1886-1887. doi:10.1126/science.1130324
Krishna, T. S., Kong, X. P., Gary, S., Burgers, P. M., & Kuriyan, J. (1994). Crystal structure of the eukaryotic DNA polymerase processivity factor PCNA. Cell, 79(7), 1233-1243. doi:10.1016/0092-8674(94)90014-0
Kufer, T. A., Sillje, H. H., Korner, R., Gruss, O. J., Meraldi, P., & Nigg, E. A. (2002). Human TPX2 is required for targeting Aurora-A kinase to the spindle. J Cell Biol, 158(4), 617-623. doi:10.1083/jcb.200204155
Kunitoku, N., Sasayama, T., Marumoto, T., Zhang, D., Honda, S., Kobayashi, O., . . . Hirota, T. (2003). CENP-A phosphorylation by Aurora-A in prophase is required for enrichment of Aurora-B at inner centromeres and for kinetochore function. Dev Cell, 5(6), 853-864. doi:10.1016/s1534-5807(03)00364-2
Langmead, B., Trapnell, C., Pop, M., & Salzberg, S. L. (2009). Ultrafast and memory-efficient alignment of short DNA sequences to the human genome. Genome Biol, 10(3), R25. doi:10.1186/gb-2009-10-3-r25
Langston, L. D., Zhang, D., Yurieva, O., Georgescu, R. E., Finkelstein, J., Yao, N. Y., . . . O'Donnell, M. E. (2014). CMG helicase and DNA polymerase epsilon form a functional
141
15-subunit holoenzyme for eukaryotic leading-strand DNA replication. Proc Natl Acad Sci U S A, 111(43), 15390-15395. doi:10.1073/pnas.1418334111
Leeuwen, F. N., Kain, H. E., Kammen, R. A., Michiels, F., Kranenburg, O. W., & Collard, J. G. (1997). The guanine nucleotide exchange factor Tiam1 affects neuronal morphology; opposing roles for the small GTPases Rac and Rho. J Cell Biol, 139(3), 797-807. doi:10.1083/jcb.139.3.797
Lewis, L. M., Edwards, M. C., Meyers, Z. R., Talbot, C. C., Jr., Hao, H., Blum, D., . . . Errington, T. M. (2018). Replication Study: Transcriptional amplification in tumor cells with elevated c-Myc. Elife, 7. doi:10.7554/eLife.30274
Lewis, P. W., Elsaesser, S. J., Noh, K. M., Stadler, S. C., & Allis, C. D. (2010). Daxx is an H3.3-specific histone chaperone and cooperates with ATRX in replication-independent chromatin assembly at telomeres. Proc Natl Acad Sci U S A, 107(32), 14075-14080. doi:10.1073/pnas.1008850107
Liberzon, A., Subramanian, A., Pinchback, R., Thorvaldsdottir, H., Tamayo, P., & Mesirov, J. P. (2011). Molecular signatures database (MSigDB) 3.0. Bioinformatics, 27(12), 1739-1740. doi:10.1093/bioinformatics/btr260
Liigand, P., Kaupmees, K., & Kruve, A. (2019). Influence of the amino acid composition on the ionization efficiencies of small peptides. J Mass Spectrom, 54(6), 481-487. doi:10.1002/jms.4348
Liigand, P., Kaupmees, K., & Kruve, A. (2019). Influence of the amino acid composition on the ionization efficiencies of small peptides. J Mass Spectrom, 54(6), 481-487. doi:10.1002/jms.4348
Lim, K. H., Brady, D. C., Kashatus, D. F., Ancrile, B. B., Der, C. J., Cox, A. D., & Counter, C. M. (2010). Aurora-A phosphorylates, activates, and relocalizes the small GTPase RalA. Mol Cell Biol, 30(2), 508-523. doi:10.1128/MCB.00916-08
Lim, S. K., & Gopalan, G. (2007a). Antizyme1 mediates AURKAIP1-dependent degradation of Aurora-A. Oncogene, 26(46), 6593-6603. doi:10.1038/sj.onc.1210482
Lim, S. K., & Gopalan, G. (2007b). Aurora-A kinase interacting protein 1 (AURKAIP1) promotes Aurora-A degradation through an alternative ubiquitin-independent pathway. Biochem J, 403(1), 119-127. doi:10.1042/BJ20061272
Lin, C. Y., Lovén, J., Rahl, P. B., Paranal, R. M., Burge, C. B., Bradner, J. E., . . . Young, R. A. (2012). Transcriptional amplification in tumor cells with elevated c-Myc. Cell, 151(1), 56-67. doi:10.1016/j.cell.2012.08.026
Lin, S., Coutinho-Mansfield, G., Wang, D., Pandit, S., & Fu, X. D. (2008). The splicing factor SC35 has an active role in transcriptional elongation. Nat Struct Mol Biol, 15(8), 819-826. doi:10.1038/nsmb.1461
Lindon, C., Grant, R., & Min, M. (2015). Ubiquitin-Mediated Degradation of Aurora Kinases. Front Oncol, 5, 307. doi:10.3389/fonc.2015.00307
Lipford, J. R., & Bell, S. P. (2001). Nucleosomes positioned by ORC facilitate the initiation of DNA replication. Mol Cell, 7(1), 21-30. doi:10.1016/s1097-2765(01)00151-4
Littlepage, L. E., Wu, H., Andresson, T., Deanehan, J. K., Amundadottir, L. T., & Ruderman, J. V. (2002). Identification of phosphorylated residues that affect the activity of the mitotic kinase Aurora-A. Proc Natl Acad Sci U S A, 99(24), 15440-15445. doi:10.1073/pnas.202606599
Liu, Q., Kaneko, S., Yang, L., Feldman, R. I., Nicosia, S. V., Chen, J., & Cheng, J. Q. (2004). Aurora-A abrogation of p53 DNA binding and transactivation activity by phosphorylation of serine 215. J Biol Chem, 279(50), 52175-52182. doi:10.1074/jbc.M406802200
Liu, Y., Vidanes, G., Lin, Y. C., Mori, S., & Siede, W. (2000). Characterization of a Saccharomyces cerevisiae homologue of Schizosaccharomyces pombe Chk1 involved in DNA-damage-induced M-phase arrest. Mol Gen Genet, 262(6), 1132-1146. doi:10.1007/pl00008656
Lorenzin, F., Benary, U., Baluapuri, A., Walz, S., Jung, L. A., von Eyss, B., . . . Wolf, E. (2016). Different promoter affinities account for specificity in MYC-dependent gene regulation. Elife, 5. doi:10.7554/eLife.15161

142
Lovén, J., Orlando, D. A., Sigova, A. A., Lin, C. Y., Rahl, P. B., Burge, C. B., . . . Young, R. A. (2012). Revisiting global gene expression analysis. Cell, 151(3), 476-482. doi:10.1016/j.cell.2012.10.012
Lu, L. Y., Wood, J. L., Ye, L., Minter-Dykhouse, K., Saunders, T. L., Yu, X., & Chen, J. (2008). Aurora A is essential for early embryonic development and tumor suppression. J Biol Chem, 283(46), 31785-31790. doi:10.1074/jbc.M805880200
Lu, Y., Hu, Z., Mangala, L. S., Stine, Z. E., Hu, X., Jiang, D., . . . Dang, C. V. (2018). MYC Targeted Long Noncoding RNA DANCR Promotes Cancer in Part by Reducing p21 Levels. Cancer Res, 78(1), 64-74. doi:10.1158/0008-5472.CAN-17-0815
Luders, J., Patel, U. K., & Stearns, T. (2006). GCP-WD is a gamma-tubulin targeting factor required for centrosomal and chromatin-mediated microtubule nucleation. Nat Cell Biol, 8(2), 137-147. doi:10.1038/ncb1349
Ma, T., Van Tine, B. A., Wei, Y., Garrett, M. D., Nelson, D., Adams, P. D., . . . Harper, J. W. (2000). Cell cycle-regulated phosphorylation of p220(NPAT) by cyclin E/Cdk2 in Cajal bodies promotes histone gene transcription. Genes Dev, 14(18), 2298-2313. doi:10.1101/gad.829500
MacNeill, S. (2012). Composition and dynamics of the eukaryotic replisome: a brief overview. Subcell Biochem, 62, 1-17. doi:10.1007/978-94-007-4572-8_1
Mahajan, P. B. (1994). Modulation of transcription of rRNA genes by rapamycin. Int J Immunopharmacol, 16(9), 711-721. doi:10.1016/0192-0561(94)90091-4
Malumbres, M., & Barbacid, M. (2001). To cycle or not to cycle: a critical decision in cancer. Nat Rev Cancer, 1(3), 222-231. doi:10.1038/35106065
Malynn, B. A., de Alboran, I. M., O'Hagan, R. C., Bronson, R., Davidson, L., DePinho, R. A., & Alt, F. W. (2000). N-myc can functionally replace c-myc in murine development, cellular growth, and differentiation. Genes Dev, 14(11), 1390-1399. Retrieved from https://www.ncbi.nlm.nih.gov/pubmed/10837031
Mandriota, S. J., Valentijn, L. J., Lesne, L., Betts, D. R., Marino, D., Boudal-Khoshbeen, M., . . . Gumy-Pause, F. (2015). Ataxia-telangiectasia mutated (ATM) silencing promotes neuroblastoma progression through a MYCN independent mechanism. Oncotarget, 6(21), 18558-18576. doi:10.18632/oncotarget.4061
Manfredi, M. G., Ecsedy, J. A., Chakravarty, A., Silverman, L., Zhang, M., Hoar, K. M., . . . Sells, T. B. (2011). Characterization of Alisertib (MLN8237), an investigational small-molecule inhibitor of aurora A kinase using novel in vivo pharmacodynamic assays. Clin Cancer Res, 17(24), 7614-7624. doi:10.1158/1078-0432.CCR-11-1536
Marahrens, Y., & Stillman, B. (1992). A yeast chromosomal origin of DNA replication defined by multiple functional elements. Science, 255(5046), 817-823. doi:10.1126/science.1536007
Maris, J. M., Hogarty, M. D., Bagatell, R., & Cohn, S. L. (2007). Neuroblastoma. Lancet, 369(9579), 2106-2120. doi:10.1016/S0140-6736(07)60983-0
Maris, J. M., & Matthay, K. K. (1999). Molecular biology of neuroblastoma. J Clin Oncol, 17(7), 2264-2279. doi:10.1200/JCO.1999.17.7.2264
Marsico, G., Chambers, V. S., Sahakyan, A. B., McCauley, P., Boutell, J. M., Antonio, M. D., & Balasubramanian, S. (2019). Whole genome experimental maps of DNA G-quadruplexes in multiple species. Nucleic Acids Research, 47(8), 3862-3874. doi:10.1093/nar/gkz179
Martin, D. E., Soulard, A., & Hall, M. N. (2004). TOR regulates ribosomal protein gene expression via PKA and the Forkhead transcription factor FHL1. Cell, 119(7), 969-979. doi:10.1016/j.cell.2004.11.047
Marumoto, T., Hirota, T., Morisaki, T., Kunitoku, N., Zhang, D., Ichikawa, Y., . . . Saya, H. (2002). Roles of aurora-A kinase in mitotic entry and G2 checkpoint in mammalian cells. Genes Cells, 7(11), 1173-1182. doi:10.1046/j.1365-2443.2002.00592.x
Marumoto, T., Honda, S., Hara, T., Nitta, M., Hirota, T., Kohmura, E., & Saya, H. (2003). Aurora-A kinase maintains the fidelity of early and late mitotic events in HeLa cells. J Biol Chem, 278(51), 51786-51795. doi:10.1074/jbc.M306275200

143
Marumoto, T., Zhang, D., & Saya, H. (2005). Aurora-A - a guardian of poles. Nat Rev Cancer, 5(1), 42-50. doi:10.1038/nrc1526
Masai, H., Matsumoto, S., You, Z., Yoshizawa-Sugata, N., & Oda, M. (2010). Eukaryotic chromosome DNA replication: where, when, and how? Annu Rev Biochem, 79, 89-130. doi:10.1146/annurev.biochem.052308.103205
Massimino, M., Biassoni, V., Gandola, L., Garre, M. L., Gatta, G., Giangaspero, F., . . . Rutkowski, S. (2016). Childhood medulloblastoma. Crit Rev Oncol Hematol, 105, 35-51. doi:10.1016/j.critrevonc.2016.05.012
Mathsyaraja, H., Freie, B., Cheng, P. F., Babaeva, E., Catchpole, J. T., Janssens, D., . . . Eisenman, R. N. (2019). Max deletion destabilizes MYC protein and abrogates Emicro-Myc lymphomagenesis. Genes Dev, 33(17-18), 1252-1264. doi:10.1101/gad.325878.119
Matsuo, N., Terao, M., Nabeshima, Y., & Hoshino, M. (2003). Roles of STEF/Tiam1, guanine nucleotide exchange factors for Rac1, in regulation of growth cone morphology. Mol Cell Neurosci, 24(1), 69-81. doi:10.1016/s1044-7431(03)00122-2
Matsuoka, S., Rotman, G., Ogawa, A., Shiloh, Y., Tamai, K., & Elledge, S. J. (2000). Ataxia telangiectasia-mutated phosphorylates Chk2 in vivo and in vitro. Proc Natl Acad Sci U S A, 97(19), 10389-10394. doi:10.1073/pnas.190030497
McMahon, S. B., Van Buskirk, H. A., Dugan, K. A., Copeland, T. D., & Cole, M. D. (1998). The novel ATM-related protein TRRAP is an essential cofactor for the c-Myc and E2F oncoproteins. Cell, 94(3), 363-374. doi:10.1016/s0092-8674(00)81479-8
McMahon, S. B., Wood, M. A., & Cole, M. D. (2000). The essential cofactor TRRAP recruits the histone acetyltransferase hGCN5 to c-Myc. Mol Cell Biol, 20(2), 556-562. doi:10.1128/mcb.20.2.556-562.2000
Meerbrey, K. L., Hu, G., Kessler, J. D., Roarty, K., Li, M. Z., Fang, J. E., . . . Elledge, S. J. (2011). The pINDUCER lentiviral toolkit for inducible RNA interference in vitro and in vivo. Proc Natl Acad Sci U S A, 108(9), 3665-3670. doi:10.1073/pnas.1019736108
Melichar, B., Adenis, A., Lockhart, A. C., Bennouna, J., Dees, E. C., Kayaleh, O., . . . Schusterbauer, C. (2015). Safety and activity of alisertib, an investigational aurora kinase A inhibitor, in patients with breast cancer, small-cell lung cancer, non-small-cell lung cancer, head and neck squamous-cell carcinoma, and gastro-oesophageal adenocarcinoma: a five-arm phase 2 study. Lancet Oncol, 16(4), 395-405. doi:10.1016/S1470-2045(15)70051-3
Meraldi, P., Honda, R., & Nigg, E. A. (2002). Aurora-A overexpression reveals tetraploidization as a major route to centrosome amplification in p53-/- cells. EMBO J, 21(4), 483-492. doi:10.1093/emboj/21.4.483
Merkhofer, E. C., Hu, P., & Johnson, T. L. (2014). Introduction to cotranscriptional RNA splicing. Methods in molecular biology (Clifton, N.J.), 1126, 83-96. doi:10.1007/978-1-62703-980-2_6
Meryet-Figuiere, M., Alaei-Mahabadi, B., Ali, M. M., Mitra, S., Subhash, S., Pandey, G. K., . . . Kanduri, C. (2014). Temporal separation of replication and transcription during S-phase progression. Cell cycle (Georgetown, Tex.), 13(20), 3241-3248. doi:10.4161/15384101.2014.953876
Min, M., Mayor, U., & Lindon, C. (2013). Ubiquitination site preferences in anaphase promoting complex/cyclosome (APC/C) substrates. Open Biol, 3(9), 130097. doi:10.1098/rsob.130097
Minn, A. J., Boise, L. H., & Thompson, C. B. (1996). Expression of Bcl-xL and loss of p53 can cooperate to overcome a cell cycle checkpoint induced by mitotic spindle damage. Genes Dev, 10(20), 2621-2631. doi:10.1101/gad.10.20.2621
Molenaar, J. J., Koster, J., Zwijnenburg, D. A., van Sluis, P., Valentijn, L. J., van der Ploeg, I., . . . Versteeg, R. (2012). Sequencing of neuroblastoma identifies chromothripsis and defects in neuritogenesis genes. Nature, 483(7391), 589-593. doi:10.1038/nature10910
144
Monier, K., Mouradian, S., & Sullivan, K. F. (2007). DNA methylation promotes Aurora-B-driven phosphorylation of histone H3 in chromosomal subdomains. J Cell Sci, 120(Pt 1), 101-114. doi:10.1242/jcs.03326
Moore, M. J., Wang, Q., Kennedy, C. J., & Silver, P. A. (2010). An alternative splicing network links cell-cycle control to apoptosis. Cell, 142(4), 625-636. doi:10.1016/j.cell.2010.07.019
Mori, D., Yamada, M., Mimori-Kiyosue, Y., Shirai, Y., Suzuki, A., Ohno, S., . . . Hirotsune, S. (2009). An essential role of the aPKC-Aurora A-NDEL1 pathway in neurite elongation by modulation of microtubule dynamics. Nat Cell Biol, 11(9), 1057-1068. doi:10.1038/ncb1919
Mori, D., Yano, Y., Toyo-oka, K., Yoshida, N., Yamada, M., Muramatsu, M., . . . Hirotsune, S. (2007). NDEL1 phosphorylation by Aurora-A kinase is essential for centrosomal maturation, separation, and TACC3 recruitment. Mol Cell Biol, 27(1), 352-367. doi:10.1128/MCB.00878-06
Mori, S., & Shirahige, K. (2007). Perturbation of the activity of replication origin by meiosis-specific transcription. J Biol Chem, 282(7), 4447-4452. doi:10.1074/jbc.M609671200
Moroz, V., Machin, D., Faldum, A., Hero, B., Iehara, T., Mosseri, V., . . . London, W. B. (2011). Changes over three decades in outcome and the prognostic influence of age-at-diagnosis in young patients with neuroblastoma: a report from the International Neuroblastoma Risk Group Project. Eur J Cancer, 47(4), 561-571. doi:10.1016/j.ejca.2010.10.022
Mosse, Y. P., Fox, E., Teachey, D. T., Reid, J. M., Safgren, S. L., Carol, H., . . . Weigel, B. J. (2019). A Phase II Study of Alisertib in Children with Recurrent/Refractory Solid Tumors or Leukemia: Children's Oncology Group Phase I and Pilot Consortium (ADVL0921). Clin Cancer Res, 25(11), 3229-3238. doi:10.1158/1078-0432.CCR-18-2675
Mosse, Y. P., Laudenslager, M., Khazi, D., Carlisle, A. J., Winter, C. L., Rappaport, E., & Maris, J. M. (2004). Germline PHOX2B mutation in hereditary neuroblastoma. Am J Hum Genet, 75(4), 727-730. doi:10.1086/424530
Mosse, Y. P., Laudenslager, M., Longo, L., Cole, K. A., Wood, A., Attiyeh, E. F., . . . Maris, J. M. (2008). Identification of ALK as a major familial neuroblastoma predisposition gene. Nature, 455(7215), 930-935. doi:10.1038/nature07261
Muller, H., Schmidt, D., Steinbrink, S., Mirgorodskaya, E., Lehmann, V., Habermann, K., . . . Lange, B. M. (2010). Proteomic and functional analysis of the mitotic Drosophila centrosome. EMBO J, 29(19), 3344-3357. doi:10.1038/emboj.2010.210
Muncan, V., Sansom, O. J., Tertoolen, L., Phesse, T. J., Begthel, H., Sancho, E., . . . Clarke, A. R. (2006). Rapid loss of intestinal crypts upon conditional deletion of the Wnt/Tcf-4 target gene c-Myc. Mol Cell Biol, 26(22), 8418-8426. doi:10.1128/MCB.00821-06
Muse, G. W., Gilchrist, D. A., Nechaev, S., Shah, R., Parker, J. S., Grissom, S. F., . . . Adelman, K. (2007). RNA polymerase is poised for activation across the genome. Nat Genet, 39(12), 1507-1511. doi:10.1038/ng.2007.21
Nair, S. K., & Burley, S. K. (2003). X-ray structures of Myc-Max and Mad-Max recognizing DNA. Molecular bases of regulation by proto-oncogenic transcription factors. Cell, 112(2), 193-205. doi:10.1016/s0092-8674(02)01284-9
Nau, M. M., Brooks, B. J., Battey, J., Sausville, E., Gazdar, A. F., Kirsch, I. R., . . . Minna, J. D. (1985). L-myc, a new myc-related gene amplified and expressed in human small cell lung cancer. Nature, 318(6041), 69-73. doi:10.1038/318069a0
NB97, Neuroblastomstudie (2002) Nesbit, C. E., Tersak, J. M., & Prochownik, E. V. (1999). MYC oncogenes and human
neoplastic disease. Oncogene, 18(19), 3004-3016. doi:10.1038/sj.onc.1202746 Ngan, E. S. (2015). Heterogeneity of neuroblastoma. Oncoscience, 2(10), 837-838.
doi:10.18632/oncoscience.216 Nguyen, H. D., Leong, W. Y., Li, W., Reddy, P. N. G., Sullivan, J. D., Walter, M. J., . . . Graubert,
T. A. (2018). Spliceosome Mutations Induce R Loop-Associated Sensitivity to ATR
145
Inhibition in Myelodysplastic Syndromes. Cancer Res, 78(18), 5363-5374. doi:10.1158/0008-5472.CAN-17-3970
Nguyen, H. G., Chinnappan, D., Urano, T., & Ravid, K. (2005). Mechanism of Aurora-B degradation and its dependency on intact KEN and A-boxes: identification of an aneuploidy-promoting property. Mol Cell Biol, 25(12), 4977-4992. doi:10.1128/MCB.25.12.4977-4992.2005
Nicol, J. W., Helt, G. A., Blanchard, S. G., Jr., Raja, A., & Loraine, A. E. (2009). The Integrated Genome Browser: free software for distribution and exploration of genome-scale datasets. Bioinformatics, 25(20), 2730-2731. doi:10.1093/bioinformatics/btp472
Nie, Z., Hu, G., Wei, G., Cui, K., Yamane, A., Resch, W., . . . Levens, D. (2012). c-Myc is a universal amplifier of expressed genes in lymphocytes and embryonic stem cells. Cell, 151(1), 68-79. doi:10.1016/j.cell.2012.08.033
Niehrs, C., & Luke, B. (2020). Regulatory R-loops as facilitators of gene expression and genome stability. Nature Reviews Molecular Cell Biology, 21(3), 167-178. doi:10.1038/s41580-019-0206-3
Nigg, E. A. (1995). Cyclin-dependent protein kinases: key regulators of the eukaryotic cell cycle. Bioessays, 17(6), 471-480. doi:10.1002/bies.950170603
Nigg, E. A. (2001). Mitotic kinases as regulators of cell division and its checkpoints. Nat Rev Mol Cell Biol, 2(1), 21-32. doi:10.1038/35048096
Nikonova, A. S., Astsaturov, I., Serebriiskii, I. G., Dunbrack, R. L., Jr., & Golemis, E. A. (2013). Aurora A kinase (AURKA) in normal and pathological cell division. Cell Mol Life Sci, 70(4), 661-687. doi:10.1007/s00018-012-1073-7
Nowacki, S., Skowron, M., Oberthuer, A., Fagin, A., Voth, H., Brors, B., . . . Fischer, M. (2008). Expression of the tumour suppressor gene CADM1 is associated with favourable outcome and inhibits cell survival in neuroblastoma. Oncogene, 27(23), 3329-3338. doi:10.1038/sj.onc.1210996
Nowotny, M., Cerritelli, S. M., Ghirlando, R., Gaidamakov, S. A., Crouch, R. J., & Yang, W. (2008). Specific recognition of RNA/DNA hybrid and enhancement of human RNase H1 activity by HBD. EMBO J, 27(7), 1172-1181. doi:10.1038/emboj.2008.44
Okamoto, Y., Abe, M., Itaya, A., Tomida, J., Ishiai, M., Takaori-Kondo, A., . . . Takata, M. (2019). FANCD2 protects genome stability by recruiting RNA processing enzymes to resolve R-loops during mild replication stress. Febs j, 286(1), 139-150. doi:10.1111/febs.14700
Okuda, M., Horn, H. F., Tarapore, P., Tokuyama, Y., Smulian, A. G., Chan, P. K., . . . Fukasawa, K. (2000). Nucleophosmin/B23 is a target of CDK2/cyclin E in centrosome duplication. Cell, 103(1), 127-140. doi:10.1016/s0092-8674(00)00093-3
Olson, C. M., Jiang, B., Erb, M. A., Liang, Y., Doctor, Z. M., Zhang, Z., . . . Gray, N. S. (2018). Pharmacological perturbation of CDK9 using selective CDK9 inhibition or degradation. Nat Chem Biol, 14(2), 163-170. doi:10.1038/nchembio.2538
Otto, T., Horn, S., Brockmann, M., Eilers, U., Schuttrumpf, L., Popov, N., . . . Eilers, M. (2009). Stabilization of N-Myc is a critical function of Aurora A in human neuroblastoma. Cancer Cell, 15(1), 67-78. doi:10.1016/j.ccr.2008.12.005
Otto, T., & Sicinski, P. (2017). Cell cycle proteins as promising targets in cancer therapy. Nat Rev Cancer, 17(2), 93-115. doi:10.1038/nrc.2016.138
Park, S. H., Kang, N., Song, E., Wie, M., Lee, E. A., Hwang, S., . . . Myung, K. (2019). ATAD5 promotes replication restart by regulating RAD51 and PCNA in response to replication stress. Nature Communications, 10(1), 5718. doi:10.1038/s41467-019-13667-4
Pattyn, A., Morin, X., Cremer, H., Goridis, C., & Brunet, J. F. (1999). The homeobox gene Phox2b is essential for the development of autonomic neural crest derivatives. Nature, 399(6734), 366-370. doi:10.1038/20700
Peifer, M., Hertwig, F., Roels, F., Dreidax, D., Gartlgruber, M., Menon, R., . . . Fischer, M. (2015). Telomerase activation by genomic rearrangements in high-risk neuroblastoma. Nature, 526(7575), 700-704. doi:10.1038/nature14980

146
Peng, J., Marshall, N. F., & Price, D. H. (1998). Identification of a cyclin subunit required for the function of Drosophila P-TEFb. J Biol Chem, 273(22), 13855-13860. doi:10.1074/jbc.273.22.13855
Petersen, B. O., Lukas, J., Sorensen, C. S., Bartek, J., & Helin, K. (1999). Phosphorylation of mammalian CDC6 by cyclin A/CDK2 regulates its subcellular localization. EMBO J, 18(2), 396-410. doi:10.1093/emboj/18.2.396
Pillay, N., Tighe, A., Nelson, L., Littler, S., Coulson-Gilmer, C., Bah, N., . . . Taylor, S. S. (2019). DNA Replication Vulnerabilities Render Ovarian Cancer Cells Sensitive to Poly(ADP-Ribose) Glycohydrolase Inhibitors. Cancer Cell, 35(3), 519-533.e518. doi:10.1016/j.ccell.2019.02.004
Pinyol, R., Scrofani, J., & Vernos, I. (2013). The role of NEDD1 phosphorylation by Aurora A in chromosomal microtubule nucleation and spindle function. Curr Biol, 23(2), 143-149. doi:10.1016/j.cub.2012.11.046
Plotnikova, O. V., Nikonova, A. S., Loskutov, Y. V., Kozyulina, P. Y., Pugacheva, E. N., & Golemis, E. A. (2012). Calmodulin activation of Aurora-A kinase (AURKA) is required during ciliary disassembly and in mitosis. Mol Biol Cell, 23(14), 2658-2670. doi:10.1091/mbc.E11-12-1056
Plotnikova, O. V., Pugacheva, E. N., Dunbrack, R. L., & Golemis, E. A. (2010). Rapid calcium-dependent activation of Aurora-A kinase. Nat Commun, 1, 64. doi:10.1038/ncomms1061
Polioudaki, H., Markaki, Y., Kourmouli, N., Dialynas, G., Theodoropoulos, P. A., Singh, P. B., & Georgatos, S. D. (2004). Mitotic phosphorylation of histone H3 at threonine 3. FEBS Lett, 560(1-3), 39-44. doi:10.1016/S0014-5793(04)00060-2
Porrua, O., & Libri, D. (2015). Transcription termination and the control of the transcriptome: why, where and how to stop. Nat Rev Mol Cell Biol, 16(3), 190-202. doi:10.1038/nrm3943
Prendergast, G. C., & Ziff, E. B. (1991). Methylation-sensitive sequence-specific DNA binding by the c-Myc basic region. Science, 251(4990), 186-189. doi:10.1126/science.1987636
ProteinAtlas: URL: http//www.proteinatlas.org/ : (10.01.2021) Pugacheva, E. N., Jablonski, S. A., Hartman, T. R., Henske, E. P., & Golemis, E. A. (2007).
HEF1-dependent Aurora A activation induces disassembly of the primary cilium. Cell, 129(7), 1351-1363. doi:10.1016/j.cell.2007.04.035
Pulverer, B. J., Fisher, C., Vousden, K., Littlewood, T., Evan, G., & Woodgett, J. R. (1994). Site-specific modulation of c-Myc cotransformation by residues phosphorylated in vivo. Oncogene, 9(1), 59-70. Retrieved from https://www.ncbi.nlm.nih.gov/pubmed/8302604
Qi, W., Cooke, L. S., Liu, X., Rimsza, L., Roe, D. J., Manziolli, A., . . . Mahadevan, D. (2011). Aurora inhibitor MLN8237 in combination with docetaxel enhances apoptosis and anti-tumor activity in mantle cell lymphoma. Biochemical pharmacology, 81(7), 881-890. doi:10.1016/j.bcp.2011.01.017
Qiu, S., Liu, J., & Xing, F. (2017). Antizyme inhibitor 1: a potential carcinogenic molecule. Cancer Sci, 108(2), 163-169. doi:10.1111/cas.13122
Quinlan, A. R. (2014). BEDTools: The Swiss-Army Tool for Genome Feature Analysis. Curr Protoc Bioinformatics, 47, 11 12 11-34. doi:10.1002/0471250953.bi1112s47
Raabe, E. H., Laudenslager, M., Winter, C., Wasserman, N., Cole, K., LaQuaglia, M., . . . Maris, J. M. (2008). Prevalence and functional consequence of PHOX2B mutations in neuroblastoma. Oncogene, 27(4), 469-476. doi:10.1038/sj.onc.1210659
Ray-Gallet, D., Woolfe, A., Vassias, I., Pellentz, C., Lacoste, N., Puri, A., . . . Almouzni, G. (2011). Dynamics of histone H3 deposition in vivo reveal a nucleosome gap-filling mechanism for H3.3 to maintain chromatin integrity. Mol Cell, 44(6), 928-941. doi:10.1016/j.molcel.2011.12.006
Ray Chaudhuri, A., & Nussenzweig, A. (2017). The multifaceted roles of PARP1 in DNA repair and chromatin remodelling. Nat Rev Mol Cell Biol, 18(10), 610-621. doi:10.1038/nrm.2017.53

147
Reboutier, D., Troadec, M. B., Cremet, J. Y., Fukasawa, K., & Prigent, C. (2012). Nucleophosmin/B23 activates Aurora A at the centrosome through phosphorylation of serine 89. J Cell Biol, 197(1), 19-26. doi:10.1083/jcb.201107134
Reppas, N. B., Wade, J. T., Church, G. M., & Struhl, K. (2006). The transition between transcriptional initiation and elongation in E. coli is highly variable and often rate limiting. Mol Cell, 24(5), 747-757. doi:10.1016/j.molcel.2006.10.030
Richard, P., Feng, S., & Manley, J. L. (2013). A SUMO-dependent interaction between Senataxin and the exosome, disrupted in the neurodegenerative disease AOA2, targets the exosome to sites of transcription-induced DNA damage. Genes Dev, 27(20), 2227-2232. doi:10.1101/gad.224923.113
Richards, M. W., Burgess, S. G., Poon, E., Carstensen, A., Eilers, M., Chesler, L., & Bayliss, R. (2016). Structural basis of N-Myc binding by Aurora-A and its destabilization by kinase inhibitors. Proc Natl Acad Sci U S A, 113(48), 13726-13731. doi:10.1073/pnas.1610626113
Richie, C. T., & Golden, A. (2005). Chromosome segregation: Aurora B gets Tousled. Curr Biol, 15(10), R379-382. doi:10.1016/j.cub.2005.05.009
Ries, L. A. G., & SEER Program (National Cancer Institute (U.S.)). (1999). Cancer incidence and survival among children and adolescents : United States SEER program 1975-1995 /[edited by Lynn A. Gloecker Ries ... et al.]. Bethesda, MD: National Cancer Institute, SEER Program.
Ritchie, M. E., Phipson, B., Wu, D., Hu, Y., Law, C. W., Shi, W., & Smyth, G. K. (2015). limma powers differential expression analyses for RNA-sequencing and microarray studies. Nucleic Acids Res, 43(7), e47. doi:10.1093/nar/gkv007
Roderwieser, A., Sand, F., Walter, E., Fischer, J., Gecht, J., Bartenhagen, C., . . . Fischer, M. (2019). Telomerase Is a Prognostic Marker of Poor Outcome and a Therapeutic Target in Neuroblastoma. JCO Precision Oncology(3), 1-20. doi:10.1200/po.19.00072
Roeschert, I., Poon, E., Henssen, A. G., Dorado Garcia, H., Gatti, M., Giansanti, C., . . . Büchel, G., Eilers, M. (2021). Combined inhibition of Aurora-A and ATR kinases results in regression of MYCN-amplified neuroblastoma. Nature Cancer. doi:10.1038/s43018-020-00171-8
Roghi, C., Giet, R., Uzbekov, R., Morin, N., Chartrain, I., Le Guellec, R., . . . Prigent, C. (1998). The Xenopus protein kinase pEg2 associates with the centrosome in a cell cycle-dependent manner, binds to the spindle microtubules and is involved in bipolar mitotic spindle assembly. J Cell Sci, 111 ( Pt 5), 557-572. Retrieved from https://www.ncbi.nlm.nih.gov/pubmed/9454730
Ronson, G. E., Piberger, A. L., Higgs, M. R., Olsen, A. L., Stewart, G. S., McHugh, P. J., . . . Lakin, N. D. (2018). PARP1 and PARP2 stabilise replication forks at base excision repair intermediates through Fbh1-dependent Rad51 regulation. Nat Commun, 9(1), 746. doi:10.1038/s41467-018-03159-2
Rosenthal, A., Kumar, S., Hofmeister, C., Laubach, J., Vij, R., Dueck, A., . . . Stewart, A. K. (2016). A Phase Ib Study of the combination of the Aurora Kinase Inhibitor Alisertib (MLN8237) and Bortezomib in Relapsed Multiple Myeloma. British journal of haematology, 174(2), 323-325. doi:10.1111/bjh.13765
Rowbotham, S. P., Barki, L., Neves-Costa, A., Santos, F., Dean, W., Hawkes, N., . . . Mermoud, J. E. (2011). Maintenance of silent chromatin through replication requires SWI/SNF-like chromatin remodeler SMARCAD1. Mol Cell, 42(3), 285-296. doi:10.1016/j.molcel.2011.02.036
Ruffner, H., & Verma, I. M. (1997). BRCA1 is a cell cycle-regulated nuclear phosphoprotein. Proc Natl Acad Sci U S A, 94(14), 7138-7143. doi:10.1073/pnas.94.14.7138
Sabò, A., Kress, T. R., Pelizzola, M., de Pretis, S., Gorski, M. M., Tesi, A., . . . Amati, B. (2014). Selective transcriptional regulation by Myc in cellular growth control and lymphomagenesis. Nature, 511(7510), 488-492. doi:10.1038/nature13537

148
Saito-Ohara, F., Imoto, I., Inoue, J., Hosoi, H., Nakagawara, A., Sugimoto, T., & Inazawa, J. (2003). PPM1D is a potential target for 17q gain in neuroblastoma. Cancer Res, 63(8), 1876-1883. Retrieved from https://www.ncbi.nlm.nih.gov/pubmed/12702577
Saldi, T., Cortazar, M. A., Sheridan, R. M., & Bentley, D. L. (2016). Coupling of RNA Polymerase II Transcription Elongation with Pre-mRNA Splicing. J Mol Biol, 428(12), 2623-2635. doi:10.1016/j.jmb.2016.04.017
Saldivar, J. C., Cortez, D., & Cimprich, K. A. (2017). The essential kinase ATR: ensuring faithful duplication of a challenging genome. Nat Rev Mol Cell Biol, 18(10), 622-636. doi:10.1038/nrm.2017.67
Sano, H., Bonadio, J., Gerbing, R. B., London, W. B., Matthay, K. K., Lukens, J. N., & Shimada, H. (2006). International neuroblastoma pathology classification adds independent prognostic information beyond the prognostic contribution of age. Eur J Cancer, 42(8), 1113-1119. doi:10.1016/j.ejca.2005.11.031
Sanso, M., Levin, R. S., Lipp, J. J., Wang, V. Y., Greifenberg, A. K., Quezada, E. M., . . . Fisher, R. P. (2016). P-TEFb regulation of transcription termination factor Xrn2 revealed by a chemical genetic screen for Cdk9 substrates. Genes Dev, 30(1), 117-131. doi:10.1101/gad.269589.115
Sardon, T., Pache, R. A., Stein, A., Molina, H., Vernos, I., & Aloy, P. (2010). Uncovering new substrates for Aurora A kinase. EMBO Rep, 11(12), 977-984. doi:10.1038/embor.2010.171
Sasai, K., Parant, J. M., Brandt, M. E., Carter, J., Adams, H. P., Stass, S. A., . . . Sen, S. (2008). Targeted disruption of Aurora A causes abnormal mitotic spindle assembly, chromosome misalignment and embryonic lethality. Oncogene, 27(29), 4122-4127. doi:10.1038/onc.2008.47
Sausen, M., Leary, R. J., Jones, S., Wu, J., Reynolds, C. P., Liu, X., . . . Hogarty, M. D. (2013). Integrated genomic analyses identify ARID1A and ARID1B alterations in the childhood cancer neuroblastoma. Nat Genet, 45(1), 12-17. doi:10.1038/ng.2493
Sawatsubashi, S., Murata, T., Lim, J., Fujiki, R., Ito, S., Suzuki, E., . . . Kato, S. (2010). A histone chaperone, DEK, transcriptionally coactivates a nuclear receptor. Genes Dev, 24(2), 159-170. doi:10.1101/gad.1857410
Sawicka, A., & Seiser, C. (2012). Histone H3 phosphorylation - a versatile chromatin modification for different occasions. Biochimie, 94(11), 2193-2201. doi:10.1016/j.biochi.2012.04.018
Schaub, F. X., Dhankani, V., Berger, A. C., Trivedi, M., Richardson, A. B., Shaw, R., . . . Cancer Genome Atlas, N. (2018). Pan-cancer Alterations of the MYC Oncogene and Its Proximal Network across the Cancer Genome Atlas. Cell Syst, 6(3), 282-300 e282. doi:10.1016/j.cels.2018.03.003
Schmittgen, T. D., & Livak, K. J. (2008). Analyzing real-time PCR data by the comparative C(T) method. Nat Protoc, 3(6), 1101-1108. doi:10.1038/nprot.2008.73
Schnepp, R. W., Khurana, P., Attiyeh, E. F., Raman, P., Chodosh, S. E., Oldridge, D. A., . . . Diskin, S. J. (2015). A LIN28B-RAN-AURKA Signaling Network Promotes Neuroblastoma Tumorigenesis. Cancer Cell, 28(5), 599-609. doi:10.1016/j.ccell.2015.09.012
Schukur, L., Zimmermann, T., Niewoehner, O., Kerr, G., Gleim, S., Bauer-Probst, B., . . . Thoma, C. R. (2020). Identification of the HECT E3 ligase UBR5 as a regulator of MYC degradation using a CRISPR/Cas9 screen. Scientific Reports, 10(1), 20044. doi:10.1038/s41598-020-76960-z
Schulte, J. H., & Eggert, A. (2015). Neuroblastoma. Crit Rev Oncog, 20(3-4), 245-270. doi:10.1615/critrevoncog.2015014033
Schulze, A., Zerfass, K., Spitkovsky, D., Middendorp, S., Berges, J., Helin, K., . . . Henglein, B. (1995). Cell cycle regulation of the cyclin A gene promoter is mediated by a variant E2F site. Proc Natl Acad Sci U S A, 92(24), 11264-11268. doi:10.1073/pnas.92.24.11264

149
Schvartzman, J. B., Krimer, D. B., & Van't Hof, J. (1984). The effects of different thymidine concentrations on DNA replication in pea-root cells synchronized by a protracted 5-fluorodeoxyuridine treatment. Exp Cell Res, 150(2), 379-389. doi:10.1016/0014-4827(84)90581-0
Schwab, M., Westermann, F., Hero, B., & Berthold, F. (2003). Neuroblastoma: biology and molecular and chromosomal pathology. Lancet Oncol, 4(8), 472-480. doi:10.1016/s1470-2045(03)01166-5
Schwartz, D., & Rotter, V. (1998). p53-dependent cell cycle control: response to genotoxic stress. Semin Cancer Biol, 8(5), 325-336. doi:10.1006/scbi.1998.0095
Seeger, R. C., Brodeur, G. M., Sather, H., Dalton, A., Siegel, S. E., Wong, K. Y., & Hammond, D. (1985). Association of multiple copies of the N-myc oncogene with rapid progression of neuroblastomas. N Engl J Med, 313(18), 1111-1116. doi:10.1056/NEJM198510313131802
Seki, A., Coppinger, J. A., Jang, C. Y., Yates, J. R., & Fang, G. (2008). Bora and the kinase Aurora a cooperatively activate the kinase Plk1 and control mitotic entry. Science, 320(5883), 1655-1658. doi:10.1126/science.1157425
Sen, S., Zhou, H., Zhang, R. D., Yoon, D. S., Vakar-Lopez, F., Ito, S., . . . Czerniak, B. (2002). Amplification/overexpression of a mitotic kinase gene in human bladder cancer. J Natl Cancer Inst, 94(17), 1320-1329. doi:10.1093/jnci/94.17.1320
Sever-Chroneos, Z., Angus, S. P., Fribourg, A. F., Wan, H., Todorov, I., Knudsen, K. E., & Knudsen, E. S. (2001). Retinoblastoma tumor suppressor protein signals through inhibition of cyclin-dependent kinase 2 activity to disrupt PCNA function in S phase. Mol Cell Biol, 21(12), 4032-4045. doi:10.1128/MCB.21.12.4032-4045.2001
Shang, X., Burlingame, S. M., Okcu, M. F., Ge, N., Russell, H. V., Egler, R. A., . . . Nuchtern, J. G. (2009). Aurora A is a negative prognostic factor and a new therapeutic target in human neuroblastoma. Mol Cancer Ther, 8(8), 2461-2469. doi:10.1158/1535-7163.MCT-08-0857
Shao, W., & Zeitlinger, J. (2017). Paused RNA polymerase II inhibits new transcriptional initiation. Nat Genet, 49(7), 1045-1051. doi:10.1038/ng.3867
Sheiness, D., & Bishop, J. M. (1979). DNA and RNA from uninfected vertebrate cells contain nucleotide sequences related to the putative transforming gene of avian myelocytomatosis virus. J Virol, 31(2), 514-521. doi:10.1128/JVI.31.2.514-521.1979
Shen, L., Shao, N., Liu, X., & Nestler, E. (2014). ngs.plot: Quick mining and visualization of next-generation sequencing data by integrating genomic databases. BMC Genomics, 15, 284. doi:10.1186/1471-2164-15-284
Shi, J., & Vakoc, C. R. (2014). The mechanisms behind the therapeutic activity of BET bromodomain inhibition. Mol Cell, 54(5), 728-736. doi:10.1016/j.molcel.2014.05.016
Shimada, H., Ambros, I. M., Dehner, L. P., Hata, J., Joshi, V. V., Roald, B., . . . Castleberry, R. P. (1999). The International Neuroblastoma Pathology Classification (the Shimada system). Cancer, 86(2), 364-372. Retrieved from https://www.ncbi.nlm.nih.gov/pubmed/10421273
Shimada, H., Chatten, J., Newton, W. A., Jr., Sachs, N., Hamoudi, A. B., Chiba, T., . . . Misugi, K. (1984). Histopathologic prognostic factors in neuroblastic tumors: definition of subtypes of ganglioneuroblastoma and an age-linked classification of neuroblastomas. J Natl Cancer Inst, 73(2), 405-416. doi:10.1093/jnci/73.2.405
Shimomura, T., Hasako, S., Nakatsuru, Y., Mita, T., Ichikawa, K., Kodera, T., . . . Iwasawa, Y. (2010). MK-5108, a highly selective Aurora-A kinase inhibitor, shows antitumor activity alone and in combination with docetaxel. Mol Cancer Ther, 9(1), 157-166. doi:10.1158/1535-7163.MCT-09-0609
Shiotani, B., Nguyen, H. D., Hakansson, P., Marechal, A., Tse, A., Tahara, H., & Zou, L. (2013). Two distinct modes of ATR activation orchestrated by Rad17 and Nbs1. Cell Rep, 3(5), 1651-1662. doi:10.1016/j.celrep.2013.04.018

150
Shyu, A. B., Greenberg, M. E., & Belasco, J. G. (1989). The c-fos transcript is targeted for rapid decay by two distinct mRNA degradation pathways. Genes Dev, 3(1), 60-72. doi:10.1101/gad.3.1.60
Siegel, R. L., Miller, K. D., & Jemal, A. (2019). Cancer statistics, 2019. CA Cancer J Clin, 69(1), 7-34. doi:10.3322/caac.21551
Sjostrom, S. K., Finn, G., Hahn, W. C., Rowitch, D. H., & Kenney, A. M. (2005). The Cdk1 complex plays a prime role in regulating N-myc phosphorylation and turnover in neural precursors. Dev Cell, 9(3), 327-338. doi:10.1016/j.devcel.2005.07.014
Slade, D. (2020). PARP and PARG inhibitors in cancer treatment. Genes Dev, 34(5-6), 360-394. doi:10.1101/gad.334516.119
Soucek, L., & Evan, G. I. (2010). The ups and downs of Myc biology. Curr Opin Genet Dev, 20(1), 91-95. doi:10.1016/j.gde.2009.11.001
Soucek, L., Helmer-Citterich, M., Sacco, A., Jucker, R., Cesareni, G., & Nasi, S. (1998). Design and properties of a Myc derivative that efficiently homodimerizes. Oncogene, 17(19), 2463-2472. doi:10.1038/sj.onc.1202199
Soucek, L., Jucker, R., Panacchia, L., Ricordy, R., Tato, F., & Nasi, S. (2002). Omomyc, a potential Myc dominant negative, enhances Myc-induced apoptosis. Cancer Res, 62(12), 3507-3510. Retrieved from https://www.ncbi.nlm.nih.gov/pubmed/12067996
Soucek, L., Nasi, S., & Evan, G. I. (2004). Omomyc expression in skin prevents Myc-induced papillomatosis. Cell Death Differ, 11(9), 1038-1045. doi:10.1038/sj.cdd.4401443
Soucek, L., Whitfield, J., Martins, C. P., Finch, A. J., Murphy, D. J., Sodir, N. M., . . . Evan, G. I. (2008). Modelling Myc inhibition as a cancer therapy. Nature, 455(7213), 679-683. doi:10.1038/nature07260
Soucek, L., Whitfield, J. R., Sodir, N. M., Masso-Valles, D., Serrano, E., Karnezis, A. N., . . . Evan, G. I. (2013). Inhibition of Myc family proteins eradicates KRas-driven lung cancer in mice. Genes Dev, 27(5), 504-513. doi:10.1101/gad.205542.112
Sporbert, A., Domaing, P., Leonhardt, H., & Cardoso, M. C. (2005). PCNA acts as a stationary loading platform for transiently interacting Okazaki fragment maturation proteins. Nucleic Acids Res, 33(11), 3521-3528. doi:10.1093/nar/gki665
Staller, P., Peukert, K., Kiermaier, A., Seoane, J., Lukas, J., Karsunky, H., . . . Eilers, M. (2001). Repression of p15INK4b expression by Myc through association with Miz-1. Nat Cell Biol, 3(4), 392-399. doi:10.1038/35070076
Stanton, B. R., Perkins, A. S., Tessarollo, L., Sassoon, D. A., & Parada, L. F. (1992). Loss of N-myc function results in embryonic lethality and failure of the epithelial component of the embryo to develop. Genes Dev, 6(12A), 2235-2247. doi:10.1101/gad.6.12a.2235
Subramanian, A., Tamayo, P., Mootha, V. K., Mukherjee, S., Ebert, B. L., Gillette, M. A., . . . Mesirov, J. P. (2005). Gene set enrichment analysis: a knowledge-based approach for interpreting genome-wide expression profiles. Proc Natl Acad Sci U S A, 102(43), 15545-15550. doi:10.1073/pnas.0506580102
Sugimoto, K., Urano, T., Zushi, H., Inoue, K., Tasaka, H., Tachibana, M., & Dotsu, M. (2002). Molecular dynamics of Aurora-A kinase in living mitotic cells simultaneously visualized with histone H3 and nuclear membrane protein importinalpha. Cell Struct Funct, 27(6), 457-467. doi:10.1247/csf.27.457
Sun, C. (2020). The SF3b complex: splicing and beyond. Cellular and Molecular Life Sciences, 77(18), 3583-3595. doi:10.1007/s00018-020-03493-z
Sur, S., & Agrawal, D. K. (2016). Phosphatases and kinases regulating CDC25 activity in the cell cycle: clinical implications of CDC25 overexpression and potential treatment strategies. Molecular and cellular biochemistry, 416(1-2), 33-46. doi:10.1007/s11010-016-2693-2
Tagami, H., Ray-Gallet, D., Almouzni, G., & Nakatani, Y. (2004). Histone H3.1 and H3.3 complexes mediate nucleosome assembly pathways dependent or independent of DNA synthesis. Cell, 116(1), 51-61. doi:10.1016/s0092-8674(03)01064-x

151
Taguchi, S., Honda, K., Sugiura, K., Yamaguchi, A., Furukawa, K., & Urano, T. (2002). Degradation of human Aurora-A protein kinase is mediated by hCdh1. FEBS Lett, 519(1-3), 59-65. doi:10.1016/s0014-5793(02)02711-4
Tang, A., Gao, K., Chu, L., Zhang, R., Yang, J., & Zheng, J. (2017). Aurora kinases: novel therapy targets in cancers. Oncotarget, 8(14), 23937-23954. doi:10.18632/oncotarget.14893
Tesi, A., de Pretis, S., Furlan, M., Filipuzzi, M., Morelli, M. J., Andronache, A., . . . Sabò, A. (2019). An early Myc-dependent transcriptional program orchestrates cell growth during B-cell activation. EMBO Rep, 20(9), e47987. doi:10.15252/embr.201947987
Thomas, L. R., Foshage, A. M., Weissmiller, A. M., Popay, T. M., Grieb, B. C., Qualls, S. J., . . . Tansey, W. P. (2016). Interaction of MYC with host cell factor-1 is mediated by the evolutionarily conserved Myc box IV motif. Oncogene, 35(27), 3613-3618. doi:10.1038/onc.2015.416
Thomas, L. R., Wang, Q., Grieb, B. C., Phan, J., Foshage, A. M., Sun, Q., . . . Tansey, W. P. (2015). Interaction with WDR5 promotes target gene recognition and tumorigenesis by MYC. Mol Cell, 58(3), 440-452. doi:10.1016/j.molcel.2015.02.028
Tillery, M. M. L., Blake-Hedges, C., Zheng, Y., Buchwalter, R. A., & Megraw, T. L. (2018). Centrosomal and Non-Centrosomal Microtubule-Organizing Centers (MTOCs) in Drosophila melanogaster. Cells, 7(9). doi:10.3390/cells7090121
Trochet, D., Bourdeaut, F., Janoueix-Lerosey, I., Deville, A., de Pontual, L., Schleiermacher, G., . . . Amiel, J. (2004). Germline mutations of the paired-like homeobox 2B (PHOX2B) gene in neuroblastoma. Am J Hum Genet, 74(4), 761-764. doi:10.1086/383253
Trumpp, A., Refaeli, Y., Oskarsson, T., Gasser, S., Murphy, M., Martin, G. R., & Bishop, J. M. (2001). c-Myc regulates mammalian body size by controlling cell number but not cell size. Nature, 414(6865), 768-773. doi:10.1038/414768a
Tsai, M. Y., Wiese, C., Cao, K., Martin, O., Donovan, P., Ruderman, J., . . . Zheng, Y. (2003). A Ran signalling pathway mediated by the mitotic kinase Aurora A in spindle assembly. Nat Cell Biol, 5(3), 242-248. doi:10.1038/ncb936
Umbreit, N. T., Zhang, C. Z., Lynch, L. D., Blaine, L. J., Cheng, A. M., Tourdot, R., . . . Pellman, D. (2020). Mechanisms generating cancer genome complexity from a single cell division error. Science, 368(6488). doi:10.1126/science.aba0712
Vader, G., & Lens, S. M. (2008). The Aurora kinase family in cell division and cancer. Biochim Biophys Acta, 1786(1), 60-72. doi:10.1016/j.bbcan.2008.07.003
Valentijn, L. J., Koster, J., Zwijnenburg, D. A., Hasselt, N. E., van Sluis, P., Volckmann, R., . . . Versteeg, R. (2015). TERT rearrangements are frequent in neuroblastoma and identify aggressive tumors. Nat Genet, 47(12), 1411-1414. doi:10.1038/ng.3438
van Groningen, T., Koster, J., Valentijn, L. J., Zwijnenburg, D. A., Akogul, N., Hasselt, N. E., . . . Versteeg, R. (2017). Neuroblastoma is composed of two super-enhancer-associated differentiation states. Nat Genet, 49(8), 1261-1266. doi:10.1038/ng.3899
Vandesompele, J., Baudis, M., De Preter, K., Van Roy, N., Ambros, P., Bown, N., . . . Speleman, F. (2005). Unequivocal delineation of clinicogenetic subgroups and development of a new model for improved outcome prediction in neuroblastoma. J Clin Oncol, 23(10), 2280-2299. doi:10.1200/JCO.2005.06.104
Vaughn, J. P., Davis, P. L., Jarboe, M. D., Huper, G., Evans, A. C., Wiseman, R. W., . . . Marks, J. R. (1996). BRCA1 expression is induced before DNA synthesis in both normal and tumor-derived breast cells. Cell Growth Differ, 7(6), 711-715. Retrieved from https://www.ncbi.nlm.nih.gov/pubmed/8780884
Veerakumarasivam, A., Goldstein, L. D., Saeb-Parsy, K., Scott, H. E., Warren, A., Thorne, N. P., . . . Kelly, J. D. (2008). AURKA overexpression accompanies dysregulation of DNA-damage response genes in invasive urothelial cell carcinoma. Cell Cycle, 7(22), 3525-3533. doi:10.4161/cc.7.22.7042
Vo, B. T., Wolf, E., Kawauchi, D., Gebhardt, A., Rehg, J. E., Finkelstein, D., . . . Roussel, M. F. (2016). The Interaction of Myc with Miz1 Defines Medulloblastoma Subgroup Identity. Cancer Cell, 29(1), 5-16. doi:10.1016/j.ccell.2015.12.003

152
von der Lehr, N., Johansson, S., Wu, S., Bahram, F., Castell, A., Cetinkaya, C., . . . Larsson, L. G. (2003). The F-box protein Skp2 participates in c-Myc proteosomal degradation and acts as a cofactor for c-Myc-regulated transcription. Mol Cell, 11(5), 1189-1200. doi:10.1016/s1097-2765(03)00193-x
Vos, S. M., Farnung, L., Boehning, M., Wigge, C., Linden, A., Urlaub, H., & Cramer, P. (2018). Structure of activated transcription complex Pol II-DSIF-PAF-SPT6. Nature, 560(7720), 607-612. doi:10.1038/s41586-018-0440-4
Waga, S., & Stillman, B. (1998). The DNA replication fork in eukaryotic cells. Annu Rev Biochem, 67, 721-751. doi:10.1146/annurev.biochem.67.1.721
Walz, S., Lorenzin, F., Morton, J., Wiese, K. E., von Eyss, B., Herold, S., . . . Eilers, M. (2014). Activation and repression by oncogenic MYC shape tumour-specific gene expression profiles. Nature, 511(7510), 483-487. doi:10.1038/nature13473
Wang, H., Hammoudeh, D. I., Follis, A. V., Reese, B. E., Lazo, J. S., Metallo, S. J., & Prochownik, E. V. (2007). Improved low molecular weight Myc-Max inhibitors. Mol Cancer Ther, 6(9), 2399-2408. doi:10.1158/1535-7163.MCT-07-0005
Wang, L. L., Teshiba, R., Ikegaki, N., Tang, X. X., Naranjo, A., London, W. B., . . . Shimada, H. (2015). Augmented expression of MYC and/or MYCN protein defines highly aggressive MYC-driven neuroblastoma: a Children's Oncology Group study. Br J Cancer, 113(1), 57-63. doi:10.1038/bjc.2015.188
Watanabe, N., Arai, H., Iwasaki, J., Shiina, M., Ogata, K., Hunter, T., & Osada, H. (2005). Cyclin-dependent kinase (CDK) phosphorylation destabilizes somatic Wee1 via multiple pathways. Proc Natl Acad Sci U S A, 102(33), 11663-11668. doi:10.1073/pnas.0500410102
Weiss, W. A., Aldape, K., Mohapatra, G., Feuerstein, B. G., & Bishop, J. M. (1997). Targeted expression of MYCN causes neuroblastoma in transgenic mice. EMBO J, 16(11), 2985-2995. doi:10.1093/emboj/16.11.2985
Welcker, M., Orian, A., Grim, J. E., Eisenman, R. N., & Clurman, B. E. (2004a). A nucleolar isoform of the Fbw7 ubiquitin ligase regulates c-Myc and cell size. Curr Biol, 14(20), 1852-1857. doi:10.1016/j.cub.2004.09.083
Welcker, M., Orian, A., Jin, J., Grim, J. E., Harper, J. W., Eisenman, R. N., & Clurman, B. E. (2004b). The Fbw7 tumor suppressor regulates glycogen synthase kinase 3 phosphorylation-dependent c-Myc protein degradation. Proc Natl Acad Sci U S A, 101(24), 9085-9090. doi:10.1073/pnas.0402770101
WHO, W.H.O. World health organization – estimated number of deaths, worldwide, both sex, all ages (2020). URL: http://www.who.int/.: (01.12.2020)
Williams, D. A., Xu, H., & Cancelas, J. A. (2006). Children are not little adults: just ask their hematopoietic stem cells. J Clin Invest, 116(10), 2593-2596. doi:10.1172/jci30083
Wilzen, A., Nilsson, S., Sjoberg, R. M., Kogner, P., Martinsson, T., & Abel, F. (2009). The Phox2 pathway is differentially expressed in neuroblastoma tumors, but no mutations were found in the candidate tumor suppressor gene PHOX2A. Int J Oncol, 34(3), 697-705. doi:10.3892/ijo_00000196
Winter, G. E., Buckley, D. L., Paulk, J., Roberts, J. M., Souza, A., Dhe-Paganon, S., & Bradner, J. E. (2015). Phthalimide conjugation as a strategy for in vivo target protein degradation. Science, 348(6241), 1376-1381. doi:10.1126/science.aab1433
Wittmann, T., Boleti, H., Antony, C., Karsenti, E., & Vernos, I. (1998). Localization of the kinesin-like protein Xklp2 to spindle poles requires a leucine zipper, a microtubule-associated protein, and dynein. J Cell Biol, 143(3), 673-685. doi:10.1083/jcb.143.3.673
Wittmann, T., Wilm, M., Karsenti, E., & Vernos, I. (2000). TPX2, A novel xenopus MAP involved in spindle pole organization. J Cell Biol, 149(7), 1405-1418. doi:10.1083/jcb.149.7.1405
Wu, J. C., Chen, T. Y., Yu, C. T., Tsai, S. J., Hsu, J. M., Tang, M. J., . . . Huang, C. Y. (2005). Identification of V23RalA-Ser194 as a critical mediator for Aurora-A-induced cellular motility and transformation by small pool expression screening. J Biol Chem, 280(10), 9013-9022. doi:10.1074/jbc.M411068200

153
Xiao, D., Yue, M., Su, H., Ren, P., Jiang, J., Li, F., . . . Qing, G. (2016). Polo-like Kinase-1 Regulates Myc Stabilization and Activates a Feedforward Circuit Promoting Tumor Cell Survival. Mol Cell, 64(3), 493-506. doi:10.1016/j.molcel.2016.09.016
Xu, J., Yue, C. F., Zhou, W. H., Qian, Y. M., Zhang, Y., Wang, S. W., . . . Liu, Q. (2014). Aurora-A contributes to cisplatin resistance and lymphatic metastasis in non-small cell lung cancer and predicts poor prognosis. J Transl Med, 12, 200. doi:10.1186/1479-5876-12-200
Yamada, T., Yamaguchi, Y., Inukai, N., Okamoto, S., Mura, T., & Handa, H. (2006). P-TEFb-mediated phosphorylation of hSpt5 C-terminal repeats is critical for processive transcription elongation. Mol Cell, 21(2), 227-237. doi:10.1016/j.molcel.2005.11.024
Yamaguchi, Y., Takagi, T., Wada, T., Yano, K., Furuya, A., Sugimoto, S., . . . Handa, H. (1999). NELF, a multisubunit complex containing RD, cooperates with DSIF to repress RNA polymerase II elongation. Cell, 97(1), 41-51. doi:10.1016/s0092-8674(00)80713-8
Yamamoto, K., Hanada, R., Kikuchi, A., Ichikawa, M., Aihara, T., Oguma, E., . . . Hayashi, Y. (1998). Spontaneous regression of localized neuroblastoma detected by mass screening. J Clin Oncol, 16(4), 1265-1269. doi:10.1200/JCO.1998.16.4.1265
Yang, G., Chang, B., Yang, F., Guo, X., Cai, K. Q., Xiao, X. S., . . . Liu, J. (2010). Aurora kinase A promotes ovarian tumorigenesis through dysregulation of the cell cycle and suppression of BRCA2. Clin Cancer Res, 16(12), 3171-3181. doi:10.1158/1078-0432.CCR-09-3171
Yin, X., Giap, C., Lazo, J. S., & Prochownik, E. V. (2003). Low molecular weight inhibitors of Myc-Max interaction and function. Oncogene, 22(40), 6151-6159. doi:10.1038/sj.onc.1206641
Yu, X., Minter-Dykhouse, K., Malureanu, L., Zhao, W. M., Zhang, D., Merkle, C. J., . . . Chen, J. (2005). Chfr is required for tumor suppression and Aurora A regulation. Nat Genet, 37(4), 401-406. doi:10.1038/ng1538
Zeineldin, M., Federico, S., Chen, X., Fan, Y., Xu, B., Stewart, E., . . . Dyer, M. A. (2020). MYCN amplification and ATRX mutations are incompatible in neuroblastoma. Nat Commun, 11(1), 913. doi:10.1038/s41467-020-14682-6
Zeitlin, S. G., Shelby, R. D., & Sullivan, K. F. (2001). CENP-A is phosphorylated by Aurora B kinase and plays an unexpected role in completion of cytokinesis. J Cell Biol, 155(7), 1147-1157. doi:10.1083/jcb.200108125
Zeng, K., Bastos, R. N., Barr, F. A., & Gruneberg, U. (2010). Protein phosphatase 6 regulates mitotic spindle formation by controlling the T-loop phosphorylation state of Aurora A bound to its activator TPX2. J Cell Biol, 191(7), 1315-1332. doi:10.1083/jcb.201008106
Zhang, D., Hirota, T., Marumoto, T., Shimizu, M., Kunitoku, N., Sasayama, T., . . . Saya, H. (2004). Cre-loxP-controlled periodic Aurora-A overexpression induces mitotic abnormalities and hyperplasia in mammary glands of mouse models. Oncogene, 23(54), 8720-8730. doi:10.1038/sj.onc.1208153
Zhang, N., Ichikawa, W., Faiola, F., Lo, S. Y., Liu, X., & Martinez, E. (2014). MYC interacts with the human STAGA coactivator complex via multivalent contacts with the GCN5 and TRRAP subunits. Biochim Biophys Acta, 1839(5), 395-405. doi:10.1016/j.bbagrm.2014.03.017
Zhang, Q., West-Osterfield, K., Spears, E., Li, Z., Panaccione, A., & Hann, S. R. (2017). MB0 and MBI Are Independent and Distinct Transactivation Domains in MYC that Are Essential for Transformation. Genes (Basel), 8(5). doi:10.3390/genes8050134
Zheng, L., & Shen, B. (2011). Okazaki fragment maturation: nucleases take centre stage. J Mol Cell Biol, 3(1), 23-30. doi:10.1093/jmcb/mjq048
Zimmerman, K. A., Yancopoulos, G. D., Collum, R. G., Smith, R. K., Kohl, N. E., Denis, K. A., . . . et al. (1986). Differential expression of myc family genes during murine development. Nature, 319(6056), 780-783. doi:10.1038/319780a0
Zubiaga, A. M. (2020). Foreword Special Issue Cell Cycle and Regulation. Genes (Basel), 11(3). doi:10.3390/genes11030254

I
7 Appendix Supplementary data Table 7.1: Table of overlapping phosphosites. Phosphoproteomics were performed on chromatin-bound proteins in S phase-synchronized IMR-5 cells treated for 4 h with 1 µM MLN8237, 1 µM MK5108, or DMSO as control. Gene name and protein name on which the phosphorylation was found are shown, as well as the localization probability (Loc prob), the likelihood that the phosphorylation is taking place on the site found, and not on an adjacent site. The amino acid (AA) and the position (pos) as well as within which sequence the phosphorylation was found. As an Aurora-A consensus sequence is identified (Kettenbach et al., 2011), the color the AA indicates a sterically unpreferred AA (red) or a sterically preferred AA (green). The counts (cnt) in DMSO (Ctrl), MK5108 (MK) and MLN8237 (MLN) reflects in how many replicates this site was found. Log2 fold change (logFC) of MK or MLN versus DMSO and p-value (p) calculated for MK and MLN are shown.
Gene name Protein name Loc prob AA Pos Sequence
Ctr cnt
MK cnt
MLN cnt
logFC MK
logFC MLN
p MK
p MLN
ADAR Double-stranded RNA-specific adenosine deaminase 0.98 S 599 TAESQTP 3 3 2 -0.16 -0.17 0.12 0.14
AHCTF1 ELYS 0.98 S 1218 PSPSPRG 3 2 3 -0.45 -0.24 0.01 0.06
AHCTF1 ELYS 1.00 S 1541 RNLSFNE 3 3 3 -0.38 -0.41 0.00 0.00
ATAD2 ATPase family AAA domain-containing protein 2 1.00 S 1243 RNNSNTC 3 2 2 -0.42 -0.39 0.01 0.01
ATRX Transcriptional regulator ATRX 0.94 S 729 DQNSDSD 2 3 2 -0.40 -0.46 0.10 0.07
ATRX Transcriptional regulator ATRX 1.00 S 731 NSDSDEM 2 2 2 -0.32 -0.18 0.02 0.09
BCLAF1 Bcl-2-associated transcription factor 1 1.00 S 222 YSNSPRS 2 3 2 -0.18 -0.21 0.11 0.11
BPTF Nucleosome-remodeling factor subunit BPTF 1.00 S 2465 QGQSPVR 3 3 3 -0.13 -0.19 0.10 0.03
C11orf30 BRCA2-interacting transcriptional repressor EMSY 1.00 S 168 TVKSPRP 3 3 3 -0.19 -0.24 0.12 0.07
CASKIN2 Caskin-2 1.00 S 697 RSPSQES 2 3 2 -0.31 -0.22 0.02 0.05
CDK11A Cyclin-dependent kinase 11 A 1.00 S 47 KRDSLEE 3 3 3 -0.19 -0.22 0.04 0.02
CDK11B Cycln-dependent kinase 11 B 1.00 S 47 KRDSLEE 3 3 3 -0.19 -0.22 0.04 0.02
CDK11B Cycln-dependent kinase 11 B 1.00 S 752 RGTSPRP 3 3 3 -0.13 -0.37 0.14 0.00
CENPU Centromere protein U 0.98 S 108 KRSSDTS 3 3 3 -0.12 -0.12 0.10 0.10
CENPU Centromere protein U 0.97 S 111 SDTSGNE 2 3 2 -0.17 -0.15 0.11 0.13
CLSPN Claspin 0.94 S 808 GFRSPSP 2 3 2 -0.19 -0.18 0.09 0.11
CTNNBL1 Beta-catenin-like protein 1 1.00 S 545 DGRSPEF 3 3 3 -0.12 -0.12 0.10 0.11
DACH1 Dachshund hmolog 1 1.00 S 493 DSPSPAP 3 3 3 -0.18 -0.33 0.06 0.00
DBN1 Drebrin 0.83 S 337 PTRSPSD 2 3 2 -0.39 -0.51 0.04 0.01
DDX20 Probable ATP-dependent RNA helicase DDX20 1.00 S 672 GNKSYLE 3 3 3 -0.16 -0.15 0.08 0.09
DEK DEK 1.00 S 307 EDSSDDE 3 3 3 -0.25 -0.12 0.01 0.13
GTF3C1 General transcription factor 3C polypeptide 1 1.00 S 739 EEDSQGK 2 3 3 -0.20 -0.20 0.14 0.15
HNRNPUL2 Heterogeneous nuclear ribonucleoprotein U-like protein 2 1.00 S 228 RSKSPLP 2 3 3 -0.26 -0.21 0.05 0.09
HUWE1 E3 ubiquitin-protein ligase HUWE1 0.99 S 1907 GTASDDE 2 2 2 -0.19 -0.18 0.08 0.09
IWS1 Protein IWS1 homolog 1.00 S 237 ASDSENE 3 3 3 -0.17 -0.34 0.07 0.00
LEO1 RNA polymerase-associated protein LEO1 1.00 S 277 ARGSDSE 3 3 3 -0.11 -0.17 0.12 0.03
LIMCH1 LIM and calponin homology domains-containing protein 1 1.00 S 718 KPKSPEP 2 3 3 -0.20 -0.14 0.05 0.13
MAP1B Microtubule-associated protein 1 B 1.00 S 1396 KVLSPLR 2 3 3 -0.19 -0.21 0.09 0.07
MCM2 DNA replication licensing factor MCM2 0.99 S 27 LTSSPGR 2 2 2 -0.72 -0.72 0.12 0.12
MPHOSPH8 M-phase phosphoprotein 8 1.00 S 136 EANSDSD 3 3 3 -0.18 -0.14 0.04 0.08
MPHOSPH8 M-phase phosphoprotein 8 1.00 S 138 NSDSDQQ 3 3 3 -0.15 -0.13 0.09 0.13
MSH6 DNA mismatch repair protein Msh6 1.00 S 261 IGGSDVE 3 3 3 -0.20 -0.15 0.05 0.11
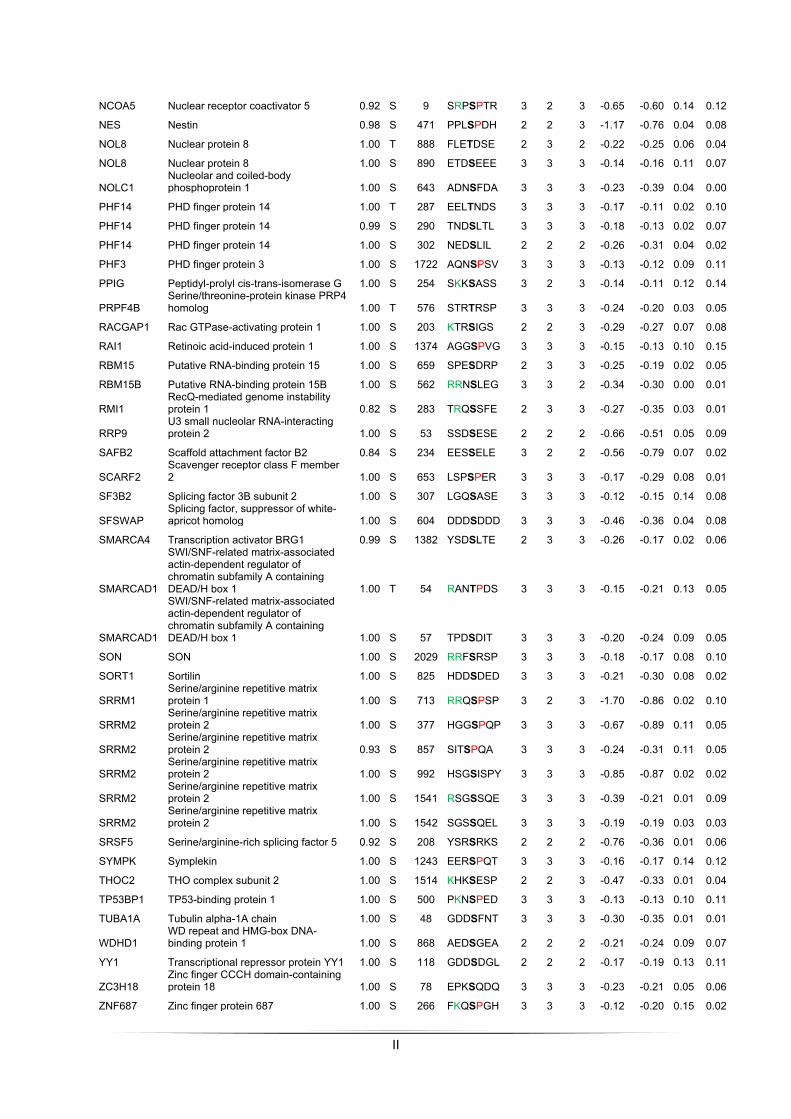
II
NCOA5 Nuclear receptor coactivator 5 0.92 S 9 SRPSPTR 3 2 3 -0.65 -0.60 0.14 0.12
NES Nestin 0.98 S 471 PPLSPDH 2 2 3 -1.17 -0.76 0.04 0.08
NOL8 Nuclear protein 8 1.00 T 888 FLETDSE 2 3 2 -0.22 -0.25 0.06 0.04
NOL8 Nuclear protein 8 1.00 S 890 ETDSEEE 3 3 3 -0.14 -0.16 0.11 0.07
NOLC1 Nucleolar and coiled-body phosphoprotein 1 1.00 S 643 ADNSFDA 3 3 3 -0.23 -0.39 0.04 0.00
PHF14 PHD finger protein 14 1.00 T 287 EELTNDS 3 3 3 -0.17 -0.11 0.02 0.10
PHF14 PHD finger protein 14 0.99 S 290 TNDSLTL 3 3 3 -0.18 -0.13 0.02 0.07
PHF14 PHD finger protein 14 1.00 S 302 NEDSLIL 2 2 2 -0.26 -0.31 0.04 0.02
PHF3 PHD finger protein 3 1.00 S 1722 AQNSPSV 3 3 3 -0.13 -0.12 0.09 0.11
PPIG Peptidyl-prolyl cis-trans-isomerase G 1.00 S 254 SKKSASS 3 2 3 -0.14 -0.11 0.12 0.14
PRPF4B Serine/threonine-protein kinase PRP4 homolog 1.00 T 576 STRTRSP 3 3 3 -0.24 -0.20 0.03 0.05
RACGAP1 Rac GTPase-activating protein 1 1.00 S 203 KTRSIGS 2 2 3 -0.29 -0.27 0.07 0.08
RAI1 Retinoic acid-induced protein 1 1.00 S 1374 AGGSPVG 3 3 3 -0.15 -0.13 0.10 0.15
RBM15 Putative RNA-binding protein 15 1.00 S 659 SPESDRP 2 3 3 -0.25 -0.19 0.02 0.05
RBM15B Putative RNA-binding protein 15B 1.00 S 562 RRNSLEG 3 3 2 -0.34 -0.30 0.00 0.01
RMI1 RecQ-mediated genome instability protein 1 0.82 S 283 TRQSSFE 2 3 3 -0.27 -0.35 0.03 0.01
RRP9 U3 small nucleolar RNA-interacting protein 2 1.00 S 53 SSDSESE 2 2 2 -0.66 -0.51 0.05 0.09
SAFB2 Scaffold attachment factor B2 0.84 S 234 EESSELE 3 2 2 -0.56 -0.79 0.07 0.02
SCARF2 Scavenger receptor class F member 2 1.00 S 653 LSPSPER 3 3 3 -0.17 -0.29 0.08 0.01
SF3B2 Splicing factor 3B subunit 2 1.00 S 307 LGQSASE 3 3 3 -0.12 -0.15 0.14 0.08
SFSWAP Splicing factor, suppressor of white-apricot homolog 1.00 S 604 DDDSDDD 3 3 3 -0.46 -0.36 0.04 0.08
SMARCA4 Transcription activator BRG1 0.99 S 1382 YSDSLTE 2 3 3 -0.26 -0.17 0.02 0.06
SMARCAD1
SWI/SNF-related matrix-associated actin-dependent regulator of chromatin subfamily A containing DEAD/H box 1 1.00 T 54 RANTPDS 3 3 3 -0.15 -0.21 0.13 0.05
SMARCAD1
SWI/SNF-related matrix-associated actin-dependent regulator of chromatin subfamily A containing DEAD/H box 1 1.00 S 57 TPDSDIT 3 3 3 -0.20 -0.24 0.09 0.05
SON SON 1.00 S 2029 RRFSRSP 3 3 3 -0.18 -0.17 0.08 0.10
SORT1 Sortilin 1.00 S 825 HDDSDED 3 3 3 -0.21 -0.30 0.08 0.02
SRRM1 Serine/arginine repetitive matrix protein 1 1.00 S 713 RRQSPSP 3 2 3 -1.70 -0.86 0.02 0.10
SRRM2 Serine/arginine repetitive matrix protein 2 1.00 S 377 HGGSPQP 3 3 3 -0.67 -0.89 0.11 0.05
SRRM2 Serine/arginine repetitive matrix protein 2 0.93 S 857 SITSPQA 3 3 3 -0.24 -0.31 0.11 0.05
SRRM2 Serine/arginine repetitive matrix protein 2 1.00 S 992 HSGSISPY 3 3 3 -0.85 -0.87 0.02 0.02
SRRM2 Serine/arginine repetitive matrix protein 2 1.00 S 1541 RSGSSQE 3 3 3 -0.39 -0.21 0.01 0.09
SRRM2 Serine/arginine repetitive matrix protein 2 1.00 S 1542 SGSSQEL 3 3 3 -0.19 -0.19 0.03 0.03
SRSF5 Serine/arginine-rich splicing factor 5 0.92 S 208 YSRSRKS 2 2 2 -0.76 -0.36 0.01 0.06
SYMPK Symplekin 1.00 S 1243 EERSPQT 3 3 3 -0.16 -0.17 0.14 0.12
THOC2 THO complex subunit 2 1.00 S 1514 KHKSESP 2 2 3 -0.47 -0.33 0.01 0.04
TP53BP1 TP53-binding protein 1 1.00 S 500 PKNSPED 3 3 3 -0.13 -0.13 0.10 0.11
TUBA1A Tubulin alpha-1A chain 1.00 S 48 GDDSFNT 3 3 3 -0.30 -0.35 0.01 0.01
WDHD1 WD repeat and HMG-box DNA-binding protein 1 1.00 S 868 AEDSGEA 2 2 2 -0.21 -0.24 0.09 0.07
YY1 Transcriptional repressor protein YY1 1.00 S 118 GDDSDGL 2 2 2 -0.17 -0.19 0.13 0.11
ZC3H18 Zinc finger CCCH domain-containing protein 18 1.00 S 78 EPKSQDQ 3 3 3 -0.23 -0.21 0.05 0.06
ZNF687 Zinc finger protein 687 1.00 S 266 FKQSPGH 3 3 3 -0.12 -0.20 0.15 0.02
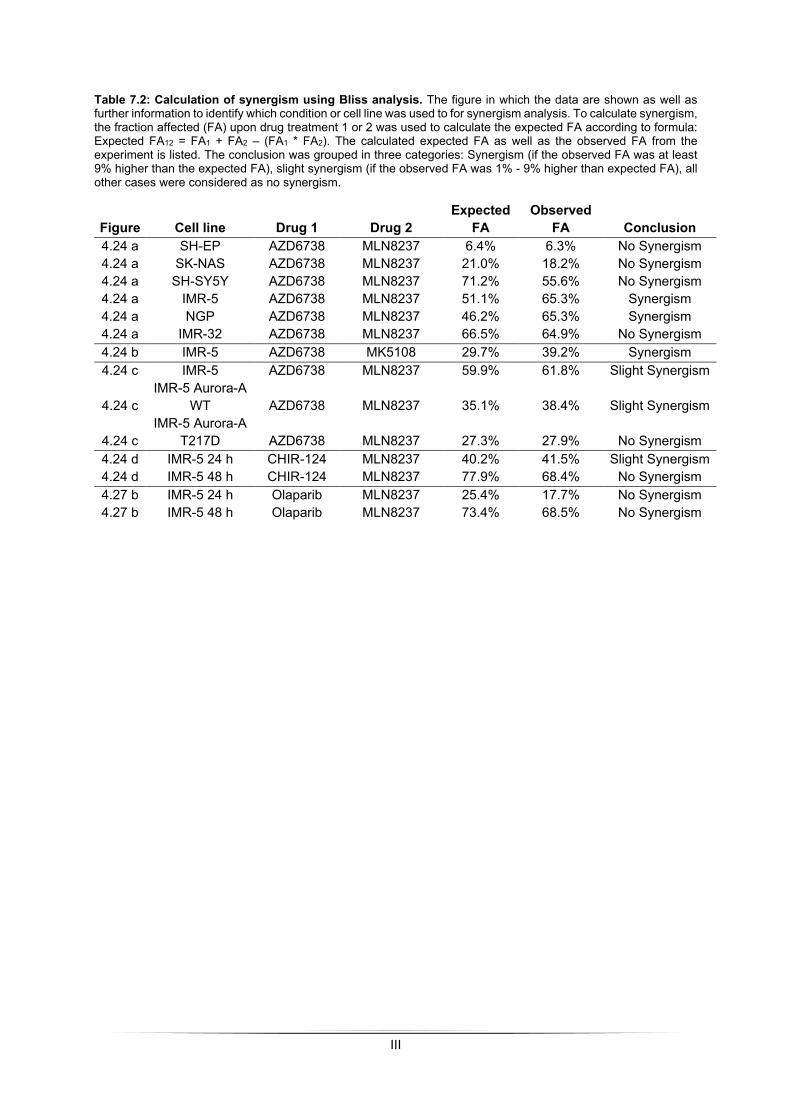
III
Table 7.2: Calculation of synergism using Bliss analysis. The figure in which the data are shown as well as further information to identify which condition or cell line was used to for synergism analysis. To calculate synergism, the fraction affected (FA) upon drug treatment 1 or 2 was used to calculate the expected FA according to formula: Expected FA12 = FA1 + FA2 – (FA1 * FA2). The calculated expected FA as well as the observed FA from the experiment is listed. The conclusion was grouped in three categories: Synergism (if the observed FA was at least 9% higher than the expected FA), slight synergism (if the observed FA was 1% - 9% higher than expected FA), all other cases were considered as no synergism.
Figure Cell line Drug 1 Drug 2 Expected
FA Observed
FA Conclusion 4.24 a SH-EP AZD6738 MLN8237 6.4% 6.3% No Synergism 4.24 a SK-NAS AZD6738 MLN8237 21.0% 18.2% No Synergism 4.24 a SH-SY5Y AZD6738 MLN8237 71.2% 55.6% No Synergism 4.24 a IMR-5 AZD6738 MLN8237 51.1% 65.3% Synergism 4.24 a NGP AZD6738 MLN8237 46.2% 65.3% Synergism 4.24 a IMR-32 AZD6738 MLN8237 66.5% 64.9% No Synergism 4.24 b IMR-5 AZD6738 MK5108 29.7% 39.2% Synergism 4.24 c IMR-5 AZD6738 MLN8237 59.9% 61.8% Slight Synergism
4.24 c IMR-5 Aurora-A
WT AZD6738 MLN8237 35.1% 38.4% Slight Synergism
4.24 c IMR-5 Aurora-A
T217D AZD6738 MLN8237 27.3% 27.9% No Synergism 4.24 d IMR-5 24 h CHIR-124 MLN8237 40.2% 41.5% Slight Synergism 4.24 d IMR-5 48 h CHIR-124 MLN8237 77.9% 68.4% No Synergism 4.27 b IMR-5 24 h Olaparib MLN8237 25.4% 17.7% No Synergism 4.27 b IMR-5 48 h Olaparib MLN8237 73.4% 68.5% No Synergism
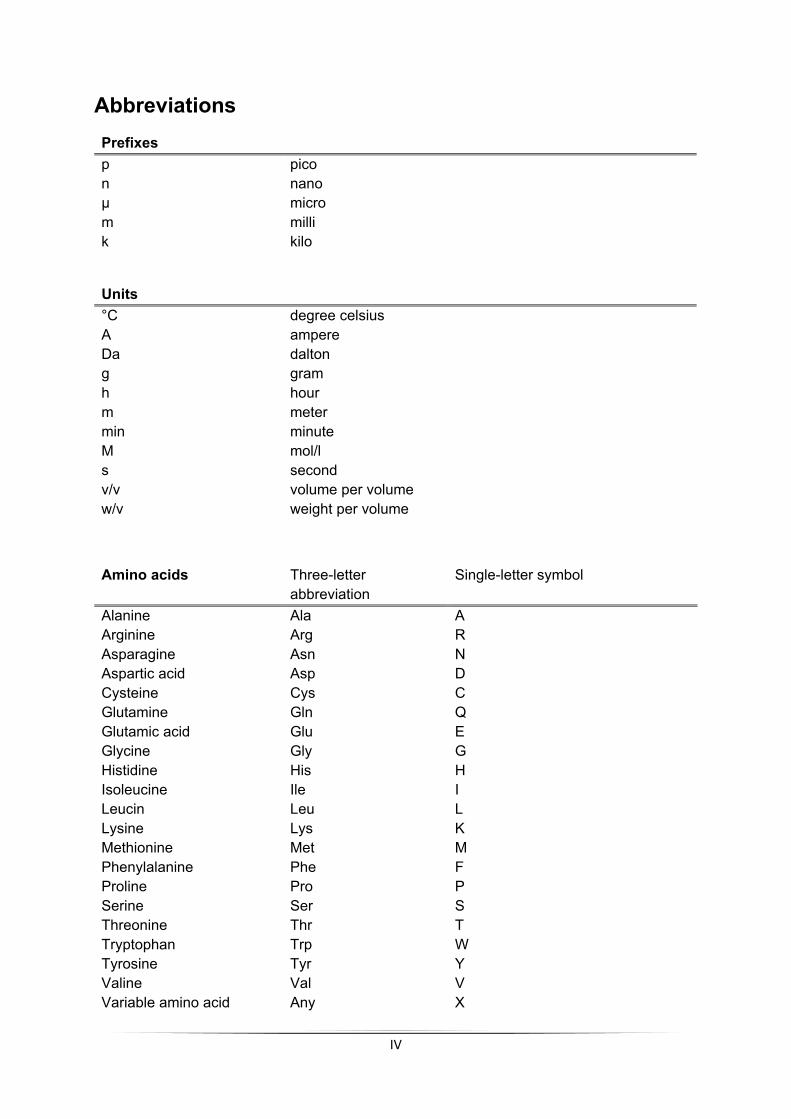
IV
Abbreviations Prefixes p pico n nano µ micro m milli k kilo
Units °C degree celsius A ampere Da dalton g gram h hour m meter min minute M mol/l s second v/v volume per volume w/v weight per volume
Amino acids Three-letter abbreviation
Single-letter symbol
Alanine Ala A Arginine Arg R Asparagine Asn N Aspartic acid Asp D Cysteine Cys C Glutamine Gln Q Glutamic acid Glu E Glycine Gly G Histidine His H Isoleucine Ile I Leucin Leu L Lysine Lys K Methionine Met M Phenylalanine Phe F Proline Pro P Serine Ser S Threonine Thr T Tryptophan Trp W Tyrosine Tyr Y Valine Val V Variable amino acid Any X

V
Other abbreviations 4sU 4-thio-uridine 4sU-seq 4sU-sequencing A box Activation box AA Amino acids ADRN Adrenergic ATM Ataxia telangiectasia mutated ATR Ataxia telangiectasia and Rad3-related APC/C Anaphase promoting complex/cyclosome APS Ammonium persulfate AZ1 Antizyme 1 B2M ß-2-microglobulin BCA Bicinchoninic assay BR-HLH-LZ Basic region helix-loop-helix-leucine zipper BSA Bovine serum albumin CD Conformation-disrupting CDC Cell division cycle cDNA Complementary DNA CDKs Cyclin-dependent kinases CDS Coding sequence ChIP Chromatin immunoprecipitation ChIP-seq ChIP-sequencing CNS Central nervous system CRCs Core regulatory circuitries CTD C-terminal domain D box Destruction box DLTs Dose-limiting toxicities dNTP Desoxy nucleoside triphosphate dsDNA Double-stranded DNA Dox Doxycycline E-boxes Enhancer-boxes EdU 5-ethynyl-2’-deoxyuridine EV Empty vector FC Fold change FCS Fetal calf serum FDR False discovery rate FP Flavopiridol G4 G-quadruplex GSEA Gene set enrichment analysis HRP Horseradish peroxidase IHC Immunohistochemistry INPC International Neuroblastoma Pathology Classification INSS International Neuroblastoma Staging System IP Immunoprecipitation LB Lysogeny broth LR Low-risk neuroblastoma M Mitosis

VI
MAX MYC associated factor X MB MYC-box MES Mesenchymal MNA MYCN-amplification mRNA Messenger RNA MS Mass-spectrometry MTOCs Microtubule organizing centers MTS Mitochondrial targeting sequence MXD MAX dimerization n Number of independent biological replicates NHEJ Non-homologous end joining NTC Non-targeting control ORC Origin of replication PARP1 Poly (ADP-ribose) polymerase 1 PAS Polyadenylation signal PBS Phosphate buffered saline PCNA Proliferating cell nuclear antigen PCM Pericentriolar material PCR Polymerase chain reaction PEI Polyethylenimine PI Propidium iodide PLA Proximity ligation assay PlaB Pladienolide B PP Protein phosphatase pre-IC Pre-initiation complex pre-RC Pre-replication complex qPCR Quantitative PCR RNAPII RNA Polymerase II RNAPII pSer2 RNAPII phosphorylated at Ser2 RNA-seq RNA-sequencing RQI RNA quality indicator RT Room temperature SAC Spindle assembly checkpoint S.D. Standard deviation S.E.M. Standard error of the mean shRNA Short hairpin RNA TAE Tris-Acetate-EDTA TBS Tris buffered saline TBS-T TBS with Tween 20 TES Transcription end site TH Tyrosine hydroxylase TSS Transcription start site UPS Ubiquitin proteasome system WT Wild type

VII
Table of figures Figure 1.1: The most abundant cancer types in children under the age of 14. ........................ 3 Figure 1.2: Survival probability of neuroblastoma patients depending on TERT expression. .. 8 Figure 1.3: Heatmap showing the clustering of mRNA expression profiles of four
mesenchymal (MES) and corresponding adrenergic (ADRN) cell lines. ........................... 9 Figure 1.4: Regulation of cell cycle checkpoints in eukaryotic cells. ...................................... 11 Figure 1.5: Different stages of transcription are associated with differential RNAPII
phosphorylation patterns. ................................................................................................ 13 Figure 1.6: Schematic overview of origin licensing, initiation, and elongation of replication in
eukaryotic cells. ............................................................................................................... 15 Figure 1.7: Domains of MYC protein and their canonical function and interaction partner. ... 19 Figure 1.8: Scheme of different models how MYC regulate transcription. ............................. 22 Figure 1.9: Approaches to target MYC proteins. .................................................................... 24 Figure 1.10: Schematic view of Aurora family members. ....................................................... 27 Figure 1.11: Mechanisms illustrating the regulation of Aurora-A expression and activity. ..... 31 Figure 1.12 Model of the stabilization of MYCN by Aurora-A in neuroblastoma cells. ........... 32
Figure 4.1: Aurora-A is bound to chromatin in a cell cycle dependent manner. ..................... 69 Figure 4.2: Aurora-A association with chromatin is MYCN-dependent. ................................. 70 Figure 4.3: Aurora-A is unphosphorylated in S phase. ........................................................... 71 Figure 4.4: Proteomics upon Aurora-A inhibition using two different inhibitors. ..................... 73 Figure 4.5: Phosphoproteomics upon Aurora-A inhibition. ..................................................... 75 Figure 4.6: Aurora-A substrates in S phase show a strong connection to splicing, chromatin
organization, and transcription. ....................................................................................... 76 Figure 4.7: Proteomic and phosphoproteomics upon removal of MYCN from chromatin. ..... 78 Figure 4.8: Phosphosites downregulated upon MYCN and Aurora-A inhibition. .................... 79 Figure 4.9: Aurora-A and MYCN are in proximity to putative substrates in IMR-5 cells. ........ 80 Figure 4.10: Aurora-A phosphorylates H3S10 in S phase. .................................................... 82 Figure 4.11: Aurora-A phosphorylates H3S10 on chromatin in S phase. ............................... 83 Figure 4.12: pH3S10 staining upon overexpression of Aurora-A WT and T217D mutant. ..... 84 Figure 4.13: Aurora-B does not contribute to H3S10 phosphorylation in S phase, neither is
H3T3 phosphorylation affected by Aurora kinases in S phase. ...................................... 85 Figure 4.14: MYCN levels influence pH3S10. ........................................................................ 86 Figure 4.15: Aurora-A favors incorporation of H3.3. ............................................................... 89 Figure 4.16: Aurora-A inhibition impairs RNAPII functionality. ............................................... 90 Figure 4.17: Aurora-A prevents elongation defects of RNAPII. .............................................. 91 Figure 4.18: Short-term inhibition of Aurora-A does not impact gene expression in S phase.
........................................................................................................................................ 92 Figure 4.19: Aurora-A is needed for splicing in S phase. ....................................................... 93 Figure 4.20: Aurora-A inhibition impairs global splicing. ........................................................ 94 Figure 4.21: Aurora-A prevents transcription-replication conflicts. ......................................... 95 Figure 4.22: RNase H1 induction stabilizes Nucleosome +1. ................................................ 96 Figure 4.23: RNase H1 overexpression leads to stalling of RNAPII, which does not result in
transcription-replication conflicts. .................................................................................... 97 Figure 4.24: Aurora-A inhibition induces ATR activation. ....................................................... 99 Figure 4.25: SF3B2, a potential Aurora-A substrate in S phase, prevents ATR activation. . 100

VIII
Figure 4.26: Crystal violet staining reflects growth deficiency upon combinatorial treatment in two MYCN-amplified neuroblastoma cells. ................................................................... 101
Figure 4.27: Combinatorial treatment enhances apoptosis in a MYCN-dependent manner. ...................................................................................................................................... 103
Figure 4.28: Combinatorial treatment enhances cell cycle speed and induces cell cycle arrest. ............................................................................................................................ 104
Figure 4.29: RNase H1 overexpression does not affect apoptosis or cell cycle. ................. 106 Figure 4.30: Effect of PARP1 inhibition on transcription-replication conflicts and apoptosis.
...................................................................................................................................... 107
Figure 5.1:Schematic network of protein interaction with MYCN and Aurora-A. .................. 112 Figure 5.2: Model of Aurora-A counteracting G9a activity to prevent transcriptional
repression. .................................................................................................................... 115 Figure 5.3: Contribution of MYCN-activated Aurora-A substrates in H3.3 incorporation. .... 117 Figure 5.4: Contribution of MYCN-activated Aurora-A substrates in splicing. ...................... 120 Figure 5.5: Contribution of MYCN-activated Aurora-A substrates in replication fork
progression and transcription-replication conflicts. ....................................................... 123 Figure 5.6: Model of pathways regulated by Aurora-A in S phase. ...................................... 123 Figure 5.7: Model how resolved R-loops interfere with pathways regulated by Aurora-A in S
phase. ........................................................................................................................... 125

IX
Table of tables Table 5.1: Summary of processes regulated by Aurora-A and whether catalytic activity or
complex disruption is required. ..................................................................................... 124 Table 7.1: Table of overlapping phosphosites. .......................................................................... I Table 7.2: Calculation of synergism using Bliss analysis. ....................................................... III

X
Acknowledgement
I would like to thank Prof. Dr. Martin Eilers for the opportunity to perform my master and my
PhD work in his laboratory. I am grateful to work on this fascinating project. Additionally, I am
thankful for the helpful, structured supervision throughout the studies, the fruitful discussions,
and suggestions which enabled a constant scientific progress of the project and myself.
Prof. Dr. Manfred Gessler and Prof. Dr. Stefan Knapp I would like to acknowledge for being
the members of my thesis committee and for their valuable comments, which helped in
progression of the project.
I would especially like to express my profound gratitude to Dr. Gabriele Büchel who worked
together with me on this fascinating project. I really appreciate your patient guidance, fruitful
discussions, and thank you for sharing your knowledge with me.
Additionally, I would like to thank Dr. Giacomo Cossa who provided a lot of advice and
encouragement throughout the whole time and was always willing to discuss any single aspect
of the project.
My office and lab mates I would like to acknowledge for the extremely nice time we had
together, trying to make the best out of every single day. And without you, Theresa Endres and
Bastian Krenz, it would not have been so motivating.
Thanks to Dr. Ursula Eilers and Dr. Christina Schülein-Völk for all the help with the Operetta
and all nice conversations while operating the microscope, as well as to Dr. Carsten Ade, Dr.
Peter Gallant, and Apoorva Baluapuri for all the help with sequencing and bioinformatics.
Furthermore, I thank all the current and former members from the Eilers lab and the
Department for Biochemistry and Molecular Biology for the encouraging working atmosphere,
sharing their knowledge, and supporting with their abilities. And here I especially appreciate
the fruitful discussions and the strong cooperation with people of the Mensa-group.
Thanks to Gabriele, Giacomo, Christina, and Steffi who proof-read this work and helped with
substantial input in improving this thesis.
Thanks to Gabriele, Giacomo, Theresa, Basti, Michi, Carina, Apoorva, Leonie, Daniel, Oli,
Jessy, and Sarah for the great time we had, not only in the lab. Thank you for all the evenings
and days we spend together, making my time in Würzburg incredibly nice and unforgettable.
Finally, I want to thank my parents, my sister, and my friends for their encouragement and the
support throughout my studies.

XI
Publications
Roeschert I.*, Poon E.*, Henssen A.G., Dorado-Garcia H., Gatti M., Giansanti C., Jamin Y.,
Ade C.P., Gallant P., Schülein-Völk C., Beli P., Richards M., Rosenfeldt M., Altmeyer M.,
Anderson J., Eggert A., Dobbelstein M., Bayliss R., Chesler L., Büchel G. & Eilers M. (2021):
Combined inhibition of Aurora-A and ATR kinases results in regression of MYCN-amplified
neuroblastoma. Nature Cancer, https://doi.org/10.1038/s43018-020-00171-8
Cossa G., Roeschert I., Prinz F., Baluapuri A., Vidal R.S., Schülein-Völk C., Chang Y.-C., Ade
C.P., Mastrobuoni G., Girard C., Wortmann L., Walz S., Lührmann R., Kempa S., Kuster B.,
Wolf E., Mumberg D. & Eilers M. (2020): Localized Inhibition of Protein Phosphatase 1 by
NUAK1 Promotes Spliceosome Activity and Reveals a MYC-Sensitive Feedback Control of
Transcription. Molecular Cell, 77 (6), 1322 – 1339.
Büchel G.*, Carstensen A.*, Mak K.-Y.*, Roeschert I., Leen E., Sumara O., Hofstetter J.,
Herold S., Kalb J., Baluapuri A., Poon E., Kwok C., Chesler L., Maric H. M., Rickman D. S.,
Wolf E., Bayliss R., Walz S. & Eilers M. (2017): Association with Aurora-A controls N-MYC-
Dependent Promoter Escape and Pause Release of RNA Polymerase II During the Cell cycle.
Cell reports, 21, 3483 – 3497.
* authors contributed equally
XII
Affidavit I hereby confirm that my thesis entitled: “Aurora-A prevents transcription-replication conflicts
in MYCN-amplified neuroblastoma” is the result of my own work. I did not receive any help or
support from commercial consultants. All sources and/or materials are listed and specified in
the thesis.
Furthermore, I confirm that this thesis has not yet been submitted as part of another
examination process neither in identical nor in similar form.
Place, Date Isabelle Röschert
Eidesstattliche Erklärung
Hiermit erkläre ich an Eides statt, die Dissertation: „Aurora-A verhindert Transkriptions-
Replikationskonflikte in MYCN-amplifizierten Neuroblastomen” eigenständig, d. h. selbst-
ständig und ohne Hilfe eines kommerziellen Promotionsberaters, angefertigt und keine
anderen als die von mir angegebenen Quellen und Hilfsmittel verwendet zu haben.
Ich erkläre außerdem, dass die Dissertation weder in gleicher noch in ähnlicher Form bereits
in einem anderen Prüfungsverfahren vorgelegt wurde.
Ort, Datum Isabelle Röschert

XIII
Curriculum vitae