Mössbauer and dielectric spectroscopy of the dynamic glass transition of a block copolymer
11
This content has been downloaded from IOPscience. Please scroll down to see the full text. Download details: IP Address: 141.35.20.30 This content was downloaded on 08/02/2014 at 13:58 Please note that terms and conditions apply. Mössbauer and dielectric spectroscopy of the dynamic glass transition of a block copolymer View the table of contents for this issue, or go to the journal homepage for more 1998 J. Phys.: Condens. Matter 10 961 (http://iopscience.iop.org/0953-8984/10/5/006) Home Search Collections Journals About Contact us My IOPscience
Transcript of Mössbauer and dielectric spectroscopy of the dynamic glass transition of a block copolymer
This content has been downloaded from IOPscience. Please scroll down to see the full text.
Download details:
IP Address: 141.35.20.30
This content was downloaded on 08/02/2014 at 13:58
Please note that terms and conditions apply.
Mössbauer and dielectric spectroscopy of the dynamic glass transition of a block copolymer
View the table of contents for this issue, or go to the journal homepage for more
1998 J. Phys.: Condens. Matter 10 961
(http://iopscience.iop.org/0953-8984/10/5/006)
Home Search Collections Journals About Contact us My IOPscience
J. Phys.: Condens. Matter10 (1998) 961–970. Printed in the UK PII: S0953-8984(98)87914-9
Mossbauer and dielectric spectroscopy of the dynamicglass transition of a block copolymer
A Gahl†, M Hillberg†, F J Litterst†‖, T Pohlmann‡, C Hubsch‡,O Nuyken‡, F Garwe§, M Beiner§ and E Donth§† Institut fur Metallphysik und Nukleare Festkorperphysik, Technische Universitat Braun-schweig, Mendelssohnstrasse 3, 38106 Braunschweig, Germany‡ Lehrstuhl fur Makromolekulare Stoffe, Technische Universitat Munchen, 85747 Garching,Germany§ Universitat Halle, Fachbereich Physik, 06099 Halle (Saale), Germany
Received 19 September 1997
Abstract. The enlargement of the time window achieved by combining57Fe Mossbauerinvestigations (10−7 to 10−9 s) with conventional dielectric spectroscopy (100 to 10−7 s) onpoly(vinylferrocene-b-propylene sulphide) allows one to characterize three different relaxationprocesses. The main process of the glass transition is measured by dielectric spectroscopyand can be well described by the common Vogel–Fulcher–Tammann law, which is typical forcooperative processes. A secondary process is shown by dielectric spectroscopy to be Arrheniusactivated, indicating a local process which leads to a broadening of the Mossbauer resonanceline. The corresponding times can be determined via line-shape analysis. A third process, theso-called cage process, is responsible for an anomalous decrease of the Debye–Waller factor.Its characteristic times are assumed to be in the picosecond region.
1. Introduction
For polymers, the transition from the liquid to the amorphous state still presents manyunsolved problems for theorists and experimentalists [1, 2]. The glass transition is adynamical process, being connected to relaxation processes taking place on differenttimescales. Their characteristic relaxation times may range from days or years to timesin the picosecond region. For this reason, experimental methods with a large time windoware desirable.
Dielectric spectroscopy [3] deals with the influence of an alternating electric field onmatter which induces a polarization of the permanent dipoles of the sample. The complexdielectric functionε(ω) = ε′(ω)− iε′′(ω) is measured as a function of the frequency of thealternating field. A relaxation process, characterized by the relaxation timeτ in the timedomain, corresponds to a reduction ofε′(ω) and to a peak ofε′′(ω). The inverse of thecharacteristic time 1/τ is proportional to the maximum frequency of the loss peak.
Scattering methods can be divided into coherent and incoherent methods, probing thepair correlation and the self-correlation function, respectively [4]. Quasielastic incoherentneutron scattering experiments [5] as well as Mossbauer spectroscopy [6–9] are ableto monitor the Fourier transform of the density autocorrelation function which containsinformation about the single-particle dynamics.57Fe Mossbauer spectroscopy directly
‖ E-mail: [email protected].
0953-8984/98/050961+10$19.50c© 1998 IOP Publishing Ltd 961
962 A Gahl et al
monitors the movement of a single Fe nucleus and covers a time range of approximately10−9 to 10−7 s. We have used ferrocene as a side group of the backbone of the polymerchain. Feyerhermet al [10] have shown that the motion of the ferrocene unit reflects themovement of the whole chain itself. Mossbauer investigations of polymers near their glasstransition have been published by Hillberget al [11].
In this article we report on the combination of Mossbauer and dielectric spectroscopy,which enlarges the time window from 100 to 10−9 s. Furthermore, it is possible to provethe existence of a dynamical process that occurs in less than 10−9 s. Using both methodsallows us to determine different dynamic processes in connection with the glass transition.
2. Experimental procedure
The dielectric spectroscopy was performed with a commercial Novocontrol DK-Spectro-meter [12] covering a frequency range from 10−2 Hz to 2× 10⁶ Hz. The spectra wererecorded between 173 and 293 K.
The 57Fe Mossbauer absorption spectra were recorded between 4.2 K and 310 K usinga conventional spectrometer with a sinusoidal velocity sweep. The source was 870 GBq57Co in Rh kept at room temperature (diameter 8 mm, thickness 6µm, source recoil-freefraction fS = 0.69 and linewidth0 = 0.113 mm s−1). A continuous-flow liquid heliumcryostat was employed. The temperature control was better than±0.5 K. Typical absorberthicknesses were about 10 mg Fe cm−2, of natural abundance.
The samples were of poly(vinylferrocene-b-propylene sulphide) (PROPS 10 andPROPS 2; see figure 1). The block copolymers are not cross-linked and are synthesizedby anionic polymerization initialized by butyl lithium. The samples are characterized bygel permeation chromatography, GPC,1H NMR, 13C NMR, and by differential scanningcalorimetry, DSC (20 K min−1). The number-averaged molecular weights areMn = 10 000g mol−1 (PROPS 10) andMn = 2000 g mol−1 (PROPS 2). The glass transition temperaturesareTg = 246 K andTg = 238 K, respectively, which are comparable withTg = 226 K forthe poly(propylene sulphide) homopolymer.
For both samples the ratio of the monomers, vinylferrocene:propylene sulphide, is 1:13.Details of the synthesis of the sample [13, 14] and results of further Mossbauer investigationsconcerning the influence of the length of the polymer chain and the swelling of the polymerwith solvent will be published elsewhere.
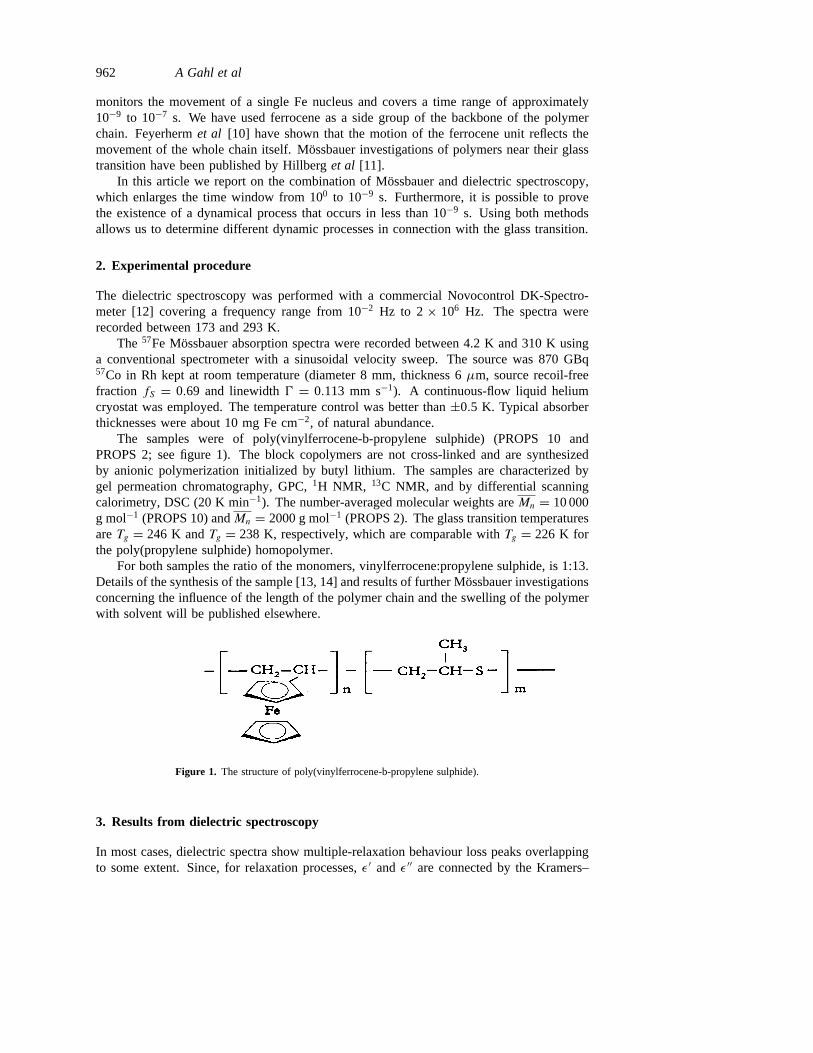
Figure 1. The structure of poly(vinylferrocene-b-propylene sulphide).
3. Results from dielectric spectroscopy
In most cases, dielectric spectra show multiple-relaxation behaviour loss peaks overlappingto some extent. Since, for relaxation processes,ε′ and ε′′ are connected by the Kramers–
The dynamic glass transition of a block copolymer 963
0.1
0 1 2 3 4 5 6lg(ν/Hz)
ε”
PROPS 10
0.5α
β
T = 248 K♦♦♦♦♦♦♦♦♦♦♦♦♦♦
♦♦♦♦♦♦♦♦♦♦♦♦♦♦♦♦♦♦♦♦♦♦
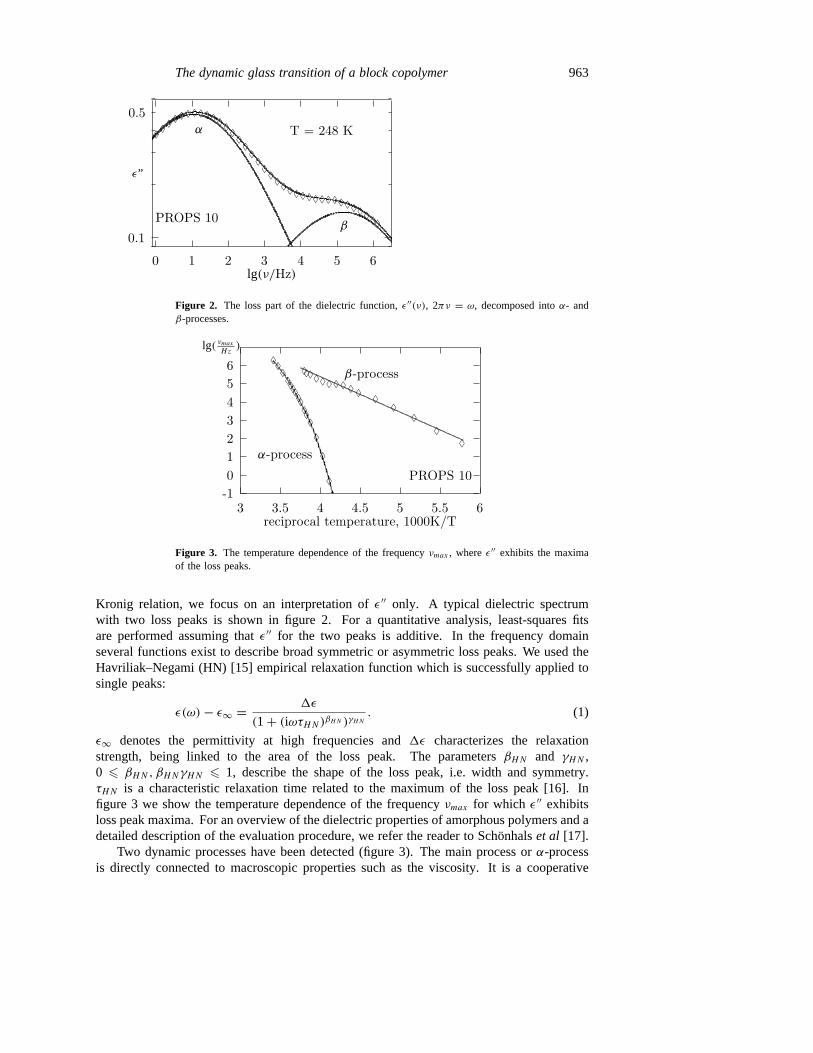
Figure 2. The loss part of the dielectric function,ε′′(ν), 2πν = ω, decomposed intoα- andβ-processes.
-10123456
3 3.5 4 4.5 5 5.5 6reciprocal temperature, 1000K/T
α-process
β-process
PROPS 10
lg( νmaxHz)
♦♦
♦♦
♦♦♦♦♦♦♦♦
♦♦♦
♦
♦
♦♦♦♦
♦♦♦♦♦♦♦♦♦
Figure 3. The temperature dependence of the frequencyνmax , whereε′′ exhibits the maximaof the loss peaks.
Kronig relation, we focus on an interpretation ofε′′ only. A typical dielectric spectrumwith two loss peaks is shown in figure 2. For a quantitative analysis, least-squares fitsare performed assuming thatε′′ for the two peaks is additive. In the frequency domainseveral functions exist to describe broad symmetric or asymmetric loss peaks. We used theHavriliak–Negami (HN) [15] empirical relaxation function which is successfully applied tosingle peaks:
ε(ω)− ε∞ = 1ε
(1+ (iωτHN)βHN )γHN . (1)
ε∞ denotes the permittivity at high frequencies and1ε characterizes the relaxationstrength, being linked to the area of the loss peak. The parametersβHN and γHN ,0 6 βHN, βHNγHN 6 1, describe the shape of the loss peak, i.e. width and symmetry.τHN is a characteristic relaxation time related to the maximum of the loss peak [16]. Infigure 3 we show the temperature dependence of the frequencyνmax for which ε′′ exhibitsloss peak maxima. For an overview of the dielectric properties of amorphous polymers and adetailed description of the evaluation procedure, we refer the reader to Schonhalset al [17].
Two dynamic processes have been detected (figure 3). The main process orα-processis directly connected to macroscopic properties such as the viscosity. It is a cooperative
964 A Gahl et al
-7.0 -6.0 -5.0 -4.0 -3.0 -2.0 -1.0 0.0 1.0 2.0 3.0 4.0 5.0 6.0 7.0
0.995
1.0
Velocity [mm/s]
312 K
0.99
0.995
1.0
Abs
orpt
ion
[1]
303 K PROPS10
0.9
1.0
178 K
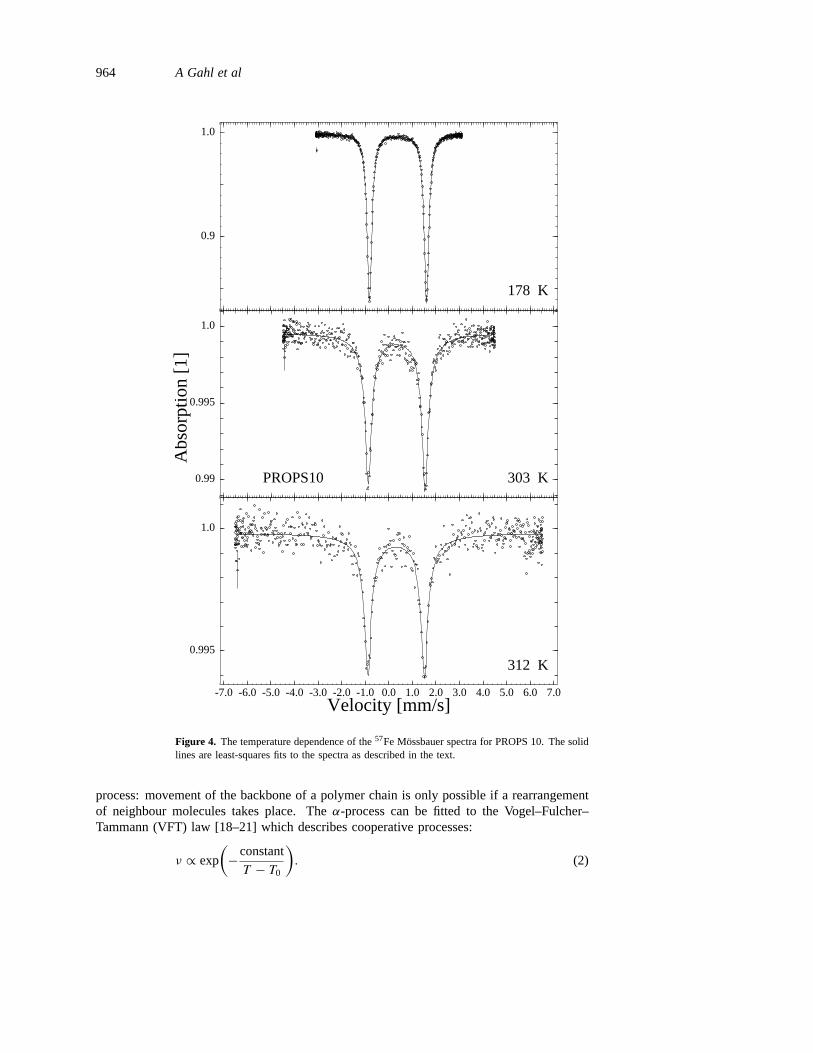
Figure 4. The temperature dependence of the57Fe Mossbauer spectra for PROPS 10. The solidlines are least-squares fits to the spectra as described in the text.
process: movement of the backbone of a polymer chain is only possible if a rearrangementof neighbour molecules takes place. Theα-process can be fitted to the Vogel–Fulcher–Tammann (VFT) law [18–21] which describes cooperative processes:
ν ∝ exp
(−constant
T − T0
). (2)
The dynamic glass transition of a block copolymer 965
A Vogel temperature,T0 = 201± 2 K, is obtained. It is often found for polymers thatT0 is 30 K to 70 K lower than the glass transition temperatureTg [18]. The β-process isArrhenius activated:
ν = ν0 exp
(− E
kBT
)(3)
with a temperature-independent activation energyE = 37± 2 kJ mol−1, typical for a localprocess. It is usually attributed to the rotation of side groups or to flip movements of partsof the polymer chain. The experimental data show that theβ-process is still active in theglassy state when the main process is frozen.
4. Results from Mossbauer spectroscopy
Mossbauer spectroscopy measures the absorption cross section as a function of energy,which is linked to the density autocorrelation functionψ(t) as a function of time by meansof Fourier transformation. The cross section is given by [4]
σ(E) = σ0(00/2)
2h
∫dt e−iωt−(00/2h)|t |ψ(t). (4)
σ0 is the cross section for nuclear resonance absorption,00 the natural half-width of theresonance line and ¯hω the energy transfer. The density correlation functionψ(t) describesthe strength of correlation between random density fluctuations after the time intervalt . It characterizes the motional behaviour of the particles under study. Choosing theDebye relaxation function forψ(t) = exp(−t/τ ), equation (4) can be evaluated analyt-ically, resulting in a Lorentzian line shape, broadened by10 = 2h/τ . Thus, the lifetimeτn = 1.41× 10⁻⁷ s = 2h/00 of the excited nucleus determines a time window for57FeMossbauer spectroscopy from about 10−7 s to 10−9 s. The intensity of the resonance lineis given by the Debye–Waller factorf containing information about motion that occurs inless than 10−9 s.
In figure 4 we show representative spectra for the sample PROPS 10. Due to aquadrupole splitting which is caused by the Fe(II) species of the ferrocene unit, tworesonance lines are observed. The splitting of 2.4 mm s−1 is typical for ferrocenecompounds.
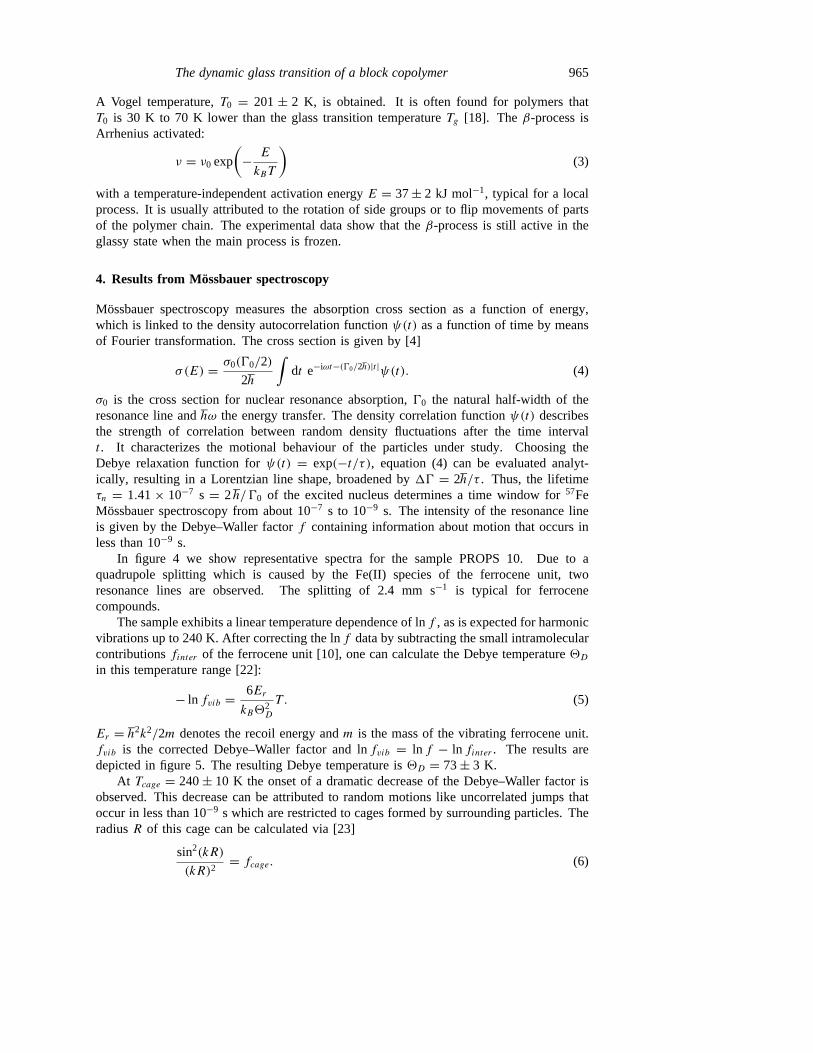
The sample exhibits a linear temperature dependence of lnf , as is expected for harmonicvibrations up to 240 K. After correcting the lnf data by subtracting the small intramolecularcontributionsfinter of the ferrocene unit [10], one can calculate the Debye temperature2D
in this temperature range [22]:
− ln fvib = 6ErkB2
2D
T . (5)
Er = h2k2/2m denotes the recoil energy andm is the mass of the vibrating ferrocene unit.fvib is the corrected Debye–Waller factor and lnfvib = ln f − ln finter . The results aredepicted in figure 5. The resulting Debye temperature is2D = 73± 3 K.
At Tcage = 240± 10 K the onset of a dramatic decrease of the Debye–Waller factor isobserved. This decrease can be attributed to random motions like uncorrelated jumps thatoccur in less than 10−9 s which are restricted to cages formed by surrounding particles. TheradiusR of this cage can be calculated via [23]
sin2(kR)
(kR)2= fcage. (6)
966 A Gahl et al
1
2
3
0 50 100 150 200 250 300 350temperature [K]
Tcage
PROPS 10
− ln(f )
??
����
��
�������������
��
��
Figure 5. The temperature dependence of− ln f ; intramolecular contributions are subtracted.Below Tcage = 240 K the data can be well described by− ln f ∝ T (the solid line).
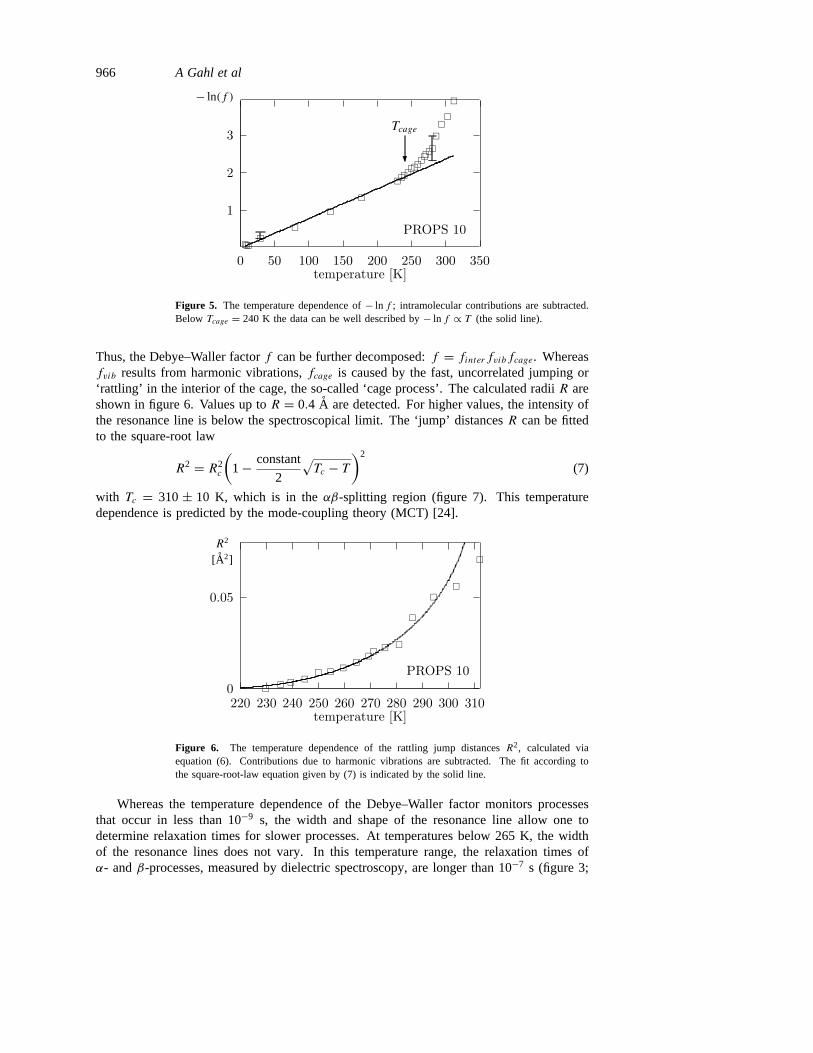
Thus, the Debye–Waller factorf can be further decomposed:f = finterfvibfcage. Whereasfvib results from harmonic vibrations,fcage is caused by the fast, uncorrelated jumping or‘rattling’ in the interior of the cage, the so-called ‘cage process’. The calculated radiiR areshown in figure 6. Values up toR = 0.4 A are detected. For higher values, the intensity ofthe resonance line is below the spectroscopical limit. The ‘jump’ distancesR can be fittedto the square-root law
R2 = R2c
(1− constant
2
√Tc − T
)2
(7)
with Tc = 310± 10 K, which is in theαβ-splitting region (figure 7). This temperaturedependence is predicted by the mode-coupling theory (MCT) [24].
0
0.05
220 230 240 250 260 270 280 290 300 310temperature [K]
PROPS 10
R2
[A2]
� � � � �� �
� �� � �
�
�
�
�
Figure 6. The temperature dependence of the rattling jump distancesR2, calculated viaequation (6). Contributions due to harmonic vibrations are subtracted. The fit according tothe square-root-law equation given by (7) is indicated by the solid line.
Whereas the temperature dependence of the Debye–Waller factor monitors processesthat occur in less than 10−9 s, the width and shape of the resonance line allow one todetermine relaxation times for slower processes. At temperatures below 265 K, the widthof the resonance lines does not vary. In this temperature range, the relaxation times ofα- andβ-processes, measured by dielectric spectroscopy, are longer than 10−7 s (figure 3;

The dynamic glass transition of a block copolymer 967
0123456789
3 3.5 4 4.5 5 5.5 6
a)
reciprocal temperature, 1000K/T
lg( νmaxHz)
-- -
-
Mossbauer spectroscopy +Dielectric spectroscopy ♦
β-process
α-process PROPS 10♦
♦♦♦♦♦
♦♦♦♦♦♦♦♦♦
♦♦
♦♦♦♦♦♦
♦♦♦♦♦♦♦+
++++++ ++
0123456789
3.5 4 4.5 5 5.5
b)
reciprocal temperature, 1000K/T
lg( νmaxHz)
Mossbauer spectroscopy +Dielectric spectroscopy ♦
β-process
α-process PROPS 2
--
--
♦
♦♦♦♦♦ ♦♦♦
♦♦♦♦♦♦
♦♦♦♦♦+
++
Figure 7. The temperature dependence of the frequencyνmax for both Mossbauer and dielectricdata. The two samples show a coincidence of the relaxation times for theβ-process.
265 K corresponds to 1000 K/T = 3.77). They correspond to energy transfers that aresmall compared to the natural linewidth00. Therefore for this dynamic regime no relaxationtimes are obtained by Mossbauer spectroscopy.
Above the temperatureT Mβ = 265± 5 K we observe the onset of a broadening ofthe resonance lines. We attribute this to the Arrhenius-activatedβ-process which is alsoseen by means of dielectric spectroscopy. The broadening becomes observable whenτ iscomparable to or shorter thanτn. Due to a continuum of inelastic energy transfers, the lineshapes can no longer be described by Lorentzians. Instead, we find that they can be wellreproduced (figure 4) by choosing the Kohlrausch–Williams–Watts (KWW) function for thedensity correlation function:
ψ(t) = exp(−(t/τKWW)βKWW ). (8)
The relaxation rate 1/τKWW is related toνmax of the HN function [16]. The KohlrauschparameterβKWW , 0 < βKWW 6 1, describes the width of the relaxation time distribution,which is wider for smallerβKWW . We evaluate equation (4) numerically by means of a fast-Fourier-transform (FFT) algorithm. As we use thick absorbers, we additionally need large-thickness corrections. The method for calculating the transmission integral of the Mossbauerspectra [25] is also based on FFT. The parameterβKWW obtained from the fit does not showa temperature dependence. In a first fit withf , ν andβKWW variable, an average value ofβKWW = 0.42 is determined in the temperature range whereT > T Mβ = 265 K for whicha line broadening is observed.

968 A Gahl et al
Using this βKWW -value, all of the spectra for the whole temperature range can bedescribed. The negative decadic logarithm of the characteristic timesτmax = 1/νmax isdepicted in figure 7 as crosses. Similar phenomena have been observed in incoherentinelastic neutron scattering experiments [5].
5. Discussion
By means of dielectric experiments (time window: 100 s to 10−7 s), it is possible to interpretthe Mossbauer data on a broader basis. Figure 7 shows both Mossbauer and dielectric datafor the samples PROPS 10 and PROPS 2.
For a more accurate discussion we have to consider the limits of the resolution ofthe two methods. Due to the small intensity of the Mossbauer resonance line at highertemperatures, the derived relaxation frequenciesν have an uncertainty as depicted in figure 7.Dielectric spectroscopy indicates rather small values [17] for the parametersβHN andβHNγHN for both peaks, describing their broadness and symmetry: 0.4 6 βHN 6 0.5and 0.56 βHNγHN 6 0.6.
Mossbauer spectroscopy probes the movement of the57Fe nucleus as a part of themonomer vinylferrocene, whereas dielectric spectroscopy gives a view of the movement ofpermanent dipoles of the angled C–S–C bonding of propylene sulphide. Nevertheless therelaxation times obtained by the two methods coincide very well (figure 7). These resultssupport those of Feyerhermet al [10], who pointed out that the movement of the57Fenucleus seems to reflect the movement of the whole chain.
In the relevant temperature range, the relaxation timesτmax of the α-process, obtainedby dielectric spectroscopy, are far too long to be detectable by Mossbauer spectroscopy.
reciprocal temperature [1/T]
α-process β-process
cage-process
| |
−7
−9
−12
−−2
Mossbauer time window
T −1g T −1
0
T −1cage
T M−1β
lg( νmaxHz )
Figure 8. The proposed scenario for the block copolymers studied, including all three processes;cf. also reference [27].
Parak and Frauenfelder carried out Mossbauer investigations on proteins [6], assigningthe broadening of the resonance line to cooperative motions—that is, theα-process. Hillberget al [11] performed Mossbauer investigations on a sample similar to the one used in thiswork (PROPS 12) and also attributed the line broadening to theα-process. From the presentdata, however, the line broadenings for PROPS 2 and 10 are unambiguously related to alocal, Arrhenius-activated process, theβ-process.
The dynamic glass transition of a block copolymer 969
The question of the cause of the dramatic decrease of the Debye–Waller factor remainsopen. As stated above, it is attributed to fast random motions,τ � 10−9 s. Qualitativelythe same temperature dependence of the Debye–Waller factor has been observed by Bartschet al [5, 26] performing quasielastic incoherent neutron scattering experiments on the Vander Waals glass orthoterphenyl: a linear temperature dependence of the logarithm of theDebye–Waller factor at low temperatures, followed by a decrease at higher temperatures.The authors describe the process responsible with a small-amplitude motion that proceedsin a time shorter than the time window of the neutron scattering experiment, e.g. a motionin the picosecond region. The increasing amplitude is interpreted as a widening of the cagefor the rattling motion of small chain portions. Thus neutron scattering and Mossbauerspectroscopy indicate very similar processes. This does not lead to any contradiction,although a Van der Waals glass and a polymer should show quite different behaviour. Thevery fast processes seem to be an intrinsic property for amorphous materials. On suchtimescales, specific polymer properties such as entanglement or chain length are no longerrelevant. The possibility that this fast process is the ‘normal’β-process which becomesfaster at higher temperatures can be discarded: the onset temperatureTcage = 240 K ofthis process, indicated by the decrease of the Debye–Waller factor, is lower than the onsettemperature of the line broadening, which is attributed to theβ-process.
6. Conclusion
This work combines Mossbauer investigations with dielectric spectroscopy on identicalpolymer samples. It demonstrates that Mossbauer spectroscopy alone is insufficient fora thorough interpretation of the motional dynamics. For our block copolymers, a typicalscenario is shown in figure 8.
From our results, three processes can be distinguished.
(i) The cooperativeα-process, which is connected to the glass transition temperatureTg(DSC) is observable by means of dielectric but not Mossbauer spectroscopy. It obeys theVFT law, yieldingT0 = 201± 2 K.
(ii) The local, Arrhenius-activatedβ-process is detected by means of dielectricspectroscopy and by means of Mossbauer spectroscopy from the broadening of the resonanceline. Its temperature-independent activation energy is 37± 2 kJ mol−1.
(iii) An anomalous decrease of the Debye–Waller factor is attributed to the onset of theso-called cage process atTcage = 240± 10 K. It is assumed to be fast (τ � 10−9 s), small-amplitude motion, restricted to a cage (60.5 A) formed by surrounding particles. Since noadditional barrier can be imagined within the cage, this process is expected to be not oronly weakly activated.
References
[1] Richert R and Blumen A (ed) 1994Disorder Effects on Relaxational Processes(Berlin: Springer)[2] Alicante Conf.; J. Non-Cryst. Solids1994172–174[3] McCrum N G, Read B E and Williams G 1991Inelastic and Dielectric Effects in Polymeric Solids(New
York: Dover)[4] Mossbauer R L 1987Hyperfine Interact.33 199[5] Bartsch E, Fujara F, Kiebel M, Sillescu H and Petry W 1989Ber. Bunsenges. Phys. Chem.93 1252[6] Parak F and Frauenfelder H 1993PhysicaA 201 332[7] Nienhaus G U and Parak F 1994Hyperfine Interact.90 243[8] Ruebenbauer K, Mullen J G, Nienhaus G U and Schupp G 1994Phys. Rev.B 49 15 607[9] Sepiol B and Vogl G 1995Hyperfine Interact.59 149
970 A Gahl et al
[10] Feyerherm R, Litterst F J, Burkhardt V and Nuyken O 1992Solid State Commun.82 141[11] Hillberg M, Stieler W, Litterst F J, Burkhardt V and Nuyken O 1994Hyperfine Interact.88 137[12] Kremer F, Boese D, Meier G and Fischer E W 1989Prog. Colloid Polym. Sci.80 129[13] Pohlmann T 1993PhD ThesisUniversity of Bayreuth[14] Hubsch C 1998PhD ThesisUniversity of Bayreuth[15] Havriliak S and Negami S 1966J. Polym. Sci.C 14 99[16] Alvarez F, Alegria A and Colmenero J 1993Phys. Rev.B 47 125[17] Schonhals A, Schlosser E and Carius H E 1990Acta Polym.41 412[18] Ferry J D 1980Viscoelastic Properties of Polymers3rd edn (New York: Wiley)[19] Vogel H 1921Phys. Z.22 645[20] Fulcher G S 1925J. Am. Ceram. Soc.8 339[21] Tammann G and Hesse W 1926Z. Anorg. Allg. Chem.156 245[22] Housley R M and Hess F 1966Phys. Rev.146 517[23] Nowik I, Bauminger E R, Cohen S G and Ofer S 1985Phys. Rev.A 31 2291[24] Gotze W 1986Phys. Scr.34 66[25] Stieler W, Hillberg M, Litterst F J, Bottger C and Hesse J 1995Nucl. Instrum. Methods Phys. Res.B 95 235[26] Sillescu H and Bartsch E 1994Disorder Effects on Relaxational Processesed R Richert and A Blumen
(Berlin: Springer) p 55[27] Donth E 1992Relaxation and Thermodynamics in Polymers. The Glass Transition(Berlin: Akademie)