soft soil stabilization using fly ash, polypropylene, copolymer ...
157
ISTANBUL TECHNICAL UNIVERSITY GRADUATE SCHOOL OF SCIENCE ENGINEERING AND TECHNOLOGY M.Sc. THESIS June, 2012 SOFT SOIL STABILIZATION USING FLY ASH, POLYPROPYLENE, COPOLYMER AND VHP Ehsan ETMINAN Department of Civil Engineering Soil Mechanics and Geotechnical Engineering Programme
-
Upload
khangminh22 -
Category
Documents
-
view
1 -
download
0
Transcript of soft soil stabilization using fly ash, polypropylene, copolymer ...

ISTANBUL TECHNICAL UNIVERSITY GRADUATE SCHOOL OF SCIENCE
ENGINEERING AND TECHNOLOGY
M.Sc. THESIS
June, 2012
SOFT SOIL STABILIZATION USING
FLY ASH, POLYPROPYLENE, COPOLYMER AND VHP
Ehsan ETMINAN
Department of Civil Engineering
Soil Mechanics and Geotechnical Engineering Programme
Anabilim Dalı : Herhangi Mühendislik, Bilim
Programı : Herhangi Program

June, 2012
ISTANBUL TECHNICAL UNIVERSITY GRADUATE SCHOOL OF SCIENCE
ENGINEERING AND TECHNOLOGY
SOFT SOIL STABILIZATION USING
FLY ASH, POLYPROPYLENE, COPOLYMER AND VHP
M.Sc. THESIS
Ehsan ETMINAN
(501091335)
Department of Civil Engineering
Soil Mechanics and Geotechnical Engineering Programme
Anabilim Dalı : Herhangi Mühendislik, Bilim
Programı : Herhangi Program
Thesis Advisor: Assoc.Prof. Aykut ŞENOL

Haziran, 2012
İSTANBUL TEKNİK ÜNİVERSİTESİ FEN BİLİMLERİ ENSTİTÜSÜ
YUMUŞAK ZEMİNLERİN UÇUCU KÜL, POLYPROPYLENE, COPOLYMER
VE VHP MALZEMELER İLE STABİLİZASYONU
YÜKSEK LİSANS TEZİ
Ehsan ETMINAN
(501091335)
İnşaat Mühendisliği Anabilim Dalı
Zemin Mekaniği ve Geoteknik Mühendisliği Programı
Anabilim Dalı : Herhangi Mühendislik, Bilim
Programı : Herhangi Program
Tez Danışmanı: Doç.Dr. Aykut ŞENOL

v
Thesis Advisor : Assoc.Prof. Aykut ŞENOL ..............................
Istanbul Technical University
Jury Members : Assoc.Prof. İsmail Hakkı AKSOY ..............................
Istanbul Technical University
Assis.Prof. Metehan İNCEGÜL ..............................
Yeditepe University
Ehsan ETMINAN, a M.Sc student of ITU Graduate School of Science
Engineering and Technology student ID 501091335 successfully defended the
thesis entitled “SOFT SOIL STABILIZATION USING FLY ASH,
POLYPROPYLENE, COPOLYMER AND VHP” which he prepared after
fulfilling the requirements specified in the associated legislations, before the jury
whose signatures are below.
Date of Submission : 03 May 2012
Date of Defense : 05 June 2012

vii
To my parents,

viii

ix
FOREWORD
First and foremost, I wish to thank to the respectful members of Geotechnical
Department of Istanbul Technical University for giving me the opportunity to study
on my M.Sc. thesis. I would specially like to thank and tell my regards to my
advisor, Assoc. Prof. Aykut ŞENOL, who was a great mentor and spent his valuable
time on my thesis, guided me throughout my study and shared his knowledge with
me. I would like to thank Assist Prof. Hasan YILDIRIM for his great support. I
would also like to thank Res. Assist. Mustafa HATIPOĞLU, Res. Assist. Tolga Y.
ÖZÜDOĞRU, M.Sc. A. Yetkin ÇETİN and our late technician Semih VİÇ, may his
soul rest in peace, for their valuable advices for my study. Finally, I want to thank to
my parents and my family for their moral support and I would like to dedicate this
thesis to my parents. They, more than anyone else, have been the best role models I
could have hoped for. Any accomplishments of mine are due to their support.
May, 2012
Ehsan ETMINAN

x

xi
TABLE OF CONTENTS
Page
FOREWORD ........................................................................................................ ix
TABLE OF CONTENTS ..................................................................................... xi
ABBREVIATIONS .............................................................................................. xv
LIST OF TABLES ............................................................................................. xvii
LIST OF FIGURES ............................................................................................ xix
SUMMARY ......................................................................................................... xxi
ÖZET ................................................................................................................. xxiii
1. INTRODUCTION ............................................................................................. 1
2. SOIL IMPROVEMENT TECHNIQUES ........................................................ 3 2.1 Concept ............................................................................................................... 3
2.2 Different Procedures of Soil Improvement ....................................................... 4
2.3 Dynamic Compaction (Impact Compaction) Method ....................................... 5
2.4 Geosynthectics ................................................................................................... 6
2.4.1 Definition .................................................................................................... 7
2.4.2 Types and manufacture ............................................................................... 7
2.4.3 Identification ............................................................................................... 8
2.4.4 Functions and applications .......................................................................... 8
2.5 Compaction Grouting ....................................................................................... 10
2.5.1 Compaction grouting process .................................................................... 10
2.5.2 Range of application of compaction grouting ........................................... 12
2.6 Soil Nailing ...................................................................................................... 12
3. SOIL STABILIZATION FOR PAVEMENTS ............................................. 15 3.1 Cementitious Stabilization ............................................................................... 15
3.1.1 Lime stabilization ...................................................................................... 15
3.1.1.1 Lime and soil modification ................................................................ 16
3.1.1.2 Soil stabilization by lime .................................................................... 16
3.1.1.3 Benefits of soil stabilization by lime .................................................. 17
3.1.1.4 Short and long-term economic benefits of using lime ....................... 17
3.1.1.5 How to use lime for soil stabilization ................................................ 18
3.1.1.6 The mechanisms of lime treatment of soils ....................................... 18
3.1.2 Portland cement stabilization .................................................................... 19
3.1.2.1 Stabilization mechanisms by portland cement ................................... 20
3.1.2.2 Mix design considerations of portland cement .................................. 21
3.1.2.3 Construction considerations ............................................................... 21
3.1.3 Fly ash stabilization .................................................................................. 23
3.1.3.1 Identification ...................................................................................... 23
3.1.3.2 Classifications and specifications of fly ash ...................................... 24
3.1.3.3 Restraints on the use of fly ash in highway constructions ................. 26
3.2 Safety Considerations of Cementitious Stabilization ....................................... 26

xii
3.3 Soil Stabilization Using Shredded Waste Tires (Scrap Tire rubber)Stabilization
......................................................................................................................... 28
3.3.1 Advantages of shredded tires .................................................................... 29
3.3.2 Disadvantages of shredded tires ................................................................ 29
3.3.3 Engineering properties of shredded tires ................................................... 30
3.4 Soil Reinforcement Using Natural and Syntheitc Fibers ................................. 31
3.4.1 Classification ............................................................................................. 32
3.4.2 Natural fibers ............................................................................................. 32
3.4.2.1 Coconut (coir) fibers .......................................................................... 33
3.4.2.2 Sisal fibers .......................................................................................... 34
3.4.2.3 Palm fibers .......................................................................................... 34
3.4.2.4 Bamboo fibers .................................................................................... 35
3.4.2.5 Flax fibers ........................................................................................... 35
3.4.3 Synthetic (man-made) fibers ..................................................................... 36
3.4.3.1 Polyethylene (PE) fibers ..................................................................... 36
3.4.3.2 Nylon fibers ........................................................................................ 37
3.4.3.3 Steel fibers .......................................................................................... 37
3.4.3.4 Polyvinyl alcohol (PVA) fibers .......................................................... 37
4. DETERMINATION OF ENGINEERING PROPERTIES OF SOFT
SOILS FOR SHALLOW SOIL STABILIZATION .................................... 39 4.1 Materials Used in Laboratory Tests ................................................................. 39
4.1.1 High plasticity clay soil ............................................................................. 39
4.1.2 Low plasticity clay soil ............................................................................. 42
4.1.3 Fly ash ....................................................................................................... 43
4.1.4 Polypropylene fiber ................................................................................... 44
4.1.5 Copolymer fiber ........................................................................................ 45
4.1.6 Virgin Homopolymerpolypropylene (VHP) fiber ..................................... 47
4.2 Laboratory Tests ............................................................................................... 48
4.2.1 Harvard miniature compaction test ........................................................... 50
4.2.2 Unconfined compression test .................................................................... 53
4.2.3 California bearing ratio test ....................................................................... 55
4.1 Evaluation of Laboratory Testing Data ............................................................ 55
4.1.1 Plain soils .................................................................................................. 57
4.1.1.1 High plasticity clay soil ...................................................................... 57
4.1.1.2 Fly ash mixtures in high plasticity clay soil ....................................... 58
4.1.1.3 Polypropylene mixtures in high plasticity clay soil ........................... 60
4.1.1.4 Copolymer mixtures in high plasticity clay soil ................................. 63
4.1.1.5 VHP mixtures in high plasticity clay soil ........................................... 66
4.1.1.6 Fly ash-polypropylene mixtures in high plasticity clay soil .............. 68
4.1.1.7 Fly ash-copolymer mixtures in high plasticity clay soil .................... 71
4.1.1.8 Fly ash-VHP mixtures in high plasticity clay soil.............................. 74
4.1.2.1 Low plasticity clay soil ...................................................................... 77
4.1.2.2 Fly ash mixtures in low plasticity clay soil ........................................ 78
4.1.2.3 Polypropylene mixtures in low plasticity clay soil ............................ 80
4.1.2.4 Copolymer mixtures in low plasticity clay soil .................................. 83
4.1.2.5 VHP mixtures in low plasticity clay soil ............................................ 85
4.1.2.6 Fly ash-polypropylene mixtures in low plasticity clay soil ................ 87
4.1.2.7 Fly ash-copolymer mixtures in low plasticity clay soil ...................... 90
4.1.2.8 Fly ash-VHP mixtures in low plasticity clay soil ............................... 93
5. CONCLUSIONS AND RECOMMENDATIONS ........................................ 97

xiii
REFERENCES .................................................................................................. 101
APPENDICES .................................................................................................... 105
CURRICULUM VITAE ................................................................................... 133

xiv

xv
ABBREVIATIONS
AASHTO : American Association of State Highway and Transportation Officials
CBR : California Bearing Ratio
CH : High Plasticity clay Soil
CL : Low Plasticity clay Soil
LL : Liquid Limit
PL : Plastic Limit
PI : Plasticity Index
SPT : Standard Penetration Test
qu : Unconfined Compression Strength
USCS : Unified Soil Classification System
w : Water Content
wopt : Optimum Water Content
γd : Dry Unit Weight
ε : Deformation
σ : Normal Stress

xvi

xvii
LIST OF TABLES
Page
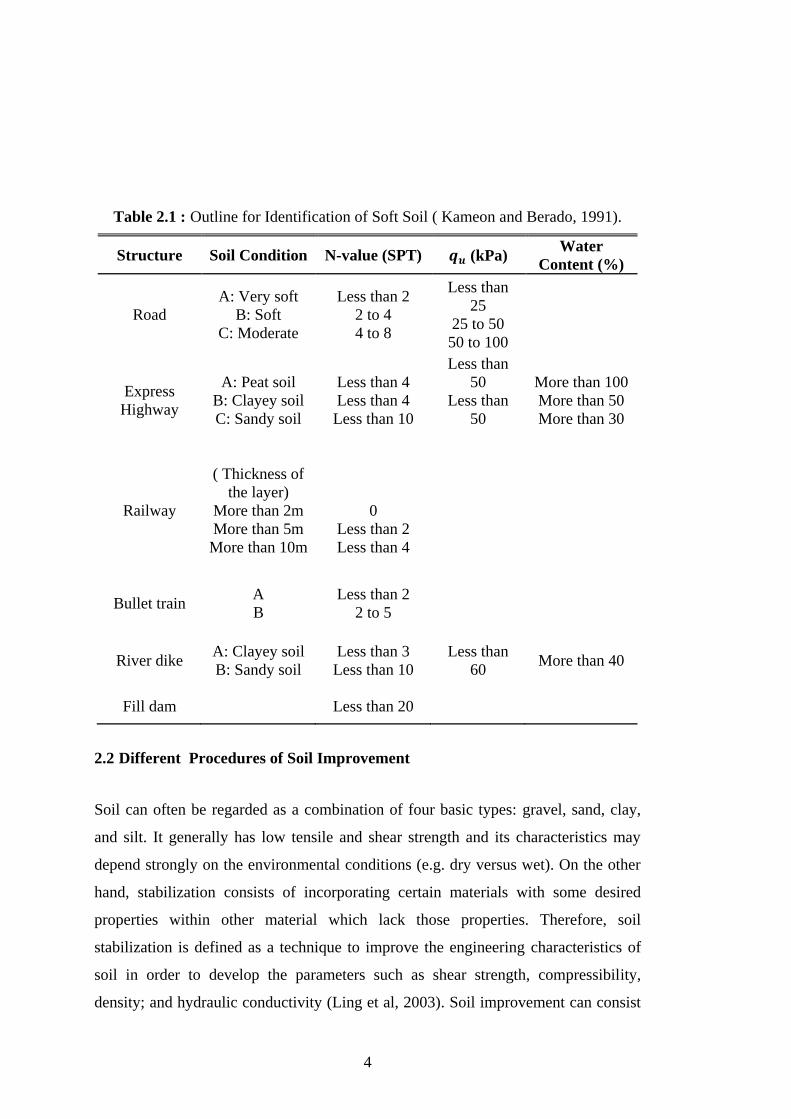
Table 2.1 : Outline for Identification of Soft Soil. ...................................................... 9
Table 2.2 : Types of geosynthetics applicable in geotechnical engineering. ............ 10
Table 3.1 : Recommended pulverization of soils. ..................................................... 22
Table 4.1 : Classification of high plasticity clay soil ................................................ 40
Table 4.2 : Atterberg limits of high plasticity clay soil ............................................. 41
Table 4.3 : Classification of low plasticity clay soil. ................................................ 42
Table 4.4 : Atterberg limits of low plasticity clay soil .............................................. 43
Table 4.5 : Chemical properties of fly ash ................................................................ 43
Table 4.6 : Physical properties of fly ash .................................................................. 43
Table 4.7 : Physical properties of polypropylene ...................................................... 45
Table 4.8: Physical properties of copolymer ............................................................. 46
Table 4.9: Physical properties of VHP ...................................................................... 47
Table 4.10: Comparison between standard, midified and harvard miniature
compaction tests ..................................................................................... 53
Table 4.11: Alternative materials and amount of them. ............................................ 56
Table 4.12: Results of experiments performed to calibrate the harvard miniature
equipment ............................................................................................... 57
Table 4.13: Results of experiments executed with high plasticity clay soil and
fly ash .................................................................................................... 59
Table 4.14 : Results of experiments executed with high plasticity clay soil and
polypropylene ........................................................................................ 61
Table 4.15: Results of experiments executed with high plasticity clay soil and
copolymer ............................................................................................... 64
Table 4.16 : Results of experiments executed with high plasticity clay soil and VHP
............................................................................................................... 66
Table 4.17 : Results of experiments executed with fly ash-polypropylene-high
plasticity clay soil .................................................................................. 69
Table 4.18 : Results of experiments executed with fly ash-copolymer-high plasticity
clay soil ................................................................................................. 72
Table 4.19 : Results of experiments executed with high plasticity clay soil and fly
ash- VHP mixtures ................................................................................ 75
Table 4.20 : Results of experiments performed to calibrate the harvard miniature
equipment. ............................................................................................... 77
Table 4.21 : Results of experiments executed with low plasticity clay soil and fly ash
............................................................................................................... 78
Table 4.22 : Results of experiments executed with low plasticity clay soil and
polypropylene ........................................................................................ 81
Table 4.23 : Results of experiments executed with low plasticity clay soil and
copolymer .............................................................................................. 83

xviii
Table 4.24 : Results of experiments executed with low plasticity clay soil and VHP
............................................................................................................... 86
Table 4.25 : Results of experiments executed with fly ash-polypropylene-low
plasticity clay soil .................................................................................. 88
Table 4.26 : Results of experiments executed with fly ash-copolymer-low plasticity
clay soil ................................................................................................. 91
Table 4.27 : Results of experiments executed with low plasticity clay soil and fly
ash- VHP mixtures ................................................................................ 94

xix
LIST OF FIGURES
Page
Figure 2.1 : Dynamic compaction Method. ................................................................ 6
Figure 2.2 : Types of geosynthetics applicable in geotechnical engineering. ........... 10
Figure 2.3 : Application of compaction grouting method. ........................................ 11
Figure 2.4 : Soil nailing consequences. .................................................................... 13
Figure 3.1 : Soil stabilization by using lime ..............................................................15
Figure 3.2 : Soil stabilization by using portland cement. .......................................... 20 Figure 3.3 : Soil stabilization by using fly ash .......................................................... 22 Figure 3.4 : Class C fly ash ....................................................................................... 24 Figure 3.5 : Class F fly ash ....................................................................................... 24 Figure 4.1 : Grain-size distribution of high plasticity clay soil … ........................... 44 Figure 4.2 : Grain-size distribution of low Plasticity clay soil .............................. 45 Figure 4.3: Grain-size distribution of fly ash ............................................................ 47 Figure 4.4 : Polypropylene fibers in (a) fibrillated form and (b) deformed form … 48 Figure 4.5 : Copolymer fibers in (a) fibrillated form and (b) deformed form … ..... 49 Figure 4.6 : VHP fibers in (a) fibrillated form and (b) deformed form .................... 50 Figure 4.7 :Tendency line for unconfined compressive strength vs time under
curing ..................................................................................................... 52 Figure 4.8 : Effect of fiber length on the unconfined compressive strength … ........ 52 Figure 4.9 : Modified Harvard Compaction apparatus ............................................. 54 Figure 4.10 : Comparison between standard proctor and harvard miniature
compaction tests ..................................................................................... 55 Figure 4.11 : Unconfined compression test apparatus … ......................................... 57 Figure 4.12 : California bearing ratio (CBR) test apparatus … ................................ 59 Figure 4.13 : Reference calibration’s unconfined compression test results .............. 61 Figure 4.14 : High plasticity clay soil’s peak point .................................................. 61 Figure 4.15 : Fly ash and high plasticity clay soil mixtures’ strength - water content
graph … ................................................................................................. 62 Figure 4.16 : Effect of adding fly ash with different amounts on CBR of CH ......... 63 Figure 4.17 : Polypropylene and high plasticity clay soil mixtures’ strength - water
content graph.......................................................................................... 65 Figure 4.18 : Reinforced high plasticity clay soil with different amounts of
polypropylene … ................................................................................... 66 Figure 4.19 : Effect of adding polypropylene with different amounts on CBR of CH
… ........................................................................................................... 66 Figure 4. 20 : Polypropylene and high plasticity clay soil mixtures’ strength - water
content graph.......................................................................................... 68 Figure 4. 21: Effect of adding copolymer with different amounts on CBR of CH ... 69 Figure 4.22 : Polypropylene and high plasticity clay soil mixtures’ strength - water
content graph …..................................................................................... 70

xx
Figure 4. 23 : Effect of adding VHP with different amounts on CBR of CH ........... 68 Figure 4. 24 : High plasticity and fly ash-polypropylene clay soil mixtures’ strength
- water content graph ............................................................................. 70 Figure 4.25 : Reinforced high plasticity clay soil with different amounts of
polypropylene … ................................................................................... 70 Figure 4.26 : CBR experiments’ results when mixing CH with 10% fly ash+ with
different amounts of polypropylene … .................................................. 71 Figure 4. 27 : High plasticity and fly ash-copolymer clay soil mixtures’ strength-
water content graph ................................................................................ 73 Figure 4. 28 : Reinforced high plasticity clay soil with different amounts of
copolymer .............................................................................................. 73 Figure 4. 29 : CBR experiments’ results when mixing CH with 10% fly ash+ with
different amounts of copolymer ............................................................. 74 Figure 4. 30 : High plasticity clay soil-fly ash-VHP mixtures’ strength - water
content graph .......................................................................................... 75 Figure 4. 31 : CBR experiments’ results when mixing CH with 10% fly ash+ with
different amounts of VHP ...................................................................... 76 Figure 4. 32 : Unconfined compression test results of low plasticity clay soil … .... 77 Figure 4. 33 : Low plasticity clay soil’s peak point .................................................. 78 Figure 4. 34 : Fly ash and low plasticity clay soil mixtures’ strength - water content
graph ...................................................................................................... 79 Figure 4. 35 : Effect of adding fly ash with different amounts on CBR of CL ......... 80 Figure 4. 36 : Polypropylene and low plasticity clay soil mixtures’ strength - water
content graph .......................................................................................... 81 Figure 4.37 : Reinforced low plasticity clay soil with different amounts of
polypropylene … ................................................................................... 82 Figure 4.38 : Effect of adding polypropylene with different amounts on CBR of CL
… ............................................................................................................ 83 Figure 4. 39 : Polypropylene and low plasticity clay soil mixtures’ strength - water
content graph .......................................................................................... 84 Figure 4. 40 : Effect of adding copolymer with different amounts on CBR of CL .. 85 Figure 4. 41 : Polypropylene and low plasticity clay soil mixtures’ strength - water
content graph … ..................................................................................... 86 Figure 4. 42 : Effect of adding VHP with different amounts on CBR of CL ........... 87 Figure 4. 43 : Low plasticity and fly ash-polypropylene clay soil mixtures’ strength -
water content graph ................................................................................ 89 Figure 4.44 : Reinforced low plasticity clay soil with different amounts of
polypropylene … ................................................................................... 89 Figure 4.45 : CBR experiments’ results when mixing CL with 10% fly ash+ with
different amounts of polypropylene … .................................................. 90 Figure 4. 46 : Low plasticity and fly ash-copolymer clay soil mixtures’ strength-
water content graph ................................................................................ 92 Figure 4. 47 : Reinforced low plasticity clay soil with different amounts of
copolymer .............................................................................................. 92 Figure 4. 48 : CBR experiments’ results when mixing CL with 10% fly ash+ with
different amounts of copolymer ............................................................. 93 Figure 4. 49 : Low plasticity clay soil-fly ash-VHP mixtures’ strength - water
content graph .......................................................................................... 95 Figure 4. 50 : CBR experiments’ results when mixing CL with 10% fly ash+ with
different amounts of VHP ...................................................................... 95

xxi
SOFT SOIL STABILIZATION USING
FLY ASH, POLYPROPYLENE, COPOLYMER AND VHP
SUMMARY
During this thesis both high and low plasticity soft clayey soil obtained from Akpınar
and Şile district of Istanbul, Turkey and mixed with class C fly ash which play the
role of cementitious binder and copolymer, polypropylene and
homopolymerpolypropylene fibers. All mentioned materials added to both clayey
soils with the scope of increasing the bearing capacity of them. The Laboratory tests
had been performed in the Istanbul Technical University’s Prof. Dr. Hamdi
Peynircioğlu Soil Mechanics Laboratory. First of all, the soils which obtained from
the field classified after performing the gradation analysis and the Atterberg limits.
Then, the clayey soil mixed with mentioned alternative materials and the optimum
water content and the maximum dry unit weight of blended soil determined by using
modified Harvard miniature compaction apparatus. Then, samples which extruded
from compaction equipment and kept in desicator for seven days as curing time,
executed to the unconfined compression test. Finally, samples prepared with respect
to each mixture’s optimum water content and executed to CBR tests. In the next step,
fly ash mixed combined with each of the fibers and new mixtures added to clayey
soils with the purpose of achieving better improvement. All compaction, unconfined
compression and CBR tests performed on these mixtures and as after gathering all
data, results of experiments done on high plasticity clay and low plasticity clay
compared. According to the data obtained from experiments, it has been improved
that mentioned alternative materials increased the strength of both high plasticity and
low plasticity clayey soils with different percentages.

xxii

xxiii
YUMUŞAK ZEMİNLERİN UÇUCU KÜL, POLYPROPYLENE,
COPOLYMER VE VHP MALZEMELER İLE STABİLİZASYONU
ÖZET
Günümüzde üst yapıdan kaynaklanan yüklerin artması, deprem ve toprak kayması
gibi doğal afetler göz önüne alındığında zeminlerin kendi bünyesinde yer alan
mühendislik özellikleri; inşaat mühendisliği yapılarının oturduğu temel tasarımları
için yetersiz sonuçlar doğurmaktadır. Özellikle yumuşak zeminler olarak
nitelendirilen siltli ve killi zeminler, başta mukavemet olmak üzere elverişsiz
mühendislik özelliklerine sahiptirler. Söz konusu elverişsiz mühendislik özelliklerini
barındıran zemin tabakaları üzerine, inşası düşünülen yapılar göz önünde
bulundurularak tekrar tasarlanmasına zemin iyileştirme denilmektedir. Zemin
iyileştirme yöntemlerindeki temel amaç, mekanik yöntemler ve araçlar kullanılarak
zeminin boşluk oranının azaltılması veya zemin boşluklarının çeşitli bileşimdeki
karışımlarla doldurulması işlemidir.
Bundan önce zeminlerin iyileşmesi için uygulanan genel çözüm, yumuşak zemin
tabakasının yeterli derinliğe kadar kazılarak kaldırılması ve bunun yerine değişik
granülometrilerde kırma taş, çakıl ve kum karışımlarının hazırlanıp, sıkıştırılarak
serilmesi şeklindedir. Mukavemeti düşük, yumuşak, ince daneli zeminin;
mukavemeti yüksek, sıkı, iri daneli zeminle yer değiştirmesi işlemi, işveren ve
yüklenici için zaman ve maliyet açısından büyük sorunlar oluşturabilmektedir.
Günümüzde gelişen teknolojinin ve çeşitli makinaların yardımıyla zemin iyileştirme
yöntemleri zemin yüzeyinden onlarca metre derinlere kadar etkili bir şekilde
uygulanmaktadır.
Genel olarak zemin iyileştirme yöntemleri uygulanan derinliğe göre ikiye ayrılır.
Eğer zemin iyileştirilmesinin derinliği temel tabanından itibaren taban genişliğinin
iki katından daha fazlaysa derin zemin iyileştirilmesi, derin zemin iyileştirmesinin
gerekli olmadığı durumlarda uygulanan yöntemlerde ise yüzeysel zemin iyileştirmesi
olarak adlandırılır. Yüzeysel zemin iyileştirmeleri genelde üstyapı yüklerinin çok
fazla olmadığı yapılarda veya demiryolu ve karayolu gibi yol inşaatlarında
kullanılırlar. Özellikle yol inşaları gibi yüzey alanının ve kazı hacminin büyük
olduğu uygulamalarda, kontrollü dolgu uygulamalarının getirisi olan büyük
maliyetler, geoteknik mühendisliğini alternatif yöntemler geliştirmeye yöneltmiştir.
Problemli zeminlerin varlığı ve derin zemin iyileştirme yöntemlerinin getirdiği
yüksek maliyetler sebebiyle pek çok yüzeysel zemin iyileştirme yöntemi ortaya
çıkmıştır. Bu yöntemlerden bazıları zeminlere çeşitli katkı maddeleri ilave edilerek,
bazıları ise herhangi bir madde katmaksızın uygulanırlar.

xxiv
Arazide zayıf mühendislik özelliklerine sahip mevcut zemin ile alternatif
malzemelerle belirli oranlarda karıştırılması son yıllarda sıkça uygulanan, maliyet
açısından büyük tasarruf sağlayan ve aynı zaman da yapım sürecini de kısaltan
avantajlı bir yöntemdir. Bu güne kadar zemin iyileştirme yöntemi olarak birçok
alternatif malzeme zayıf zeminle karıştırılarak çeşitli uygulamalarda kullanılmıştır.
Bu karışımlarda kullanılan alternatif malzemelerin bazıları doğal yollarla elde edilen,
bazıları ise sanayi ürünü veya sanayi artığı olarak elde edilen malzemelerdir.
Türkiye’de, elektrik enerjisi üretimi amacıyla kullanılan iki önemli üretim kaynağı
bulunmaktadır. Bunlar hidroelektrik enerjisi sağlayan barajlar ve genellikle yakıt
olarak pulverize kömürün kullanıldığı termik santrallerdir. Ayrıca pulverize kömür
yakıt olarak demir – çelik gibi ısıl işlemin kullanıldığı çeşitli sanayi sektörlerinde de
kullanılmaktadır. Pulverize kömürün yakılarak kullanıldığı tüm sanayi sektörlerinde,
ortaya çıkan çok ince küle “uçucu kül” adı verilir. Ortaya çıkan bu uçucu küller,
gerek taşıma ve gerekse depolama sırasında önemli sorunlar oluştururlar. Uçucu
küller kuru olarak atık depolarına atılmakta ya da suyla karıştırılmak suretiyle kül
barajlarına pompalanmaktadır. Dünyada ortaya çıkan uçucu kül miktarı yılda 500
milyon ton civarındadır. Ortaya çıkan bu 500 milyon tonun % 75’ ten fazlası
değerlendirilememektedir. Almanya, Belçika, Hollanda gibi çevreye duyarlı
ülkelerde uçucu kül değerlendirilmesi % 95 civarındayken, ABD, İngiltere, Çin gibi
sanayi yoğun ülkelerde bu oran % 30 - % 50 arasında değişmektedir. Türkiye’de
kömür ile çalışan 16 adet termik santralin oluşturduğu toplam uçucu kül miktarı yılda
ortalama 15 - 16 milyon ton civarındayken, 2050 yalında bu miktarın yılda 50
milyon tona çıkması tahmin edilmektedir. Türkiye’ de uçucu külün endüstrideki net
kullanımı konusunda yeterli bilgi bulunmasa da çeşitli yayınlarda, üretilen toplam
uçucu külün %5’ i kadarı çimento ve beton üretiminde katkı olarak kullanıldığı
vurgulanmıştır. Termik santrallerden açığa çıkan atıkların, önemli çevre sorunları
yarattığı bilinmektedir. Bu atıkların inşaat sektöründe, özellikle beton ve çimento
üretiminde değerlendirilmesi çevresel, teknik ve ekonomik yönden büyük faydalar
sağlamaktadır. Ancak ortaya çıkacak uçucu kül hacmi beton üretim sektöründe
kullanılana göre çok fazla olduğundan, araştırmacılar farklı disiplinlerde de bu
malzemeyi kullanmayı denemişlerdir. Geoteknik mühendisleri ise uçucu külü zemin
iyileştirmesinde kullanarak yararlı ve alternatif bir tüketim oluşturmuşlardır.
Polimerler hayatımız için yaşamsal önemi olan büyük moleküllerdir. Ancak doğal
polimerlerin haricinde, hepimizin gündelik hayatta en çok duyduğu ya da bildiği
polimerler plastikler ve kauçuklardır. Yapay polimerler birçok sektörde olduğu gibi
inşaat mühendisliğinde de yapı malzemesi olarak kullanılmaktadır. Altyapı
ürünlerinden, ev dekorasyon ürünlerine kadar yapı malzemesinin her alanında plastik
malzemeleri ya da plastik bazlı kompozit malzemeleri görülebilir.
Yüzeysel zemin stabilizasyonu kapsamında, polipropilen, polyester ve kopolimer
gibi polimerler, son yıllarda alternatif malzeme arayışında olan geoteknik
mühendisliğinin ilgi alanına girmiştir. Yüksek çekme mukavemetine sahip bu
malzemelerin zemin içinde kullanıldıklarında, gerilmeleri üstlenip bu gerilmeleri
zemin içerisinde dağıtma eğilimi gösterir. Ayrıca yapay polimerlerin ucuz maliyetleri
ve kolay elde edilmeleri nedeniyle, yüzeysel zemin iyileştirilmelerin de
kullanılmaları yararlı sonuçlar doğurmaktadır. Atıkların ve yapay polimerlerin, yan
ürün ve dolgu malzemesi olarak inşaat sektöründe kullanılması, dolgu kalınlığının
azalmasına, mukavemetinin artmasına ve doğanın korunmasına yardımcı olacaktır.
Ayrıca, bu atıkların değerlendirilmesi ile depolama ve geri dönüştürmeden

xxv
kaynaklanan çevre kirliliği ve ek maliyetler azalacaktır. Bu sebepler göz önüne
alındığında yararlı atık maddelerin yol ve üstyapı inşaatlarında kullanılması
araştırmacıların ve uygulamacıların dikkatini çeken bir çözüm oluşturmaktadır.
Bu çalışmada Akpınar ve Şile bölgelerinden alınan yüksek ve düşük plastisiteli
yumuşak kil zeminler; çimentolaşma rolü oynayan C tipi uçucu kül, kopolimer,
polipropilen ve VHP fiberleri ile ayrı ayrı ve birlikte karıştırılmıştır. Bu malzemeler
kullanılarak, iki farklı kil zemin için taşıma gücünün arttırılması amaçlanmıştır.
Laboratuar çalışmaları İstanbul Teknik Üniversitesi Prof. Dr. Hamdi Peynircioğlu
zemin mekaniği laboratuarında yapılmıştır. Deney çalışmaları sırasında ilk olarak,
araziden alınan zeminler granülometri eğrisi ve Atterberg kıvam limitleri kullanılarak
sınıflandırılmıştır. Daha sonra bu zeminler alternatif malzemeler ile karıştırılmış ve
modifiye Harvard minyatür kompaksiyon aleti ile numunelerinin optimum su
muhtevaları ve maksimum kuru birim hacim ağırlıkları belirlenmiştir. Sonrasında,
kompaksiyon aleti yardımıyla elde edilen numuneler yedi gün süre ile desikatörde
bekletilmiş ve serbest basınç deneyine tabii tutulmuşlardır. Bir sonraki aşamada,
optimum su muhtevasında hazırlanmış her bir numune üzerinde CBR deneyi
yapılmıştır. Son olarak, killi zeminlerde daha yüksek iyileştirme elde etmek için
uçucu kül her bir fiberle ayrı ayrı karıştırılmıştır. Bütün karışımlar üzerinde
kompaksiyon, serbest basınç ve CBR deneyleri yapılmış ve veriler toplanılarak
sonuçlar düşük ve yüksek plastisiteli her iki zemin türü için karşılaştırılmıştır.
Deneylerden elde edilen sonuçlar doğrultusunda, alternatif malzemelerin yüksek ve
düşük plastisiteli killi zeminlerin mukavemetlerini farklı yüzdelerde arttırdığı tespit
edilmiştir.

v

1
1. INTRODUCTION
As more and more construction is concentrated in densely populated urban areas,
there is an increasing need to construct on soft subsoils, which were considered
unsuitable for construction just a couple of decades ago. Soft soils are complex, rate-
dependent non-linear multi-phase materials, and major advances have been made in
recent years in advanced constitutive modeling of such materials. For high subgrade
constructions, selection of appropriate materials for embankment construction is a
challenging issue both in terms of cost and expected engineering performance.
Excavation, loading and transportation of the materials are the most important
constituents of the total cost during embankment construction process. In the
conventional approach, the soft foundation soils are removed and replaced by gravel
or crushed rock fill layer. The embankment, subbase, base and pavement materials
are provided from borrow sites resulting in significant cost increases. The use of on-
site soils is the most economical approach especially in comparison to bringing select
borrow materials from remote locations. It is conceivable that stabilization of
marginal on-site soils and improvement of their engineering properties can be an
economical alternative to borrow materials.
Stabilization of the soils and pavement bases with coal fly ash became a very good
option for design engineers. Fly ash stabilization used in order to modify the
engineering properties of locally available materials. Fly ash is the material extracted
from flue gases of a furnace fired with coal. Fly ash is non-plastic fine silt and its
composition varies according to the nature of coal burned. The quantity of fly ash
generated per year worldwide exceeds 600 million tons, and in Turkey
approximately 13 million tons of fly ash is produced per year in 11 power plants. At
present, the generation of fly ash is far in excess of its utilization. It is can be used as
an alternative to conventional materials in the construction of geotechnical and
geoenvironmental infrastructures (Şenol et al., 2003).
Randomly distributed fibers, when used as insertion in highway subgrades, can also
produce a high performance in the stabilization of weak roads. Many investigators

2
have used various types of fibers under different test conditions. The most important
findings of the previous research work is that the use of certain fiber in road
construction can significantly increase pavement resistance to rutting, as compared to
the resistance of non-stabilized pavement over a weak subgrade. Polypropylene,
copolymer and homopolymerpolypropylene fibers that used in concrete applications
recently used in the geotechnical engineering in order to increase the strength of
subgrade soils.
During this study, fly ash as a recycled material and polypropylene, copolymer and
homopolymerpolypropylen fibers as synthetic fibers added to the weak subgrade
soils. Related experiments performed in order to classify mentioned soils and
determine their initial compaction and unconfined compression strength and even
CBR percent of them. Then, each four alternative materials mixed with soils and the
amounts of improvement measured by explained tests. In the last part of
experiments, with the purpose of achieving better amounts of stabilization, each fiber
mixed with fly ash and total mixture blended with soils and their compaction and
unconfined compression strength obtained and all data compared in order to get a
general rule for soft soil stabilization by using mentioned alternative materials.

3
2. SOIL IMPROVEMENT TECHNIQUES
2.1 Concept
In general, the term soft soil includes soft clay soils, soils with large fractions of fine
particles such as silts, clay soils which have high moisture content, peat foundations,
and loose sand deposits near or under the water Table (Kamon and Bergado, 1991).
For clayey soils, the softness of the subgrade can be assessed by its unconfined
compressibility strength, . On the other hand, the SPT N-values are utilized to
ascertain the consistency of the subgrade and its relative density. Table 2.1 outlines
the identification of soft soil according to the types of the structure using the
aforementioned assessment methods.
Construction of buildings and other civil engineering structures on weak or soft soil
are highly risky because such soil is susceptible to differential settlements due to its
poor shear strength and high compressibility. Generally soil improvement in
geotechnical engineering means the increase on soil shear strength, the reduction of
soil compressibility, and the reduction of soil permeability. The soft soil
improvement techniques can be classified broadly into two categories, namely: I)
those techniques involving the work on soil only such as dewatering and compaction
and II) those methods that require foreign materials such as the use of the chemical
admixtures and the utilization of various reinforcements. Various soil improvement
techniques are presented that have been tested to provide soil strength improvement,
mitigation of total and differential settlements, shorter construction time, reduced
construction costs, and other characteristics which may impact on their utilization to
specific projects on soft soil. For infrastructures in embankment fill on soft subgrade,
soil improvement is not limited to portions below ground, but also includes
improvement of fill soils above ground by reinforcing by grids or geotextiles as well
as by the use of light materials such as Virgin Homopolymerpolypropylene or fly ash
and other related materials. (Powrie, 2004).
4
Table 2.1 : Outline for Identification of Soft Soil ( Kameon and Berado, 1991).
Structure Soil Condition N-value (SPT) (kPa) Water
Content (%)
Road
A: Very soft
B: Soft
C: Moderate
Less than 2
2 to 4
4 to 8
Less than
25
25 to 50
50 to 100
Express
Highway
A: Peat soil
B: Clayey soil
C: Sandy soil
Less than 4
Less than 4
Less than 10
Less than
50
Less than
50
More than 100
More than 50
More than 30
Railway
( Thickness of
the layer)
More than 2m
More than 5m
More than 10m
0
Less than 2
Less than 4
Bullet train A
B
Less than 2
2 to 5
River dike A: Clayey soil
B: Sandy soil
Less than 3
Less than 10
Less than
60 More than 40
Fill dam Less than 20
2.2 Different Procedures of Soil Improvement
Soil can often be regarded as a combination of four basic types: gravel, sand, clay,
and silt. It generally has low tensile and shear strength and its characteristics may
depend strongly on the environmental conditions (e.g. dry versus wet). On the other
hand, stabilization consists of incorporating certain materials with some desired
properties within other material which lack those properties. Therefore, soil
stabilization is defined as a technique to improve the engineering characteristics of
soil in order to develop the parameters such as shear strength, compressibility,
density; and hydraulic conductivity (Ling et al, 2003). Soil improvement can consist

5
of soil nailing, dynamic compaction, jet grout and other methods. Mainly, materials
used as soil stabilizer are composite materials consisting of alternating layers of
compacted backfill and man-made reinforcing materials. So, the primary purpose of
improving soil mass is to improve its stability, to increase its bearing capacity, and to
reduce settlements and lateral deformation (McGown et al, 1978).
2.3 Dynamic Compaction (Impact Compaction) Method
Dynamic compaction (Figure 2.1) is the process of forcing granular particles into a
tighter arrangement subsequent to impact by another object. Typically, compaction is
achieved by using heavy rollers or vibratory equipment. Conventional compaction,
which first requires soil removal, is used for controlled fill placement and is
undertaken in thin lifts, usually 9 to 12 inches thick. The water content of the
material being densified during conventional compaction must be controlled to
within a few percentage points of optimum water content by aeration or wetting.
Generally speaking, this type of compaction is undertaken above the water Table.
On the other hand, dynamic compaction is the process of densifying soils to elatively
great depths by applying energy at the existing ground surface. The soils are
densified at the prevailing water content when the energy is applied. Granular soil
deposits located below the groundwater Table also achieve densification (DAS,
2007).
Densification results from systematically lifting and dropping a heavy steel weight
from a crawler crane. The weights generally range from 6 to 30 tons, and the drop
height typically ranges from 1m to 30m. Following impact, craters as deep as six feet
are created and later backfilled utilizing fill materials. The number of times a weight
must be dropped in one place is calculated during the soil analysis phase. One of the
most important considerations regarding the applicability of dynamic compaction is
the type of soil being densified. Most soil types can be improved with dynamic
compaction. Old fills and granular soils are most often treated. The soils that are
below the water Table have to be treated carefully to permit emission of the excess
pore water pressure that is created when the weight is dropped onto the surface.
Borings should be made to determine the actual properties that have been achieved
after densification, from which a more refined settlement prediction can be made.

6
Analysis of both the land under consideration and a thorough understanding of the
contemplated use of the land is imperative (Raison, 2004).
Figure 2.1 : Dynamic compaction Method (http://www.instantel.com).
2.4 Geosynthectics
Geosynthetics are planar products manufactured from polymeric materials (the
synthetic) used with soil, rock, or other geotechnical- related material (the geo) as
part of a civil engineering project or system. There are few developments that have
had such a rapid growth and strong influence on so many aspects of civil engineering
practice as geosynthetics. In 1970, there were only five or six geosynthetics
available, while today more than 600 different geosynthetic products are sold
throughout the world. Worldwide annual consumption of geosynthetics is
approximately close to 1,000,000,000 . Since the total cost of the construction is at
least four or five times the cost of the geosynthetic itself, the impact of these
materials on civil engineering construction is very large indeed. In less than 30 year,
geosynthetics have revolutionized many aspects of our practice, and in some
applications they have entirely replaced the traditional construction material. In many
cases, the use of a geosynthetic can significantly increase the safety factor, improve

7
performance, and reduce costs in comparison with conventional design and
construction alternates (Dixon, 1998).
2.4.1 Definition
ASTM has defined a geosynthetic as a planar product manufactured from a
polymeric material used with soil, rock, earth, or other geotechnical-related material
as an integral part of a civil engineering project, structure, or system. A geotextile is
a permeable geosynthetic made of textile materials. Geogrids are primarily used for
reinforcement; they are formed by a regular ne twork of tensile elements with
apertures of sufficient size to interlock with surrounding fill material. Geomembranes
are lowpermeability geosynthetics used as fluid barriers. Geotextiles and related
products such as nets and grids can be combined with geomembranes and other
synthetics to take advantage of the best attributes of each component. These products
are called geocomposites, and they may be composites of geotextile-geonets,
geotextile-geogrids, geotextilegeomembranes, geomembrane-geonets, geotextile-
polymeric cores, and even threedimensional polymeric cell structures. There is
almost no limit to the variety of geocomposites that are possible and useful. The
general generic term encompassing all these materials is geosynthetic (Puppala et al,
2010).
2.4.2 Types and manufacture
Most geosynthetics are made from synthetic polymers such as polypropylene,
polyester, polyethylene, polyamide, PVC, homopolymers, etc. These materials are
highly resistant to biological and chemical degradation. Natural fibers such as cotton,
jute, bamboo, etc., could be used as geotextiles and geogrids, specially for temporary
applications, but with few exceptions they have not been promoted or researched as
widely as polymeric geosynthetics. In manufacturing geotextiles, elements such as
fibers or yarns are combined into planar textile structures. The fibers can be
continuous filaments, which are very long thin strands of a polymer, or staple fibers,
which are short filaments, typically 20 to 100 mm long. The fibers may also be
produced by slitting an extruded plastic sheet or film to form thin flat tapes. In both
filaments and slit films, the extrusion or drawing process elongates the polymers in
the direction of the draw and increases the fiber strength.

8
Geotextile type is determined by the method used to combine the filaments or tapes
into the planar textile structure. The vast majority of geotextiles are either woven or
nonwoven. Woven geotextiles are made of monofilament, multifilament, or
fibrillated yarns, or of slit films and tapes. Although the weaving process is very old,
nonwoven textile manufacture is a modem industrial development. Synthetic
polymer fibers or filaments are continuously extruded and spun, blown or otherwise
laid onto a moving belt. Then the mass of filaments or fibers are either needle
punched, in which the filaments are mechanically entangled by a series of small
needles, or heat bonded, in which the fibers are welded together by heat and/or
pressure at their points of contact in the nonwoven mass. Stiff geogrids with integral
junctions are manufactured by extruding and orienting sheets of polyolefins. Flexible
geogrids are made of polyester yarns joined at the crossover points by knitting or
weaving, and coated with a polymer (Puppala et al, 2010).
2.4.3 Identification
Geosynthetics are generically identified by: (I) polymer; (II) type of fiber or yarn, if
appropriate; (III) type of geosynthetic; (VI) mass per unit area or thickness, if
appropriate; and (V) any additional information or physical properties necessary to
describe the material. Four examples are:
polypropylene staple fiber needlepunched nonwoven, 350 g/m2;
polyethylene net, 440 g/m2 with 8 mm openings;
polypropylene biaxial geogrid with 25 mm x 25 mm openings; and
high-density polyethylene geomembrane, 1.5 mm thick.
2.4.4 Functions and applications
Geosynthetics Geosynthetics have six primary functions:
filtration
drainage
separation
reinforcement
9
fluid barrier
protection
Geosynthetic applications are usually defined by their primary, or principal, function.
In a number of applications, in addition to the primary function, geosynthetics
usually perform one or more secondary functions. It is important to consider both the
primary and secondary functions in the design computations and specifications. More
than 150 separate applications of geosynthetics have been identified (Koerner, 2005).
A few examples follow:
Geotextile filters replace graded granular filters in trench drains to prevent soils from
migrating into drainage aggregate or pipes. They are also used as filters below riprap
and other armor materials in coastal and river bank protection systems. Geotextiles
and geocomposites can also be used as drains, by allowing water to drain from or
through soils of lower permeability. Examples include pavement edge drains, slope
interceptor drains, and abutments and retaining wall drains. Geotextiles are often
used as separators to prevent fine- grained subgrade soils from being pumped into
permeable, granular road bases and to prevent road base materials from penetrating
into the underlying soft subgrade. Separators maintain the design thickness and
roadway integrity. Geogrid and geotextile reinforcement enables embankments to be
constructed over very soft foundations. They are also used to construct sTable slopes
at much steeper angles than would otherwise be possible. Polymeric reinforced
backfills for retaining walls and abutments was mentioned in the Introduction.
Geomembranes, thin-film geotextile composites, geosynthetic-clay liners, and field-
coated geotextiles are used as fluid barriers to impede the flow of a liquid or gas
from one location to another. This geosynthetic function has application in asphalt
pavement overlays, encapsulation of swelling soils, and waste containment. In the
sixth function, protection, the geosynthetic acts as a stress relief layer. A protective
cushion of nonwoven geotextiles is often used to prevent puncture of geomembranes
(by reducing point stresses) from stones in the adjacent soil or drainage aggregate
during installation and while in service (Guangxin et al, 2008). Figure 2.2 illustrates
types of geosynthetics used in geotechnical engineering.

10
Figure 2.2 : Types of geosynthetics applicable in geotechnical engineering.
2.5 Compaction Grouting
Compaction grouting is the strategic injection of a low-slump mortar grout under
relatively high pressure to displace and compact soil in place. This technique was
pioneered on the west coast of the United States in the 1950s, and is the only
grouting technique to have its roots in that country. Developed to overcome the lack
of control of travel and set times associated with conventional slurry grouting,
compaction grouting was first used to rectify settled structures. In the late 1970s, the
technique was used for the first time in lieu of underpinning to protect surface
structures from settlement during soft ground tunneling (Karol, 2005).
2.5.1 Compaction grouting process
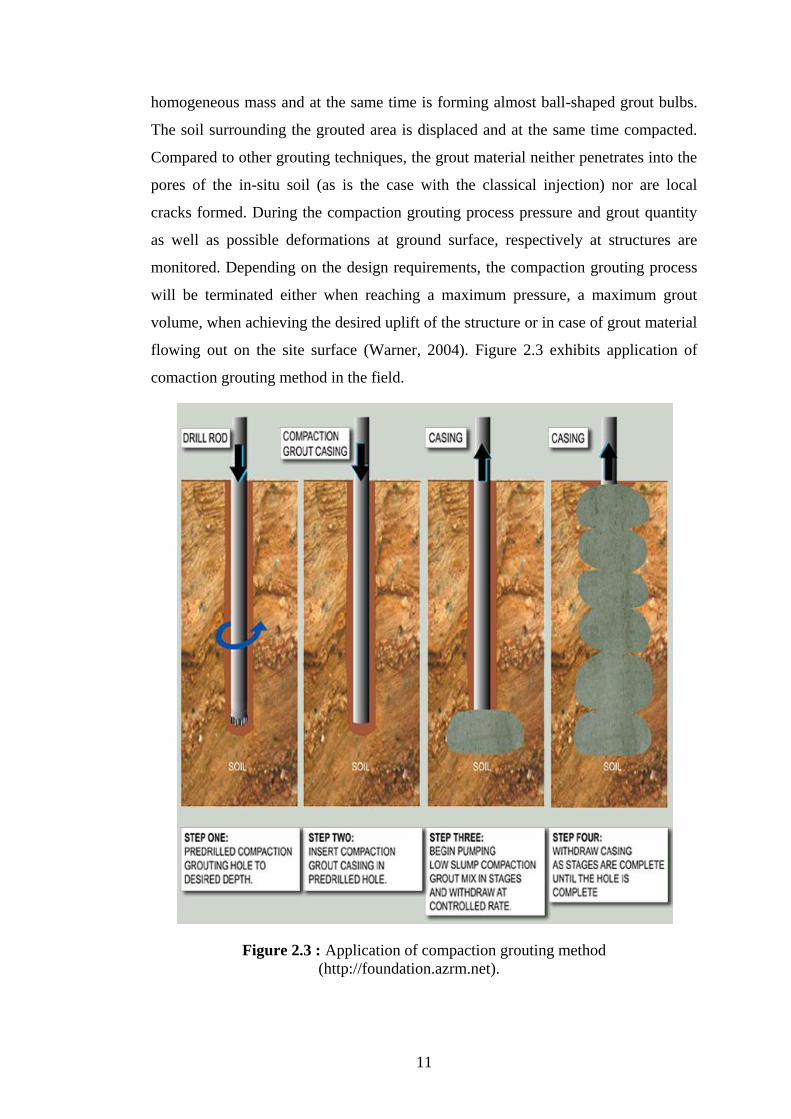
When applying the compaction grouting process usually a stiff to plastic grout is
injected into the soil under pressure. It expands in the soil as a relatively
11
homogeneous mass and at the same time is forming almost ball-shaped grout bulbs.
The soil surrounding the grouted area is displaced and at the same time compacted.
Compared to other grouting techniques, the grout material neither penetrates into the
pores of the in-situ soil (as is the case with the classical injection) nor are local
cracks formed. During the compaction grouting process pressure and grout quantity
as well as possible deformations at ground surface, respectively at structures are
monitored. Depending on the design requirements, the compaction grouting process
will be terminated either when reaching a maximum pressure, a maximum grout
volume, when achieving the desired uplift of the structure or in case of grout material
flowing out on the site surface (Warner, 2004). Figure 2.3 exhibits application of
comaction grouting method in the field.
Figure 2.3 : Application of compaction grouting method
(http://foundation.azrm.net).

12
2.5.2 Range of application of compaction grouting
The compaction grouting method may be used for the improvement of non-cohesive
soils, especially in cases, where soils of loose to medium density are encountered.
This method is also used in fine-grained soils in order to install elements of higher
strength and bearing capacity in soils of low bearing capacity, thus improving the
load bearing behavior of the soil. When using this technique in saturated clayey soil,
a temporary increase of the pore water pressure can be observed (Warner, 2004).
2.6 Soil Nailing
The basic concept of soil nailing is to reinforce and strengthen the existing ground by
installing closely-spaced steel bars, called "nails", into a slope or excavation as
construction proceeds from the “top down.” This process creates a reinforced section
that is internally table and able to retain the ground mass. As with mechanically
stabilized earth walls, the reinforcements are passive and develop their reinforcing
action through nail-ground interactions as the ground deforms during and following
construction. Nails work predominantly in tension but may develop shear in certain
circumstances. The effect of the nail reinforcement is to improve stability by 1)
increasing the normal force and hence the soil shear resistance along potential slip
surfaces in frictional soils; and 2) reducing the driving force along potential slip
surfaces in both frictional and cohesive soils. A construction facing is also usually
required and is typically shotcrete reinforced by welded wire mesh. The steel nail
bars are typically 20 to 35 mm in diameter, with a yield strength in the range of 420
to 500 N/mm2, and are typically installed into drillholes having diameters in the
range of 100 mm to 300 mm and at a spacing between 1 and 2 meters. The nail
lengths are typically 70 to 100 percent of the wall height. Nail inclinations are
generally on the order of 15 degrees below horizontal to facilitate grouting. Soil nails
typically consist of steel reinforcement inclusions and may be categorized on the
basis of their method of installation and degree of corrosion protection. For
conventional drill and grout nail installations, the nail grout consists typically of a
neat cement grout with a water cement ratio of about 0.4 to 0.5. Where a stiffer
consistency grout is required a lower slump sand-cement grout may be used. Sand-
cement grout may also be used in conjunction with large nail holes for economic

13
reasons (Figure 2.4). There are 3 general rules for the calculation and installation of
soil nails:
I. Soil nails must penetrate beyond the slip plane into the passive zone typically for
4-5 meters.
II. The spacing of the soil nails, horizontally and vertically, must be directly related
to the strength of the soil. Extra soil nails should be installed at the edge of any
surface being stabilized.
III. Soil nailing should commence immediately after excavation. Any delay increases
the chance of the unrestrained ground relaxing (Johnson P., Card G., 1998).
Figure 2.4 : Soil nailing consequences (http://1.bp.blogspot.com).

14

15
3. SOIL STABILIZATION FOR PAVEMENTS
3.1 Cementitious Stabilization
The principal materials used for the cementitious stabilization and modification of
highway pavement materials are lime, fly ash, and portland cement. Whereas lime
and portland cement are manufactured products, fly ash is a by-product of the
burning of coal at electric power generating stations. As a consequence, fly ash
generally exhibits greater variability than is seen in the other products. By-products
such as kiln dust and fluidized bed ash from various manufacturing and energy
generating processes are used to a lesser extent. Stabilization projects are almost
always site-specific, requiring the application of standard test methods, along with
fundamental analysis and design procedures, to develop an accepTable solution. As
with any such process, adherence to strict environmental constraints is vital to project
success. The use of cementitious materials makes a positive contribution to economic
and resource sustainability because it allows enhancement of both standard and
substandard in situ soils to levels consistent with the requirements of a given
application (Ibanez, 2007).
3.1.1 Lime stabilization
Lime can be used to treat soils in order to improve their workability and load-bearing
characteristics in a number of situations. Quicklime is frequently used to dry wet
soils at construction sites and elsewhere, reducing downtime and providing an
improved working surface. An even more significant use of lime is in the
modification and stabilization of soil beneath road and similar construction projects.
Lime can substantially increase the stability, impermeability, and load-bearing
capacity of the subgrade. Both quicklime and hydrated lime may be used for this
purpose. Application of lime to subgrades can provide significantly improved
engineering properties. Figure 3.1 exhibits soil stabilization using lime (Das, 2007).

16
Figure 3.1 : Soil stabilization by using lime (www.mwvetcon.com).
3.1.1.1 Lime and soil modification
Lime is an excellent choice for short-term modification of soil properties. Lime can
modify almost all fine-grained soils, but the most dramatic improvement occurs in
clay soils of moderate to high plasticity. Modification occurs because calcium
cations supplied by hydrated lime replace the cations normally present on the surface
of the clay mineral, promoted by the high pH environment of the lime-water system.
Thus, the clay surface mineralogy is altered, producing the following benefits:
Plasticity reduction;
Reduction in moisture-holding capacity (drying);
Swell reduction;
Improved stability; and
Ability to construct a solid working platform (Kumar et al, 2007).
3.1.1.2 Soil stabilization by lime
Soil stabilization occurs when lime is added to a reactive soil to generate long-term
strength gain through a pozzolanic reaction. This reaction produces sTable calcium

17
silicate hydrates and calcium aluminate hydrates as the calcium from the lime reacts
with the aluminates and silicates solubilized from the clay. The full-term pozzolanic
reaction can continue for a very long period of time, even decades (as long as enough
lime is present and the pH remains high (above 10)). As a result, lime treatment can
produce high and long-lasting strength gains. The key to pozzolanic reactivity and
stabilization is a reactive soil, a good mix design protocol, and reliable construction
practices (Little, 1995).
3.1.1.3 Benefits of soil stabilization by lime
Lime substantially increases soil resilient modulus values (by a factor of 10 or more
in many cases). In addition, when lime is added to soil, substantial improvements in
shear strength (by a factor of 20 or more in some cases), continued strength over
time, even after periods of environmental or load damage (autogenous healing), and
long-term durability over decades of service even under severe environmental
conditions have been seen. Generally we can categorize advantages of lime treatment
as below.
• Save budget - reduce project costs.
• Save time - bring your project back on schedule or even finish early
• Least environmental impact - minimise vehicle movements and disturbance
to the surrounding areas.
• Minimise - waste generation, tipping and aggregate fill demand.
• Avoid - aggregate and landfill taxes.
• Simple - process and equipment requirements.
• Long history of use - used widely for many years throughout the World
(Qubain BS., 2000).
3.1.1.4 Short and long-term economic benefits of using lime
In the short-term, the structural contribution of lime-stabilized layers in pavement
design can create more cost-effective design alternatives. For instance,a project in

18
Pennsylvania began with a $29.3 million traditional design approach. An alternate
design using lime stabilization, consistent with AASHTO mechanistic-empirical
designs, cost only $21.6 million—more than 25 percent savings. The savings came
from treating the existing subgrade material with lime, rather than removing the
material and replacing it with granular material; and thinner layers of flexible
pavement for the lime stabilized alternate due to the increased strength of the lime
stabilized subbase. In the longer term, lime stabilization provides performance
benefits that reduce maintenance costs. To illustrate, stabilizing an 8-inch native
clay subgrade with lime as part of an asphalt pavement project can reduce 30-year
life cycle costs from $24.49 to $22.47 per square yard (Ibanez, 2007).
3.1.1.5 How to use lime for soil stabilization
Lime stabilization is not difficult to carry out. After proper mix design and testing is
performed, in-place mixing is usually used to add the appropriate amount of lime to
soil, mixed to an appropriate depth. Pulverization and mixing is used to thoroughly
combine the lime and soil. For heavy clays, preliminary mixing may be followed by
24 to 48 hours (or more) of moist curing, followed by final mixing. For maximum
development of strength and durability, proper compaction is necessary. Correct
curing is also important. If sulfates are present at levels greater than 0.3 percent,
special procedures are required (Ibanez, 2007).
3.1.1.6 The mechanisms of lime treatment of soils
I. Improvement (quicklime addition only)
As equation 3.1 exhibits, once quicklime is mixed with the moisture bearing soil an
exothermic (heat producing) reaction takes place.
CaO + = Ca + 1140 kJ/kg CaO (3.1)
quicklime water hydrated lime heat produced
In a homogeneous mixture, the quicklime reacts with the moisture present in the soil.
This exothermic reaction generates significant amounts of heat energy which will dry
the soil (temperatures can reach in excess of 100ºC) as well as chemically binding
32% of its own weight of water as hydroxide.

19
II. Modification (quicklime or hydrated lime / liquid lime addition)
The next steps, Modification and Stabilisation only occur with clay soils. When
quicklime or hydrated lime is added to a clay soil, the clay platelets go through an
ion exchange process, which introduces calcium into the clay surface and causes a
change in the way the clay platelets align, as shown in the pictures below. This gives
an increase in soil strength and will normally occur quite rapidly (usually within two
hours of mixing but can take up to a day depending on site conditions).
III. Stabilization (quicklime or hydrated lime / liquid lime addition)
The silica and alumina contents of the clay soil will react with the calcium present in
the lime to form calcium silicate hydrates or calcium aluminate hydrates. This
reaction is slow to proceed and is similar to the reactions that occur when cement
cures. The strength gain can continue for over 10 years (Ibanez, 2007).
3.1.2 Portland cement stabilization
Since 1915, more than 100,000 miles of equivalent 7.5 m (24 ft) wide pavement
bases has been constructed from cement-stabilized soils. Cement has been found to
be effective in stabilizing a wide variety of soils, including granular materials, silts,
and clays; byproducts such as slag and fly ash; and waste materials such as
pulverized bituminous pavements and crushed concrete. These materials are used in
pavement base, subbase, and subgrade construction. Definitions and Applications
Cement-stabilized materials generally fall into two classes—soil-cement and cement-
modified soil.
Soil-cement is a mixture of pulverized soil material and/or aggregates, measured
amounts of portland cement, and water that is compacted to a high density. Enough
cement is added to produce a hardened material with the strength and durability
necessary to serve as the primary structural base layer in a flexible pavement or as a
subbase for rigid pavements. Cement-treated aggregate base and recycled flexible
pavements are considered soil-cement products. Cement-modified soil is a soil or
aggregate material that has been treated with a relatively small proportion of portland
cement (less cement than is required to produce hardened soil-cement), with the

20
objective of altering undesirable properties of soils or other materials so they are
suiTable for use in construction. Cement-modified soil is typically used to improve
subgrade soils or to amend local aggregates for use as base in lieu of more costly
transported aggregates. Alternative terms include cement-treated or cement-
stabilized soil or subgrade. Figure 3.2 exhibit a practical scene of soil stabilization by
using Portland Cement (Bell, 2000).
Figure 3.2 : Soil stabilization by using portland cement(www.reichler.net).
3.1.2.1 Stabilization mechanisms by portland cement
Portland cement is composed of calcium-silicates and calcium-aluminates that, when
combined with water, hydrate to form the cementing compounds of calcium-
silicatehydrate and calcium-aluminate-hydrate, as well as excess calcium hydroxide.
Because of the cementitious material, as well as the calcium hydroxide (lime)
formed, portland cement may be successful in stabilizing both granular and fine-
grained soils, as well as aggregates and miscellaneous materials. A pozzolanic
reaction between the calcium hydroxide released during hydration and soil alumina
and soil silica occurs in fine-grained clay soils and is an important aspect of the

21
stabilization of these soils. The permeability of cementstabilized material is greatly
reduced. The result is a moisture-resistant material that is highly durable and resistant
to leaching over the long term (Rawas and Goosen, 2006).
3.1.2.2 Mix design considerations of portland cement
Mix design requirements vary depending on the objective. Soil-cement bases
generally have more stringent requirements than cement-modified soil subgrades.
For soil-cement bases, two types of testing have typically been used—durability tests
and strength tests. The Portland Cement Association has developed requirements for
AASHTO soils A-1 to A-7 that make it possible to determine the durability of
cement on the basis of maximum weight losses under wet-dry (ASTM D559) and
freeze-thaw (ASTM D560) tests. Many state departments of transportation currently
require minimum unconfined compressive strength testing (ASTM D1633) in lieu of
these durability tests. This requirement is often based on many years of experience
with soil-cement. The advantage of using these strength tests is that they can be
conducted more rapidly than the durability tests (7 days vs. 1 month) and require less
laboratory equipment and technician training. However, achievement of a specified
strength does not always ensure durability. Typical minimum strength varies from
200 to 750 pounds per square inch. For cement-modified soils, the engineer selects
an objective and defines the cement requirements accordingly. Objectives may
include one or more of the following: reducing the plasticity index (Atterberg limits,
ASTM D4318); increasing the shrinkage limit; reducing the volume change of the
soil (AASHTO T116); reducing clay/silt-sized particles (hydrometer analysis);
meeting strength values/indexes such as the California Bearing Ratio (ASTM
D1883) or triaxial test (ASTM D2850); and improving resilient modulus (ASTM
D2434). Cement has been incorporated successfully into soils in the field with
plasticity indexes ranging as high as 50 (Kowalski and Starry, 2007).
3.1.2.3 Construction considerations
Construction of soil-cement and cement-modified soil is normally a fast,
straightforward process. Cement can be incorporated into soil/aggregate in a number
of ways. The most common method is to spread dry cement in measured amounts on
22
a prepared soil/aggregate and blend it in with a transverse single-shaft mixer to a
specified depth. Cement slurries—in which water and cement are combined in a
50/50 blend with a slurry-jet mixer or in a water truck with a recirculation pump—
have been used successfully to reduce dusting and improve mixing with heavy clays.
Sometimes, central mixing plants are employed. Twin shaft continuous-flow pug
mills are most common, although rotary-drum mixers have been used as well.
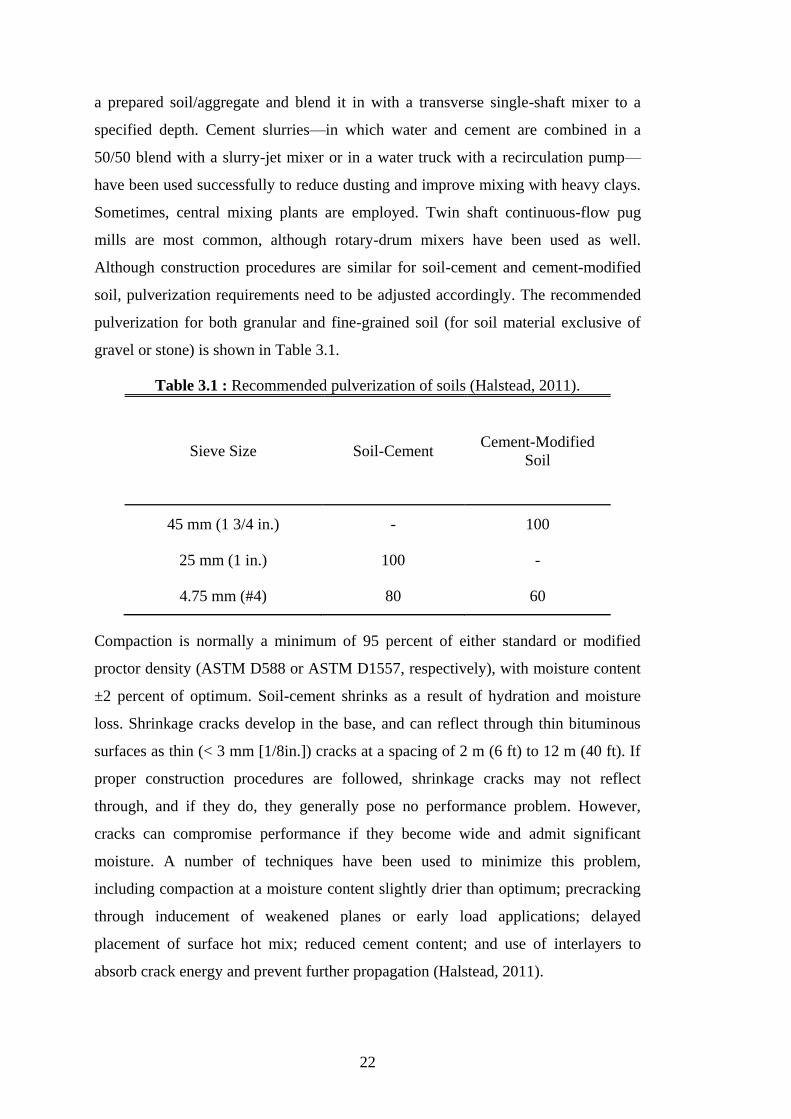
Although construction procedures are similar for soil-cement and cement-modified
soil, pulverization requirements need to be adjusted accordingly. The recommended
pulverization for both granular and fine-grained soil (for soil material exclusive of
gravel or stone) is shown in Table 3.1.
Table 3.1 : Recommended pulverization of soils (Halstead, 2011).
Sieve Size Soil-Cement Cement-Modified
Soil
45 mm (1 3/4 in.) - 100
25 mm (1 in.) 100 -
4.75 mm (#4) 80 60
Compaction is normally a minimum of 95 percent of either standard or modified
proctor density (ASTM D588 or ASTM D1557, respectively), with moisture content
±2 percent of optimum. Soil-cement shrinks as a result of hydration and moisture
loss. Shrinkage cracks develop in the base, and can reflect through thin bituminous
surfaces as thin (< 3 mm [1/8in.]) cracks at a spacing of 2 m (6 ft) to 12 m (40 ft). If
proper construction procedures are followed, shrinkage cracks may not reflect
through, and if they do, they generally pose no performance problem. However,
cracks can compromise performance if they become wide and admit significant
moisture. A number of techniques have been used to minimize this problem,
including compaction at a moisture content slightly drier than optimum; precracking
through inducement of weakened planes or early load applications; delayed
placement of surface hot mix; reduced cement content; and use of interlayers to
absorb crack energy and prevent further propagation (Halstead, 2011).

23
3.1.3 Fly ash stabilization
Stabilization of soils and pavement bases with coal fly ash is an increasingly popular
option for design engineers. Fly ash stabilization is used to modify the engineering
properties of locally available materials and produce a structurally sound
construction base. Both non-self-cementing and self-cementing coal ash can be used
in stabilization applications. Figure 3.3 shows using fly ash in order to stabilization
of clayey soil (Şenol et al, 2003).
Figure 3.3 : Soil stabilization by using fly ash(www.ashgroveresources.com).
3.1.3.1 Identification
Fly ash is one of the residues generated in the combustion of coal. Fly ash is
generally captured from the chimneys of coal-fired power plants, and is one of two
types of ash that jointly are known as coal ash; the other, bottom ash, is removed
from the bottom of coal furnaces. Depending upon the source and makeup of the coal
being burned, the components of fly ash vary considerably, but all fly ash includes
substantial amount of silicon dioxide (SiO2) (both amorphous and crystalline) and
calcium oxide (CaO). Toxic constitutes include arsenic, beryllium, boron, cadmium,
chromium, thallium VI, cobalt, lead, manganese, mercury, molybdenum, selenium,
strontium, thallium, and vanadium, along with dioxins compounds. In the past,fly ash
was generally released into the atmosphere, but pollution control equipment

24
mandated in recent decades now requires that it be captured prior to release. In
addition to economic and ecological benefits, the use of fly ash in concrete improves
its workability, reduces segregation, bleeding, heat evolution and permeability,
inhibits alkali-aggregate reaction, and enhances sulfate resistance. Even though the
use of fly ash in concrete has increased in the last 20 years, less than 20% of the fly
ash collected was used in the cement and concrete industries (Helmuth 1987).
3.1.3.2 Classifications and specifications of fly ash
Two major classes of fly ash are specified in ASTM C 618 on the basis of their
chemical composition resulting from the type of coal burned; these are designated
Class F and Class C. Class F is fly ash normally produced from burning anthracite or
bituminous coal, and Class C is normally produced from the burning of
subbituminous coal and lignite (as are found in some of the western states of the
United States). Figures 3.4 and 3.5 illustrate class C and F of fly ash. Class C fly ash
usually has cementitious properties in addition to pozzolanic properties due to free
lime, whereas Class F is rarely cementitious when mixed with water alone. All fly
ashes used in the United States before 1975 were Class F (Adams, 1988).
Fly ash which is produced at base loaded electric generating plants is usually very
uniform. Base loaded plants are those plants which operate continuously. The only
exception to uniformity is in the start-up and the shut-down of these plants.
Contamination may occur from using other fuels to start the plant, and
inconsistencies in carbon content occur until the plant reaches full operating
efficiency. The ash produced from the start-up and shut-down must be separated
from what is produced when the plant is running efficiently. In addition, when
sources of coal are changed, it is necessary to separate the two types of fly ashes.
Peak load plants are subjected to many start-up and shut-down cycles. Because of
this, these plants may not produce much uniform fly ash.
The most-often-used specifications for fly ash are ASTM C 618 and AASHTO M
295. While some differences exist, these two specifications are essentially
equivalent. Some state transportation agencies have specifications that differ from
the standards (Admixtures and Ground Slag 1990). The general classification of fly

25
ash by the type of coal burned does not adequately define the type of behavior to be
expected when the materials are used in concrete.
There are also wide differences in characteristics within each class. Despite the
reference in ASTM C 618 to the classes of coal from which Class F and Class C fly
ashes are derived, there was no requirement that a given class of fly ash must come
from a specific type of coal. For example, Class F ash can be produced from coals
that are not bituminous. and bituminous coals can produce ash that is not Class F. It
should be noted that current standards contain numerous physical and chemical
requirements that do not serve a useful purpose. Whereas some requirements are
needed for ensuring batch-to-batch uniformity, many are unnecessary (Halstead,
2011).
Figure 3.4 : Class C fly ash.
Figure 3.5: Class F fly ash.
26
3.1.3.3 Restraints on the use of fly ash in highway constructions
It is well known now that both classes of fly ash improve the properties of concrete,
but several factors and cautions should be considered when using fly ashes especially
in highway construction, where fly ash is heavily used. In a report prepared by the
Virginia Highway and Transportation Research Council (VHTRC) and summarized
by Halstead (1986), several restraints relating to the use of fly ash concrete for
construction of highways and other highway structures were discussed. These
restraints include the following: 1) special precautions may be necessary to ensure
that the proper amount of entrained air is present; 2) not all fly ashes have sufficient
pozzolanic activity to provide good results in concrete; 3) suitable fly ashes are not
always available near the construction site, and transportation costs may nullify any
cost advantage; and 4) mix proportions might have to be modified for any chance in
the fly ash composition.Since the cement-fly ash reaction is influenced by the
properties of the cement, it is important for a transportation agency not only to test
and approve each fly ash source but also to investigate the properties of the specific
fly ash-cement combination to be used for each project (Halstead, 1986).
3.2 Safety Considerations of Cementitious Stabilization
Lime is an alkaline material that is reactive in the presence of moisture. These soil
applications can cause drift of dusts containing lime, fly ash or cement dusts over a
short distance. The chemical reaction between the soil, water and stabilizing
material creates heat. Steam is often seen rising form the ground as the water in the
soil evaporates. Workers must protect themselves from skin exposure to chemical
and thermal buns. Burns can occur when mixed soil is trapped next to the skin, in a
boot, glove, or tight fitting cloths, for a prolonged period of time. In many cases, this
can cause second and third degree burns while causing little or no discomfort.
Personal protection should be properly worn when employees are required to be in
close contact with mixed soil within the first 24 to 48 hours of mixing. Following are
the considerations that should not be neglected during stabilization processes:
To prevent large dust clouds Western Stabilization uses a closed system to
transfer bulk products from the pneumatic trailers to the spreader. Filter bags
on the spreader trap dusts generated during bulk transfer. Wind screens also

27
cover the point of delivery to prevent drift as the material is placed onto the
ground. Water trucks connected to the mixer add water during mixing to
control dusts and improve the efficiency of the reaction with the soil. The
mixing drum is also enclosed by a curtain which is lowered to the ground as
the rotor is mixing the soil. While these efforts greatly reduce unintended
drift, all workers must stay clear of the soil stabilizing operations and
equipment.
Workers must be aware of their surroundings and take actions to prevent
unintended exposures. Soil stabilizing products react with water and workers
need to protect their skin and eyes from contact with unreacted materials.
Be aware and stay clear of drift and do not breathe dusts or touch raw
materials on the ground. Wash skin with soap and water should it come into
contact with lime, fly ash, cement or bentonite.
If inhaled, remove person to fresh air and Irrigate the nose and throat with
water if necessary.
Impervious coveralls pulled down over the top of boots should be worn to
prevent penetration of liquids. When conditions are wet and the mud is deep,
the coveralls should be tapped in place to prevent them from pulling up and
expositing the tops of the boots. Sleeves of the coveralls may also need to be
tapped to prevent them from pulling up and exposing clothing or skin.
The use of barrier creams is recommended to prevent exposure to the arms,
hands, neck and face.
Tight fitting goggles should be worn to protect the eyes form dusts and
liquids, when it is necessary to work in conditions where employees can be
exposed to wet soils, raw lime, fly ash, cement or bentonite or mixed soils
where the chemical reaction is continuing to occur.
Impervious Gloves should be worn to prevent contact with the skin. In wet
and muddy conditions, the gloves may need to be tapped to prevent any
moisture form getting in the top of the gloves. In some wet and muddy

28
conditions, gloves with long gauntlets may be needed to protect the forearm,
and clothing.
High top work boots impervious to liquids.
NIOSH approved respirators, rated to control silica exposure, and should be
used when necessary.
Confined spaces should be well ventilated and the atmosphere tested before
any employee is allowed to enter.
In the event of eye contact, immediately flush the eye(s) with ample water.
Continue flushing for 20 minutes and seek medical assistance.
Burns should be treated by a physician (Transportation Research Board
(TRB), 1987).
3.3 Soil Stabilization Using Shredded Waste Tires (Scrap Tire
rubber)Stabilization
For a long time, numerous industrial and public initiatives have been launched in
order to make knowledge, practices and mentalities evolve in the relation to the
acceptability of using the waste instead of a raw material as the construction product.
The objectives of the initiatives have been to evaluate current practices and to make
new solutions and beneficial use channels emerge. At the same time, scientific and
standardization communities have developed methodologies and tools to fit with the
assessment needs. Waste tires have been a disposal problem in the past and are
continuing to accumulate throughout the world today. Waste tire stockpiles constitute
environmental and health hazards by producing air pollution from tire stockpile fires
and breeding grounds for potential disease carrying mosquitoes and vermin. Under
recent environmental legislation that encourages the reuse or recycling of waste
products, the use of discarded tires has been increasing. The most desirable approach
to reduce waste tire stockpiles is to recover the resource by recycling. Using
shredded waste tires as a lightweight fill material for road construction has proven to
be another beneficial use of this waste product. Shredded tires were proven to be a
viable form of lightweight fill because they are relatively lightweight, inexpensive,

29
and non-biodegradable. In general, the material is very elastic, very porous, contains
good vibration damping properties, and is easily compacted (Erol, 2008).
3.3.1 Advantages of shredded tires
Shredded tires exhibit many advantages as a lightweight fill material. To begin with,
shredded tires are non-biodegradable either above or below the water line under
normal conditions. This provides for a sTable road base for a longer time period than
some other lightweight fill materials. Wood products like sawdust, bark, and wood
chips tend to biodegrade over time if not completely submerged. In addition,
shredded tires weigh only 20 - 40 pounds per cubic foot (320 - 640 kg per cubic
meter). Because of their low density, tire shreds can be used to build roads over
unsTable soils. They are also easily transported and placed on the job site and display
excellent porosity features. This is important for proper drainage of highway base
grades. Given current rates of use, the existing stockpiles of waste tires will not be
depleted any time soon. This supply should help to keep the material costs down for
some time. Additionally, using shredded tires as fill material will help to free up
other valuable road building resources, namely sand and gravel for other use. From
an economic viewpoint, tire shreds present even more advantages. First of all,
shredded tires are relatively inexpensive. In addition, the use of shredded tires may
also help complete a job faster and therefore save more money. For example,
construction projects utilizing surcharging methods often have waiting periods of
four to twelve months for the surcharge materials to settle and compress the unsTable
soils. Under similar conditions, lightweight fill designs do not generally require a
waiting period. This may also reduce the time and inconvenience associated with
staged construction projects (Bosscher et al, 1997).
3.3.2 Disadvantages of shredded tires
While shredded tires appear to be an excellent choice for a lightweight fill material,
they do have some drawbacks. First, because the use of shredded tires as a
lightweight fill material is a fairly new concept, there is a definite lack of information
concerning their use and very limited design standards are available. Recent projects
have used trial and error methods for determining the amount and depth of shredded
tires to use. One report does not recommend shredded tires for use under hard

30
surfaced pavements unless a substantial overburden thickness is used, 1.5 m (5 foot)
minimum.
Second, waste tires do require some preparation before they can be used as a road
building material. The tires must be cleaned so that they are free from oils and grease
in order to avoid soil and groundwater contamination. In addition, the Minnesota
Pollution ,Control Agency (MPCA) has shown that tire shreds may leach out heavy
metals when subject to highly acidic solutions with a pH of 3.5. These conditions are
unlikely to be found in most peat bogs, locations where lightweight fill materials are
most useful. However, testing should be completed on a site-by-site basis if any
doubt exists.
Finally, to the general public it may appear that using shredded tires for fill material
is just another way of burying waste. The public may oppose projects using waste
tires even if projects are deemed environmentally safe. Overall, more research must
be conducted on the engineering and environmental aspects of this material in order
for it to have an impact as an alternative construction material (BOSSCHER et al,
1997).
3.3.3 Engineering properties of shredded tires
Shredded waste tires have many beneficial engineering properties as a lightweight
fill material. To begin with, compacted shredded tire material is more porous than a
washed gravel. CalTrans conducted a constant head permeability test on two types of
shredded tires and the permeability coefficients were on the order of 10,000 ft/day
(3,000 m/day). When used in the road base or subbase, shredded tires will improve
drainage below the pavement and therefore should extend the life of the roadway.
Additionally, tire shreds are very elastic. This property enables the tire material to
better distribute the roadway loads over unsTable soils. However, the same elastic
properties can lead to higher than normal deflections. Shredded tires also possess
vibration1 damping properties, a benefit in situations where vibratory compaction is
hazardous to the surroundings. Furthermore, shredded tires are easily compacted1
and consolidated. Their angular shape and excellent friction characteristics allow the
individual tire shreds to lock together very well. Lastly, shredded tires have bulk
densities comparable to wood chips, approximately 20 pounds per cubic foot (320 kg

31
per cubic meter). Compacted densities are about 40 pcf (640 kg per cubic meter).
Although there are no widely accepted design standards for shredded tires,
construction contracts have produced some similar specifications for tire shreds as a
lightweight fill material. First of all, the size of the tire shreds is always specified.
Different shredding processes can produce shredded tires with highly varying
characteristics. The source of the tires i.e., automobile, truck, tractor, etc. may also
complicate the situation. A maximum size shred or chip along with a specification
for percent passing a certain size screen is usually given. For example, 80% of the
material (by weight) shall pass a 6 inch (15 cm) screen. Additionally, it is usually
stated that the tire chips shall be free of oil, grease, or any other contaminants that
may leach into the soil or ground water. If any metal fragments are present in the tire
shreds, they must be firmly attached and 98% embedded to the material. No metal
fragments are to be allowed in the fill material unless they are embedded within the
tire shreds. Specifications also frequently state that all shredded tire pieces shall have
at least one sidewall severed from the face of the tire. Finally, the weight (by truck
measure) of the shredded tire material is normally specified.
3.4 Soil Reinforcement Using Natural and Syntheitc Fibers
Soil can often be regarded as a combination of four basic types: gravel, sand, clay,
and silt. It generally has low tensile and shear strength and its characteristics may
depend strongly on the environmental conditions (e.g. dry versus wet). On the other
hand, reinforcement consists of incorporating certain materials with some desired
properties within other material which lack those properties. Therefore, soil
reinforcement is defined as a technique to improve the engineering characteristics of
soil in order to develop the parameters such as shear strength, compressibility,
density; and hydraulic conductivity.. Mainly, reinforced soil is a composite material
consisting of alternating layers of compacted backfill and man-made reinforcing
material. So, the primary purpose of reinforcing soil mass is to improve its stability,
to increase its bearing capacity, and to reduce settlements and lateral deformation.
The standard fiber-reinforced soil is defined as a soil mass that contains randomly
distributed, discrete elements, i.e. fibers, which provide an improvement in the
mechanical behavior of the soil composite. Fiber reinforced soil behaves as a
composite material in which fibers of relatively high tensile strength are embedded in

32
a matrix of soil. Shear stresses in the soil mobilize tensile resistance in the fibers,
which in turn imparts greater strength to the soil. Mainly, the use of random discrete
flexible fibers mimics the behavior of plant roots and contributes to the stability of
soil mass by adding strength to the near-surface soils in which the effective stress is
low. In this way, laboratory and some in situ pilot test results have led to encouraging
conclusions proving the potential use of fibers for the reinforcement of soil mass
providing an artificial replication of the effects of vegetation (Abtahi et al, 2009).
3.4.1 Classification
A comprehensive literature review shows that short fiber soil composite can be
considered as a coin with two sides. One side includes the randomly direct inclusion
of fibers into the matrix, i.e. soil mass. Another side comprises the oriented fibrous
materials, e.g. Geo-Synthetics family. It is emphasized that the former concept is not
as well-known as the second, not only in optimizing fiber properties, fiber diameter,
length, surface texture, etc., but also in reinforcing mechanism. McGown (1978)
classified soil reinforcement into two major categories including ideally inextensible
versus ideally extensible inclusions. The former includes high modulus metal strips
that strengthens soil and inhibits both internal and boundary deformations.
Catastrophic failure and collapse of soil can occur if reinforcement breaks. Ideally
extensible inclusions include relatively low modulus natural and/or synthetic fibers,
plant roots; and geosynthetics. They provide some strengthening but more
importantly they present greater extensibility (ductility); and smaller loss of post-
peak strength compared to the neat soil (Savastano et al, 2000).
3.4.2 Natural fibers
At the present time, there is a greater awareness that landfills are filling up, resources
are being used up, the planet is being polluted and that non-renewable resources will
not last forever. So, there is a need to more environmentally friendly materials. That
is why there have been many experimental investigations and a great deal of interest
has been created worldwide on potential applications of natural fibers for soil
reinforcement in recent years. The term ‘‘eco-composite’’ shows the importance role
of natural fibers in the modern industry. Mainly, what part of the plant the fiber came
from, the age of the plant; and how the fiber was isolated, are some of the factors

33
which affect the performance of natural fibers in a natural fiber reinforced soil. It is
necessary to mention that natural fibers have been used for a long time in many
developing countries in cement composites and earth blocks because of their
availability and low cost (Li, 2005).
3.4.2.1 Coconut (coir) fibers
The outer covering of fibrous material of a matured coconut, termed coconut husk, is
the reject of coconut fruit. The fibers are normally 50–350 mmlong and consist
mainly of lignin, tannin, cellulose, pectin and other water soluble substances.
However, due to its high lignin content, coir degradation takes place much more
slowly than in other natural fibers. So, the fiber is also very long lasting, with infield
service life of 4–10 years. The water absorption of that is about 130–180% and
diameter is about 0.1–0.6 mm. Coir retains much of its tensile strength when wet. It
has low tenacity but the elongation is much higher. The degradation of coir depends
on the medium of embedment, the climatic conditions and is found to retain 80% of
its tensile strength after 6 months of embedment in clay. Coir geo-textiles are
presently available with wide ranges of properties which can be
economieconomically utilized for temporary reinforcement purposes. Mainly, coir
fiber shows better resilient response against synthetic fibers by higher coefficient of
friction. For instance, findings show that coir fiber exhibits greater enhancements
(47.50%) in resilient modulus or strength of the soil than the synthetic one (40.0%).
Viswanadham (1989) have reported about the efficacy of randomly distributed coir
fibers in reducing the swelling tendency of the soil. Ravishankar and Raghavan
confirmed that for coir-stabilized lateritic soils, the maximum dry density (MDD) of
the soil decreases with addition of coir and the value of optimum moisture content
(OMC) of the soil increases with an increase in percentage of coir. The compressive
strength of the composite soil increases up to 1% of coir content and further increase
in coir quantity results in the reduction of the values. The percentage of water
absorption increases with an increase in the percentage of coir. Tensile strength of
coir-reinforced soil (oven dry samples) increases with an increase in the percentage
of coir. Khedari et al. introduced a new type of soil–cement block reinforced with
coir fibers with low thermal conductivity. Black cotton soil treated with 4% lime and
reinforced with coir fiber shows ductility behavior before and after failure. An

34
optimum fiber content of 1% (by weight) with aspect ratio of 20 for fiber was
recommended for strengthening the BC soil (Babu et al, 2008).
3.4.2.2 Sisal fibers
Sisal is a lingo-cellulosed fiber in which its traditional use is as a reinforcement for
gypsum plaster sheets in building industry with 60–70% of water absorption and
diameter about 0.06–0.4 mm. Sisal fibers are extracted from the leaves of the plants,
which vary in size, between 6–10 cm in width and 50–250 cm in length. In general,
Brazil, Indonesia and East African countries are the world’s main producers of sisal
fibers. Ghavami et al. found that inclusion of 4% sisal, or coconut fiber, imparted
considerable ductility and slightly increased the compressive strength. It was also
found that introduction of bitumen emulsion did not improve the bonding between
the soil and fibers; but did significantly improve soil durability. Prabakar and
Siridihar used 0.25%, 0.5%, 0.75% and 1% of sisal fibers by weight of raw soil with
four different lengths of 10, 15, 20 and 25 mm to reinforce a local problematic soil.
They concluded that sisal fibers reduce the dry density of the soil. The increase in the
fiber length and fiber content also reduces the dry density of the soil. As well, it was
found that the shear stress is increased non-linearly with increase in length of fiber
up to 20 mm and beyond, where an increase in length reduces the shear stress. The
percentage of fiber content also improves the shear strength. But, beyond 0.75% fiber
content, the shear stress reduces with increase in fiber content. Sisal fiber reinforced
soils stabilized with cement were used as a building material by Mattone (2005).
3.4.2.3 Palm fibers
The palm fibers in date production have filament textures with special properties
such as low costs, plenitude in the region, durability, lightweight, tension capacity
and relative strength against deterioration. Fibers extracted from decomposed palm
trees are found to be brittle, having low tensile strength and modulus of elasticity and
very high water absorption. Unconfined compression strength (UCS), California
Bearing Ratio (CBR) and compaction tests were performed on neat and palm fiber
reinforced soil samples by Marandi et al. They reported that at a constant palm fiber
length, with increase in fiber inclusion (from 0% to 1%), the maximum and residual
strengths were increased, while the difference between the residual and maximum

35
strengths. was decreased. A similar trend was observed for constant palm fiber
inclusion and increase in palm fiber length (from 20 mm to 40 mm). Jamellodin et al.
found that a significant improvement in the failure deviator stress and shear strength
parameters (C and U) of the soft soil reinforced with palm fibers can be achieved. It
is observed that the fibers act to interlock particles and group of particles in a unitary
coherent matrix thus the strength properties of the soil can be increased. Ahmad et al.
(2010) mixed palm fibers with silty sand soil to investigate the increase of shear
strength during triaxial compression. The specimens were tested with 0.25% and
0.5% content of palm fibers of different lengths (i.e. 15 mm, 30 mm and 45 mm).
Reinforced silty sand containing 0.5% coated fibers of 30 mm length exhibited
approximately 25% increase in friction angle and 35% in cohesion compared to those
of unreinforced silty sand(Ahmad et al.2010).
3.4.2.4 Bamboo fibers
Bamboo fiber is a regenerated cellulose fiber. It is a common fact that bamboo can
thrive naturally without using any pesticide. The fiber is seldom eaten by pests or
infected by pathogens. So, scientists found that bamboo owns a unique anti-bacteria
and bacteriostatic bio-agent named ‘‘Bamboo Kun’’. It is important to know that the
root rhizomes of bamboo are excellent soil binders which can prevent erosion.
Bamboo fibers are remarkably strong in tension but have low modulus of elasticity
about 33–40 kN/mm2 and high water absorption about 40–45%. The tests undertaken
by Coutts showed that the bamboo fiber is a satisfactory fiber for incorporation into
the cement matrix. Therefore, Ramaswamy et al. studied the behavior of concrete
reinforced with bamboo fibers. The results show that these fibers can be used with
advantage in concrete in a manner similar to other fibers. It seems that the
combination of cement and the root rhizomes of bamboo open a new window for soil
reinforcement process (Khedari et al.2005).
3.4.2.5 Flax fibers
Flax is probably the oldest textile fiber known to mankind. It has been used for the
production of linen cloth since ancient times [68]. Flax is a slender, blue flowered
plant grown for its fibers and seeds in many parts of the world [59]. In an effort,
Segetin et al. (2007) improved the ductility of the soil–cement composite with the

36
addition of flax fibers. An enamel paint coating was applied to the fiber surface to
increase its interfacial bond strength with the soil. ‘‘Uku’’ is a low-cost flax fiber-
reinforced stabilized rammed earth walled housing system that has been recently
designed as a building material. In this way, a mobile flax machine is used enabling
the fast and mobile processing of flax leaves into flax fibers (Segetin et al., 2007).
3.4.3 Synthetic (man-made) fibers
3.4.3.1 Polyethylene (PE) fibers
The feasibility of reinforcing soil with polyethylene (PE) strips and/or fibers has
been also investigated to a limited extent. It has been reported that the presence of a
small fraction of high density PE (HDPE) fibers can increase the fracture energy of
the soil. Nowadays, GEOFIBERS, typically 2.5-5 cm long discrete PP and/or PE
fibrillated or tape strands, are mixed or blended into sand or clay soils. But, it is
important to know that some researchers have applied the term ‘‘Geofiber’’ for PP
fibers used in soil reinforcement. Sobhan and Mashand demonstrated the importance
of using toughness as a measure of performance. These studies showed that increases
in tensile strength with added HDPE strips were not realized but large increases in
toughness resulting from increased strain capacity was observed. With increasing
toughness, much of the expected performance benefits due to fiber inclusion are in
the post-peak load portion of the stress–strain behavior. Thus, as the fibers develop
tension, an improved stress–strain response is the result. However, improvements in
fatigue behavior were not noted. Kim et al. used PE waste fishing net (0%, 0.25%,
0.5%, 0.75%, and 1%) to reinforce lightweight soil derived from dredging process.
They found that the maximum increase in compressive strength was obtained for a
waste fishing net content of about 0.25%. Choudhary et al. reported that the addition
of reclaimed HDPE strips to local sand increases the CBR value and secant modulus.
The maximum improvement in CBR and secant modulus is obtained when the strip
content is 4% with the aspect ratio of 3, approximately three times that of an
unreinforced system. As well, base course thickness can be significantly reduced if
HDPE strip einforced sand is used as sub-grade material in pavement engineering.
As it can be seen environmental purposes are the main reason of using PE fibers
and/or strips in geotechnical engineering to landfill the waste PE-based materials
(Khedari et al.2005).

37
3.4.3.2 Nylon fibers
Kumar and Tabor (2006) studied the strength behavior of nylon fiber reinforced silty
clay with different degree of compaction. The study indicates that peak and residual
strength of the samples for 93% compaction are significantly more than the samples
compacted at the higher densities. Gosavi et al. reported that by mixing nylon fibers
and jute fibers, the CBR value of soil is enhanced by about 50% of that of
unreinforced soil, whereas coconut fiber increases the value by as high as 96%. The
optimum quantity of fiber to be mixed with soil is found to be 0.75% and any
addition of fiber beyond this quantity does not have any significant increase in the
CBR value. Murray et al. (2000) conducted a laboratory test program to evaluate the
properties of nylon carpet waste fiber reinforced sandy silt soil. As well, field trials
have showed that shredded carpet waste fibers (to 70 mm long) can be blended into
soil with conventional equipment. The availability of low cost fibers from carpet
waste could lead to wider use of fiber reinforced soil and more cost-effective
construction (Kumar and Tabor, 2006).
3.4.3.3 Steel fibers
Steel fiber reinforcements found in concrete structures are also used for the
reinforcement of soil–cement composites. In addition, steel fibers can improve the
soil strength but this improvement is not compared with the case of using other types
of fibers. However, Ghazavi and Roustaie recommended that in cold climates, where
soil is affected by freeze–thaw cycles, polypropylene fibers are preferable to steel
fibers. Since, polypropylene fibers possess smaller unit weight than steel fibers. In
other words, the former fibers decrease the sample volume increase more than steel
fibers (Segetin et al., 2007).
3.4.3.4 Polyvinyl alcohol (PVA) fibers
Polyvinyl alcohol (PVA) fiber is a synthetic fiber that has recently been used in
fiber-reinforced concrete, since its weather resistance, chemical resistance (especially
alkaline resistance), and tensile strength are superior to that of PP fiber. PVA fiber
has a significantly lower shrinkage from heat than nylon and/or polyester. It has a
specific gravity of 1.3 g/cm3, a good adhesive property to cement; and high anti-
alkali characteristics. For this reason, it is suiTable for using PVA fiber as a soil

38
reinforcing material. Therefore, the inclusion of PVA fiber seems to produce more
effective reinforcement in terms of strength and ductility when compared to other
fibers under the same cementation. Park et al. found that the addition of 1%
polyvinyl alcohol (PVA) fiber to 4% cemented sand resulted in a two times increase
in both the UCS and the axial strain at peak strength when compared to non-fiber-
reinforced specimen (Segetin et al., 2007).

39
4. DETERMINATION OF ENGINEERING PROPERTIES OF SOFT SOILS
FOR SHALLOW SOIL STABILIZATION
4.1 Materials Used in Laboratory Tests
An extensive laboratory investigation has been performed to investigate the use of
fly ash, polypropylene and copolymer and virgin homopolymerpolypropylene (VHP)
fibers to stabilize clayey soils. Various combinations of the soil with fly ash,
polypropylene, copolymer and VHP mixtures were prepared in the laboratory and
experiments were performed to evaluate the engineering properties of these mixtures.
4.1.1 High plasticity clay soil
As the first group of experiments aimed at stabilization, a clayey soil obtained from
Akpınar district of Istanbul, Turkey. In order to classify mentioned soil properly, we
must know its grain size distribution. The grain size of coarse-grained soil is
generally determined by means of sieve analysis. The sieve analysis determines the
gradation (the distribution of aggregate particles, by size, within a given sample)
in order to determine compliance with design and verification specifications.
The gradation data can be used to calculate relationships between various aggregate
or aggregate blends, to check compliance with such blends, and to predict trends
during production by plotting gradation curves graphically, to name just a few
uses. Used in conjunction with other tests, the sieve analysis is a powerful quality
control and quality acceptance tool. In order to do the sieve analysis, plain soil dried
in an oven regulated at 110 ± 5°C for 24 hours. Then, logical amount of soil chose
for the test. At the rest of the experiment, sample weighed and then sieved by a
suitable stack of sieves. It was poured into the top sieve which its opening was larger
than the greatest grain. Then, shaking process applied and continued until additional
shaking didn't produce any appreciable change in the amount of material retained in
each sieve. The contents of each sieve transferred to a separate dish and weighed
carefully as illustrated in Table 4.1.

40
For a fine-grained soil, the grain size distribution can be obtained by means of
hydrometer analysis. The hydrometer test uses Stokes equation (for the velocity of a
free falling sphere in suspension) to determine grain size distribution smaller than
#200 sieve. According to Stokes’ law, a sphere falling freely through a liquid of
infinite extent will accelerate rapidly to a certain maximum velocity and will
continue at that velocity as long as conditions remain the same. With respect to
hydrometer test, 50 gram of plain soil passed through #200 sieve added to 100-150
ml of dispersion agent. Sodium-hexameta-phosphate (NaPO3)6 was used to
deflocculates the fine-grained soil. The new mixture left for approximately 24 hours
to be dispersed. After mentioned time, distilled water was added to the soil-
dispersion suspension in 1000 cc graduated cylinder. Whole suspension was mixed
by air-blower in which it's nuzzle had been located at the bottom of suspension for
about 1-2 minute and distilled water added to increase the water level to 1000 ml.
Then, meniscus put slowly to the suspension in predetermined times and reading
results recorded. Table 4.2 exhibits the results of hydrometer analysis.
With respect to both sieve and hydrometer analysis, grain-size distribution curve of
plain soil obtained as it exhibited in Figure 4.1. According to the graph, plain soil
consists of 3% sand, 27% silt and 70% clay and all data summarized in Table 4.3.
Table 4.1 : Classification of high plasticity clay soil.
Gravel Sand Silt Clay
% 0 3 27 70
Since most of the plain soil consisted of fine grain soil, Atterberg limits should be
defined. Liquid limit determined by Casagrande test which a small slope is failing
while bumping a dish on to a rubber block. The water content corresponding to the
25 blows and therefore, liquid limit determined as 78%.

41
Figure 4.1 : Grain-size distribution of high plasticity clay soil.
The plastic limit of the soil is defined as the water content at which the soil begins to
crumble when rolled into a thread 3 mm in diameter, and plastic limit amount for our
sample soil was 28%. The plasticity index obtained equal to 50%. Atterberg limits
data are illustrated in Table 4.4.
Table 4.2 : Atterberg limits of high plasticity clay soil.
Liquid Limit Plastic Limit Plasticity index
LL (%) PL (%) PI (%)
78 28 50
With respect to Unified Soil Classification System (USCS) and all data reached from
experiments, this plain soil classify as CH (High plasticity clay soil).
0
10
20
30
40
50
60
70
80
90
100
0.001 0.010 0.100 1.000 10.000
Per
cen
t fi
ner
(%
)
Particle size (log) (mm)

42
4.1.2 Low plasticity clay soil
Second group of experiments aimed at stabilization, refers to low plasticity clay of
Şile district of Istanbul, Turkey. Sieve analysis and hydrometer analysis performed
on the same way as it explained in section 4.1.1. All data gathered and outcomes
illustrated in Figure 4.2, which exhibits grain-size distribution of low plasticity clay
soil (CL).
Figure 4.2 : Grain-size distribution of low Plasticity clay soil.
With respect to Figure 4.3 clayey soil consist of 0% of gravel, 2% of sand, 53% of
silt and 45% of clay. Table 4.5 shows the low plasticity clay soil’s classification.
Table 4.3 : Classification of low plasticity clay soil.
Gravel Sand Silt Clay
% 0 2 53 45
Liquid limit of mentioned clay soil determined using Cassagrande method, equal to
41% and plastic limit equal to 23%. Hence, by using plasticity index formula, the PI
0
10
20
30
40
50
60
70
80
90
100
0.001 0.010 0.100 1.000 10.000
Per
cen
t fi
ner
(%
)
Particle size (log) (mm)

43
of clay soil obtained as 18%. Atterberg limits of low plasticity clay soil are exhibited
in Table 4.6.
Table 4.4 : Atterberg limits of low plasticity clay soil.
Liquid Limit Plastic Limit Plasticity index
LL (%) PL (%) PI (%)
41 23 18
4.1.3 Fly ash
Fly ash as the first alternative material used in tests obtained from Çayırhan power
station located on 120 km of Ankara, Turkey. Table 4.7 demonstrates the percentages
of chemical characteristics of class C fly ash used in tests, while Table 4.8 shows the
physical properties of it.
Table 4.5 : Chemical properties of fly ash.
Parameter Value (%)
CaCO3 + MgCO3 1.25
H2O 0.20
SiO2 45.00
Al2O3 13.90
Fe2O3 8.26
CaO 15.11
MgO 6.68
SO3 4.26
Na2O 2.13
K2O 2.78
Cl 0.06
Loss on ignition 0.22
S.CaO 0.15
TOTAL 100%
Table 4.6 : Physical properties of fly ash.
Specific surface
(cm/gr)
Specific gravity
(gr/cm3)
Activity Index (%)
2100 2.34 83

44
Both sieve analysis and hydraulic analysis tests had done on the fly ash and the
results of them illustrated as the grain-size distribution curve in Figure 4.3.
\
Figure 4.3 : Grain-size distribution of fly ash.
4.1.4 Polypropylene fiber
Polypropylene fiber is made of 100% virgin materials consisting of a twisted
fibrillating network fiber, yielding a high-performance concrete reinforcement
system. Polypropylene fiber is used to reduce plastic and hardened concrete
shrinkage, improve impact strength, and increase fatigue resistance and concrete
toughness. Table 4.9 exhibits the physical properties of polypropylene.
Polypropylene is mainly used with performance concrete applications such as
industrial floors, bridge decks, shotcrete, loading docks and precast products –
anywhere that steel reinforcement reduction or replacement is the objective.
0
10
20
30
40
50
60
70
80
90
100
0.001 0.010 0.100 1.000 10.000
Per
cen
t fi
ner
(%
)
Particle size (log) (mm)

45
Table 4.7 : Physical properties of polypropylene.
Properties of Polypropylene Value
Color White
Form Fibrillated Fiber
Acid/Alkali Resistance Excellent
Specific Gravity 0.91
Absorption Nil
Tensile Strength 758
Length 54 mm
Compliance ASTM C-1116
Both twisted fibrillating network form and deformed form of polypropylene fibers
are demonstrated in Figure 4.4.
(a) Polypropylene fibers (b) Deformed polypropylene fibers
Figure 4.4 : Polypropylene fibers in (a) fibrillated form and (b) deformed form.
4.1.5 Copolymer fiber
Copolymer fiber is made of 100% virgin materials consisting of a twisted fibrillating
network fiber, yielding a high-performance concrete reinforcement system. This
extra heavy-duty fiber offers maximum long-term durability, structural

46
enhancements, and effective secondary/temperature crack control by incorporating a
truly unique synergistic fiber system of long length design. Table 4.10 demonstrates
the physical properties of copolymer.
Table 4.8 : Physical properties of copolymer.
Properties of copolymer Value
Color Gray
Form Monofilament Fiber
Acid/Alkali Resistance Excellent
Specific Gravity 0.91
Absorption Nil
Tensile Strength 758
Length 54 mm
Compliance ASTM C-1116
The objective of using copolymer is to inhibit plastic and settlement shrinkage
cracking prior to the initial set, and to reduce hardened concrete shrinkage cracking,
improve impact strength, and enhance concrete toughness and durability as an
alternate secondary/temperature/structural reinforcement. Both twisted monofilament
network form and deformed form of copolymer fibers are demonstrated in Figure
4.5.
(a) Copolymer fibers (b) Deformed copolymer fibers
Figure 4.5 : Copolymer fibers in (a) fibrillated form and (b) deformed form.
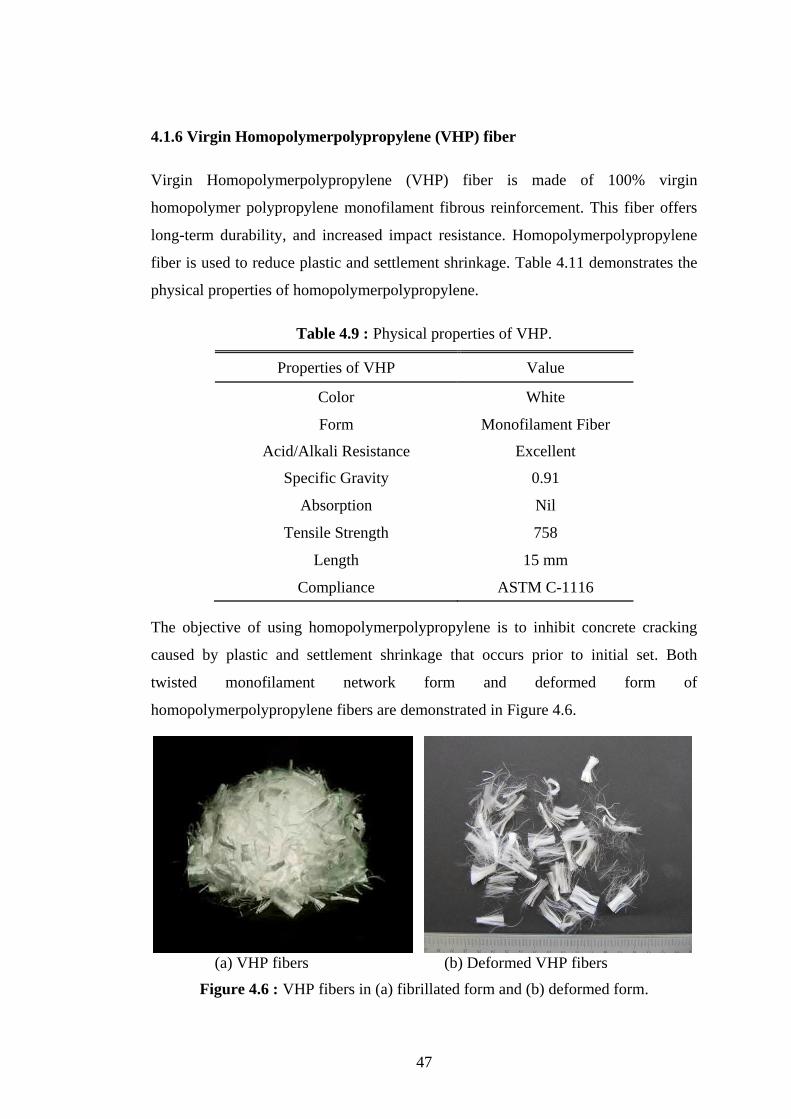
47
4.1.6 Virgin Homopolymerpolypropylene (VHP) fiber
Virgin Homopolymerpolypropylene (VHP) fiber is made of 100% virgin
homopolymer polypropylene monofilament fibrous reinforcement. This fiber offers
long-term durability, and increased impact resistance. Homopolymerpolypropylene
fiber is used to reduce plastic and settlement shrinkage. Table 4.11 demonstrates the
physical properties of homopolymerpolypropylene.
Table 4.9 : Physical properties of VHP.
Properties of VHP Value
Color White
Form Monofilament Fiber
Acid/Alkali Resistance Excellent
Specific Gravity 0.91
Absorption Nil
Tensile Strength 758
Length 15 mm
Compliance ASTM C-1116
The objective of using homopolymerpolypropylene is to inhibit concrete cracking
caused by plastic and settlement shrinkage that occurs prior to initial set. Both
twisted monofilament network form and deformed form of
homopolymerpolypropylene fibers are demonstrated in Figure 4.6.
(a) VHP fibers (b) Deformed VHP fibers
Figure 4.6 : VHP fibers in (a) fibrillated form and (b) deformed form.

48
4.2 Laboratory Tests
Laboratory tests done during 2010-2012 years in Istanbul Technical University’s
civil engineering faculty in the geotechnical engineering laboratory called Prof. Dr.
Hamdi Peynircioğlu laboratory. Both high plasticity clay soil (CH) and low plasticity
clay soil (CL) obtained from different parts of Istanbul, Turkey and the amount of
improvement of mentioned clayey soils measured by using compaction, unconfined
compression and CBR tests. Maximum dry unit weight and related optimum water
content of samples determined by using especially designed Harvard miniature
compaction apparatus. At least five cylindrical samples with different water contents
are subjected to unconfined compression test after seven days of curing. Under the
curing process, the unconfined compressive strength of fly ash or other materials
which result in cementitious stabilization increases with the increase of curing time.
Unconfined compressive strength of mixture increases rapidly along a straight line
before a certain curing time. Then, unconfined compressive strength increases slowly
and even stops. Fluctuation phenomena for the strength take place, too. During the
hardening period (curing time), the internal pressure stresses of stabilized materials
take place. During the hydration process, the compressive strength increases with the
development of hydrate. Its volume increases when the hydrate goes on. The volume
increasing causes internal pressure. Figure 4.7 shows the tendency line for
unconfined compressive strength increasing with time under curing (Li, et al., 2010).
With respect to Figure 4.7, it can be seen that slope of the curve decreases after seven
days of curing time. Because of field conditions and economical aspects of projects it
is expected that after seven days of curing at least 85% of final unconfined
compressive strength of the mixtures are being obtained. In order to keep the samples
on their natural water content during seven days of curing, desiccators were used.
Besides, after putting the samples in the desiccators, vacuum applied to desiccators
in order to preventing the loss of natural water content of samples. All the fibers used
during tests have high tensile strength and hence length of the fibers has direct
relation with the results of the unconfined compression test.

49
Figure 4.7 : Tendency line for unconfined compressive strength vs time under
curing (Li, et al., 2010).
According to the Figure 4.8 the unconfined compressive strength of the mixture
increases as the length of the fibers increases up to 15mm and then it decreases as the
length of the fibers increases up to 25% (Jiang, et al., 2010).
Figure 4.8 : Effect of fiber length on the unconfined compressive strength (Jiang, et
al., 2010).
Finally, according to cementitious stabilization aspect of fly ash, seven days of
curing chose and fibers decided to have 15mm length according to the Figure 4.8.
0
2
4
6
8
10
2 6 10 14 18 22 26 30 Un
con
fin
ed c
om
pre
ssio
n s
tren
gth
(Mp
a)
Time (Day)
0.20
0.22
0.24
0.26
0.28
0.30
0.32
0.34
0.36
0.38
0.40
8 10 12 14 16 18 20 22 24 26
Un
con
fin
ed c
om
pre
ssiv
e st
ren
gth
(Mp
a)
Fiber length (mm)
0.1%
0.2%
0.3%
0.4%

50
4.2.1 Harvard miniature compaction test
Compaction of soil comprises an important aspect of geotechnical investigation
involving fill applications. Preparation of compacted specimen in the laboratory is
essential to study the moisture-density and moisture strength relationships of soils
and their mixtures. Compaction characteristics of soil are usually determined by
conducting standard procter tests in the laboratory over the soil and the test results
are utilized in the field for different construction and also for ensuring the quality of
construction. However, the test is quite costly and time consuming. Further when
extent of construction is very large for example making sub-grade of roads of large
length, generally existing materials along the length widely varies due to depositional
reasons, and in such cases, number of compaction tests to be performed, becomes
very large, extremely time consuming and costly. In such cases if the estimation of
the moisture-density relationship could be developed on the basis of some test which
are quick to perform, less time consuming and cheap, then the process will help the
constructors enormously. Harvard Miniature compaction (Figure 4.9) was developed
by Wilson (1950) in order to perform less time consuming and cheap standard
proctor tests. The principal advantages of tests done by Harvard miniature
compaction apparatus are:
1) Only small amounts of soil are required (but must pass through No. 4 sieve)
2) One can obtain samples of dimensions suiTable for testing unconfined or triaxial
compression. These samples also may be suiTable for falling-head permeability tests
using triaxial apparatus.
The intent was to duplicate more closely field compaction using a sheep-foot roller
(Wilson, et al., 1950). Harvard miniature compaction apparatus consist of the parts
mentioned below:
• Hammer
• Hammer height fixer
• Mold
• Mold fixer
• Collar

51
Figure 4.9 : Modified harvard compaction apparatus.
In order to calibrate the harvard miniature compaction apparatus to apply as same
energy as standard compaction test, two different comparative tests done on high
plasticity clay soil. Results of the experiments illustrated in Figure 4.10.
a) Standard proctor compaction test ( wopt = % 27 ; γd max = 15.00 kN /m
3)
13
14
14
15
15
16
15 20 25 30 35 40
Dry
un
it w
eigh
t (
kN
/m³)
Water content (%)

52
b) Harvard miniature compaction test ( wopt = % 27; γd max = 15.00 kN /m
3)
Figure 4.10 : Comparison between standard proctor and harvard miniature
compaction tests.
According to Figure 4.10, we could obtain both maximum dry unit weight and
optimum water content in the harvard miniature compaction equipment equal to
standard proctor compaction equipment. In this test soil is compacted by a 720.7 gr
hammer falling a distance of 15 cm into a soil filled mold. The mold which has inner
diameter of 4.94 cm and height of 10cm (total volume of mold=191.56 cm3) is filled
with three equal layers of soil, and each layer is subjected to 27 drops of the hammer.
Table 4.12 exhibits a whole comparison between standard proctor, modified proctor
and harvard miniature compaction parameters.
In order to perform harvard miniature compaction test, first of all, we have to
pulverize the soil and run it through the # 4 sieve. Then, the weight of the soil sample
as well as the weight of the compaction mold (without the collar) would be
determined by using balance. After adding water in each step of experiment and then
mixing it thoroughly into the soil until the soil gets a uniform color, the compaction
apparatus assambled and soil would placed in the mold and compacted by means of
hammer. This procedure should continue to three steps and during the third step of
compaction, soil should completely fill the cylinder and must extend slightly above
13.0
13.5
14.0
14.5
15.0
15.5
20 25 30 35
Dry
un
it w
eigh
t (k
N /
m³)
Water content (%)

53
the collar joint. If the soil is below the collar joint at the completion of the drops, the
test point must be repeated. (Note: for the last layer, we have to watch carefully, and
add more soil after about 10 drops if it appears that the soil will be compacted below
the collar joint.) Then, the collar will be removed carefully and the compacted soil
would be trimmed off using the trowel. The compacted soil weighed while it’s in the
mold and the wet mass of the soil will be determined by subtracting the weight of the
mold. Remove the soil from the mold using a mechanical extruder and water content
of soil measured using remaining sample soils.
Table 4.10 : Comparison between standard, modified and harvard miniature
compaction tests.
Standard proctor
test
modified proctor
test
Harvard
compaction test
No. of blow per layer 25 56 27
No. of layers 3 5 3
Weight of hammer (gr) 2500 4500 720.7
Height (cm) 30.5 45.7 15
Volume (cm3) 944 2304 191
Energy (gr.cm/cm3) 6058.00 24992.19 6534.81
No. of blow per layer 25 56 27
No. of layers 3 5 3
4.2.2 Unconfined compression test
The primary purpose of this test is to determine the unconfined compressive strength,
which is then used to calculate the unconsolidated undrained shear strength of the
clay under unconfined conditions. According to the ASTM standard, the unconfined
compressive strength (qu) is defined as the compressive stress at which an
unconfined cylindrical specimen of soil will fail in a simple compression test. In
addition, in this test method, the unconfined compressive strength is taken as the

54
maximum load attained per unit area, or the load per unit area at 15% axial strain,
whichever occurs first during the performance of a test. For soils, the undrained shear
strength (Su) is necessary for the determination of the bearing capacity of
foundations, dams, etc (ASTM D2166). In order to perform unconfined compression
test, the soil which extruded from harvard miniature compaction test used as soil
sample for this test. Then, the exact diameter and length of the specimen measured at
three locations 120° apart. Average of the measurements recorded as the diameter
and length on the data sheet. In this test, the aspect ratio (L/d) of the soil specimen
should be approximately between 2 and 2.5, where L and d are the length and
diameter of soil specimen, respectively. Then, the specimen carefully placed in the
compression device. The device adjusted so that the upper plate just makes contact
with the specimen and the load and deformation dials set to zero. The load applied to
the sample so that the device produces an axial strain at a rate of 0.5% to 2.0% per
minute, and then the load and deformation dial readings recorded on the data sheet at
every 20 to 50 divisions on deformation the dial (Das, 1997). Figure 4.11 shows the
unconfined compression test apparatus used during tests.
Figure 4.11 : Unconfined compression test apparatus.

55
4.2.3 California bearing ratio test
The California bearing ratio (CBR) is a penetration test for evaluation of the
mechanical strength of road subgrades and base courses. It was developed by the
California Department of Transportation before World War II. The test is performed
by measuring the pressure required to penetrate a soil sample with a plunger of
standard area. The measured pressure is then divided by the pressure required to
achieve an equal penetration on a standard crushed rock material. The CBR test is
described in ASTM Standards D1883-05 (for laboratory-prepared samples) and
D4429 (for soils in place in field), and AASHTO T193. The results obtained by this
test are used with the empirical curves to determine the thickness of pavement and its
component layers (Drumm, et al., 1990). The CBR test shall be carried out on
material passing the 20 mm test sieve. With respect to the results of compaction tests,
soil samples prepared with their maximum dry unit weight and optimum water
content. The samples were compacted in a CBR mould in 3 layers by 56 blows. After
the compaction, the moulds and the soils were placed in the machine. During all
CBR tests the plunger set to penetrate to the bottom of the compacted soils. Then,
surcharge weights were placed on the soil samples. After adjusting the displacement
and mould measuring devices, motor switched to drive with a loading of 1mm/min.
The penetration process was continued until 8mm of penetration, and the load
amounts were recorded every 0.25mm of displacement. Finally, after removing the
samples from the moulds, for each experiment, two specimens from the top and
bottom of the samples were taken in order to determine the water content of the
sample soils. Figure 4.12 exhibits the CBR apparatus used during tests.
4.1 Evaluation of Laboratory Testing Data
Laboratory tests done during 20/07/2010-14/01/2012 in Istanbul Technical
University’s civil engineering faculty in the geotechnical engineering laboratory
called Prof. Dr. Hamdi Peynircioğlu laboratory. Initially, harvard miniature
compaction equipment calibrated in order to induce as same energy as standard
compaction equipment. After calibration, compaction and unconfined compression
and CBR tests performed on both high plasticity (CH) and low plasticity (CL) clay
soils. During mentioned tests, both type of clay soil blended with four different

56
materials and even different mixtures of them. Table 4.13 exhibits the alternative
materials used during tests and amount of them.
Figure 4.12 : California bearing ratio (CBR) test apparatus.
Table 4.11 : Alternative materials and amount of them.
No. Material 1 2 3 4 5
1 Fly ash 5% 10% 15% - -
2 Polypropylene 0.25% 0.5% 0.75% 1% -
3 Copolymer 0.5% 0.75% 1% 1.25% 1.5%
4 Homopolymerpolypropylene 0.25% 0.5% 0.75% 1% 1.5%
5
Fly ash 10% 10% 10% - -
Polypropylene 0.25% 0.5% 0.75% - -
6
Fly ash 10% 10% 10% - -
Copolymer 0.75% 1% 1.25% - -
7 Fly ash
10% 10% 10% - -
Homopolymerpolypropylene 0.25% 0.5% 0.75% - -
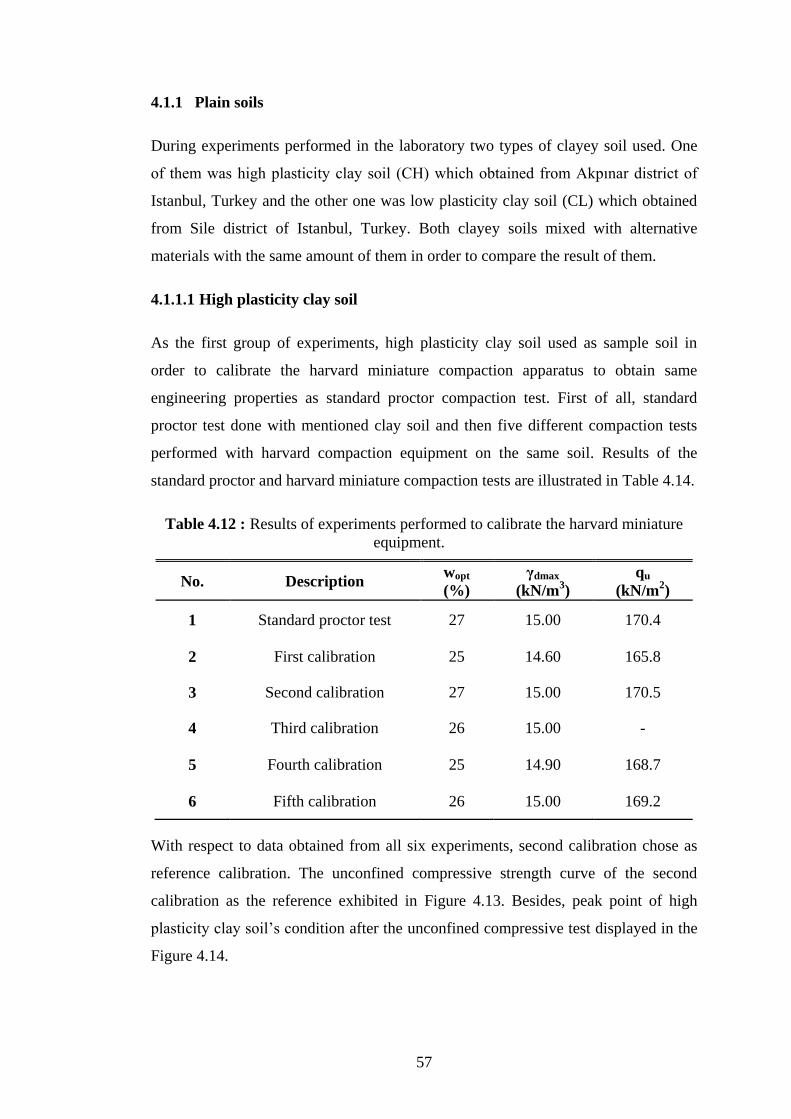
57
4.1.1 Plain soils
During experiments performed in the laboratory two types of clayey soil used. One
of them was high plasticity clay soil (CH) which obtained from Akpınar district of
Istanbul, Turkey and the other one was low plasticity clay soil (CL) which obtained
from Sile district of Istanbul, Turkey. Both clayey soils mixed with alternative
materials with the same amount of them in order to compare the result of them.
4.1.1.1 High plasticity clay soil
As the first group of experiments, high plasticity clay soil used as sample soil in
order to calibrate the harvard miniature compaction apparatus to obtain same
engineering properties as standard proctor compaction test. First of all, standard
proctor test done with mentioned clay soil and then five different compaction tests
performed with harvard compaction equipment on the same soil. Results of the
standard proctor and harvard miniature compaction tests are illustrated in Table 4.14.
Table 4.12 : Results of experiments performed to calibrate the harvard miniature
equipment.
No. Description wopt
(%)
γdmax
(kN/m3)
qu
(kN/m2)
1 Standard proctor test 27 15.00 170.4
2 First calibration 25 14.60 165.8
3 Second calibration 27 15.00 170.5
4 Third calibration 26 15.00 -
5 Fourth calibration 25 14.90 168.7
6 Fifth calibration 26 15.00 169.2
With respect to data obtained from all six experiments, second calibration chose as
reference calibration. The unconfined compressive strength curve of the second
calibration as the reference exhibited in Figure 4.13. Besides, peak point of high
plasticity clay soil’s condition after the unconfined compressive test displayed in the
Figure 4.14.

58
Figure 4.13 : Reference calibration’s unconfined compression test results.
Figure 4.14 : High plasticity clay soil’s peak point (w = % 27, qu =170.5 kN/m2).
4.1.1.2 Fly ash mixtures in high plasticity clay soil
In order to studying the effects of mixing fly ash with high plasticity clay soil, three
different amounts of fly ash added to the denominated soil. The amounts of fly ash
compared to the whole mixtures and optimum water contents, maximum dry unit
weights, maximum unconfined compressive strength and CBR percents of that
mixtures illustrated in Table 4.15.
0
20
40
60
80
100
120
140
160
180
200
15 20 25 30 35 40
Un
con
fin
ed c
om
pre
ssio
n s
tren
gth
(kN
/m²)
Water content (%)

59
Table 4.13 : Results of experiments executed with high plasticity clay soil and fly
ash.
No. Description wopt
(%)
γdmax
(kN/m3)
qu
(kN/m2)
CBR (%)
1 95% CH+5% Fly ash 24 15.60 475 17.36
2 90% CH+10% Fly ash 24 15.60 314 21.46
3 85% CH+15% Fly ash 25 15.50 326 18.03
Three different high plasticity clay soil-fly ash mixtures prepared in the laboratory
and each experiment’s unconfined compressive strength calculated as Figure 4.15.
After gathering all data and comparing them in a graph, it can be seen that in the
mixture with 10% of fly ash, the unconfined compressive strength of the mixture
increases up to 279%.
Figure 4.15 : Fly ash and high plasticity clay soil mixtures’ strength - water content
graph.
0
50
100
150
200
250
300
350
400
450
500
10 15 20 25 30 35 40
Un
con
fin
ed c
om
pre
ssio
n s
tren
gth
(k
N /
m²)
Water content (%)
Plain soil
5% Fly as
10% Fly ash
15% Flay ash

60
With respect to the results of unconfined compression test, it seems that by adding
fly ash up to 10% of total weight maximum unconfined compressive strength
increases significantly and reaches the maximum value at 10%. On the other hand, at
15% fly ash content, the increase in the unconfined compressive strength (qu) greatly
diminishes which could be even neglected.
After determination of optimum water content of mixtures, CBR samples prepared
with related optimum water content. The results of CBR experiment show same
behaviors as unconfined compression test. In another words, the CBR percent of
mixtures increase as amount of fly ash reach to 10% and make a peak at that value.
Then, as the amount of fly ash increase up to 15% the CBR percent decreases. The
results of CBR test demonstrated in Figure 4.16.
Figure 4.16 : Effect of adding fly ash with different amounts on CBR of CH.
4.1.1.3 Polypropylene mixtures in high plasticity clay soil
In order to studying the effects of mixing polypropylene with high plasticity clay
soil, first of all, five different amounts of polypropylene ( 0.25%, 0.50, 0.75%,1%
and 1.25%) added to the denominated soil. All the mixtures prepared and induced to
compaction and unconfined compression tests. Since the dry unit weight of
polypropylene is so less than clay, when we added 1.25% of polypropylene to 98.5%
0
5
10
15
20
25
0 5 10 15
CB
R (
%)
Fly ash content (%)

61
of clay the volume of the mentioned alternative material increased in a way that
when we reached to 24% of water content, the mixture still was not mixed enough
for the compaction test. Hence, we decided to neglect to continue our studies for
1.25% of polypropylene and further amounts.
The amounts of polypropylene added to the whole mixtures and optimum water
contents, maximum dry unit weights, maximum unconfined compressive strength
and CBR percent of that mixtures are illustrated in Table 4.16.
Table 4.14 : Results of experiments executed with high plasticity clay soil and
polypropylene.
No. Description wopt
(%)
γdmax
(kN/m3)
qu
(kN/m2)
CBR (%)
1 99.75% CH+
0.25% Polypropylene 26 14.60 255 15.7052
2 99. 5% CH+
0. 5% Polypropylene 25 14.50 275 16.9218
3 99.25% CH+
0.75% Polypropylene 25 14.50 317 19.0232
4 99% CH+
1% Polypropylene 26 14.60 315 19.355
Four different high plasticity clay soil-polypropylene mixtures prepared in the
laboratory and each experiment’s unconfined compressive strength calculated as
Figure 4.15. According to the data obtained from experiments, it is obvious that the
maximum unconfined compressive strength of mixtures reached when we mixed the
high plasticity clay soil with 0.75% of polypropylene which shows 186% of increase
compared to the plain soil.
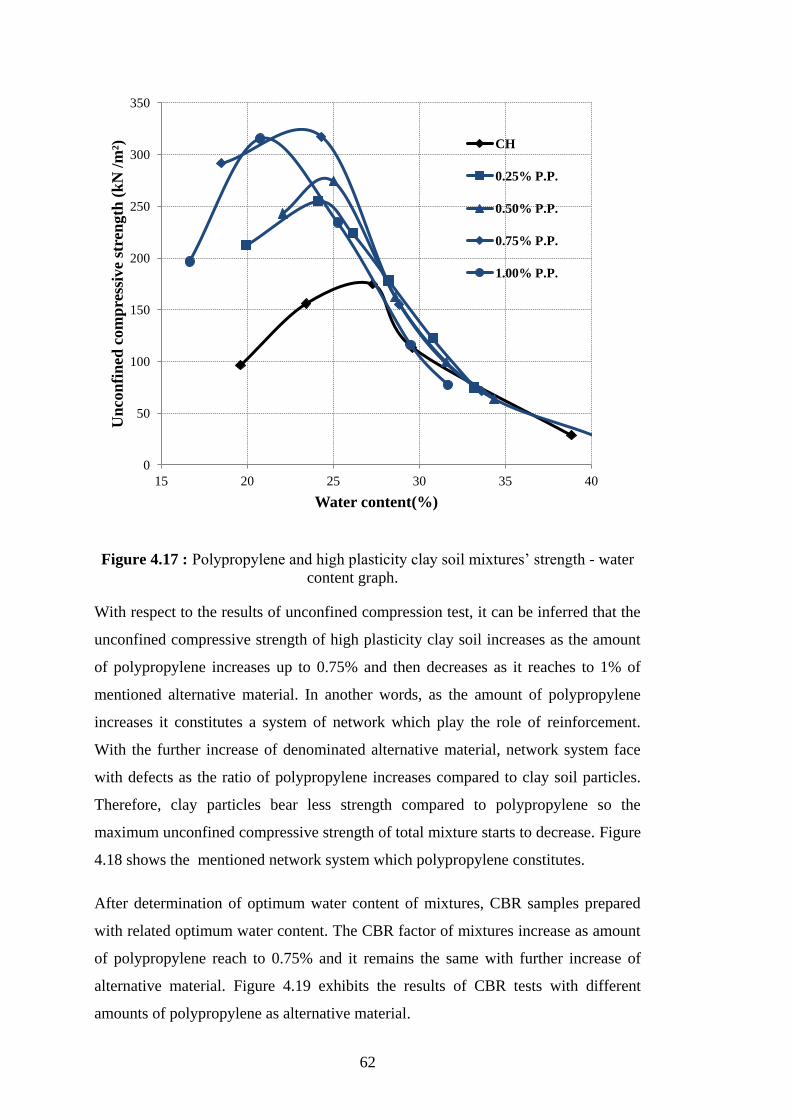
62
Figure 4.17 : Polypropylene and high plasticity clay soil mixtures’ strength - water
content graph.
With respect to the results of unconfined compression test, it can be inferred that the
unconfined compressive strength of high plasticity clay soil increases as the amount
of polypropylene increases up to 0.75% and then decreases as it reaches to 1% of
mentioned alternative material. In another words, as the amount of polypropylene
increases it constitutes a system of network which play the role of reinforcement.
With the further increase of denominated alternative material, network system face
with defects as the ratio of polypropylene increases compared to clay soil particles.
Therefore, clay particles bear less strength compared to polypropylene so the
maximum unconfined compressive strength of total mixture starts to decrease. Figure
4.18 shows the mentioned network system which polypropylene constitutes.
After determination of optimum water content of mixtures, CBR samples prepared
with related optimum water content. The CBR factor of mixtures increase as amount
of polypropylene reach to 0.75% and it remains the same with further increase of
alternative material. Figure 4.19 exhibits the results of CBR tests with different
amounts of polypropylene as alternative material.
0
50
100
150
200
250
300
350
15 20 25 30 35 40
Un
con
fin
ed c
om
pre
ssiv
e st
ren
gth
(k
N /
m²)
Water content(%)
CH
0.25% P.P.
0.50% P.P.
0.75% P.P.
1.00% P.P.

63
a) 0.25% PP + CH b) 0.75% PP + CH c) 1.00% PP + CH
Figure 4.18 : Reinforced high plasticity clay soil with different amounts of
polypropylene.
Figure 4.19 : Effect of adding polypropylene with different amounts on CBR of CH.
4.1.1.4 Copolymer mixtures in high plasticity clay soil
In order to studying the effects of mixing copolymer with high plasticity clay soil,
plain soil mixed with 0.50%, 0.75%, 1%, 1.25% and 1.5% of denominated
10
12
14
16
18
20
22
0 0.25 0.5 0.75 1
CB
R (
%)
Polyperpylene content (%)

64
alternative material. The amounts of copolymer compared to the whole mixtures and
optimum water contents, maximum dry unit weights, maximum unconfined
compressive strength and CBR percent of that mixtures are illustrated in Table 4.17.
Table 4.15 : Results of experiments executed with high plasticity clay soil and
copolymer.
No. Description wopt
(%)
γdmax
(kN/m3)
qu
(kN/m2)
CBR (%)
1 99.5% CH+0.5% CP 26 15.20 236 14.16
2 99.25% CH+0.75% CP 26 15.00 320 19.57
3 99.00% CH+1.00% CP 26 14.80 172 16.59
4 98.75% CH+1.25% CP 25 15.10 250 14.93
5 98.5% CH+1.5% CP 26 15.00 237 14.37
Highest maximum unconfined compressive strength obtained when high plasticity
clay soil mixed with 1% of copolymer. Five different high plasticity clay soil-
copolymer mixtures prepared in the laboratory and each experiment’s unconfined
compressive strength calculated as Figure 4.20. All data gathered and compared in a
graph, hence, it can be inferred that when 99% of high plasticity clay soil and 1.00%
of copolymer blended, the unconfined compressive strength of the mixture increases
up to 187%.
By analyzing the results of unconfined compression test, it can be inferred that
maximum strength of the mixture increases as the amount of copolymer increases up
to 1% of total weight. Then, maximum unconfined compressive strength of the
mixture starts to decrease as the amount of copolymer increases. This fluctuation of
maximum unconfined strength is because of the low dry unit weight of copolymer
compare with the high plasticity clay soil. Since our aim was having a homogeneous
mixtures, therefore, when the amount of copolymer reach more than 1% we could

65
see that copolymer fibers caused the clay soil particles to separate and vacant spaces
filled with copolymer fibers and hence the maximum strength of whole mixture
decreased.
Figure 4.20 : Polypropylene and high plasticity clay soil mixtures’ strength - water
content graph.
After determination of optimum water content of mixtures, CBR samples prepared
with related optimum water contents. The results of CBR experiment show same
behaviors as unconfined compressive test. In another words, the CBR percent of
mixtures increase as amount of copolymer reach to 1% and make a peak at that
value. Then, as the amount of copolymer as alternative material increase up to 1.5%
the CBR property of mixtures decreases. The results of CBR test demonstrated in
Figure 4.21.
0
50
100
150
200
250
300
350
15 20 25 30 35 40
Un
con
fin
ed c
om
pre
ssio
n s
tren
gth
(k
N /
m²)
Water content (%)
Plain soil
0.50% CP
0.75% CP
1% CP
1.25% CP
1.5% CP

66
Figure 4.21 : Effect of adding copolymer with different amounts on CBR of CH.
4.1.1.5 VHP mixtures in high plasticity clay soil
With the purpose of studying the effects of mixing high plasticity clay soil with
homopolymerpolypropylene (VHP), plain soil mixed with 0.25%, 0.50%, 0.75%, 1%
and 1.5% of denominated alternative material. The amounts of VHP compared to the
whole mixtures and optimum water contents, maximum dry unit weights, maximum
unconfined compressive strength and CBR percent of that mixtures are illustrated in
Table 4.18.
Table 4.16 : Results of experiments executed with high plasticity clay soil and VHP.
No. Description wopt
(%)
γdmax
(kN/m3)
qu
(kN/m2)
CBR (%)
1 99.75% CH+0.25%
VHP 16 1.68 335 20.07
2 99. 5% CH+0.5% VHP 18 1.61 306 17.14
3 99.00% CH+1.00%
VHP 23 1.56 279 16.21
4 98.75% CH+1.25%
VHP 24 1.54 243 14.79
5 98.5% CH+1.5% VHP 25 1.51 215 12.35
10
11
12
13
14
15
16
17
18
19
20
0 0.25 0.5 0.75 1 1.25 1.5
CB
R (
%)
Copolymer content (%)

67
Five different high plasticity clay soil-VHP mixtures prepared in the laboratory and
each experiment’s unconfined compressive strength calculated as Figure 4.22. All
data gathered and compared in a graph, hence, it can be inferred that when 99.75% of
high plasticity clay soil and 0.25% of VHP blended, the unconfined compressive
strength of the mixture increases up to 207%.
Figure 4.22 : Polypropylene and high plasticity clay soil mixtures’ strength - water
content graph.
By analyzing the results of unconfined compressive test, it can be inferred that
maximum strength of the mixture decreases as the amount of VHP increases up to
1.5% of total weight. Same as other fibers, since dry unit weight of VHP is much less
than plain soil, as the amount of demonstrated alternative material increases it
occupies more spaces, hence, it cause clay particles to separate and new vacant fill
with VHP and it results in decrease of strength.
After determination of optimum water content of mixtures, CBR samples prepared
with related optimum water contents. The results of CBR experiment show same
behaviors as unconfined compressive test. In another words, the CBR percent of
0
50
100
150
200
250
300
350
400
5 10 15 20 25 30 35 40
Un
con
fin
ed c
om
pre
ssiv
e st
ren
gth
(k
N /
m²)
Water content (%)
Plain soil
0.25% VHP
0.5% VHP
0.75% VHP
1%VHP
1.5% VHP

68
mixtures decreases as amount of VHP reach to 1.5%. The results of CBR test
demonstrated in Figure 4.23.
Figure 4.23 : Effect of adding VHP with different amounts on CBR of CH.
4.1.1.6 Fly ash-polypropylene mixtures in high plasticity clay soil
After mixing high plasticity clay soil with fly ash and polypropylene fiber, we
decided to combine fly ash with polypropylene and then added to clay soil. In order
to studying the effects of mixing high plasticity clay soil with fly ash-polypropylene,
we had to choose best mixture ratios of them. Since best results of fly ash generally
obtain when we add 10% of fly ash, therefore, we decided to add a constant value of
fly ash to the clay soil. On the other hand, as the results of mixing clay soil with
polypropylene shows, the best results reaches when we mix the high plasticity clay
soil with 0.25%, 0.50% and 0.75% of polypropylene. Three different fly ash-
polypropylene mixtures prepared and induced to compaction and unconfined
compression and CBR tests. Different amounts of polypropylene with 10% of fly ash
added to the whole mixtures and results of compaction, unconfined compression and
CBR tests of that mixtures are illustrated in Table 4.19.
10
12
14
16
18
20
22
0 0.25 0.5 0.75 1 1.25 1.5
CB
R (
%)
VHP content (%)

69
Table 4.17 : Results of experiments executed with fly ash-polypropylene-high
plasticity clay soil.
No. Description wopt
(%)
γdmax
(kN/m3)
qu
(kN/m2)
CBR (%)
1 89.75% CH + 0.25% PP
+ 10% Fly ash 25 15.10 342 17.98
2 89.5% CH + 0.5% PP +
10% Fly ash 24 15.00 328 17.37
3 89.25% CH + 0.75% PP
+ 10% Fly ash 25 15.10 342 19.57
Three different high plasticity clay soil, fly ash-polypropylene mixtures prepared in
the laboratory and each experiment’s unconfined compressive strength calculated as
Figure 4.24. According to the data obtained from experiments, it is obvious that the
maximum unconfined compressive strength of mixtures reached when we mixed the
high plasticity clay soil with 0.75% of polypropylene and 10% of fly ash which
shows 186% of increase compared to the plain soil.
With respect to the results of unconfined compression test, it can be inferred that the
unconfined compressive strength of high plasticity clay soil decreases as the amount
of fly ash-polypropylene increases from 0.25% up to 0.50% and then increases as it
reaches to 0.75% of mentioned alternative material. The fluctuation of unconfined
compressive strength (qu) between these three combinations is so less that
differences can be neglected. During this combination of alternative materials, fly
ash cause the cementitious stabilization of mixture while polypropylene fibers
constitutes a system of network which play the role of reinforcement of that mixture.
Figure 4.25 shows the stabilized samples which induced to unconfined compression
test.

70
Figure 4.24 : High plasticity and fly ash-polypropylene clay soil mixtures’ strength -
water content graph.
a) 0.25% PP +
%10 fly ash
b) 0.50% PP +
%10 fly ash
c) 0.75% PP +
%10 fly ash
Figure 4.25 : Reinforced high plasticity clay soil with different amounts of
polypropylene.
0
50
100
150
200
250
300
350
400
10 15 20 25 30 35 40
Un
con
fin
ed c
om
pre
ssiv
e st
ren
gth
(kN
/m
²)
Water content (%)
Plain soil
0.25% PP +10% Fly ash
0.50% PP +10% Fly ash
0.75% PP +10% Fly ash

71
Optimum water content of each mixture defined by unconfined compression
experiments. In the next step, CBR samples prepared with related optimum water
contents. Figure 4.26 exhibits the results of CBR tests with fly ash and different
amounts of polypropylene as alternative material. According to Figure 4.26, the
CBR property of mixtures tends to increase as the amount of polypropylene
increases. Although we reached to higher percentages of unconfined compression
strength and CBR compare to plain soil, but we expected better results than what we
reached. It is because polypropylene is a material which is not strong enough to
create a network system and therefore, from the economical aspect it is not good for
use as soil reinforcement.
Figure 4.26 : CBR experiments’ results when mixing CH with 10% fly ash+ with
different amounts of polypropylene.
4.1.1.7 Fly ash-copolymer mixtures in high plasticity clay soil
In the next step of high plasticity clay soil’s stabilization with alternative materials,
we decided to combine fly ash and copolymer together. In order to studying the
effects of mixing high plasticity clay soil with fly ash-copolymer, we had to choose
best mixture ratios of them. Most of the time, maximum strength of clay soils
reaches when we mix it with 10% of fly ash, hence, we decided to add a constant
value of fly ash to the mentioned clay soil. On the other hand, results of mixing high
10
12
14
16
18
20
22
0 0.25 0.5 0.75
CB
R (
%)
10% Fly ash+ Polypropylene content (%)

72
plasticity clay soil with polypropylene shows that best results reaches when we mix
mentioned clay soil with 0.75%, 1% and 1.25% of polypropylene. Three different fly
ash-copolymer mixtures prepared and induced to compaction and unconfined
compression and CBR tests. Different amounts of copolymer mixed with 10% of fly
ash and added to the high plasticity clay soil Table 4.20 exhibits the results of
compaction, unconfined compression and CBR tests of those mixtures.
Table 4.18 : Results of experiments executed with fly ash-copolymer-high plasticity
clay soil.
No. Description wopt
(%)
γdmax
(kN/m3)
qu
(kN/m2)
CBR (%)
1 89.25% CH + 0.75% CP
+ 10% Fly ash 20 14.87 319 19.56
2 89.00% CH + 1.00% CP
+ 10% Fly ash 19 15.20 581 21.71
3 88.75% CH + 1.25% CP
+ 10% Fly ash 21 14.90 369 19.14
3 different fly ash-copolymer and high plasticity clay soil mixtures prepared in the
laboratory and each experiment’s unconfined compressive strength calculated as
Figure 4.27. With respect to the data obtained from experiments, it is obvious that the
maximum unconfined compressive strength of mixtures reached when we mixed the
high plasticity clay soil with 1% of polypropylene and 10% of fly ash which shows
342% of increase compared to the plain soil.
With respect to the results of unconfined compression test, it can be inferred that the
unconfined compressive strength of high plasticity clay soil increases as the amount
of fly ash-copolymer increases from 0.75% up to 1% and then decreases as it reaches
to 1.25% of mentioned alternative material. The fluctuation of unconfined
compressive strength (qu) between these three combinations is so less that differences
can be neglected. During this combination of alternative materials, fly ash cause the
cementitious stabilization of mixture while polypropylene fibers constitutes a system
of network which play the role of reinforcement of that mixture. Figure 4.28 shows
the stabilized samples which induced to unconfined compression test.

73
Figure 4.27 : High plasticity and fly ash-copolymer clay soil mixtures’ strength-
water content graph.
a) 0.75% CP +
%10 fly ash
b) 1% CP +
%10 fly ash
c) 1.25% CP +
%10 fly ash
Figure 4.28 : Reinforced high plasticity clay soil with different amounts of
copolymer.
0
100
200
300
400
500
600
700
10 15 20 25 30 35 40
Un
con
fin
ed c
om
pre
ssiv
e st
ren
gth
(k
N /
m²)
Water content (%)
Plain soil
0.75% CP+ 10% Fly ash
1% CP+ 10% Fly ash
1.25% CP+ 10% Fly ash

74
Optimum water content of each mixture defined by unconfined compression
experiments. In the next step, CBR samples prepared with related optimum water
contents. Figure 4.29 exhibits the results of CBR tests with different amounts of
copolymer as alternative material.
Figure 4.29 : CBR experiments’ results when mixing CH with 10% fly ash+ with
different amounts of copolymer.
4.1.1.8 Fly ash-VHP mixtures in high plasticity clay soil
As the last step of experiments done in order to stabilize high plasticity clay with
alternative materials, we decided to combine fly ash and homopolymerpolypropylene
together. In order to studying the effects of mixing high plasticity clay soil with fly
ash-homopolymerpolypropylene, we had to choose best mixture ratios of them.
Generally, maximum strength of clay soils obtains when we mix it with 10% of fly
ash, hence, we decided to choose a constant value of fly ash to the mentioned clay
soil. On the other hand, results of mixing high plasticity clay soil with VHP shows
that best results reaches when we mix mentioned clay soil with 0.55%, 0.5% and
0.75% of polypropylene. Three different fly ash-VHP mixtures prepared and induced
to compaction and unconfined compression and CBR tests. Different amounts of
virgin homopolymerpolypropylene mixed with 10% of fly ash and added to the high
plasticity clay soil. Table 4.21 exhibits the results of compaction, unconfined
compression and CBR tests of explained mixtures.
10
12
14
16
18
20
22
24
0 0.25 0.5 0.75 1 1.25
CB
R (
%)
10% Fly ash+ Copolymer contents (%)

75
Table 4.19 : Results of experiments executed with high plasticity clay soil and fly
ash- VHP mixtures.
No. Description wopt
(%)
γdmax
(kN/m3)
qu
(kN/m2)
CBR (%)
1 89.75% CH + 0.25%
VHP + 10% Fly ash 17 17.1 337 34.72
2 89.5% CH + 0.5% VHP
+ 10% Fly ash 19 16.6 305 30.08
3 89.25% CH + 0.75%
VHP + 10% Fly ash 22 15.7 278 23.66
Four different high plasticity clay soil-VHP mixtures prepared in the laboratory and
each experiment’s unconfined compressive strength calculated as Figure 4.30.
According to the data obtained from experiments, it is obvious that the maximum
unconfined compressive strength of mixtures reached when we mixed the high
plasticity clay soil with 0.25% of VHP which shows 186% of increase compared to
the plain soil.
Figure 4.30 : High plasticity clay soil-fly ash-VHP mixtures’ strength - water
content graph.
0
50
100
150
200
250
300
350
400
5 10 15 20 25 30 35 40 45
Un
con
fin
ed c
om
pre
ssiv
e s
tren
gth
(k
N/m
²)
Water content(%)
Plain soil
0.25% VHP+ 10% Fly ash
0.5% VHP+ 10% Fly ash
0.75% VHP+ 10% Fly ash

76
With respect to the results of unconfined compression test, it can be understood that
the unconfined compressive strength of high plasticity clay soil decreases as the
amount of VHP increases up to 0.75%. It can be inferred that as the amount of virgin
homopolymerpolyproylene increases it comprises a system of network which play
the role of reinforcement. With the further increase of denominated alternative
material, network system face with defects as the ratio of VHP increases compared to
clay soil particles. Therefore, clay particles bear less strength compared to VHP
which is an additive material, thus the maximum unconfined compressive strength of
total mixture starts to decrease.
After determination of optimum water content of mixtures, CBR samples prepared
with related optimum water content. The CBR factor of mixtures decreases as the
amount of VHP increases up to 0.75%. Figure 4.31 displays the results of CBR
experiments done with 10% of fly ash and different amounts of VHP as alternative
materials.
Figure 4.31 : CBR experiments’ results when mixing CH with 10% fly ash+ with
different amounts of VHP.
10
15
20
25
30
35
40
0 0.25 0.5 0.75
CB
R (
%)
10% Fly ash+ VHP contents (%)

77
4.1.2.1 Low plasticity clay soil
As second group of experiments, low plasticity clay soil used as sample soil. In order
to compare the results of mixing low plasticity clay soil with alternative materials,
plain soil’s maximum dry unit weight, maximum unconfined compression strength
and CBR properties determined by using modified Harvard miniature compaction,
unconfined compressive and CBR test equipments respectively. Results of standard
proctor test performed by harvard miniature compaction apparatus and unconfined
compression and CBR tests are illustrated in Table 4.22.
Table 4.20 : Results of experiments performed to calibrate the harvard miniature
equipment.
No. Description wopt
(%)
γdmax
(kN/m3)
qu
(kN/m2)
CBR (%)
1 Low plasticity clay soil
(CL) 26 15.3 177 12.06
The unconfined compressive strength curve of the low plasticity clay as the plain soil
exhibited in Figure 4.32. Plain soil’s peak point deformed form after the unconfined
compressive test are displayed in Figure 4.35.
Figure 4.32 : Unconfined compression test results of low plasticity clay soil.
0
20
40
60
80
100
120
140
160
180
200
10 15 20 25 30 35
Un
con
fin
ed c
om
pre
ssio
n s
tren
gth
(kN
/m²)
Water content (%)
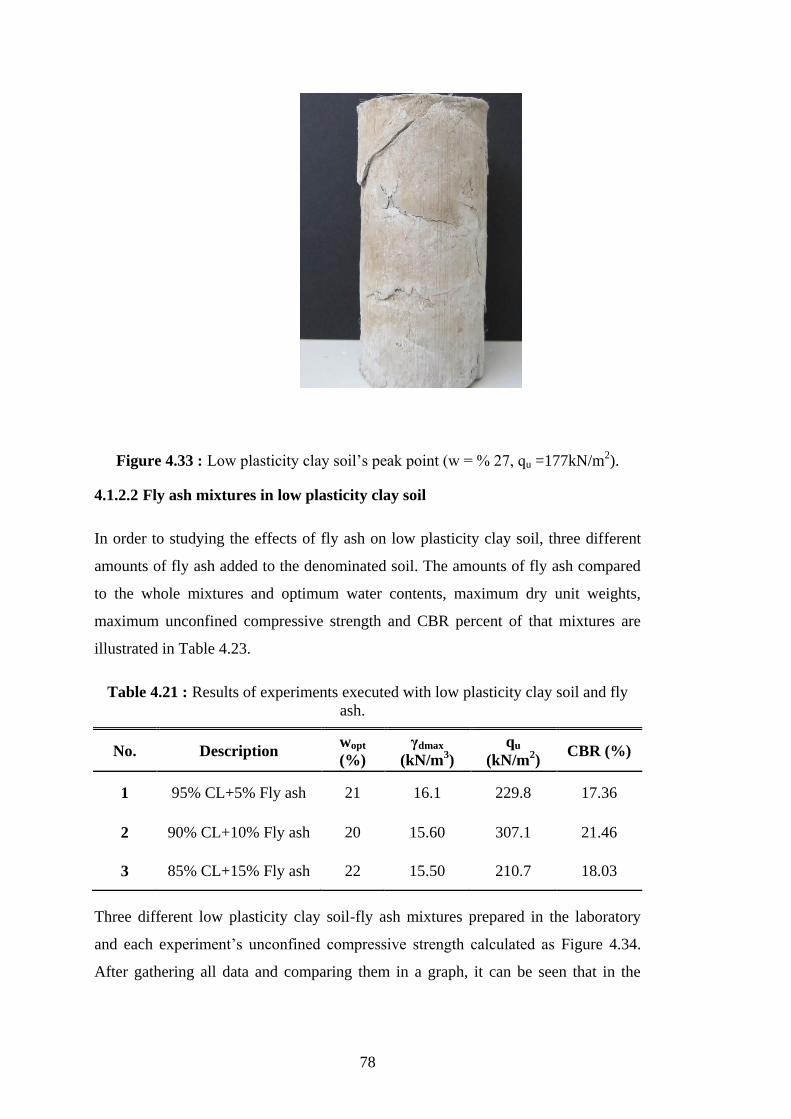
78
Figure 4.33 : Low plasticity clay soil’s peak point (w = % 27, qu =177kN/m2).
4.1.2.2 Fly ash mixtures in low plasticity clay soil
In order to studying the effects of fly ash on low plasticity clay soil, three different
amounts of fly ash added to the denominated soil. The amounts of fly ash compared
to the whole mixtures and optimum water contents, maximum dry unit weights,
maximum unconfined compressive strength and CBR percent of that mixtures are
illustrated in Table 4.23.
Table 4.21 : Results of experiments executed with low plasticity clay soil and fly
ash.
No. Description wopt
(%)
γdmax
(kN/m3)
qu
(kN/m2)
CBR (%)
1 95% CL+5% Fly ash 21 16.1 229.8 17.36
2 90% CL+10% Fly ash 20 15.60 307.1 21.46
3 85% CL+15% Fly ash 22 15.50 210.7 18.03
Three different low plasticity clay soil-fly ash mixtures prepared in the laboratory
and each experiment’s unconfined compressive strength calculated as Figure 4.34.
After gathering all data and comparing them in a graph, it can be seen that in the

79
mixture with 10% of fly ash, the unconfined compressive strength of the mixture
increases up to 174%.
Figure 4.34 : Fly ash and low plasticity clay soil mixtures’ strength - water content
graph.
With respect to the results of unconfined compression test, it seems that by adding
fly ash up to 10% of total weight maximum unconfined compressive strength
increases significantly and reaches the maximum value at 10%. On the other hand, at
15% fly ash content, the increase in the unconfined compressive strength (qu) greatly
diminishes which can be even neglected.
After determination of optimum water content of mixtures, CBR samples prepared
with related optimum water content. The results of CBR experiments show same
behaviors as unconfined compression test. In another words, the CBR percent of
mixtures increase as amount of fly ash reach to 10% and make a peak at that value.
Then, as the amount of fly ash increase up to 15% the CBR property of mixture
decreases. The results of CBR tests demonstrated in Figure 4.35.
0
50
100
150
200
250
300
350
10 15 20 25 30 35
Un
con
fin
ed c
om
pre
ssiv
e st
ren
gth
(k
N/m
²)
Water content(%)
Plain soil
5% Fly ash
10% Fly ash
15% Fly ash

80
Figure 4.35 : Effect of adding fly ash with different amounts on CBR of CL.
4.1.2.3 Polypropylene mixtures in low plasticity clay soil
In order to study the effects of mixing polypropylene with low plasticity clay soil,
first of all, five different amounts of polypropylene (0.25%, 0.50, 0.75%,1% and
1.25%) added to the denominated soil. All the mixtures prepared and induced to
compaction and unconfined compression tests. Since the dry unit weight of
polypropylene is so less than clay, when we added 1.25% of polypropylene to
98.75% of clay, the volume of the mentioned alternative material increased in a way
that when we reached to 26% of water content, the mixture still not mixed enough
for the compaction test and therefore we couldn’t obtain a homogenous mixture.
Hence, we decided to interrupt adding 1.25% or more of polypropylene.
The amounts of polypropylene added to the whole mixtures and optimum water
contents, maximum dry unit weights, maximum unconfined compressive strength
and CBR percent of that mixtures illustrated in Table 4.24.
Four different high plasticity clay soil-polypropylene mixtures prepared in the
laboratory and each experiment’s unconfined compressive strength calculated as
Figure 4.36. According to the data obtained from experiments, it is obvious that the
maximum unconfined compressive strength of mixtures reached when we mixed the
high plasticity clay soil with 0.75% of polypropylene which shows 212% of increase
compared to the plain soil.
5
10
15
20
25
30
0 5 10 15
CB
R (
%)
Flay ash content (%)

81
Table 4.22 : Results of experiments executed with low plasticity clay soil and
polypropylene.
No. Description wopt
(%)
γdmax
(kN/m3)
qu
(kN/m2)
CBR (%)
1 99.75% CH+
0.25% Polypropylene 26 14.60 255.2 15.7052
2 99. 5% CH+
0. 5% Polypropylene 25 14.50 275.9 16.9218
3 99.25% CH+
0.75% Polypropylene 25 14.50 317.3 19.0232
4 99% CH+
1% Polypropylene 26 14.60 315.7 19.355
Figure 4.36 : Polypropylene and low plasticity clay soil mixtures’ strength - water
content graph.
0
50
100
150
200
250
300
350
400
450
10 15 20 25 30 35
Un
con
fin
ed c
om
pre
ssiv
e st
ren
gth
(k
N /
m²)
Water content (%)
Plain soil
0.25% PP
0.5% PP
0.75% PP
1% PP

82
With respect to the results of unconfined compression test, it can be inferred that the
unconfined compressive strength of low plasticity clay soil increases as the amount
of polypropylene increases up to 0.75% and then decreases as it reaches to 1% of
mentioned alternative material. In another words, as the amount of polypropylene
increases it constitutes a system of network which play the role of reinforcement.
With the further increase of denominated alternative material, network system face
with defects as the ratio of polypropylene increases compared to clay soil particles.
Therefore, clay particles bear less strength compared to polypropylene so the
maximum unconfined compressive strength of total mixture starts to decrease. Figure
4.37 shows the network system which polypropylene constitutes in low plasticity
clay soil.
a) 0.5% PP + CH b) 0.75% PP + CH c) 1% PP + CH
Figure 4.37 : Reinforced low plasticity clay soil with different amounts of
polypropylene.
After determination of optimum water content of mixtures, CBR samples prepared
with related optimum water contents. The CBR factor of mixtures increase as amount
of polypropylene reach to 0.75% and it starts to decrease with further increase in
amount of alternative material. Figure 4.38 exhibits the results of CBR tests with
different amounts of polypropylene as alternative material.

83
Figure 4.38 : Effect of adding polypropylene with different amounts on CBR of CL.
4.1.2.4 Copolymer mixtures in low plasticity clay soil
In order to studying the effects of mixing copolymer with low plasticity clay soil,
plain soil mixed with 0.25%, 0.5%, 0.75%, 1% and 1.25% of denominated
alternative material. The amounts of copolymer compared to the whole mixtures and
optimum water contents, maximum dry unit weights, maximum unconfined
compressive strengths and CBR percents of that mixtures are illustrated in Table
4.25.
Table 4.23 : Results of experiments executed with low plasticity clay soil and
copolymer.
No. Description wopt
(%)
γdmax
(kN/m3)
qu
(kN/m2)
CBR (%)
1 99.75% CL+0.25% CP 20 15.1 265 14.15
2 99. 5% CL+0. 5% CP 23 15.34 281 16.59
3 99.25% CL+0.75% CP 18 15.41 377 19.57
4 99% CL+1% CP 21 15.3 266 14.93
5 98.75% CL+1.25% CP 20 15.18 260 14.37
11
13
15
17
19
21
23
0 0.25 0.5 0.75 1
CB
R (
%)
Polypropylen content (%)

84
Highest maximum unconfined compressive strength obtained when low plasticity
clay soil mixed with 0.75% of copolymer. Five different low plasticity clay soil-
copolymer mixtures prepared in the laboratory and each experiment’s unconfined
compressive strength calculated as Figure 4.39. All data gathered and compared in a
graph, hence, it can be inferred that when 99.25% of high plasticity clay soil and
0.75% of copolymer blended, the unconfined compressive strength of the mixture
increases up to 212%.
Figure 4.39 : Polypropylene and low plasticity clay soil mixtures’ strength - water
content graph.
By analyzing the results of unconfined compression test, it can be inferred that
maximum strength of the mixture increases as the amount of copolymer increases up
to 0.75% of total weight. Then, maximum unconfined compressive strength of the
mixture starts to decrease as the amount of copolymer increases. This fluctuation of
maximum unconfined strength is because of the low dry unit weight of copolymer
compare with the low plasticity clay soil. Since we try to have homogeneous
mixtures, therefore, when the amount of copolymer reach more than 0.75% we can
0
50
100
150
200
250
300
350
400
10 15 20 25 30 35
Un
con
fin
ed c
om
pre
ssiv
e st
ren
gth
(k
N /
m²)
Water content (%)
Plain soil
0.25% CP
0.5% CP
0.75% CP
1% CP
1.25% CP
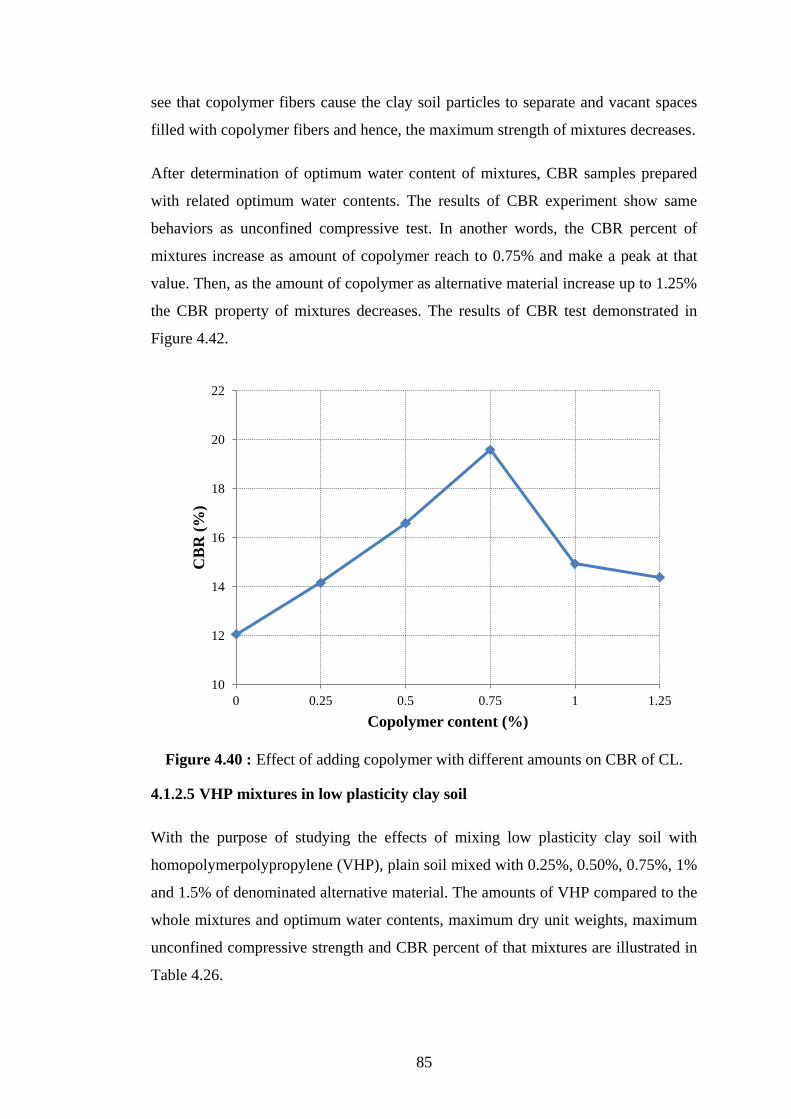
85
see that copolymer fibers cause the clay soil particles to separate and vacant spaces
filled with copolymer fibers and hence, the maximum strength of mixtures decreases.
After determination of optimum water content of mixtures, CBR samples prepared
with related optimum water contents. The results of CBR experiment show same
behaviors as unconfined compressive test. In another words, the CBR percent of
mixtures increase as amount of copolymer reach to 0.75% and make a peak at that
value. Then, as the amount of copolymer as alternative material increase up to 1.25%
the CBR property of mixtures decreases. The results of CBR test demonstrated in
Figure 4.42.
Figure 4.40 : Effect of adding copolymer with different amounts on CBR of CL.
4.1.2.5 VHP mixtures in low plasticity clay soil
With the purpose of studying the effects of mixing low plasticity clay soil with
homopolymerpolypropylene (VHP), plain soil mixed with 0.25%, 0.50%, 0.75%, 1%
and 1.5% of denominated alternative material. The amounts of VHP compared to the
whole mixtures and optimum water contents, maximum dry unit weights, maximum
unconfined compressive strength and CBR percent of that mixtures are illustrated in
Table 4.26.
10
12
14
16
18
20
22
0 0.25 0.5 0.75 1 1.25
CB
R (
%)
Copolymer content (%)

86
Table 4.24 : Results of experiments executed with low plasticity clay soil and VHP.
No. Description wopt
(%)
γdmax
(kN/m3)
qu
(kN/m2)
CBR (%)
1 99.75% CL+0.25%
VHP 23 1.61 228 16.79
2 99. 5% CL+0.5% VHP 23 1.51 215 15.2
3 99% CL+1% VHP 24 1.54 219.7 14.34
4 98.75% CL+1.25%
VHP 29 1.52 142 13.97
5 98.5% CL+1.5% VHP 28 1.46 67 9.44
Five different low plasticity clay soil-VHP mixtures prepared in the laboratory and
each experiment’s unconfined compressive strength calculated as Figure 4.41. All
data gathered and compared in a graph, hence, it can be inferred that when 99.75% of
high plasticity clay soil and 0.25% of VHP blended, the unconfined compressive
strength of the mixture increases up to 129%.
Figure 4.41 : VHP and low plasticity clay soil mixtures’ strength - water content
graph.
0
50
100
150
200
250
10 15 20 25 30 35 40
Un
con
fin
ed c
om
pre
ssiv
e st
ren
gth
(k
Pa)
Water content(%)
Plain soil
0.25% VHP
0.5% VHP
0.75% VHP
1% VHP
1.5% VHP

87
By analyzing the results of unconfined compressive test, it can be inferred that
maximum strength of the mixture decreases as the amount of VHP increases up to
1.5% of total weight. Same as other fibers, since dry unit weight of VHP is much less
than plain soil, as the amount of demonstrated alternative material increases it
occupies more spaces, hence, it causes clay particles to separate and new vacant fill
with VHP and it results in decrease of strength. After determination of optimum
water content of mixtures, CBR samples prepared with related optimum water
contents. The results of CBR experiment show same behaviors as unconfined
compressive test. In another words, the CBR percent of mixtures decreases as
amount of VHP reach to 1.5%. The results of CBR test demonstrated in Figure 4.42.
Figure 4.42 : Effect of adding VHP with different amounts on CBR of CL.
4.1.2.6 Fly ash-polypropylene mixtures in low plasticity clay soil
After mixing low plasticity clay soil with fly ash and polypropylene fiber, we
decided to combine fly ash with polypropylene and then added to clay soil. In order
to studying the effects of mixing low plasticity clay soil with fly ash-polypropylene,
we had to choose best mixture ratios of them. Since best results of fly ash generally
obtain when we add 10% of fly ash, therefore, we decided to add a constant value of
fly ash to the clay soil. On the other hand, as the results of mixing clay soil with
polypropylene shows, the best results reaches when we mix the low plasticity clay
8
9
10
11
12
13
14
15
16
17
18
0 0.25 0.5 0.75 1 1.25 1.5
CB
R (
%)
VHP content (%)

88
soil with 0.25%, 0.50% and 0.75% of polypropylene. Three different fly ash-
polypropylene mixtures prepared and induced to compaction and unconfined
compression and CBR tests. Different amounts of polypropylene with 10% of fly ash
added to the whole mixtures and results of compaction, unconfined compression and
CBR tests of that mixtures are illustrated in Table 4.27.
Table 4.25 : Results of experiments executed with fly ash-polypropylene-low
plasticity clay soil.
No. Description wopt
(%)
γdmax
(kN/m3)
qu
(kN/m2)
CBR (%)
1 89.75% CL + 0.25% PP +
10% Fly ash 21 14.9 268 22.14
2 89.5% CL + 0.5% PP +
10% Fly ash 18 14.9 259 21.43
3 89.25% CL + 0.75% PP +
10% Fly ash 22 14.9 232 20.72
Three different low plasticity clay soil, fly ash-polypropylene mixtures prepared in
the laboratory and each experiment’s unconfined compressive strength calculated as
Figure 4.43. According to the data obtained from experiments, it is obvious that the
maximum unconfined compressive strength of mixtures reached when we mixed the
low plasticity clay soil with 0.25% of polypropylene and 10% of fly ash which shows
186% of increase compared to the plain soil.
With respect to the results of unconfined compression test, it can be inferred that the
unconfined compressive strength of low plasticity clay soil decreases as the amount
of fly ash-polypropylene increases from 0.25% up to 0.70% of mentioned alternative
material. The fluctuation of unconfined compressive strength (qu) between these
three combinations is so less that differences can be neglected. During this
combination of alternative materials, fly ash cause the cementitious stabilization of
mixture while polypropylene fibers constitutes a system of network which play the
role of reinforcement of that mixture. Figure 4.44 shows the stabilized samples
which induced to unconfined compression test.

89
Figure 4.43 : Low plasticity and fly ash-polypropylene clay soil mixtures’ strength -
water content graph.
a) 0.25% PP +
%10 fly ash
b) 0.50% PP +
%10 fly ash
c) 0.75% PP +
%10 fly ash
Figure 4.44 : Reinforced low plasticity clay soil with different amounts of
polypropylene.
0
50
100
150
200
250
300
10 15 20 25 30 35 40
Un
con
fin
ed c
om
pre
ssiv
e st
ren
gth
(k
N /
m²)
Water content (%)
Plain soil
0.25% PP+ 10% Fly ash
0.5% PP+ 10% Fly ash
0.75% PP+ 10% Fly ash

90
Optimum water content of each mixture defined by unconfined compression
experiments. In the next step, CBR samples prepared with related optimum water
contents. Figure 4.45 exhibits the results of CBR tests with different amounts of
polypropylene as alternative material. According to Figure 4.45, the CBR property
of mixtures tends to decrease as the amount of polypropylene increases.
Figure 4.45 : CBR experiments’ results when mixing CL with 10% fly ash+ with
different amounts of polypropylene.
4.1.2.7 Fly ash-copolymer mixtures in low plasticity clay soil
In the next step of low plasticity clay soil’s stabilization with alternative materials,
we decided to combine fly ash and copolymer together. In order to studying the
effects of mixing low plasticity clay soil with fly ash-copolymer, we had to choose
best mixture ratios of them. Most of the time, maximum strength of clay soils
reaches when we mix it with 10% of fly ash, hence, we decided to add a constant
value of fly ash to the mentioned clay soil. On the other hand, results of mixing low
plasticity clay soil with polypropylene shows that best results reaches when we mix
mentioned clay soil with 0.75%, 1% and 1.25% of polypropylene. Three different fly
ash-copolymer mixtures prepared and induced to compaction and unconfined
compression and CBR tests. Different amounts of copolymer mixed with 10% of fly
ash and added to the low plasticity clay soil Table 4.28 exhibits the results of
compaction, unconfined compression and CBR tests of those mixtures.
10
12
14
16
18
20
22
24
0 0.25 0.5 0.75
CB
R (
%)
10% Fly ash+ Polypropylene content (%)
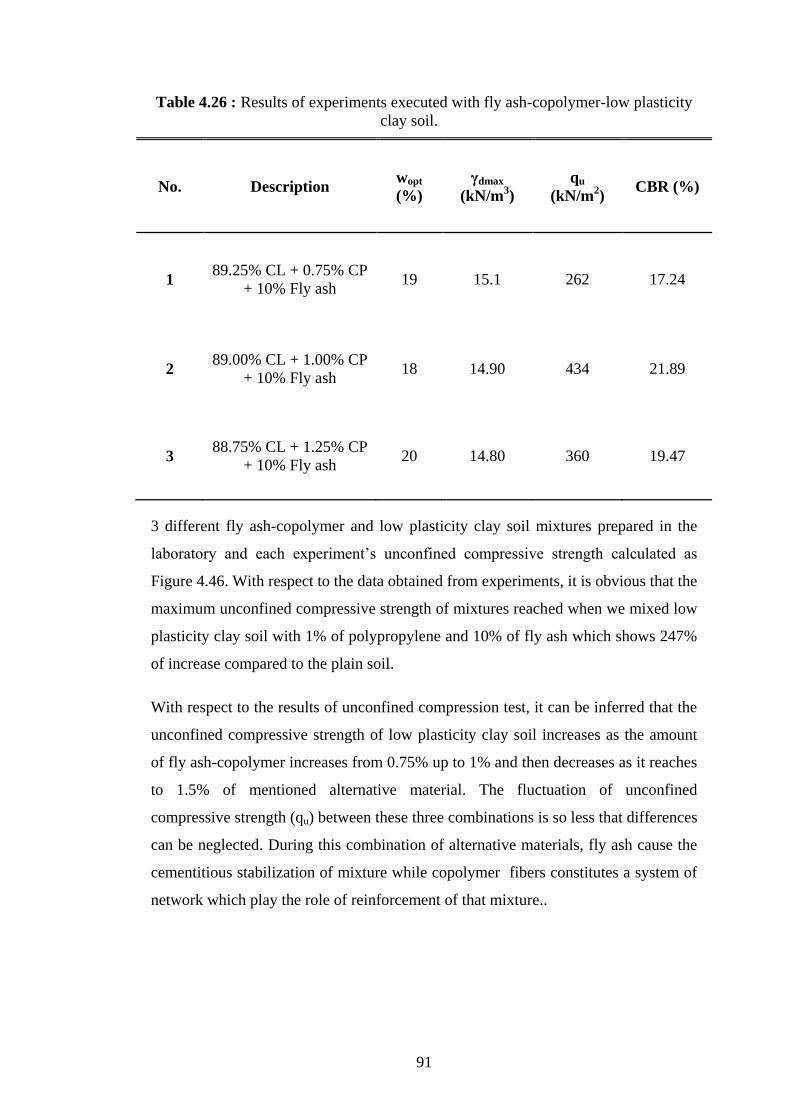
91
Table 4.26 : Results of experiments executed with fly ash-copolymer-low plasticity
clay soil.
No. Description wopt
(%)
γdmax
(kN/m3)
qu
(kN/m2)
CBR (%)
1 89.25% CL + 0.75% CP
+ 10% Fly ash 19 15.1 262 17.24
2 89.00% CL + 1.00% CP
+ 10% Fly ash 18 14.90 434 21.89
3 88.75% CL + 1.25% CP
+ 10% Fly ash 20 14.80 360 19.47
3 different fly ash-copolymer and low plasticity clay soil mixtures prepared in the
laboratory and each experiment’s unconfined compressive strength calculated as
Figure 4.46. With respect to the data obtained from experiments, it is obvious that the
maximum unconfined compressive strength of mixtures reached when we mixed low
plasticity clay soil with 1% of polypropylene and 10% of fly ash which shows 247%
of increase compared to the plain soil.
With respect to the results of unconfined compression test, it can be inferred that the
unconfined compressive strength of low plasticity clay soil increases as the amount
of fly ash-copolymer increases from 0.75% up to 1% and then decreases as it reaches
to 1.5% of mentioned alternative material. The fluctuation of unconfined
compressive strength (qu) between these three combinations is so less that differences
can be neglected. During this combination of alternative materials, fly ash cause the
cementitious stabilization of mixture while copolymer fibers constitutes a system of
network which play the role of reinforcement of that mixture..

92
Figure 4.46 : Low plasticity and fly ash-copolymer clay soil mixtures’ strength-
water content graph.
a) 0.75% CP +
%10 fly ash
b) 1% CP +
%10 fly ash
c) 1.25% CP +
%10 fly ash
Figure 4.47 : Reinforced low plasticity clay soil with different amounts of
copolymer.
0
50
100
150
200
250
300
350
400
450
500
10 15 20 25 30 35 40
Un
con
fin
ed c
om
pre
ssiv
e st
ren
gth
(k
N /
m²)
Water content (%)
Plain soil
0.75% CP+ 10% Fly ash
1% CP+ 10% Fly ash
1.25% CP+ 10% Fly ash

93
Optimum water content of each mixture defined by unconfined compression
experiments. In the next step, CBR samples prepared with related optimum water
contents. Figure 4.48 exhibits the results of CBR tests with different amounts of
polypropylene as alternative material. According to Figure 4.48, the CBR property
of mixtures tends to increase as the amount of copolymer increases.
Figure 4.48 : CBR experiments’ results when mixing CL with 10% fly ash+ with
different amounts of copolymer.
4.1.2.8 Fly ash-VHP mixtures in low plasticity clay soil
As the last step of experiments done in order to stabilize low plasticity clay with
alternative materials, we decided to combine fly ash and homopolymerpolypropylene
together. In order to studying the effects of mixing low plasticity clay soil with fly
ash-homopolymerpolypropylene, we had to choose best mixture ratios of them.
Generally, maximum strength of clay soils obtains when we mix it with 10% of fly
ash, hence, we decided to choose a constant value of fly ash to the mentioned clay
soil. On the other hand, results of mixing low plasticity clay soil with VHP shows
that best results reaches when we mix mentioned clay soil with 0.25%, 0.5% and
0.75% of VHP. Three different fly ash-VHP mixtures prepared and induced to
compaction and unconfined compression and CBR tests. Table 4.29 exhibits the
results of compaction, unconfined compression and CBR experiments of explained
mixtures.
10
12
14
16
18
20
22
24
0 0.25 0.5 0.75 1 1.25
CB
R (
%)
10% Fly ash+ copolymer contents (%)

94
Table 4.27 : Results of experiments executed with low plasticity clay soil and fly
ash- VHP mixtures.
No. Description wopt
(%)
γdmax
(kN/m3)
qu
(kN/m2)
CBR (%)
1 89.75% CL + 0.25%
VHP + 10% Fly ash 12 17.1 507 27.74
2 89.5% CL + 0.5% VHP
+ 10% Fly ash 14 16.2 390 24.12
3 89.25% CL + 0.25%
VHP + 10% Fly ash 17 15.7 310 16.87
Three different low plasticity clay soil-VHP mixtures prepared in the laboratory and
each experiment’s unconfined compressive strength calculated as Figure 4.49.
According to the data obtained from experiments, it is obvious that the maximum
unconfined compressive strength of mixtures reached when we mixed the low
plasticity clay soil with 0.25% of VHP and 10% of fly ash which shows 687% of
increase compared to the plain soil.
With respect to the results of unconfined compression test, it can be understood that
the unconfined compressive strength of low plasticity clay soil decreases as the
amount of VHP increases up to 0.75%. It can be inferred that as the amount of virgin
homopolymerpolyproylene increases it comprises a system of network which play
the role of reinforcement. With the further increase of denominated alternative
material, network system face with defects as the ratio of VHP increases compared to
clay soil particles. Therefore, clay particles bear less strength compared to VHP
which is an additive material, thus the maximum unconfined compressive strength of
total mixture starts to decrease.
After determination of optimum water content of mixtures, CBR samples prepared
with related optimum water content. The CBR factor of mixtures decreases as the
amount of VHP increases up to 0.75%. Figure 4.50 displays the results of CBR
experiments done with 10% of fly ash and different amounts of VHP as alternative
materials.

95
Figure 4.49 : Low plasticity clay soil-fly ash-VHP mixtures’ strength - water content
graph.
Figure 4.50 : CBR experiments’ results when mixing CL with 10% fly ash+ with
different amounts of VHP.
0
100
200
300
400
500
600
0 5 10 15 20 25 30 35
Un
con
fin
ed c
om
pre
ssiv
e st
ren
gth
(k
Pa)
Water content(%)
Plain soil
0.25% VHP+ 10% Fly ash
0.5% VHP+ 10% Fly ash
0.75% VHP+ 10% Fly ash
10
12
14
16
18
20
22
24
26
28
30
0 0.25 0.5 0.75
CB
R (
%)
10% Fly ash+ VHP contents (%)

96

97
5. CONCLUSIONS AND RECOMMENDATIONS
Alternative techniques and materials are constantly being investigated to develop
innovative solutions for the construction of highway embankments and other types of
earth structures. Improvement of the subgrade soils for highway embankments can
be critical for implementing sustainable and economical applications, especially for
cases where recycled or other alternative materials are used.
During the first chapter of the research the needs for soft soil improvement has been
discussed. In the second part of research, the most common methods used for soft
soil stabilization has been described. With respect to the fact that most of the
methods mentioned in this chapter are highly expensive, hence, the need for
determination of alternative methods has been revealed.
As the second part of the research, the definition and the aims of soil stabilization
have been discussed. Then, globally common methods for road subgrades advantages
and disadvantages of them have been mentioned. Lime, portland cement which are
manufactured products that frequently used in civil engineering and fly ash which is
a by-product of the burning of coal at electric power generating stations used in order
to stabilize shallow clayey soils. In addition to these materials which cause
cementitious reaction, other additives such as shredded tire rubbers and natural and
synthetic fibers mixed with clayey soils with the scope of improvement.
During last chapter of the research, both high plasticity clay soil (CH) and low
plasticity clay soil (CL) mixed with fly ash and polypropylene, copolymer and
homopolymerpolypropylene fibers. Prepared samples induced to the compaction test
which conducted in especially designed Harvard compaction equipment after seven
days of curing time and then, the unconfined compression and CBR tests performed.
In the first step of the experiments, both clayey soils’ engineering properties has been
determined. Then, the soil mixed with 5%, 10% and 15% of the class C fly ash
compared to the whole mixture weight. As the second alternative material used in
order to stabilization, 0.25%, 0.50%, 0.75% and 1% of polypropylene fiber which
constitutes a network system added to the whole mixture. The copolymer fibers with

98
0.50%, 0.75%, 1% and 1.25% amounts added to the clayey soil. As the last
alternative material, homopolymerpolypropylene (VHP) added to them and
mentioned engineering properties of them defined.
With respect to the outcomes of experiments conducted, it can be inferred that the
fly ash acts the role of cementitious reaction which can be categorized as the
chemical stabilization, while polypropylene, copolymer and VHP fibers play the role
of soil reinforcement. Hence, in another step of the researches it was decided to mix
the fly ash and each of the fibers in order to achieve better results. Since best results
of all compaction, unconfined compression and CBR tests obtained when we mixed
the soil with 10% of fly ash and 0.25%, 0.50% and 0.75% of the polypropylene and
0.75%, 1%, 1.25% of the copolymer and 0.25%, 0.50% and 0.75% of the VHP, it
was decided to choose constant value for the fly ash and add each fibers step by step
to get better results compare with adding each alternative material alone. With the
purpose of discussing each of the mixtures mentioned above with more details clayey
soils divided into two groups (high and low plasticity).
I) High plasticity clay soil (CH)
According to the results of compaction, the unconfined compression and CBR tests,
high plasticity clay soil have optimum water content equal to 27% and the maximum
dry unit weight, the unconfined compression strength and CBR percent equal to
15.00 kN/m3, 170.5 kN/m
2 and 11.06%. High plasticity clay soil mixed with 5%,
10% and 15% of the fly ash and the maximum strength and better compaction and
CBR achieved when mix it with 10% 0f fly ash. Maximum unconfined compression
strength of the mixture increased to 475 kN/m2 which exhibits 279% increase of
strength which is result of cementitious reaction caused by chemical reaction.
Polypropylene fiber as an additive mixed with the plain soil and best results obtained
when mixed with 0.75% of the mentioned alternative material compare with the total
weight of mixture. By adding 0.75% of polypropylene, the maximum strength of
bended soil reached 317 kN/m3 which shows 186% increase. Next alternative
material which added to the plain soil was copolymer and maximum unconfined
compression strength of the mixture increased to 320 kN/m3 which was 188% of the
strength improvement. Last alternative material was homopolymerpolypropylene
(VHP) which showed 207% since it reached to 335 kN/m3 of strength. High
plasticity clay soil achieved better results of the stabilization when mixed with 10%

99
of fly ash and 0.75% of polypropylene when it reached to the 342 kN/m3 which
means 186% of strength improvement. When initial sample soil blended with 10% of
fly ash and 1% of copolymer its strength reached to 581 kN/m3 which illustrate
342% of improvement compare with the mentioned sample soil. As the last group of
experiments done with the purpose of soil stabilization, plain soil mixed with fly ash
and VHP fibers and mixture’s unconfined compression strength reached to 337
kN/m3 which exhibits 187% of soil strength improvement. After analyzing all data it
is concluded that the most maximum unconfined strength of high plasticity clay soil
can be reached when we mix it with 10% of fly ash and 1% of copolymer.
II) Low plasticity clay soil (CL)
According to the results of the compaction, the unconfined compression and CBR
tests, low plasticity clay soil have optimum water content equal to 26% and the
maximum dry unit weight, the unconfined compression strength and CBR percent
equal to 15.3 kN/m3, 177 kN/m2 and 12.17%. Low plasticity clay soil mixed with
5%, 10% and 15% of fly ash and maximum strength and better compaction and CBR
achieved when we mix it with 10% 0f fly ash. Maximum unconfined compression
strength of the mixture increased to 307.1 kN/m2 which exhibits 174% increase of
the strength which is result of the cementitious reaction caused by the chemical
reaction. Polypropylene fiber as an additive, mixed with plain soil and best results
obtained when mixed with 0.75% of mentioned alternative material compare with the
total weight of mixture. By adding 0.75% of polypropylene, maximum strength of
blended soil reached 317.3 kN/m3 which shows 186% increase. Next alternative
material which added to the plain soil was copolymer and maximum unconfined
compression strength of the mixture increased to 377 kN/m3 which was 213% of the
strength improvement. Last alternative material was homopolymerpolypropylene
(VHP) which showed 124% since it reached to 219.7 kN/m3 of the strength. Low
plasticity clay soil achieved better results of stabilization when mixed with 10% of
fly ash and 0.25% of polypropylene when it reached to the 268 kN/m3 which means
151% of the strength improvement. When initial sample soil blended with 10% of fly
ash and 1% of copolymer its strength reached to 434 kN/m3 which illustrate 245% of
improvement compare with the mentioned sample soil. As the last group of
experiments done with the purpose of soil stabilization, plain soil with fly ash and
VHP fibers and the mixture’s unconfined compression strength reached to 507

100
kN/m3 which exhibits 287% of the soil strength improvement. After analyzing all
data we can infer that the most maximum unconfined strength of low plasticity clay
soil can be reached when mix it with 10% of fly ash and 0.25% of
homopolymerpolypropylene.
Further studies can include especially large-scale tests in order to better understand
the behavior of fiber-reinforced soils. As well, further studies are necessary to
elucidate the fracture mechanism, the effect of prior treatment of the fibers and the
durability of the composite at long term and under more severe conditions. In
particular, the effects of drainage and pore pressures on the effective strength of the
stabilized soil and creep along their interface are of particular interest. Besides,
measurement of durability and aging of fibers in soil composites recommended. It is
suggested that the large volumes of recycled waste materials and fibers can be used
as a value-added product to enhance the shear strength and the load deformation
response of soils.

101
REFERENCES
Abtahi, M., Sheikhzadeh. M., Hejazi, M., Hassani Y. 2009: Compressive behavior
of composite soils reinforced with recycled waste tire cords and
polypropylene fibers, 1st International and conference text
engineering, Rasht, Iran.
Adams, T. H. 1988: Marketing of fly ash concrete. In MSU seminar: Fly ash
applications to concrete, Michigan State University.
Ahmad, F., Bateni, F., Azmi, M. 2010: Performance evaluation of silty sand
reinforced with fibers, Geotext Geomembrane congress, 93–9.
ASTM D1633-00, “Standard Test Method for Compressive Strength of Molded Soil-
Cement Cylinders” American Society for Testing and Materials, USA.
ASTM D2166, “Standard Test Method for Unconfined Compressive Strength of
Cohesive Soil” American Society for Testing and Materials, USA.
ASTM D4318-10, “Standard Test Methods for Liquid Limit, Plastic Limit, and
Plasticity Index of Soils” American Society for Testing and Materials,
USA.
ASTM D559-03, “Standard Test Methods for Wetting and Drying Compacted Soil-
Cement Mixtures” American Society for Testing and Materials, USA.
ASTM D560-03, “Standard Test Methods for Freezing and Thawing Compacted
Soil-Cement Mixtures” American Society for Testing and Materials,
USA.
ASTM D7380 - 08, “Standard Test Method for Soil Compaction Determination at
Shallow Depths Using 5-lb (2.3 kg) Dynamic Cone Penetrometer”
American Society for Testing and Materials, USA.
Babu, S., Vasudevan, K. 2008: Strength and stiffness response of coir fiber-
reinforced tropical soil, Civil Engineering ASCE; 571–7.
Bell, F.G. 2000: Engineering Treatment of Soils, Taylor & Francis group, London,
UK.
Bosscher, P. J., Edil, T. B., Kuraoka, S. 1997: “Design of Highway Embankments
Using Tire Chips,” Journal of Geotechnical and Geoenvironmental
Engineering, 123, 295-304, USA.
Das, B. 1997: Soil Mechanics Laboratory Manual, Oxford University Press, UK.
Das, B. 2007: Principles of Foundation Engineering, 6th Edition, Thomson Learning.
Dixon, N. 1998: Geotechnical Engineering of Landfills, First Edition, Thomas
Telford publication.

102
Drumm, E.C., Boateng-Poku, Y., and Johnson Pierce, T. 1990: Estimation of
subgrade resilient modulus from standard tests, Journal of
Geotechnical Engineering, Vol. 116, No. 5, pp. 774-789.
Erol, B. 2008: Atık Maddelerin Yol İnşaatlarında Temel Malzemesi Olarak
Kullanımı,” İstanbul Teknik Üniversitesi, Fen Bilimleri Enstitüsü,
Yüksek Lisans Tezi, İstanbul.
Guang-Xin, L., Yun-Min, C., Xiao-Wu, T. 2008: Geosynthetics in Civil and
Environmental Engineering: Geosynthetics Asia 2008 Proceedings of
the 4th Asian Regional Conference on Geosynthetics in Shanghai,
China.
Halstead, G. 1986: Use of fly ash in concrete, NCHRP 127 (October), Washington:
Transportation Research Board, National Research Council.
Halstead, G. 2011: Cement-Modified Soil for Long Lasting Pavements, Annual
Conference of the Transportation Association of Canada, Edmonton,
Alberta 2011.
Helmuth, R. 1987: Fly Ash in Cement and Concrete, Portland Cement Association
publications
Ibanez, J. 2007: Environmental Chemistry: Fundamentals, Springer publications.
James, W. 2004: Practical Handbook of Grouting: Soil, Rock, and Structures,
Hoboken, N.J. publications.
Jiang, H., Cai, Y., Liu, J. 2010: Engineering Properties of Soils Reinforced by Short
Discrete Polypropylene Fiber, Journal of Materials in Civil
Engineering, ASCE, USA.
Johnson, P. E., Card, G.B. 1998: The Use of Soil Nails for the Construction and
Repair of Retaining Walls, Thomas Telford publication.
Kamon, M., and Bergardo, D.T. 1992: Ground improvement techniques, Proc. 9th
Asian Regional Conference on soil mechanics and foundation
engineering, Bangkok, Vol. 2.
Khedari, J., Watsanasathaporn, P., Hirunlabh, J. 2005: Development of fiber-
based soil–cement block with low thermal conductivity.”, Cement
Concrete Composision:111–6.
Koerner, R. 2005: Designing with geosynthetics, Pearson Prentice Hall.
Kowaski, T., Starry, D. 2007: Modern Soil Stabilization Techniques, Annual
Conference of the Transportation Association of Canada.
Kumar, A., Walia, B. S., Bajaj, A. 2007: Influence of Fly Ash, Lime and Polyester
Fibers on Compaction and Strength Properties of Expansive Soil,”
Journal of Materials in Civil Engineering, ASCE, USA.
Li, Z., Chen, Y., Gong, J. 2010. Rapid Curing Technology of Lime – Fly Ash
Stabilized Macadam, Integrated Transportation Systems, ASCE, USA.
Ling, I., Leshchinsky, D., Tatsuoka, F. 2003: Reinforced soil engineering:
advances in research and practice, Marcel Dekker Inc.

103
Little, D. N. 1995: Handbook for Stabilization of Pavement Subgrades and Base
Courses with Lime, The National Lime Association, Kendall/Hunt
Pub. Co., Dubuque, Iowa, USA.
Mattone R. 2005: Sisal fibre reinforced soil with cement or cactus pulp in bahareque
technique. Cement Concrete Composision; 611–6.
Mcgown A, Andrawes Z, Hasani M. 1978: Effect of inclusion properties on the
behavior of sand Geotechnique.
Murray, J., Frost, D., Wang, Y. 2000: The behavior of sandy soil reinforced with
discontinuous fiber inclusions.
Powrie, W. 2004: Soil Mechanics: Concepts and Applications, Second Edition, Spon
Press.
Puppala, A., Huang, J., Han, J., Hoyos, L. 2010: Ground Improvement and
Geosynthetics, American society of civil engineering (ASCE)
publication.
Qubain, B. 2000: Incorporating Subgrade Lime Stabilization into Pavement Desig,
Transportation Research Board Meeting.
Raison, C. (2004). Ground And Soil Improvement, First edition,Thomas Telford
publication.
Rawas, A., Goosen, M. 2006: Expansive Soils: Recent Advances in Characterization
and Treatment, Taylor & Francis group, London, UK.
Reuben, R. 2005: Chemical Grouting and Soil Stabilization, Marcel Dekker Inc.
Savastano, H., Warden, G., Coutts, P. 2000: Brazilian waste fibers as
reinforcement for cement-based composites. Cement Concrete
Compos 379–84.
Segetin, M., Jayaraman, K., Xu, X. 2007: Reinforcement of soil–cement building
materials: manufacturability and properties. Build Environment 066–
79.
Şenol, A., Edil, T. B., Acosta, H., A., Benson., C. H. 2003: Soft Subgrades
Stabilization by Using Various Fly Ashes, Resources, Conservation
and Recycling, vol.46, p.p. 365-376.
Tang C, Shi B, Gao W, Chen F, Cai Y. 2007: Strength and mechanical behavior of
short polypropylene fiber reinforced and cement stabilized clayey soil.
TRANSPORTATION RESEARCH BOARD (TRB) 1987: State-of-the-Art
Report: Lime Stabilization Research, Properties, Design, and
Construction, National Research Council, Washington, DC, USA.
Wilson, S. 1950: Small Soil Compaction Apparatus Duplicates Field Results
Closely,” Engineering News Record.
Url <http://foundation.azrm.net>.
Url <http://www.instantel.com>.
Url <http://www.tencate.com>.

104

105
APPENDICES
APPENDIX A : Results of Harvard miniature compaction tests

106
APPENDIX A.1
Figure A.1 : High plasticity clay soil, wopt: 27%, γdmax: 15.00 kN/m3.
Figure A.2 : CH + 5% Fly ash,; wopt: 24%, γdmax: 15.60 kN/m3.
13.4
13.6
13.8
14
14.2
14.4
14.6
14.8
15
15.00 20.00 25.00 30.00 35.00 40.00
Dry
Un
it W
eigh
t (k
N/m
³)
Water Content (%)
13.00
13.50
14.00
14.50
15.00
15.50
16.00
15.00 20.00 25.00 30.00 35.00
Dry
Un
it W
eigh
t (k
N/m
³)
Water Content (%)

107
Figure A.3 : CH +10% Fly ash,; wopt: 24%, γdmax: 15.60 kN/m3.
Figure A.4 : CH + 15% Fly ash,; wopt: 25%, γdmax: 15.50 kN/m3.
13
13.5
14
14.5
15
15.5
16
15.00 20.00 25.00 30.00 35.00 40.00
Dry
Un
it W
eigh
t (k
N/m
³)
Water Content (%)
13.00
13.50
14.00
14.50
15.00
15.50
16.00
15.00 20.00 25.00 30.00 35.00
Dry
Un
it W
eigh
t (k
N/m
³)
Water Content (%)

108
Figure A.5 : CH + 0.25% PP; wopt: 26%, γdmax: 14.60 kN/m3.
Figure A.6 : CH + 0.50% PP; wopt: 25%, γdmax: 14.50 kN/m3.
13.00
13.50
14.00
14.50
15.00
20.00 25.00 30.00 35.00
Dry
Un
it W
eigh
t (k
N/m
³)
Water Content (%)
13
13.5
14
14.5
15
20.00 25.00 30.00 35.00
Dry
Un
it W
eigh
t (k
N/m
³)
Water Content (%)

109
Figure A.7 : CH + 0.75% PP; wopt: 25%, γdmax: 14.50 kN/m3.
Figure A.8 : CH + 1.00% PP; wopt: 26%, γdmax: 14.60 kN/m3.
12.00
12.50
13.00
13.50
14.00
14.50
15.00
15.00 20.00 25.00 30.00 35.00 40.00
Dry
Un
it W
eig
ht
(kN
/m³)
Water Content (%)
13.00
13.50
14.00
14.50
15.00
15.00 20.00 25.00 30.00 35.00 40.00
Dry
Un
it W
eigh
t (k
N/m
³)
Water Content (%)
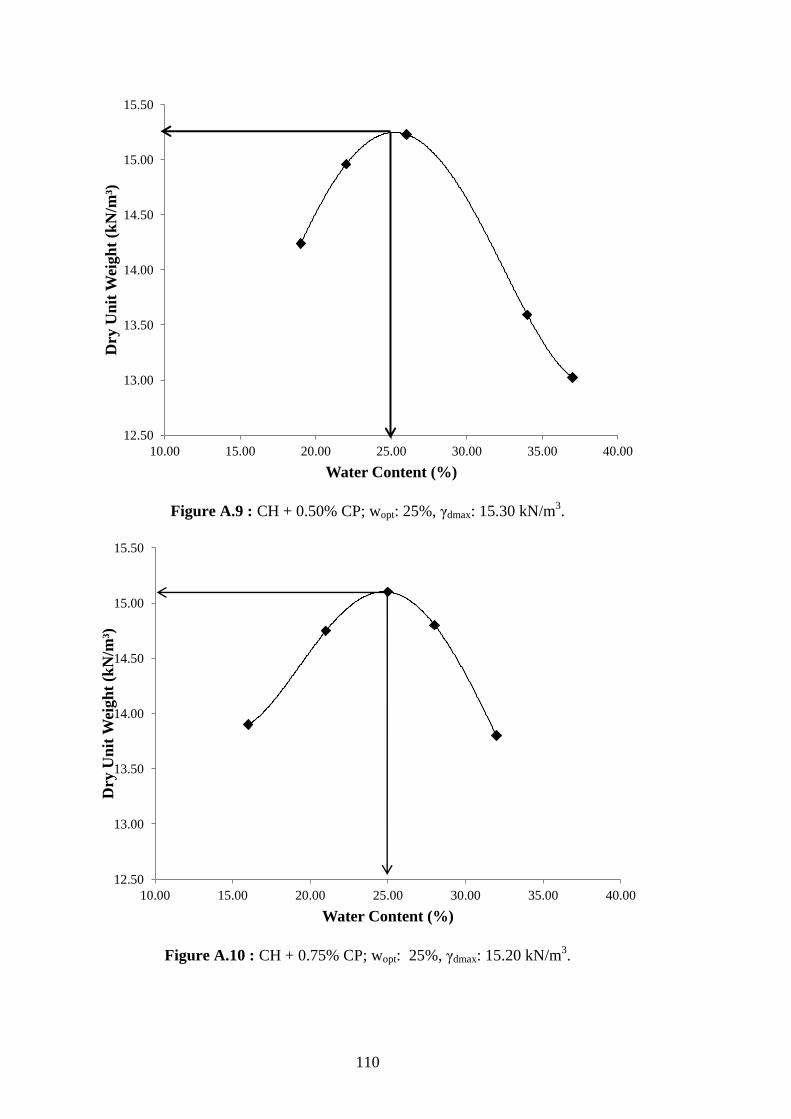
110
Figure A.9 : CH + 0.50% CP; wopt: 25%, γdmax: 15.30 kN/m3.
Figure A.10 : CH + 0.75% CP; wopt: 25%, γdmax: 15.20 kN/m3.
12.50
13.00
13.50
14.00
14.50
15.00
15.50
10.00 15.00 20.00 25.00 30.00 35.00 40.00
Dry
Un
it W
eigh
t (k
N/m
³)
Water Content (%)
12.50
13.00
13.50
14.00
14.50
15.00
15.50
10.00 15.00 20.00 25.00 30.00 35.00 40.00
Dry
Un
it W
eigh
t (k
N/m
³)
Water Content (%)

111
Figure A.11 : CH + 1.00% CP; wopt: 27%, γdmax: 15.00 kN/m3.
Figure A.12 : CH + 1.25% CP; wopt: 27%, γdmax: 15.00 kN/m3.
12.00
12.50
13.00
13.50
14.00
14.50
15.00
15.50
10.00 15.00 20.00 25.00 30.00 35.00 40.00 45.00
Dry
Un
it W
eigh
t (k
N/m
³)
Water Content (%)
12.50
13.00
13.50
14.00
14.50
15.00
15.50
10.00 15.00 20.00 25.00 30.00 35.00 40.00
Dry
Un
it W
eig
ht
(kN
/m³)
Water Content (%)

112
Figure A.13 : CH + 0.25% VHP; wopt: 17%, γdmax: 16.80 kN/m3.
Figure A.14 : CH + 0.50% VHP; wopt: 18%, γdmax: 16.10 kN/m3.
15.00
15.50
16.00
16.50
17.00
17.50
5.00 10.00 15.00 20.00 25.00
Dry
Un
it W
eigh
t (k
N/m
³)
Water Content (%)
15.00
15.20
15.40
15.60
15.80
16.00
16.20
10.00 15.00 20.00 25.00
Dry
Un
it W
eigh
t (k
N/m
³)
Water Content (%)

113
Figure A.15 : CH + 0.75% VHP; wopt: 23%, γdmax: 15.70 kN/m3.
Figure A.16 : CH + 1.00% VHP; wopt: 24%, γdmax: 15.40 kN/m3.
12.00
12.50
13.00
13.50
14.00
14.50
15.00
15.50
16.00
10.00 15.00 20.00 25.00 30.00 35.00 40.00
Dry
Un
it W
eigh
t (k
N/m
³)
Water Content (%)
13.00
13.50
14.00
14.50
15.00
15.50
16.00
15.00 20.00 25.00 30.00 35.00
Dry
Un
it W
eigh
t (k
N/m
³)
Water Content (%)

114
Figure A.17 : CH + 1.50% VHP; wopt: 25%, γdmax: 15.10 kN/m3.
Figure A.18 : CH + 0.25% PP +10% Fly ash; wopt: 26%, γdmax: 14.80 kN/m3.
13.00
13.50
14.00
14.50
15.00
15.50
20.00 25.00 30.00
Dry
Un
it W
eigh
t (g
/cm
³)
Water Content (%)
12.5
13
13.5
14
14.5
15
15.5
10.00 15.00 20.00 25.00 30.00 35.00 40.00
Dry
Un
it W
eigh
t (k
N/m
³)
Water Content (%)

115
Figure A.19 : CH + 0. 50% PP +10% Fly ash; wopt: 25%, γdmax: 15.10 kN/m3.
Figure A.20 : CH + 0.75% PP+10% Fly ash; wopt: 24%, γdmax: 15.00 kN/m3.
13.00
13.50
14.00
14.50
15.00
15.50
15.00 20.00 25.00 30.00 35.00
Dry
Un
it W
eig
ht
(kN
/m³)
Water Content (%)
13.50
14.00
14.50
15.00
15.50
15.00 20.00 25.00 30.00 35.00
Dry
Un
it W
eigh
t (k
N/m
³)
Water Content (%)

116
Figure A.21 : CH + 1.00% PP+10% Fly ash; wopt: 24%, γdmax: 15.10 kN/m3.
Figure A.22 : CH +0.75% CP + 10% Fly ash; wopt: 24%, γdmax: 15.20 kN/m3.
13.00
13.50
14.00
14.50
15.00
15.50
15.00 20.00 25.00 30.00 35.00
Dry
Un
it W
eigh
t (k
N/m
³)
Water Content (%)
13.00
13.50
14.00
14.50
15.00
15.50
15.00 20.00 25.00 30.00 35.00
Dry
Un
it W
eigh
t (k
N/m
³)
Water Content (%)

117
Figure A.23 : CH +1.00% CP + 10% Fly ash; wopt: 23%, γdmax: 14.90 kN/m3.
Figure A.24 : CH +1.25% CP + 10% Fly ash; wopt: 23%, γdmax: 14.90 kN/m3.
13.00
13.50
14.00
14.50
15.00
15.50
15.00 20.00 25.00 30.00
Dry
Un
it W
eigh
t (k
N/m
³)
Water Content (%)
13
13.5
14
14.5
15
15.5
10.00 15.00 20.00 25.00 30.00 35.00
Dry
Un
it W
eigh
t (k
N/m
³)
Water Content (%)

118
Figure A.25 : CH +0.25% VHP + 10% Fly ash; wopt: 13%, γdmax: 17.20 kN/m3.
Figure A.26 : CH +0.50% VHP + 10% Fly ash; wopt: 17%, γdmax: 16.70 kN/m3.
16.00
16.50
17.00
17.50
5.00 10.00 15.00 20.00
Dry
Un
it W
eigh
t (k
N/m
³)
Water Content (%)
15.00
15.50
16.00
16.50
17.00
10.00 15.00 20.00 25.00
Dry
Un
it W
eigh
t (k
N/m
³)
Water Content (%)

119
Figure A.27 : CH +0.75% VHP + 10% Fly ash; wopt: 21%, γdmax: 15.80 kN/m3.
Figure A.28 : Low plasticity clay soil, wopt: 25%, γdmax: 15.30 kN/m3.
14.00
14.50
15.00
15.50
16.00
10.00 15.00 20.00 25.00 30.00
Dry
Un
it W
eigh
t (k
N/m
³)
Water Content (%)
14.00
14.50
15.00
15.50
10.00 15.00 20.00 25.00 30.00 35.00
Dry
Un
it W
eigh
t (k
N/m
³)
Water Content (%)

120
Figure A.29 : CL + 5% Fly ash,; wopt: 23%, γdmax: 16.20 kN/m3.
Figure A.30 : CL +10% Fly ash,; wopt: 22%, γdmax: 16.50 kN/m3.
14.00
14.50
15.00
15.50
16.00
16.50
15.00 20.00 25.00 30.00 35.00
Dry
Un
it W
eigh
t (k
N/m
³)
Water Content (%)
15.00
15.50
16.00
16.50
17.00
15.00 20.00 25.00 30.00
Dry
Un
it W
eigh
t (k
N/m
³)
Water Content (%)
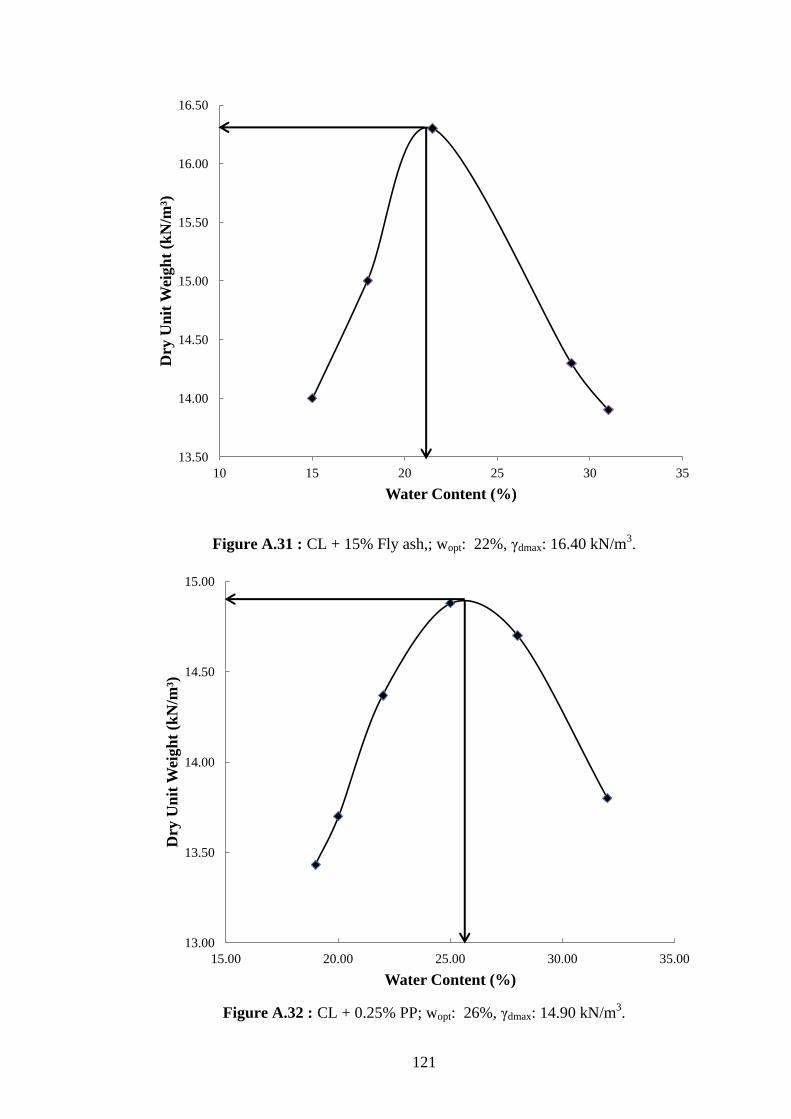
121
Figure A.31 : CL + 15% Fly ash,; wopt: 22%, γdmax: 16.40 kN/m3.
Figure A.32 : CL + 0.25% PP; wopt: 26%, γdmax: 14.90 kN/m3.
13.50
14.00
14.50
15.00
15.50
16.00
16.50
10 15 20 25 30 35
Dry
Un
it W
eigh
t (k
N/m
³)
Water Content (%)
13.00
13.50
14.00
14.50
15.00
15.00 20.00 25.00 30.00 35.00
Dry
Un
it W
eigh
t (k
N/m
³)
Water Content (%)
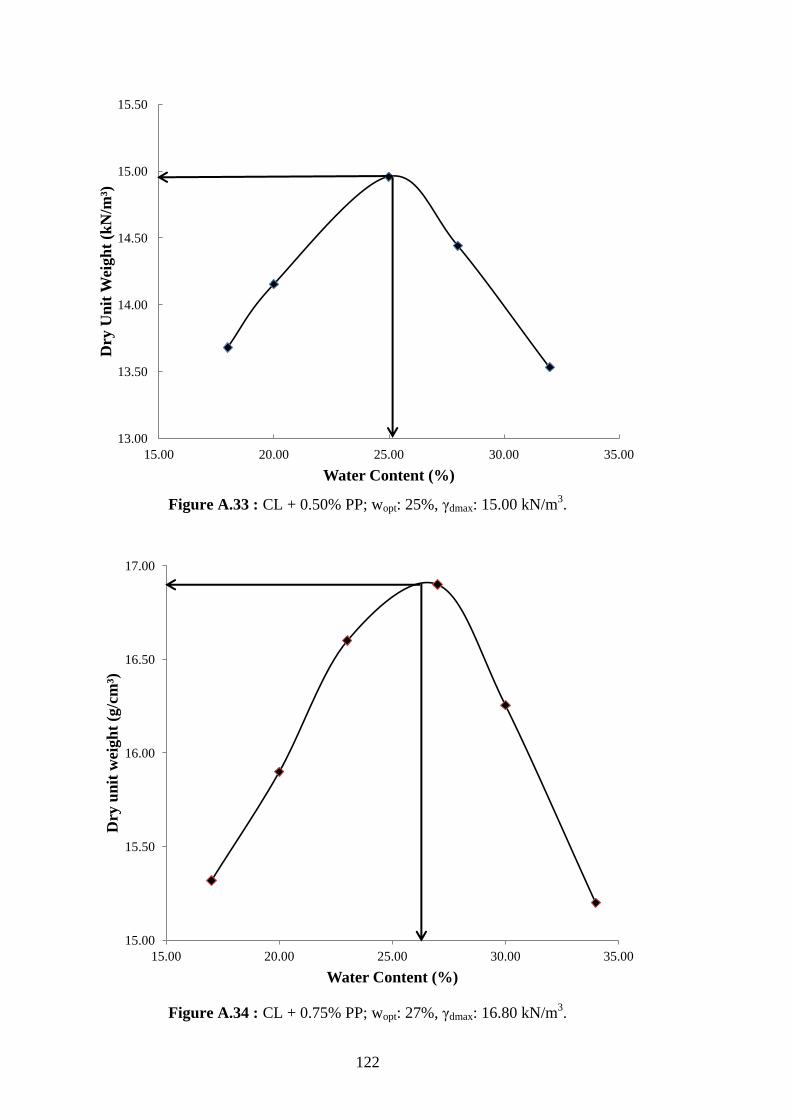
122
Figure A.33 : CL + 0.50% PP; wopt: 25%, γdmax: 15.00 kN/m3.
Figure A.34 : CL + 0.75% PP; wopt: 27%, γdmax: 16.80 kN/m3.
13.00
13.50
14.00
14.50
15.00
15.50
15.00 20.00 25.00 30.00 35.00
Dry
Un
it W
eigh
t (k
N/m
³)
Water Content (%)
15.00
15.50
16.00
16.50
17.00
15.00 20.00 25.00 30.00 35.00
Dry
un
it w
eigh
t (g
/cm
³)
Water Content (%)

123
Figure A.35 : CL + 1.00% PP; wopt: 25%, γdmax: 17.20 kN/m3.
Figure A.36 : CL + 0.50% CP; wopt: 25%, γdmax: 15.30 kN/m3.
15.50
16.00
16.50
17.00
17.50
15.00 20.00 25.00 30.00 35.00
Dry
Un
it W
eigh
t (k
N/m
³)
Water Content (%)
15.00
15.50
16.00
16.50
17.00
15.00 20.00 25.00 30.00 35.00
Dry
Un
it W
eigh
t (k
N/m
³)
Water Content (%)

124
Figure A.37 : CL + 0.75% CP; wopt: 25%, γdmax: 16.90 kN/m3.
Figure A.38 : CL + 1.00% CP; wopt: 27%, γdmax: 15.00 kN/m3.
15.00
15.50
16.00
16.50
17.00
17.50
15.00 20.00 25.00 30.00 35.00
Dry
Un
it W
eigh
t (k
N/m
³)
Water Content (%)
12.00
12.50
13.00
13.50
14.00
14.50
15.00
15.50
10.00 15.00 20.00 25.00 30.00 35.00 40.00 45.00
Dry
Un
it W
eigh
t (k
N/m
³)
Water Content (%)

125
Figure A.39 : CL + 1.25% CP; wopt: 27%, γdmax: 15.30 kN/m3.
Figure A.40 : CL + 0.25% VHP; wopt: 22%, γdmax: 16.10 kN/m3.
14.00
14.50
15.00
15.50
15.00 20.00 25.00 30.00 35.00
Dry
Un
it W
eigh
t (k
N/m
³)
Water content (%)
13.00
13.50
14.00
14.50
15.00
15.50
16.00
16.50
15 20 25 30 35
Dry
Un
it W
eigh
t (k
N/m
³)
Water Content (%)

126
Figure A.41 : CL + 0.50% VHP; wopt: 27%, γdmax: 15.60 kN/m3.
Figure A.42 : CL + 0.75% VHP; wopt: 27%, γdmax: 15.40 kN/m3.
14.00
14.50
15.00
15.50
16.00
15 20 25 30
Dry
Un
it W
eigh
t (k
N/m
³)
Water Content (%)
13.50
14.00
14.50
15.00
15.50
16.00
15 20 25 30 35 40
Dry
Un
it W
eig
ht
(kN
/m³)
Water Content (%)

127
Figure A.43 : CL + 1.00% VHP; wopt: 25%, γdmax: 15.20 kN/m3.
Figure A.44 : CL + 1.50% VHP; wopt: 28%, γdmax: 14.60 kN/m3.
13.50
14.00
14.50
15.00
15.50
15 20 25 30 35
Dry
Un
it W
eigh
t (k
N/m
³)
Water Content (%)
13.00
13.50
14.00
14.50
15.00
15 20 25 30 35 40
Dry
Un
it W
eigh
t (k
N/m
³)
Water Content (%)

128
Figure A.45 : CL+ 0.25% PP; wopt: 26%, γdmax: 14.80 kN/m3.
Figure A.46 : CL + 0.50% PP +10% Fly ash; wopt: 24%, γdmax: 15.10 kN/m3.
13.00
13.50
14.00
14.50
15.00
15.50
10.00 15.00 20.00 25.00 30.00
Dry
Un
it W
eigh
t (k
N/m
³)
Water Content (%)
13.00
13.50
14.00
14.50
15.00
15.50
15.00 20.00 25.00 30.00
Dry
Un
it W
eigh
t (k
N/m
³)
Water Content (%)
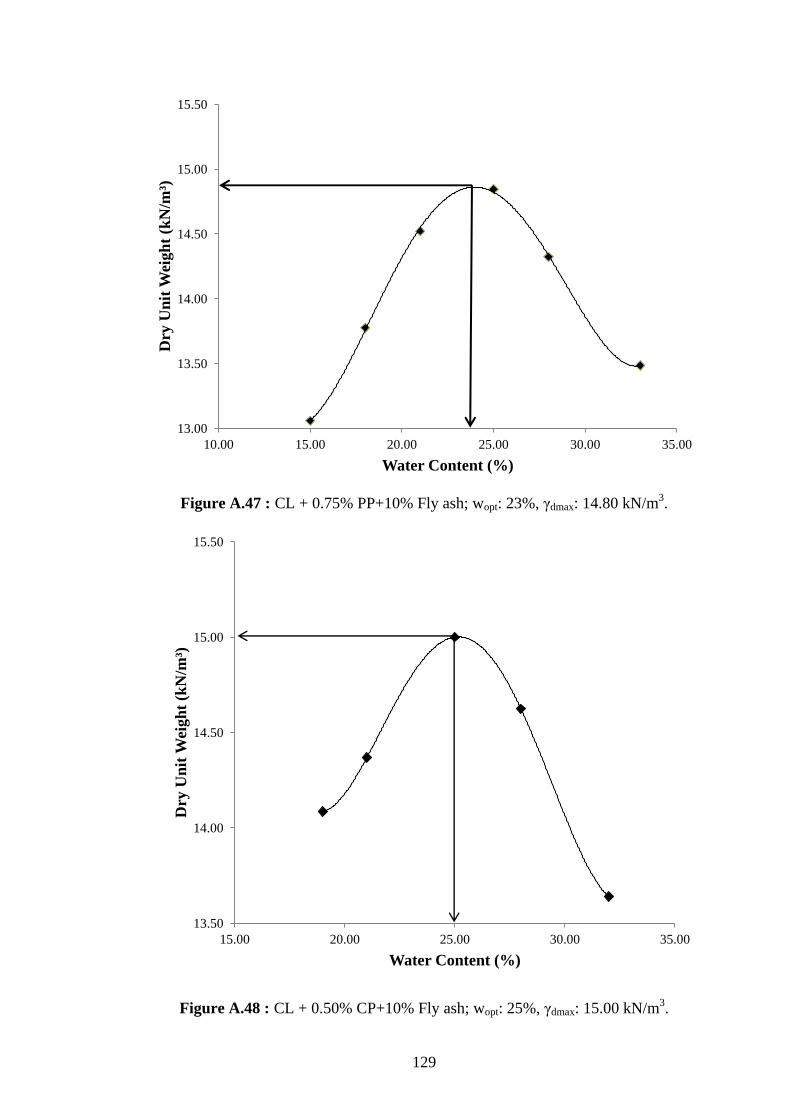
129
Figure A.47 : CL + 0.75% PP+10% Fly ash; wopt: 23%, γdmax: 14.80 kN/m3.
Figure A.48 : CL + 0.50% CP+10% Fly ash; wopt: 25%, γdmax: 15.00 kN/m3.
13.00
13.50
14.00
14.50
15.00
15.50
10.00 15.00 20.00 25.00 30.00 35.00
Dry
Un
it W
eigh
t (k
N/m
³)
Water Content (%)
13.50
14.00
14.50
15.00
15.50
15.00 20.00 25.00 30.00 35.00
Dry
Un
it W
eigh
t (k
N/m
³)
Water Content (%)

130
Figure A.49 : CL +0.75% CP + 10% Fly ash; wopt: 25%, γdmax: 15.00 kN/m3.
Figure A.50 : CH +1.00% CP + 10% Fly ash; wopt: 25%, γdmax: 15.20 kN/m3.
13.00
13.50
14.00
14.50
15.00
15.50
15.00 20.00 25.00 30.00 35.00
Dry
Un
it W
eig
ht
(kN
/m³)
Water Content (%)
13.00
13.50
14.00
14.50
15.00
15.50
15.00 20.00 25.00 30.00 35.00
Dry
Un
it W
eigh
t (k
N/m
³)
Water Content (%)

131
Figure A.51 : CL +1.25% CP + 10% Fly ash; wopt: 28%, γdmax: 14.70 kN/m3.
Figure A.52 : CL +0.25% VHP + 10% Fly ash; wopt: 12%, γdmax: 17.00 kN/m3.
13.00
13.50
14.00
14.50
15.00
15.00 20.00 25.00 30.00 35.00 40.00
Dry
Un
it W
eigh
t (k
N/m
³)
Water Content (%)
12.00
13.00
14.00
15.00
16.00
17.00
18.00
0.00 5.00 10.00 15.00 20.00
Dry
Un
it W
eigh
t (k
N/m
³)
Water Content (%)

132
Figure A.53 : CL +0.50% VHP + 10% Fly ash; wopt: 13%, γdmax: 16.20 kN/m3.
Figure A.54 : CL +0.75% VHP + 10% Fly ash; wopt: 17%, γdmax: 15.70 kN/m3.
14.00
14.50
15.00
15.50
16.00
16.50
5.00 10.00 15.00 20.00 25.00
Dry
Un
it W
eigh
t (k
N/m
³)
Water Content (%)
11.50
12.00
12.50
13.00
13.50
14.00
14.50
15.00
15.50
16.00
5.00 10.00 15.00 20.00 25.00 30.00
Dry
Un
it W
eigh
t (k
N/m
³)
Water Content (%)

133
CURRICULUM VITAE
Name Surname: Ehsan ETMINAN
Place and Date of Birth: URMIA/ 24, November, 1984
Address: No.24, Behdari Ave, Koye Dadgostary, Urmia, Iran
E-Mail: [email protected]
B.Sc.: Urmia University/ Civil Engineering
PUBLICATIONS/PRESENTATIONS ON THE THESIS
ŞENOL, A., ETMINAN, E., OLGUN, G., (2012), “Stabilization of Clayey
Soils Using Fly Ash and Homopolymerpolypropylene” ASCE’s Geo-
Congress, State of the Art and Practice in Geotechnical Engineering,
(Oakland, CA 2012).
ŞENOL, A., ETMINAN, E., OZUDOGRU, T. Y., YILDIRIM, H., (2011),
“Stabilization of A Low Plasticity Clay Soil by Alternative Materials”
International Symposium on Advances in Ground Technology Geo-
Information (IS-AGTG), Singapore.