Procedures conditioning the absorption/desorption behavior of cold-cured epoxy resins
Upload
independentCategory
view
1download
0
Melt Viscoelastic Properties of Peroxide CuredPolypropylene-Ethylene Octene CopolymerThermoplastic Vulcanizates
R. Rajesh Babu, Nikhil K. Singha, Kinsuk NaskarRubber Technology Centre, Indian Institute of Technology, Kharagpur 721302, India
The dynamic viscoelastic properties of uncrosslinkedand dynamically crosslinked blends of polypropylene(PP) and ethylene octene copolymer (EOC) wereinvestigated in the melt state to study the mecha-nism of reinforcement, influence of particle size, andkinetics of modulus recovery. Dynamic vulcanizationwas performed by coagent assisted peroxide cross-linking system. Addition of peroxide in PP/EOC blendinvolves two major competing reactions: crosslinkingin EOC and degradation of PP by b chain-scission. Inthis article, morphological and melt rheological prop-erties of the TPVs were studied with special refer-ence to the effect of mixing protocol. Three differentmixing techniques were investigated. They are: (i)conventional or preblending method—melt mixing ofPP and EOC followed by dynamic vulcanization (ii)phase mixing method—curative master batch of EOCadded on the molten PP (iii) split addition of PP—preblending method followed by addition of half partof PP (dilution procedure). The type of mixing proto-col has a significant influence on the rheologicalbehavior. Rheological properties have been evaluatedat the processing temperature (1808C) in a RubberProcess Analyzer (RPA 2000). A variety of rheologicalobservations such as Payne effect, modulus recoveryand shear rate sensitivity were studied by carryingout frequency and strain amplitude sweeps. POLYM.ENG. SCI., 50:455–467, 2010. ª 2009 Society of PlasticsEngineers
INTRODUCTION
Thermoplastic vulcanizates (TPVs) are prepared by the
dynamic vulcanization process, where crosslinking of an
elastomer takes place during its melt mixing with a
thermoplastic polymer under high shear. The resulting
morphology consists of micron sized finely dispersed
crosslinked rubbery particles in a continuous thermoplas-
tic matrix. TPVs have rubber like properties but can be
processed as thermoplastic using conventional thermo-
plastic processing equipments [1–3]. An extensive study
of the TPVs based on various rubber-plastic blends were
examined by Coran and Patel [4, 5]. In the present study,
polypropylene (PP) and ethylene octene copolymer
(EOC) based TPVs were prepared by coagent assisted
peroxide crosslinking system. With the addition of perox-
ide two competing reactions take place simultaneously:
crosslinking in EOC and chain scission of PP. The latter
causes lowering of molecular weight and narrow down
the molecular weight distribution, hence melt becomes
more Newtonian and viscoelasticity decreases. On the
contrary, crosslinking and chain branching occur in EOC
phase, which considerably change the viscoelastic proper-
ties. The mechanical and rheological properties of the
blends depend not only on the constituent polymers but
also on the morphology of the blend. TPVs consist of
densely packed crosslinked rubber particles in thermo-
plastic matrix and their rheological properties can be
compared to that of highly filled polymers [6]. Further-
more, rheological study provides valuable information
about the flow properties of the compound in the melt
processing equipments.
Goettler et al. [7] was the first to study about the
technical importance of the TPVs in terms of rheological
characteristics using a capillary rheometer. Han et al. [8]
described the comparative rheological study of PP, PP/
ethylene propylene diene rubber (EPDM) uncrosslinked
and dynamically crosslinked blends using various rheo-
logical instruments to measure steady shear flow, uniax-
ial extension, and oscillation flow properties of the com-
pounds. Steeman et al. [9] reported that TPVs have a
yield stress for flow and the value increases with
increase in elastomer component in TPVs. An extensive
study of rheological response of PP/EPDM blends and
the TPVs with phenolic resin as curing agent was
explored by Jain et al. [10]. Rheological properties of
various rubber-plastic uncrosslinked and dynamically
crosslinked blends with special reference to the effect of
blend ratio, shear rate, melt elasticity, and degree of
crosslinking have been interpreted and described by sev-
Correspondence to: Kinsuk Naskar; e-mail: [email protected]
Contract grant sponsor: Council of Scientific and Industrial Research
(CSIR), New Delhi, India.
DOI 10.1002/pen.21553
Published online in Wiley InterScience (www.interscience.wiley.com).
VVC 2009 Society of Plastics Engineers
POLYMER ENGINEERING AND SCIENCE—-2010

eral authors [11–13]. Katbab et al. [14, 15] discussed the
formation of morphology and correlated with the
mechanical and rheological properties for the nonrein-
forced and reinforced (carbon black and silica fillers)
TPVs. Chatterjee and Naskar [16] analyzed the rheologi-
cal response of nanosilica filled PP based TPVs. Rheo-
logical behavior of dynamically and statically vulcanized
blends of PP and styrene butadiene styrene triblock co-
polymer (SBS) with reference to the effect of various
curing agents was studied by Ichazo et al. [17]. The lin-
ear viscoelastic properties of PP/styrene ethylene butadi-
ene styrene block copolymer (SEBS) blends and PP/
EPDM TPVs are described in terms of composition ratio
and also discussed about the oil diffusion and distribu-
tion in the blend components by Sengers et al. [18].
Recently, Leblanc [19] studied the nonlinear viscoelastic
property of the various commercially available TPVs
with varying hardness by a Fourier transform rheometer
(FT-rheo) to get insight into the morphology developed
and the subtle role played by the extractible content such
as oil and plasticizers. Li and Kontopoulou [20] studied
the evolution of morphology and rheological response of
PP/EOC TPVs with peroxide as curing agent and corre-
lated with the gel point of the EOC phase. Generally,
coagents are multifunctional vinyl monomers, which are
highly reactive toward free radical either by addition
reaction and/or by hydrogen abstraction. Chain scission
also could be retarded by stabilizing the PP macroradi-
cals by addition reaction across the double bond in the
coagent. Our recent work had revealed the effect of dif-
ferent peroxides [21] and different coagents [22] on fixed
blend ratio of PP/EOC TPVs. Parent et al. [23] studied
the variation of molecular weight and branching distribu-
tion in PP obtained by the treatment of coagent assisted
peroxide. Furthermore, the obtained product architecture
was analyzed by the melt rheological characterization
such as oscillatory shear and extensional deformation.
Generally, the flow properties of the TPVs are influenced
by various factors such as polymer characteristics (mo-
lecular weight, molecular weight distribution, degree of
branching), crosslinked dispersed particles (size, degree
of dispersion, crosslink density), interfacial interaction
and the processing conditions.
In our previous paper [24], mechanical properties
and morphology of the TPVs prepared by three different
mixing protocols were investigated in detail. The
present article aims to understand the melt viscoelastic
property and modulus recovery in molten TPVs
prepared by three different methods. The morphology
of various TPVs was correlated with the observed
dynamic rheological response. Initially, the discussion is
focused on the fixed concentration (optimized concentra-
tion: 2 phr) of curative in TPVs in three different mixing
methods. Furthermore, to get a better insight in the
reinforcement mechanism, the dependence of dynamic
functions was studied by varying the concentrations of
curative.
EXPERIMENTAL
Materials
The general purpose polyolefin elastomer Exact 5371
[specific gravity, 0.870 g/cm3 at 238C; comonomer
(octene) content 13%; melt flow index (MFI), 5.0 g/10
min @1908C/2.16 kg], was obtained from Exxon Mobil
Chemical Company. Polypropylene (PP; specific gravity,
0.9 g/cm3 at 238C; melt flow index, 3.0 g/10 min @
2308C/2.16 kg) was obtained from IPCL, India. Dicumyl
peroxide (DCP; Perkadox-BC-40B-PD) having an active
peroxide content of 40% was obtained from Akzo Nobel
Chemical Company, The Netherlands. Its half life time
(t1/2) at 1388C is 1 hr and specific gravity is 1.53 g/cm3
at 238C. The coagent, triallyl cyanurate SR 507A; (spe-
cific gravity, 1.12 g/cm3 at 238C) was obtained from Sar-
tomer Company.
Preparation of TPVs
All PP-EOC TPVs were prepared by melt blending of
the components in the Haake Rheomix 600 s at a temper-
ature of 1808C with a rotor speed of 70 rpm. The compo-
sition of PP/EOC TPVs employed in this study are shown
in Table 1. TPVs were prepared by three different mixing
methods, which were systematically represented in Fig. 1.
In all the mixing methods, time to perform the dynamic
vulcanization process was maintained for 4 min.
Prepared TPVs were designated as follow: the first let-
ter denotes the method by which the TPVs are prepared,
followed by the second letter and a number indicating the
type of peroxide and concentration of corresponding per-
oxide, respectively. For example, PD2 corresponds to the
composition of 2 phr concentration of dicumyl peroxide
prepared by phase mixing method. After mixing, the
blends were removed from the Haake chamber at hot con-
dition and sheeted out in a two roll mill at room tempera-
ture (258C) after a single pass. Sheets were then cut and
pressed in a compression molding machine (Moore Press,
Birmingham, UK) at 1908C for 4 min at 5 MPa pressure.
Aluminum foils were placed between the mold plates.
The molded sheets were then cooled down to room tem-
perature under the same pressure.
TABLE 1. Composition of TPVs.
Component Phr
Ethylene octene copolymer (EOC) 100
Polypropylene (PP) 50
Dicumyl peroxide (DCP) 0–5a (varied)
Triallyl cyanurate (TAC) 2.0
a Concentration of DCP was optimized at 2.0 phr [21], which corre-
sponds to 3 milliequivalents concentration.
456 POLYMER ENGINEERING AND SCIENCE—-2010 DOI 10.1002/pen

Gel Content
To estimate the degree of crosslinking in the EOC
phase in the TPVs prepared, the samples were subjected
to a series of solvent extraction. All the measurements
were done according to ASTM D 2765. About 2 g of
TPV sample were first extracted for 24 h in hot xylene at
808C to remove the uncrosslinked EOC phase and low
molecular weight PP fragments. It seemed to be a qualita-
tive estimation because of the restricted extraction of
EOC phase in the presence of PP phase. The samples was
completely dried after extraction and weighted. Then the
initial loss can be calculated from the
Xcð%Þ ¼ Wl
W0
� �� 100 (1)
where
Xc ¼ Percentage of residue after xylene extraction at
808CW0 ¼ Initial weight of the specimen and
Wl ¼ Weight after xylene extraction.
The dried sample was further extracted for 72 h in
boiling xylene at 1408C to completely remove the PP and
soluble EOC phase. The gel content can be calculated as
Gelð%Þ ¼ 100� ðWl �WhÞ �WPP
WEOC
� 100
� �(2)
where
Wl¼weight of the sample after xylene extraction at 808CWh ¼ weight of the sample after xylene extraction at
1408CWPP and WEOC ¼ weights of PP and EOC in the PP/
EOC TPVs, respectively.
Crosslink Density
Equilibrium solvent swelling measurements were car-
ried out on the PP/EOC TPVs to determine the crosslink
density of the EOC in presence of PP. The overall cross-
link density was calculated using the modified Flory-
Rehner equation [21, 25, 26]. From the degree of swelling,
the overall crosslink density was calculated relative to the
(EOC þ PP) phases and expressed as (m þ PP). The latter
was done in order to avoid the need to correct for a part of
the PP, being extracted as amorphous PP. A circular piece
of 2 mm thickness was made to swell in cyclohexane for
about 48 h to achieve equilibrium swelling condition. Ini-
tial weight, swollen weight, and de-swollen or dried
weight were measured and substituted in the Flory-Rehner
equation to get the values of crosslink density.
Morphology
Phase morphology of the cryofractured samples of var-
ious blends was investigated by a JEOL JSM 5800 Digital
FIG. 1. Schematic diagram of the preparation of thermoplastic vulcanizates by various methods.
DOI 10.1002/pen POLYMER ENGINEERING AND SCIENCE—-2010 457

Scanning Electron Microscope (SEM). All the blends
were cryofractured in liquid nitrogen to avoid any possi-
bility of phase deformation during cracking process. For
uncrosslinked PP/EOC blends, low melting temperature
EOC component was preferentially extracted by treating
in hot xylene at 708C for 30 min. For dynamically cross-
linked PP/EOC TPVs, uncrosslinked PP was preferentially
extracted by treating in hot xylene at 1208C for 60 min.
All the treated samples were dried under vacuum oven
at 708C for 5 h to remove the traces of solvents. The
dried samples were then gold sputtered and examined
under SEM.
Rheological Measurements
Melt rheological behavior of the TPVs were analyzed
in a Rubber Process Analyser (RPA 2000, Alpha Technol-
ogies) equipped with biconical dies. All the specimens
were directly loaded between the dies maintained at
1808C, and the test were carried out in both frequency
sweep and strain sweep mode.
Frequency Sweep. The frequency was logarithmically
increased from 0.33 to 33 Hz at a constant strain ampli-
tude of 5%. A strain of 5% was selected to ensure that
the rheological behavior was located in the linear visco-
elastic region.
Strain Sweep. The strain amplitude sweep was
performed from 1 to 1200% at a constant frequency of
0.5 Hz.
Modulus Recovery. To determine the recovery
kinetics, each sample underwent the following test
sequences: (a) frequency sweep, (b) strain sweep, (c)
relaxation time of 2 min, (d) frequency sweep, (e) strain
sweep, (f) relaxation time of 2 min, (g) frequency
sweep, and (h) strain sweep. All the tests were carried
at a temperature of 1808C. Average of three measure-
ments was reported for each sample. Similar sequences
were pursued by Osman and Atallah [27] in characteriz-
ing the viscoelastic property of calcium carbonate filled
polyethylene.
RESULTS AND DISCUSSION
Gel Content and Overall Crosslink Density
Variation in the gel content values and the overall
crosslink density values of TPVs with same concentration
of peroxide prepared by three different methods are
shown in the Table 2. Gel content was measured in two
stages for the samples prepared. In the first stage, PP was
extracted at 808C by hot xylene. It is believed that this
can extract uncrosslinked EOC phase along with very low
molecular weight PP fractions. During low temperature
extraction (808C) process, PP remains almost insoluble in
xylene (may be very low molecular weight species were
extracted out). However, at high temperature (1408C)soluble PP fractions are removed leaving only crosslinked
EOC gels. Maximum value of gel content is observed for
phase-mixed TPV and the least for preblended TPV at
both stages of extraction. The differences can be roughly
compared to the extent of crosslinking in the EOC phase.
It can be concluded that, higher gel content in the PD2
indicates that crosslinking reaction of the EOC proceeds
predominantly with less influence on the PP phase. Over-
all crosslink density values are in complete agreement
with the gel content measurements. In equilibrium solvent
swelling measurements, a significant contribution of both
the crosslinking in EOC phase and the degradation in PP
phase are coupled to give the values. This further con-
firms the limited extent of degradation in the PP phase
with the higher crosslinking degree in EOC phase for
PD2 TPV.
Morphology
A schematic representation of morphology evolution of
50/100 PP/EOC uncrosslinked and dynamically vulcan-
ized blends with same amount of peroxide prepared by
three different methods is shown in Fig. 2 and corre-
sponding SEM photomicrographs were shown in Fig. 3. It
is interesting to note that in uncrosslinked blend, EOC
forms the matrix phase with PP as dispersed one. During
dynamic vulcanization, phase inversion occurs, that is, PP
forms the matrix and crosslinked EOC form the dispersed
TABLE 2. Gel content and crosslink density of TPVs.
Compound name Xc(%)a Gel (%)bOverall crosslink
density (m þ PP) 3 1024 (mol/ml)cCrosslink
density (m) 3 1024 (mol/ml)d
CD2 78.3 6 0.6 39.3 6 1.1 2.27 6 0.25 1.55 6 0.2
PD2 97.2 6 0.8 60.8 6 1.2 5.24 6 0.3 1.55 6 0.2
SD2 90.5 6 1.0 55.5 6 1.0 3.57 6 0.2 1.55 6 0.2
a Percentage of residue after Xylene extract of TPVs at 808C.b Gel content after boiling xylene extract of TPVs at 1408C (on samples previously extracted at 808C temperature).c Equilibrium solvent swelling measurements in PP/EOC TPVs in cyclohexane at room temperature for 72 hr.d Crosslink density of only EOC with the same amount of peroxide as that in TPVs.
458 POLYMER ENGINEERING AND SCIENCE—-2010 DOI 10.1002/pen

phase. With the addition of peroxide, EOC gets cross-
linked and PP undergoes degradation. This leads to
increase in viscosity ratio, which plays an important role
in driving the morphology of TPVs. The less viscous PP
encapsulates the more viscous crosslinked EOC phase to
minimize the mixing energy. In this particular blend sys-
tem, proportion of EOC is twice than that of PP (50/100
PP/EOC), which results to form densely packed three-
dimensional network structure. These crosslinked EOC
particles are dispersed in the form of aggregates and/or
agglomerates in the PP matrix. Furthermore, these EOC
aggregates or agglomerates are embedded in the PP mac-
romolecules via joint shell mechanism or segmental inter-
diffusion mechanism [14, 15, 28, 29, 30]. Addition of
curative (peroxide and coagent) in PP/EOC blends results
to give several reactions: crosslinking in EOC, degrada-
tion in PP, generation of in situ graft copolymer, limited
extend of crosslinking in PP phase and formation of
branched PP chains. However different methods have
their own influence on the aforementioned reactions
which had been discussed in detail in one of our earlier
communications [24]. Among the three different methods
employed at equal concentration of curative dosage, the
efficiency of crosslinking in the EOC phase apparently
has an important effect on the evolution of morphology,
i.e., the particle size. The finest particle size (better mor-
phology) was observed for PD2 whilst CD2 exhibits the
largest rubber particles (see Fig. 3). This may be attrib-
uted due to the high degree of crosslinking in EOC with
minor effect on PP phase in the PD2. In contrast, smaller
particle size is associated with higher surface area having
higher probability of adsorption of PP chains on their sur-
face. The PP chains are adsorbed on the surface of cross-
linked EOC domains via physical and/or chemical bond-
ing. Within measurement accuracy, no clear distinction
between the particle size of PD2 and SD2 is seen. How-
ever, PD2 seems to exhibit somewhat lower particle size
than SD2 at this particular concentration of peroxide. The
morphological evolutions are in agreement with the gel
content and overall crosslink density values.
Rheological Properties
Strain Dependence of Viscoelastic Behavior. Strain
sweep test was carried out to characterize the strain de-
FIG. 2. Schematic representation of morphology evolution of dynami-
cally vulcanized blends prepared by different methods.
FIG. 3. Scanning electron photomicrograph of uncrosslinked and dynamically vulcanized blends at 2 phr
concentration of DCP. (a) Uncrosslinked. (b) Preblending method. (c) Phase mixing method. (d) Split addi-
tion method.
DOI 10.1002/pen POLYMER ENGINEERING AND SCIENCE—-2010 459
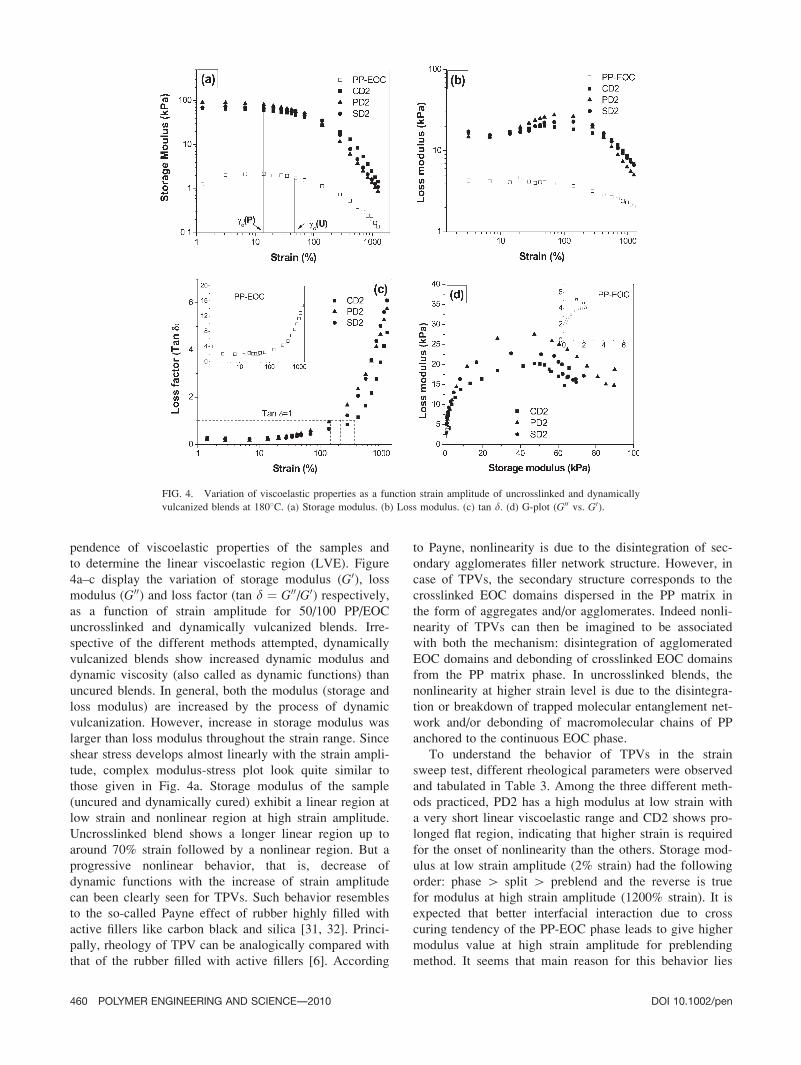
pendence of viscoelastic properties of the samples and
to determine the linear viscoelastic region (LVE). Figure
4a–c display the variation of storage modulus (G0), lossmodulus (G00) and loss factor (tan d ¼ G00/G0) respectively,as a function of strain amplitude for 50/100 PP/EOC
uncrosslinked and dynamically vulcanized blends. Irre-
spective of the different methods attempted, dynamically
vulcanized blends show increased dynamic modulus and
dynamic viscosity (also called as dynamic functions) than
uncured blends. In general, both the modulus (storage and
loss modulus) are increased by the process of dynamic
vulcanization. However, increase in storage modulus was
larger than loss modulus throughout the strain range. Since
shear stress develops almost linearly with the strain ampli-
tude, complex modulus-stress plot look quite similar to
those given in Fig. 4a. Storage modulus of the sample
(uncured and dynamically cured) exhibit a linear region at
low strain and nonlinear region at high strain amplitude.
Uncrosslinked blend shows a longer linear region up to
around 70% strain followed by a nonlinear region. But a
progressive nonlinear behavior, that is, decrease of
dynamic functions with the increase of strain amplitude
can been clearly seen for TPVs. Such behavior resembles
to the so-called Payne effect of rubber highly filled with
active fillers like carbon black and silica [31, 32]. Princi-
pally, rheology of TPV can be analogically compared with
that of the rubber filled with active fillers [6]. According
to Payne, nonlinearity is due to the disintegration of sec-
ondary agglomerates filler network structure. However, in
case of TPVs, the secondary structure corresponds to the
crosslinked EOC domains dispersed in the PP matrix in
the form of aggregates and/or agglomerates. Indeed nonli-
nearity of TPVs can then be imagined to be associated
with both the mechanism: disintegration of agglomerated
EOC domains and debonding of crosslinked EOC domains
from the PP matrix phase. In uncrosslinked blends, the
nonlinearity at higher strain level is due to the disintegra-
tion or breakdown of trapped molecular entanglement net-
work and/or debonding of macromolecular chains of PP
anchored to the continuous EOC phase.
To understand the behavior of TPVs in the strain
sweep test, different rheological parameters were observed
and tabulated in Table 3. Among the three different meth-
ods practiced, PD2 has a high modulus at low strain with
a very short linear viscoelastic range and CD2 shows pro-
longed flat region, indicating that higher strain is required
for the onset of nonlinearity than the others. Storage mod-
ulus at low strain amplitude (2% strain) had the following
order: phase [ split [ preblend and the reverse is true
for modulus at high strain amplitude (1200% strain). It is
expected that better interfacial interaction due to cross
curing tendency of the PP-EOC phase leads to give higher
modulus value at high strain amplitude for preblending
method. It seems that main reason for this behavior lies
FIG. 4. Variation of viscoelastic properties as a function strain amplitude of uncrosslinked and dynamically
vulcanized blends at 1808C. (a) Storage modulus. (b) Loss modulus. (c) tan d. (d) G-plot (G00 vs. G0).
460 POLYMER ENGINEERING AND SCIENCE—-2010 DOI 10.1002/pen
in the morphology developed and the particle size of the
dispersed phase. In case of filled polymer system, there is
a direct consequence of the particle size and filler net-
working (magnitude of aggregates and agglomerates).
This is due to the fact that the smaller the particle, the
smaller is the inter-aggregate distance and hence higher is
the probability towards the formation of filler network.
It was observed that deviation from the linear visco-
elastic behavior of TPVs starts at lower strain than
uncrosslinked blends. Transition point in the region where
the linear to nonlinear viscoelastic behavior starts is
defined as critical strain amplitude (cc) and for uniformity
it may be taken as the strain value at the storage modulus
equal to 90% of the initial storage modulus (0.9 G00). It is
clear from the Fig. 4a and Table 3, phase mixed TPV
shows lower critical strain amplitude followed by split
addition and preblending TPV. It can be stated generally
that presence of secondary clusters increase the modulus
and enhance the nonlinearity.
Strain dependency of loss modulus (viscous modulus)
of uncrosslinked and dynamically crosslinked blends is
presented in Fig. 4b. In contrast to the G0 behavior of
TPVs, G00 shows a maximum at the critical strain ampli-
tude region whereas uncrosslinked blends is indeed linear
at low strain region followed by decrease in loss modulus
value with increasing deformation. Dependence of loss
modulus on strain amplitude depends on the rates of net-
work breakdown and reformation as well as sliding of
macrochains at the domain surface. The magnitude of loss
maxima are substantially emphasized for the phase mixed
TPVs. It may be related to the energy dissipation pro-
duced by the breakdown of crosslinked EOC aggregates
[32].
By definition, loss factor tan d is determined by both
loss and storage moduli (tan d ¼ G00/G0). Uncrosslinkedblends exhibit higher tan d value in the entire strain am-
plitude range, which is due to the dominance of viscous
nature. However, TPVs exhibit more elastic behavior at
low strain region, that is, G0 [ G00, with increasing defor-
mation TPVs become progressively more viscous and two
curves intersect at tan d ¼ 1 (G0 ¼ G00; Fig. 4c). The
effect of smaller particle size and high degree of cross-
linking in the EOC phase are manifested by a substantial
shift of the intersection point to the low strain region. G-
plot (G00 vs. G0) of the strain sweep data is shown in Fig.
4d. Generally, G0 is related to the extent of filler network
formation and G00 to the breakdown and reformation of
these structures. In uncrosslinked blends, there is a linear
relationship between G0 and G00 in the strain region stud-
ied. In case of TPVs, a semicircular arc is observed which
may be a direct manifestation of morphology developed.
Similar semicircular arc is observed for the carbon black
filled SBR rubber and smaller particles exhibited more
pronounced arc [33]. Phase mixed TPVs show more pro-
nounced and bigger arc followed by preblended and split
added TPVs. Variation in the TPVs prepared by different
methods is associated with the different state and magni-
tude of crosslinked EOC network (aggregates and/or
agglomerates) formation and reformation.
Frequency Dependence of Viscoelastic Properties. Dy-
namic frequency sweep tests were performed at fixed low
strain amplitude (selected from linear viscoelastic region)
to further study the network formation and microstruc-
tural changes. Figure 5a shows the logarithmic plot of
dynamic functions (complex modulus G*, complex vis-
cosity g*) as a function of frequency (x) for the uncros-
slinked (TPO) and dynamically crosslinked blends
(TPVs). As shown, g* decreases with increase in x for
all the blends (TPO and all TPVs), which clearly demon-
strates the pseudoplastic behavior and significant non-
Newtonian properties (shear thinning behavior). Irrespec-
tive of different methods, TPVs exhibit higher viscosity
values in the entire range of frequency than the uncros-
slinked blends and a more prominent increase of g* in
the low frequency region and the curve tends to converge
at the higher frequency.
Zero shear viscosity (g�0) values, obtained experimen-
tally at the x ¼ 0.1 Hz are shown in Table 4. The higher
g�0 value is observed for phase mixed TPVs. Moreover,
viscosity curve at low frequency can be fitted in the
Power law equation.
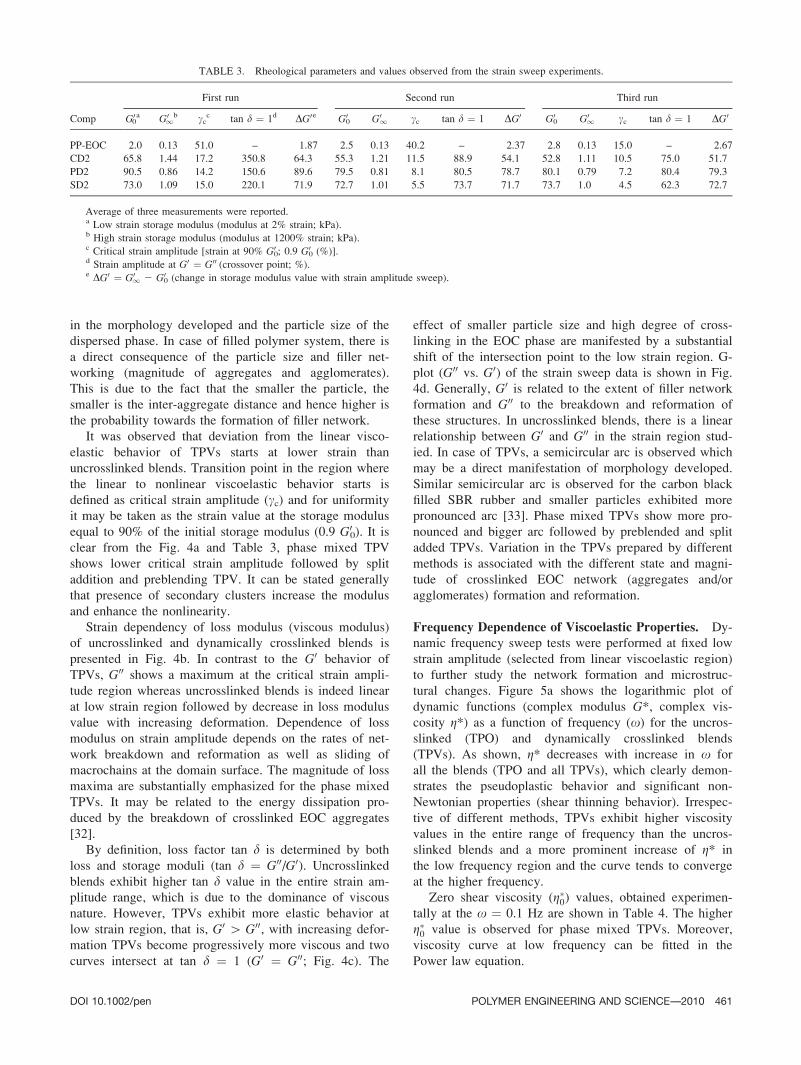
TABLE 3. Rheological parameters and values observed from the strain sweep experiments.
Comp
First run Second run Third run
G00a G01
b ccc tan d ¼ 1d DG0e G0
0 G01 cc tan d ¼ 1 DG0 G00 G01 cc tan d ¼ 1 DG0
PP-EOC 2.0 0.13 51.0 – 1.87 2.5 0.13 40.2 – 2.37 2.8 0.13 15.0 – 2.67
CD2 65.8 1.44 17.2 350.8 64.3 55.3 1.21 11.5 88.9 54.1 52.8 1.11 10.5 75.0 51.7
PD2 90.5 0.86 14.2 150.6 89.6 79.5 0.81 8.1 80.5 78.7 80.1 0.79 7.2 80.4 79.3
SD2 73.0 1.09 15.0 220.1 71.9 72.7 1.01 5.5 73.7 71.7 73.7 1.0 4.5 62.3 72.7
Average of three measurements were reported.a Low strain storage modulus (modulus at 2% strain; kPa).b High strain storage modulus (modulus at 1200% strain; kPa).c Critical strain amplitude [strain at 90% G0
0; 0.9 G00 (%)].
d Strain amplitude at G0 ¼ G00 (crossover point; %).e DG0 ¼ G01 2 G0
0 (change in storage modulus value with strain amplitude sweep).
DOI 10.1002/pen POLYMER ENGINEERING AND SCIENCE—-2010 461

Z� ¼ kon (3)
where Z* is a complex viscosity, k is sample exponential
factor, o is the oscillation frequency and n is the shear
thinning exponent. The value of n can be determined
from the slope of straight line obtained in the low fre-
quency region in the log (Z*) vs. log (o) plot. The value
of n increased drastically for the dynamically vulcanized
blends, that is, more pseudoplastic behavior is obtained
by dynamic vulcanization (Table 4). Higher moduli in the
low shear rate region and more shear thinning behavior
with increasing shear rate can afford to give better proc-
essing characteristics. This can be attributed due to the
state and mode of three-dimensional network structure
formed by the dispersed crosslinked EOC particles and
the overlapping of the matrix phase, that is, PP macromo-
lecules absorbed by physical and/or chemical crosslinking
on the surface of domains. Thereby interface becomes
less mobile, which leads to increase in the shear viscosity
at low frequency region. As the frequency increases, the
network structure, mainly aggregates/agglomerates tends
to collapse and deform to exhibit higher shear thinning
behavior [34]. This implies that the crosslinked EOC
domains could behave as the filler in the PP matrix. It
was previously reported that, TPVs with high amount of
rubber have been shown to behave like highly filled mol-
ten thermoplastic [7, 8, 14].
Frequency sweep at small amplitude does not signifi-
cantly deform the microstructure of the complex fluid; it
allows understanding the reinforcing effect. Figures 5a–c
show the dependence of G0, G00, and tan d as a function
of angular frequency. Both the moduli increase with
increase in x for all the blends. In TPOs, G00 is larger
than G0 in the low frequency region, demonstrating vis-
cous nature of the compound. However, with increase in
frequency the two moduli cross each other called cross-
over frequency (xc), that is, G0 ¼ G00, denotes the transi-
tion from viscous to rubbery response. In uncrosslinked
blend xc observed at higher frequency (30 Hz). But in
case of TPVs, G0 becomes large than G00 over the whole
range of experimental frequency, hence no xc is
observed. Therefore the TPVs can be described as ‘‘visco-
elastic solid.’’ In other words, dynamically vulcanized
samples show high elasticity in the experimental fre-
quency range. In TPOs, loss factor tan d is high and
decays very fast with increase in x. But TPVs show very
low values in the entire range of frequency applied and
the curve becomes almost flat, reflecting the presence of
three-dimensional network structures and their influence
on the moduli. In a nutshell, in contrast to TPOs, TPVs
show a gradual increase in both the modulus and decrease
in their x dependency. In general, dynamic functions at
low frequency is strongly depend on the physical network
formation (hydrodynamic and secondary structure) by the
inclusion, whereas at high frequency is dominated by
matrix (along with hydrodynamic effect).
Modulus Recovery. Experiments on recovery of
dynamic functions after the application of large strain am-
plitude perturbation were performed for all the samples
investigated. Figure 6 shows that the comparative subse-
quent strain sweep results performed immediately after a
relaxation time of 2 min and a frequency sweep (for
clarity only phase mixed TPV is shown in Fig. 6). The
typical qualitative feature of Payne effect, that is, decrease
FIG. 5. Variation of viscoelastic property as a function of angular fre-
quency for uncrosslinked and dynamically crosslinked blends. (a) Com-
plex modulus and complex viscosity. (b) Storage modulus and loss mod-
ulus. (c) tan d.
462 POLYMER ENGINEERING AND SCIENCE—-2010 DOI 10.1002/pen

of G0 and the appearance of G00 max in the subsequent
strain sweep test is observed. However, linear range
decreased (cc at lower strain amplitude) and both the mod-
uli (G0 and G00) decrease with the formation of G00 max at
lower strain amplitude in the subsequent strain sweep test.
The variation of modulus value at low and high strain am-
plitude in all the three strain sweeps are shown in Table 3.
These evolutions are associated with the nonreversal de-
formation of the network formed by the disintegration of
crosslinked EOC aggregates and/or agglomerates and also
de-wetting of the EOC domains from the PP matrix as
well as rupture of chain entanglements and chains con-
necting aggregates. This corresponds to the so called phe-
nomenon Mullins effect or stress softening effect [35]. It
is important to note that all the dynamic stress softening is
achieved in the second sweep (2nd run) and only minor
effects take place in the subsequent sweep (3rd run). Fur-
thermore, it is observed from the figures, that the linear
complex modulus (modulus at 2% strain) of TPVs is
reformed to a large extent (more than 90% of initial or lin-
ear modulus is recovered) in the subsequent strain sweep.
In the literature, it had been shown that, when the calcium
carbonate filled Polyethylene (highly loaded particulate
filled polyethylene) is subjected to subsequent strain sweep
[27], the onset of nonlinearity shifted to the higher defor-
mation (strain %) and a drastic decrease was observed in
the initial storage modulus. However, in case of TPVs the
reverse is observed, that is, initial storage modulus is
regained to large extent and the onset of linearity is shifted
to the lower deformation.
Dependence of dynamic functions as a function of fre-
quency for both the uncrosslinked and dynamically cross-
linked blends, before and after strain sweep followed by
relaxation time is plotted in Fig. 7a,b. A marginal reduc-
tion in the dynamic functions is observed only in the low
frequency region and the curves converge at the higher fre-
quency. It is worth noting that no Mullins effect or strain
history effects occur between the 2nd and 3rd runs. The
dynamic functions are almost similar in both 2nd and 3rd
runs. These results strongly suggest that the EOC domains
formed energetically elastic network structure. In other
words, the network is not significantly affected by the
strain sweep or all the strain effects are recovered during
the 2-min relaxation time between the subsequent sweeps.
Reinforcement Mechanism. The factors which affect
the rheological characteristics of the TPVs are size of the
dispersed domain, state of dispersion, intrinsic characteris-
tics of the blend components, volume fraction, interfacial
interaction, and processing conditions [2, 7]. Melt rheo-
logical characteristics of the TPVs can be analogically
compared with the filled polymer composites [8]. In gen-
eral, active fillers (such as carbon black, silica) have the
tendency to form agglomerates, especially at higher load-
ing, leading to the formation of cluster or chain-like struc-
ture or network structure. Depending on the activity of
the filler surface, the network could be of direct contact
mode or joint shell mode [32]. In case of fillers, well wet-
ted by the polymer molecules (carbon black in hydrocar-
bon rubber) the filler network might be formed by a joint
shell mechanism [32, 33]. A schematic representation of
joint shell mechanism is shown in Fig. 8. Because of the
better interfacial interaction between the polymer and fil-
ler, the polymers molecules are adsorbed onto the surface
of the filler either chemically or physically [33]. Thereby
the segmental mobility of the polymer molecules are re-
stricted and the modulus might increase in the vicinity of
TABLE 4. Rheological parameters and values observed from the frequency sweep experiments.
Comp
First run Second run Third run
G00a g00
b nc G00 g00 n G0
0 g00 n
PP-EOC 3006 0.944 20.3132 3490 1.097 20.3362 4630 1.40 20.3735
CD2 139,000 43.58 20.8210 126,000 39.56 20.7931 116,000 36.54 20.7829
PD2 235,000 73.92 20.8941 190,000 59.75 20.8594 183,000 57.61 20.8556
SD2 169,000 53.11 20.8412 158,000 49.62 20.8051 153,000 48.02 20.8051
Average of three measurements is reported.a Complex modulus at low frequency (0.05Hz; kPa).b Zero shear viscosity (complex viscosity at low frequency; Pa s).c Shear thinning component (slope of the straight line obtained by plotting log (g*) and log (x) between the frequency 0.1 and 1.0 Hz).
FIG. 6. Storage and loss modulus of phase mixed TPVs plotted as a
function of strain amplitude. (Full symbol represents for first run and
open symbol for second measurement after relaxation and frequency
sweep.)
DOI 10.1002/pen POLYMER ENGINEERING AND SCIENCE—-2010 463

the filler particle. Smaller particles have higher tendency
to form filler network and have more immobilized rubber
shell in comparison with the larger filler particle. Simi-
larly, in TPVs, the difference between the surface energy
of the PP matrix and the crosslinked EOC particles leads
to the adsorption of the PP molecule onto the surface of
the crosslinked EOC particles through segmental interfu-
sion mechanism [28, 29]. For better understanding and to
avoid complication, discussion is narrowed down to only
preblended and phase mixed TPVs.
To explore the reinforcement characteristics of the
TPVs prepared, the concentration of the curative (perox-
ide) was varied in both preblending and phase mixing
method and the corresponding gel content and overall
crosslink density values are shown in Fig. 9. The modulus
evolution and viscosity curve for the phase mixed TPVs
are presented in Fig. 10a,b. We observe a decrease in
dynamic functions (G* and g*) at high concentration of
peroxide (4.6 phr). As previously mentioned, phase mix-
ing method involves the addition of EOC curative master
batch to the molten PP to form TPVs. From the method
of preparation, it can be visualized that high concentration
of peroxide have more number of reactive species in the
EOC phase which readily undergo crosslinking reaction
before the optimum dispersion of EOC domains during
mixing with molten PP. Furthermore, tightly crosslinked
domains restrict the disintegration of crosslinked EOC
particles which results to form coarsest crosslinked EOC
particles. In case of preblending method, particle size con-
tinuously decreases with increase in concentration of per-
oxide combined with the significant lowering of molecular
weight in the PP phase (b-chain scission). A speculative
model of morphology development in dynamically vul-
canized blends prepared by preblending and phase mixing
method as a function of concentration of peroxide is
shown in Fig. 11. The flow behavior of the polymer
blends can be well illustrated by the Power law model
(Eq. 3). The Power law constants such as flow behavior
index (n) and consistency index (k) have been calculated
from the linear fit of the log–log plot of complex viscos-
ity and the frequency (Fig. 10b) for the preblended and
phase mixed TPVs as a function of peroxide concentra-
tion is shown in Table 5. All the samples show pseudo-
plastic behavior, that is, n value is less than one for all
the samples. However, n value is found to increase with
increase in concentration of peroxide. It is well known
that higher n value indicates a less pseudoplastic behav-
ior. When compared at equal concentration of peroxide,
preblended TPVs show more pseudoplastic nature than
phase mixed TPVs. For example, n value of CD2 and
PD2 was found to be 0.82 and 0.89, respectively. The
consistency index is defined as the viscosity value at unitFIG. 7. Dependence of viscoelastic property as a function of angular
frequency. (Full symbols for first frequency sweep and open symbols for
second sweep after an strain amplitude sweep and a relaxation time of
2 min. (a) Complex viscosity (g*). (b) Complex modulus (G*).)
FIG. 8. Joint shell model: describing the adsorption of rubber molecu-
lar chains or polymer segments on the surface of carbon black.
464 POLYMER ENGINEERING AND SCIENCE—-2010 DOI 10.1002/pen

shear rate. It is observed that k value increases with an
increase in peroxide concentration for the preblended
TPVs. But, in case of phase mixed TPVs, k value
increases with increase in concentration of peroxide up to
3.6 phr, beyond which k value tends to decrease. This
indicates that PD4.6 sample shows lower resistance to
flow.
It is believed that crosslinked EOC domains are dis-
persed in the form of aggregates and agglomerates. Fur-
thermore, these aggregates and/or agglomerates are con-
nected via joint shell mechanism to form three-dimen-
sional network structure. It is inseparable in the given
experimental window, to determine the network formation
through direct bonding mode or indirect mode (through
polymer chains bridging on the different domains). It is
well known that, smaller the particle size, higher is the
surface area, shorter the interaggregate distance and hence
formation of more developed network via segmental inter-
diffusion mechanism [36, 37]. Larger crosslinked EOC
particles account to the decrease in the G0 and g* in both
strain sweep and frequency sweep tests. This invokes the
possibility of less adsorbed PP molecular chains and also
aid in the roll over of polymer chains over the coarser
crosslinked EOC domains or aggregates when deformed
in the shear mode. The increase in particle size also
reduces the network formation by increasing the distance
between the particles. Although the overall crosslink den-
sity and the gel content of the TPVs increases with
increase in concentration of peroxide in phase mixed
TPVs, dynamic functions decrease at higher concentration
of peroxide. However, in case of preblending method,
FIG. 9. Gel content and overall crosslink density values as a function
of concentration of peroxide for both preblended and phase mixed TPVs.
FIG. 10. Variation of viscoelastic properties of phase mixed TPVs.
(a) Storage modulus vs. Strain amplitude. (b) Complex viscosity vs. Fre-
quency.
FIG. 11. A speculative model of morphology development in dynami-
cally vulcanized blends prepared by preblending and phase mixing
method as a function of concentration of peroxide. C, preblending
method; P, phase mixing method; DCP, dicumyl peroxide.
DOI 10.1002/pen POLYMER ENGINEERING AND SCIENCE—-2010 465

within the curative concentration limit, initial storage
modulus value increases with increase in curative concen-
tration. Therefore, it can be expected that network forma-
tion overrides the effect of degradation in PP matrix
effect on the rheological measurements. These clearly em-
phasis that the primary factors which determine the melt
viscoelastic characteristics of the TPVs are the particle
size and their network formation via adsorption tendency.
Other important factor for the reinforcement mecha-
nism is the chain bridging effect, that is, influence of ma-
trix molecular weight on the property improvement [38].
When the matrix chain length is sufficiently long, PP
chains are immobilized by chain adsorption at one or sev-
eral points along their chain lengths which affect their
stress response on the dynamic experiments. In other
words, the generated liable bonds alter the mobility and
dynamic stiffness. High molecular weight species or long
chain molecules efficiently transfer the stress from the
crosslinked domains to the matrix. This contributes to the
reduction in the interlayer slip between matrix and dis-
persed domains which gives rise to increase in dynamic
function in frequency sweep and retraction of dynamic
functions after subsequent strain perturbation [38]. A
schematic representation illustrating difference in binding
the particles and the particle size of the TPVs prepared
by preblending TPVs (conventional method) and phase
mixed TPVs at equal concentration of curative (2 phr:
optimized concentration) is shown in Fig. 12. It is very
clear form Table 3 and Fig. 4a that PD2 shows higher
modulus value at low strain and more nonlinear behavior.
It is very clear from the morphological analysis that PD2
exhibits very small particle size whilst CD2 shows the
largest. It can be stated that, Payne effect depends on the
state and degree of network formation. The network
formed via joint shell mechanism would be much less
rigid which may disintegrate at a relatively lower level of
applied strain amplitude [32, 33]. Smaller crosslinked
EOC particles have higher tendency to adsorb the PP
chains on the surface and hence form more trapped PP
chains by connecting the particles. The adsorbed chains
on the surface of the domains via physical and/or chemi-
cal adsorption generally broaden the relaxation spectrum
towards longer time which has been reflected in the
higher dynamic modulus and viscosity in the frequency
and strain sweep experiments [32, 36, 37].
CONCLUSIONS
Rheological and morphological characteristics of perox-
ide cured PP/EOC TPVs have been analyzed with special
reference to the effect of blending sequence or mixing pro-
tocol. Dynamic rheological behavior of the samples was
studied and correlated with the final morphology. Irrespec-
TABLE 5. Flow behavior index (n) and consistency index (k) value for
the preblended and phase mixed TPVs as a function of peroxide
concentration.
Compound ID n k (kPa sn) Compound ID n k (kPa sn)
CD0.6 0.8012 7.24 PD0.6 0.8662 13.1
CD2.0 0.8210 12.02 PD2.0 0.894 15.4
CD3.6 0.8562 14.45 PD3.6 0.905 19.5
CD4.5 0.8819 18.62 PD4.5 0.913 7.76
FIG. 12. Schematic representation of possible structure developed by TPVs illustrating difference in binding
the particles and the particle size of the TPVs prepared by preblended TPVs (conventional method) and
phase mixed TPVs at 2 phr concentration of DCP.
466 POLYMER ENGINEERING AND SCIENCE—-2010 DOI 10.1002/pen

tive of blending sequence used, dynamically cured blends
show higher dynamic modulus and viscosity than uncured
blend. At this particular composition ratio, TPVs respond
as a viscoelastic solid as a result of formation of three-
dimensional network structure. Among the methods
employed, phase mixed TPVs (PD2) shows higher dynamic
modulus and more nonlinear behavior. Interpretation of
results of increase in dynamic functions and the nonlinear-
ity still remains a subject of debate. The concept of modu-
lus recovery and network formation yields a good interpre-
tation. The network structure formed by the dispersed phase
mainly depends on the particle size and their interaction.
Recovery test carried out by subsequent strain sweep and
frequency sweep proved the presence of the memory effect
(Mullins effect) and the existence of the energetically elas-
tic network domains. Both polymer matrix characteristics
and the dispersed phase characteristics are equally impor-
tant in contributing to the overall dynamic properties of the
TPVs. There exists a direct consequence between the parti-
cle size and the degree of crosslinking in the dispersed
phase. The higher the degree of crosslinking in the dis-
persed phase, the smaller is the particle size. Lower the par-
ticle size (higher the surface area) better is the adsorption
on the matrix phase which leads to form better and more
developed network structure. When the matrix chain length
is sufficiently short, lower is the efficiency to transfer the
applied stress or strain between the aggregates and/or
agglomerates and also to the matrix phase.
REFERENCES
1. A.M. Gessler and W.H. Haslett (to Esso Research and Engi-
neering Company), U.S. Patent 3,037,954 (1962).
2. G. Holden, N.R. Legge, and H.E. Schroeders, ThermoplasticElastomer—A Comprehensive Review, Hanser, Munich, New
York (1987).
3. K. Kocsis, Polymer Blends and Alloys, Marcel Dekker, New
York (1999).
4. A.Y. Coran and R. Patel, Rubber Chem. Technol., 53, 141(1980).
5. A.Y. Coran and R. Patel, Rubber Chem. Technol., 55, 116(1982).
6. K. Naskar, Rubber Chem. Technol., 80, 504 (2007).
7. L.A. Goettler, J.R. Richwine, and F.J. Wille, Rubber Chem.Technol., 55, 1448 (1982).
8. P.K. Han and J.L. White, Rubber Chem. Technol., 68, 728(1995).
9. P. Steemean and W. Zoetelief, Paper presented at ANTEC,Orland, USA (2000).
10. A.K. Jain, N.K. Gupta, and A.K. Nagpal, J. Appl. Polym.Sci., 77, 1488 (2000).
11. C.R. Kumer, S.V. Nair, K.E. George, Z. Oomen, and
S. Thomas, Polym. Eng. Sci., 43, 1555 (2003).
12. P. Ezzati, I. Ghasemi, M. Karrabi, and H. Azizi, Iran.Polym. J., 17, 265 (2008).
13. B. Kuriakose and S.K. De, Polym. Eng. Sci., 25, 630 (1985).
14. A.A. Katbab, H. Nazockdast, and S. Bazgir, J. Appl. Polym.Sci., 75, 1127 (2000).
15. A.A. Katbab, S. Bazgir, and H. Nazockdast, J. Appl. Polym.Sci., 92, 2000 (2004).
16. K. Chatterjee and K. Naskar, Polym. Eng. Sci., 48, 1077
(2008).
17. M. Ichazo, M. Hernandez, J. Gonzalez, C. Albano, and N.
Dominguez, Polym. Bull., 51, 419 (2004).
18. W.G.F. Sengers, P. Sengupta, J.W.M. Noordermeer, S.J.
Picken, and A.D. Gotsis, Polymer, 45, 858 (2004).
19. J.L. Leblanc, J. Appl. Polym. Sci., 101, 4193 (2006).
20. Z. Li and M. Kontopoulou, Polym. Eng. Sci., 49, 34 (2009).
21. R.R. Babu, N.K. Singha, and K. Naskar, J. Appl. Polym.Sci., 113, 1836 (2009).
22. R.R. Babu, N.K. Singha, and K. Naskar, J. Appl. Polym.Sci. 113, 3207 (2009).
23. J.S. Parent, A. Bodsworth, S.S. Sengupta, M. Kontopoulou,
B.I. Chaudhary, D. Poche, and S. Cousteaux, Polymer, 50,85 (2009).
24. R.R. Babu, N.K. Singha, and K. Naskar, Personal Commu-
nication.
25. P.J. Flory and J. Rehner, J. Chem. Phys., 11, 512 (1943).
26. K. Naskar and J.W.M. Noordermeer, Rubber Chem. Tech-nol., 77, 955 (2004).
27. M.A. Osman and A. Atallah, Polymer, 47, 2357 (2006).
28. F. Goharpey, A.A. Katbab, and H. Nazockdast, RubberChem. Technol., 76, 239 (2003).
29. F. Goharpey, A.A. Katbab, and H. Nazockdast, Polym. Eng.Sci., 45, 84 (2005).
30. G. Naderi, P.G. Lafleur, and C. Dubois, Polym. Eng. Sci.,47, 207 (2007).
31. G. Heinrich and M. Kluppel, Adv. Polym. Sci., 160, 1
(2002).
32. M.J. Wang, Rubber Chem. Technol., 71, 520 (1998).
33. J.B. Donnet, R.C. Bansal, and M.J. Wang, Carbon Black:Science and Technology, Marcel Dekker, New York (1993).
34. L. Cui, Z. Zhou, Y. Zhang, Yinxi Zhang, X. Zhang, and W.
Zhou, J. Appl. Polym. Sci., 106, 811 (2007).
35. J. Ramier, C. Gauthier, L. Chazeau, L. Stelandre, and L.
Guy, J. Polym. Sci. Part A Polym. Phys., 45, 286 (2007).
36. X. Xu, C. Gao, and Q. Zheng, Polym. Eng. Sci., 48, 656(2008).
37. J. Frohlich, W. Niedermier, and H.D. Luginsland, Compos.A, 36, 449 (2005).
38. M.I. Aranguren, E. Mora, J.V. DeGroot, and C.W. Macosko,
J. Rheol., 36, 1165 (1992).
DOI 10.1002/pen POLYMER ENGINEERING AND SCIENCE—-2010 467
Copyright © 2022 FDOKUMEN