Dielectric properties of laser exploded clusters
13
Dielectric properties of laser exploded clusters John P. Palastro, Thomas Antonsen, and Ayush Gupta Institute for Research in Electrical and Applied Physics, University of Maryland, College Park, Maryland 20742 Received 8 December 2006; accepted 8 February 2007; published online 28 March 2007 The optical properties of a gas of laser-pulse exploded clusters are determined by the time evolving polarizabilities of individual clusters. In turn, the polarizability of an individual cluster is determined by the time evolution of individual electrons within the cluster’s electrostatic potential. We calculate the linear cluster polarizability using the Vlasov equation. A quasistatic equilibrium is calculated from a bi-Maxwellian distribution that models both the hot and cold electrons, using inputs from a particle-in-cell simulation T. Taguchi et al., Phys. Rev. Lett. 92, 205003 2004. We then perturb the system to first order in the field and integrate the response of individual electrons to the self-consistent field following unperturbed orbits. The dipole spectrum depicts strong absorption at frequencies much smaller than p / 2. This enhanced absorption results from a beating of the laser field with electron orbital motion. © 2007 American Institute of Physics. DOI: 10.1063/1.2712814 I. INTRODUCTION A cluster is an aggregate of 10 2 –10 7 atoms held together by van der Waals forces. Clusters form when high pressure gas passes through a nozzle, and the gas undergoes rapid expansion and cooling. 1 A gas of clusters makes an ideal system for coupling energy from a laser field to the cluster gas medium, while allowing long propagation distances. 2 This is because the laser matter interaction occurs at the local solid density of the cluster, yielding strong absorption, while the average density of the medium is low, allowing for propagation. This energy coupling has led to the experimen- tal observation of several unique optical properties, such as x-ray generation, harmonic conversion, and self-focusing. 3–8 Laser irradiated cluster gases have been considered as a source of these phenomena in a variety of applications, in- cluding medical imaging, plasma based accelerators, and ra- diation sources. 9–11 The laser intensities required for use of these applications can couple so much energy to an indi- vidual cluster that it explodes. Exploding clusters have, thus, been explored extensively in the past decade. A gas of exploding clusters represents a novel, time de- pendent, nonlinear optical medium. 3 The processes of har- monic generation, 4,5 spectral wave number shifts, 6 and self-focusing 7 have all been shown to occur in cluster gases. The optical properties of the cluster gas are characterized by the polarization density P =4n cl p, where n cl is the number density of clusters and p represents the local ensemble av- erage of the dipole moments of the individual clusters. Here we assume that the cluster radius is smaller than the radiation wavelengths of interest and that the cluster density is low enough such that the intercluster spacing is much greater than the cluster radius and, as a result, interaction between clusters occurs through the mean field. The explosion of the clusters occurs on a time scale determined by the inertia of the ions, while the dipole moment is determined mainly by the rapid motion of the cluster electrons. It is thus possible to characterize the dipole moment in terms of a frequency de- pendent polarizability , t that evolves slowly in time. Here the local Fourier transforms of the laser electric field and the dipole moment are related by P ¯ = , tE ¯ . We then define the bulk dielectric constant for a gas of clusters as the sum total of individual cluster contributions, bulk =1+4n cl . 1 The bulk dielectric constant provides the connection to the macroscopic phenomena that can determine how best to uti- lize the cluster in the aforementioned applications. The simplest model that can be used to describe the clus- ter polarizability is that of a uniform density, cold plasma. 12 In this case the cluster can be characterized as a sphere of radius a with local dielectric constant =1- p 2 / - i, where p 2 =4e 2 n e / m e , n e is the electron density, e is the unit of charge, is the electron-ion collision frequency, and m e is the electron mass. In the presence of an external field, Et = Etx ˆ , one can determine the potential outside the cluster r a to be 13 ¯ 1 r, , = - Re r + a 3 r 2 -1 +2 E ¯ e i , 2 where the overline on 1 and E denotes a temporal Fourier transform. The polarizability of the cluster is defined as the ratio of dipole moment to the electric field. This ratio can be extracted from the dependence of the potential on the radius as given in Eq. 2. In particular, the portion of the potential that varies as r -2 gives = a 3 -1 +2 . 3 If we substitute the cold plasma dielectric constant into Eq. 3, and neglect for the moment collisions, we find that the cluster has a dielectric resonance when = p / 3. 12 This resonance can be excited by a laser field of prescribed fre- quency in two ways during the course of cluster heating and explosion. First, as the cluster atoms are being ionized, the electron density will rise in time and pass through the reso- nance before the cluster has had a chance to expand. Since PHYSICS OF PLASMAS 14, 033105 2007 1070-664X/2007/143/033105/13/$23.00 © 2007 American Institute of Physics 14, 033105-1 Downloaded 18 May 2007 to 129.2.106.35. Redistribution subject to AIP license or copyright, see http://pop.aip.org/pop/copyright.jsp
Transcript of Dielectric properties of laser exploded clusters

Dielectric properties of laser exploded clustersJohn P. Palastro, Thomas Antonsen, and Ayush GuptaInstitute for Research in Electrical and Applied Physics, University of Maryland,College Park, Maryland 20742
�Received 8 December 2006; accepted 8 February 2007; published online 28 March 2007�
The optical properties of a gas of laser-pulse exploded clusters are determined by the time evolvingpolarizabilities of individual clusters. In turn, the polarizability of an individual cluster is determinedby the time evolution of individual electrons within the cluster’s electrostatic potential. We calculatethe linear cluster polarizability using the Vlasov equation. A quasistatic equilibrium is calculatedfrom a bi-Maxwellian distribution that models both the hot and cold electrons, using inputs from aparticle-in-cell simulation �T. Taguchi et al., Phys. Rev. Lett. 92, 205003 �2004��. We then perturbthe system to first order in the field and integrate the response of individual electrons to theself-consistent field following unperturbed orbits. The dipole spectrum depicts strong absorption atfrequencies much smaller than �p / �2. This enhanced absorption results from a beating of the laserfield with electron orbital motion. © 2007 American Institute of Physics. �DOI: 10.1063/1.2712814�
I. INTRODUCTION
A cluster is an aggregate of 102–107 atoms held togetherby van der Waals forces. Clusters form when high pressuregas passes through a nozzle, and the gas undergoes rapidexpansion and cooling.1 A gas of clusters makes an idealsystem for coupling energy from a laser field to the clustergas medium, while allowing long propagation distances.2
This is because the laser matter interaction occurs at the localsolid density of the cluster, yielding strong absorption, whilethe average density of the medium is low, allowing forpropagation. This energy coupling has led to the experimen-tal observation of several unique optical properties, such asx-ray generation, harmonic conversion, and self-focusing.3–8
Laser irradiated cluster gases have been considered as asource of these phenomena in a variety of applications, in-cluding medical imaging, plasma based accelerators, and ra-diation sources.9–11 The laser intensities required for use ofthese applications can couple so much energy to an indi-vidual cluster that it explodes. Exploding clusters have, thus,been explored extensively in the past decade.
A gas of exploding clusters represents a novel, time de-pendent, nonlinear optical medium.3 The processes of har-monic generation,4,5 spectral wave number shifts,6 andself-focusing7 have all been shown to occur in cluster gases.The optical properties of the cluster gas are characterized bythe polarization density P=4�ncl�p�, where ncl is the numberdensity of clusters and �p� represents the local ensemble av-erage of the dipole moments of the individual clusters. Herewe assume that the cluster radius is smaller than the radiationwavelengths of interest and that the cluster density is lowenough such that the intercluster spacing is much greaterthan the cluster radius and, as a result, interaction betweenclusters occurs through the mean field. The explosion of theclusters occurs on a time scale determined by the inertia ofthe ions, while the dipole moment is determined mainly bythe rapid motion of the cluster electrons. It is thus possible tocharacterize the dipole moment in terms of a frequency de-pendent polarizability ��� , t� that evolves slowly in time.
Here the local Fourier transforms of the laser electric field
and the dipole moment are related by P=��� , t�E. We thendefine the bulk dielectric constant for a gas of clusters as thesum total of individual cluster contributions,
�bulk = 1 + 4�ncl������ . �1�
The bulk dielectric constant provides the connection to themacroscopic phenomena that can determine how best to uti-lize the cluster in the aforementioned applications.
The simplest model that can be used to describe the clus-ter polarizability is that of a uniform density, cold plasma.12
In this case the cluster can be characterized as a sphere ofradius a with local dielectric constant �=1−�p
2 /���− i��,where �p
2 =4�e2ne /me, ne is the electron density, e is the unitof charge, � is the electron-ion collision frequency, and me isthe electron mass. In the presence of an external field, E�t�=E�t�x, one can determine the potential outside the cluster�r�a� to be13
�1�r,�,�� = − Re�r +a3
r2
���� − 1
���� + 2E���ei�� , �2�
where the overline on �1 and E denotes a temporal Fouriertransform. The polarizability of the cluster is defined as theratio of dipole moment to the electric field. This ratio can beextracted from the dependence of the potential on the radiusas given in Eq. �2�. In particular, the portion of the potentialthat varies as r−2 gives
���� = a3���� − 1
���� + 2 . �3�
If we substitute the cold plasma dielectric constant into Eq.�3�, and neglect for the moment collisions, we find that thecluster has a dielectric resonance when �=�p /�3.12 Thisresonance can be excited by a laser field of prescribed fre-quency in two ways during the course of cluster heating andexplosion. First, as the cluster atoms are being ionized, theelectron density will rise in time and pass through the reso-nance before the cluster has had a chance to expand. Since
PHYSICS OF PLASMAS 14, 033105 �2007�
1070-664X/2007/14�3�/033105/13/$23.00 © 2007 American Institute of Physics14, 033105-1
Downloaded 18 May 2007 to 129.2.106.35. Redistribution subject to AIP license or copyright, see http://pop.aip.org/pop/copyright.jsp

the cluster atoms are initially at solid density, the electrondensity quickly exceeds the critical density by a large mar-gin, �p�10�. Second, after the cluster has been heated, andexpands, the radius will increase and the density will drop. Ifthe cluster remains a solid, uniform sphere, it will pass againthrough a resonance as it expands. With collisions included,the resonance acquires a nonzero width. However, for pre-dicted values of the collision rate the resonance is narrowenough that strong heating would only be observed for ashort duration of time. In experiments, it is observed thatheating occurs throughout the laser pulse and thus, the uni-form density model needs to be modified so as to be consis-tent with experiments. In addition to the excitation of thecluster resonance by the laser heating pulse at frequency �,the cluster resonance can be excited by nonlinear signals atharmonics of �.4,5,14 Thus, general knowledge of the fre-quency dependent polarizability is of interest.15
It is worth noting that the uniform density model makestwo significant simplifying assumptions: uniform ion density,and zero electron temperature. The first approximation re-sults in a simple analytic formula for the dipole moment dueto the uniformity of the dielectric constant within the cluster.However, the assumption of a sharp boundary results in apolarizability that in the absence of collisions is real exceptfor a narrow range of frequencies around the resonance. Con-sequently, according to this model absorption only occursduring a brief time when the cluster is in resonance. Thissimplification was corrected by a fully hydrodynamic modelof the cluster that was introduced by Milchberg.16 The modelwas the first to introduce spatial variation in the cluster iondensity, but assumed the electrons responded to the laser as acold fluid. This model coupled a 1D Lagrangian fluid code toa laser field governed by � ·��r , t�E=0. Here the dielectricconstant is modeled as ��r�=1−�p
2�r� /���− i��r��+�r�,where contains the dielectric response of the neutral clus-ter atoms. The radial variation in the ion density profile anddielectric constant allows for continuous absorption of laserenergy at the location of the plasma resonance, � �p�r , t�.Thus, a cluster can absorb energy throughout the laser pulse,up until the time that the maximum cluster electron density isbelow the critical density. We note that the uniform densitymodel is still useful, and that agreement between the uniformdensity model and the nonuniform density calculations canbe achieved by artificially increasing the collision frequencyand decreasing the ion mass in the uniform density model.17
The second approximation made in the uniform dielec-tric model is that the plasma is cold. Consequently, the clus-ter electron response to the internal electric field is local inspace. While this may be a good approximation initially, asthe cluster heats up it is likely to fail. Furthermore, for suf-ficiently large laser intensities, 11015 W/cm2, a popula-tion of energetic electrons is produced. These electrons havesufficiently high speed such that they travel a distance com-parable to the cluster size in one laser period. Their responseto the internal field is necessarily nonlocal, and cannot bedescribed accurately by a fluid theory.
Kinetic treatments of cluster explosion require solvingfor individual electron trajectories. Several particle-in-cell�PIC� simulations have been developed to model the interac-
tion of clusters with intense laser pulses. Many of thesesimulations have focused on clusters irradiated with veryhigh laser intensities, on the order of 1017 W/cm2. In theregime most of the electrons are expelled from the clustercore early in the laser pulse.18 The cluster expansion thenmanifests itself as an ion core explosion due to its ownspace-charge repulsion. Here we will mainly discuss a moremoderate intensity regime, 1015–1017 W/cm2, parallelingthe results of the PIC code developed by Taguchi et al.19
Simulations conducted by Taguchi et al.19 and Gupta etal.20 indicate that the cluster can resonantly absorb energythrough an electron transit time resonance. These simulationsshow an absorption process related to that proposed byBrunel for the case of sharp density gradients.21 Electrons areextracted from the cluster by the laser electric field. Theemission of these electrons is limited by their space chargepotential. In the next half of the cycle, the laser field switchesdirection, and the extracted electrons are accelerated backtowards the cluster by both the space-charge and laser field.The electrons then return to the cluster core having gainedenergy from the field.
Within the cluster the electric field remains small be-cause it is shielded by the large dielectric response of theoverdense plasma. The electrons then pass through the clus-ter and can emerge in phase with the laser. If when passingthrough the cluster, the electrons maintain the proper phasewith respect to the field, they can continue to be acceleratedto very high energies. A simple scaling argument shows thata critical intensity exists for the onset of the transit timeresonance �4I /D2= ��c /2��mec
2 /e�2=1.361010 W, whereD is the cluster diameter, � is the laser wavelength, and I isthe laser intensity. PIC simulations demonstrate that the heat-ing process leads to a two-temperature electron distributionfunction.22 The energetic electrons have orbits that lie prima-rily in a low density halo that surrounds the cluster core. Theresponse of these “halo” electrons is important in determin-ing the cluster polarizability.
While PIC codes in principle provide a complete de-scription of the cluster explosion process, including the gen-eration of an oscillating dipole moment in response to theapplied laser electric field, they do not lend themselves tocalculating the propagation of a laser pulse through a gas ofclusters. To understand the propagation through a gas of ex-ploding clusters it is useful to have an expression for ortabulation of the dielectric constant of the gas that is of theform of Eq. �1�. The goal of this paper is to present calcula-tions of the frequency dependent cluster polarizability ��� , t�that includes the effects of nonuniform cluster density andenergetic cluster electrons, and would be useful to the studyof laser propagation. Our approach will be to assume that theion density profile is fixed and that the cluster electrons arein a quasiequilibrium state. We will then perform a linearperturbation analysis of this state to obtain the frequencydependent polarizability. More specifically, the cluster willbe described by the coupled Vlasov-Poission system. Param-eters that determine the equilibrium configuration will betaken from the results of a PIC simulation, and the resultingequilibrium electron density and electrostatic potential willbe compared with the PIC results.
033105-2 Palastro, Antonsen, and Gupta Phys. Plasmas 14, 033105 �2007�
Downloaded 18 May 2007 to 129.2.106.35. Redistribution subject to AIP license or copyright, see http://pop.aip.org/pop/copyright.jsp

In Secs. II and III we present our kinetic model of theequilibrium cluster system and perturbation to that system,respectively. Section II also includes a discussion of the al-gorithm used in solving our kinetic model for the clusterpolarizability. In Sec. IV we present the results of our kineticcalculation. Polarizabilities from an assembled ion core withvarying electron temperature, diffuse ion profile with varyingelectron temperature, and polarizabilities at different timesduring the cluster evolution with the equilibrium determinedby our PIC simulation19 are presented. Section V containsour conclusions.
II. EQUILIBRIUM CONFIGURATION
To examine the interaction of the two populations ofelectrons with the laser field we invoke a coupled 2DVlasov-Poisson system of equations. We consider the prob-lem in two dimensions rather than three so that �a� we candirectly compare results with our PIC modeling which isprimarily two-dimensional and �b� the resulting integrals aresimplified. The system can be expressed as
�fs
�t+ v · �fs −
qs
ms� � ·
�fs
�v= 0 �4�
and
�2� = − 4��s
qs� fsd2v , �5�
where � is the electrostatic potential, fs= fs�x , v , t� is thedistribution function for a specie s, qs is the charge of thatspecie, and ms is the mass. For the clusters under consider-ation the wavelength ��� of the laser electric field is muchlonger than the cluster radius �a�, and thus the cluster re-sponse can be treated in the electrostatic limit �a /��1�. Inthis case the connection between the system, Eqs. �4� and�5�, and the time dependent laser electric field is madethrough the application of the boundary condition to Eq. �5�that the gradient of � match to a uniform electric field as�x �→ .
We imagine the system can be described as two parts: acircularly symmetric equilibrium, and a self-consistent di-pole response to the perturbing laser electric field, E�t�=Er�t�x. The total potential and electron distribution functionare written as the sum of their equilibrium and perturbedcontributions,
��r,�,t� = �o�r� + Re��1�r,t�ei�� �6�
and
fe�r,�, v ,t� = fo�r, v � + Re�f1�r, v ,t�ei�� . �7�
Here, �o and fo are the equilibrium quantities, while �1 andf1 are self-consistent responses to the perturbing laser elec-tric field. The equilibrium quantities are considered to beindependent of time on the time scale of the laser period. Thetime variation in the perturbed quantities arises from thecluster’s response to the perturbing laser electric field. Theangular dependence in the perturbed quantities ensures thatthe total perturbed electric field, E1=−��1, matches the per-turbing electric field, E�t�, for large �x �.
The ions are treated as a fixed distribution of charge dueto their relatively large inertia. The distribution function istaken to be cold with a spatial density nion�r�,
f ion�r, v � = nion�r��2�v� . �8�
In effect, we are specifying the ion density profile, which isassumed to be fixed. Our subsequent analysis thus focuses onthe electrons.
We first consider the circularly symmetric equilibrium.Substitution of Eqs. �6� and �7� into Eq. �4�, and keepingonly lowest order terms in the potential, yields
v · �fo −q
m� �o ·
�fo
�v= 0, �9�
for the equilibrium electron distribution function. The formalsolution to Eq. �9� allows fo to be any function of the con-stants of motion: in this case, the equilibrium energy andangular momentum. Electron distributions from PIC simula-tions show that the distributions functions are well character-ized by an isotropic bi-Maxwellian distribution.22 To capturethis effect, we include two independent electron populationsdistinguished by their densities at zero potential �nc ,nh� andtheir temperatures �Tc ,Th�. The equilibrium electron distribu-tion function is then
fo�r,v� =ncm
2�Tce−Ho/Tc +
nhm
2�The−Ho/Th,
for �o�0� � Ho � 0, �10�
where Ho=Ho�r ,v�=mv2 /2+q�0�r� is the total energy of anelectron in the equilibrium potential. Here the subscript crefers to the low temperature core electrons, which aremostly shielded from the laser field, and the subscript h tothe hot electrons which are more directly exposed to the laserfield. The distribution function is taken to be zero for ener-gies greater than zero, and we assume the equilibrium poten-tial vanishes at the calculation boundary. We are, therefore,only considering particles that are confined to the equilib-rium potential.
Substituting the equilibrium distribution functions Eqs.�8� and �10� into the equilibrium version of the Poisson equa-tion �5� we obtain
�r2�o�r� = − 4��qinion�r� + qence
qe�o�r�/Tc + qenheqe�o�r�/Th� ,
�11�
where qi and qe are ion and electron charge, respectively.Here we have neglected the corrections to the density due tothe distribution function cutoff at zero energy. The correctiontends to be small and as for most clusters the depth of theequilibrium potential well �o�0� tends to far exceed the typi-cal temperatures.
The equilibrium quantities are independent of �, andthus the derivative of �o is set to zero at the origin. This alsoensures that the potential is deepest at the cluster center. Asalready mentioned, the potential �o is set to zero at the com-putational boundary �r=L�. The equilibrium electric field,Eo=−��o, is fixed at the boundary by maintaining a chargeimbalance defined by
033105-3 Dielectric properties of laser exploded clusters Phys. Plasmas 14, 033105 �2007�
Downloaded 18 May 2007 to 129.2.106.35. Redistribution subject to AIP license or copyright, see http://pop.aip.org/pop/copyright.jsp

�0
L
��1 − ��Znion�r� − nc�r� − nh�r��d2r � 0, �12�
where 0���1, is chosen to best match the results from ourPIC simulation for the parameters used in generating Fig. 1,unless otherwise stated. For all other calculations, the imbal-ance was fixed as the temperature varied. For a given Tc andTh, then, we determine the values of nc and nh by the condi-tion above for the charge imbalance and by setting the de-sired fraction of hot electrons. Equations �6�–�8� and theabove conditions provide a closed set of equations for de-scribing the equilibrium cluster plasma.
Figure 1 shows the equilibrium potential, on the rightvertical axis, and electron density, on the left vertical axis,calculated from our model �solid� for a 38 nm cluster. Theion density was extracted from the PIC simulation of Taguchiet al. at 300 fs.19 The applied field in the PIC simulation wasa 100 fs full width at half maximum Gaussian pulse with awavelength of 800 nm, and intensity of 51015 W/cm2. By125 fs after the peak of the laser pulse, the heated electronsconsisted of two species, one at Tc=300 eV and the other atTh=6.4 keV, which contributed 10% of the total electronpopulation. For comparison the electron density from thePIC code has been plotted �dotted�. The agreement betweenthe PIC density and that of our model extends to even thehalo region. The inset shows the electron density for both ona log scale. As mentioned, the potential depth exceeds thevalue of the temperature. The good agreement seen hereshows that it is reasonable to model the equilibrium as beingstationary on time scales that are short compared with theexpansion time of the ions. Our analysis of the perturbationsof this equilibrium are contained in the next section.
III. LINEAR PERTURBATION
We now consider the linear response of the cluster to afinite duration laser electric field E�t�=Er�t�x imposed at thesystem boundary. The imposed laser field drives a time de-pendent perturbation in the cluster potential. This results inthe electron density changing to shield out the laser fieldfrom the cluster core. The cluster continues to evolve self-consistently in this manner under the time evolution of thelaser field.
A. Linear system
The equation describing the time evolution of the firstorder distribution function for electrons is found by substitu-tion of Eqs. �6� and �7� into Eq. �4� and linearizing. We findthat
df1
dt− q�v�t� · ��1�r,�,t��
dfo
dE= 0. �13�
Here the time derivative is taken following equilibrium elec-tron orbits, and thus v�t� is understood to be the motionresulting from the equilibrium potential, �o. The first orderpotential is the solution to the Poisson equation with the firstorder density as the source,
�2�1�r,�,t� = − 4�q� d2vf1�r,�, v ,t� . �14�
The system boundary �r=L� is far enough away that thecluster will appear as a dipole oscillator, with the x compo-nent of the dipole moment, px, defined as
px�t� = �0
2� �0
L
r cos���n1�r,�,t�d2r , �15�
where n1 is the first order electron density perturbation. Forlarge r, the general electrostatic potential due to a dipole canbe written as �1�r ,� , t�=Re��1�r , t�ei��, where �1�r , t� satis-fies
�1�r,t� = − rEr�t� +p�t�
r. �16�
We eliminate the unknown quantity p�t� by differentiatingEq. �16� with respect to r, and combining the result with Eq.�16�, arriving at our condition on the potential at the simula-tion boundary,
��d�1�r,t�dr
+�1�r,t�
r��
r=L= − 2Er�t� . �17�
In addition we require �1�r=0, t�=0, which is consistentwith the angular dependence ei�.
In frequency space, the dipole moment can be expressedas the linear response of a medium to an electric field:
px��� = ����Er��� , �18�
where � is the polarizability of the cluster and the overlinedenotes that the quantities are temporal Fourier transforms.By applying a laser field as an impulse to the cluster at t=0, the entire dipole spectrum can be recovered. That is, we
FIG. 1. Comparison of electron density extracted from the PIC simulation�dotted line� and the result of our equilibrium calculation with parameters�Tc ,Th� and �nc ,nh� extracted from the PIC simulation �solid line� on the leftaxis. The inset shows the same comparison on a vertical log-scale. Thecorresponding electrostatic potential is plotted on the right scale.
033105-4 Palastro, Antonsen, and Gupta Phys. Plasmas 14, 033105 �2007�
Downloaded 18 May 2007 to 129.2.106.35. Redistribution subject to AIP license or copyright, see http://pop.aip.org/pop/copyright.jsp

apply an impulsive electric field, measure the time dependentdipole response, Fourier transform this response, and form
the ratio of p��� to Er���. For numerical purposes, our ap-plied laser field takes the form
Er�t� = Ao�
2�
1
t2 + ��/2�2 , �19�
where in the limit that �→0, Er�t�→Ao��t�, and Ao is anarbitrary multiplicative factor. For nonzero values of �,
Er���=A0 exp�−����� and we include this factor in the cal-culation of the polarizability. In our calculations we set � 0.01 fs.
B. Trajectories
We now focus on the solution of Eq. �13�. Integration ofthis equation is carried out along the trajectories of electronsin the unperturbed field given in terms of the equilibriumpotential. For any electron in our system we can express itsequilibrium Hamiltonian as
Ho =pr
2
2m+
�2
2mr2 + q�o�r� , �20�
where pr and � are the radial and angular momentum, respec-tively. The equilibrium Hamiltonian is conserved as it exhib-its no explicit time dependence. The potential depends onlyon radius, and thus the angular momentum of electrons in theequilibrium cluster potential is also conserved. The equationfor the radial motion can then be written as
r = −q
m
�
�r�o +
�2
m2r3 . �21�
These equations represent a central force problem.23
Electron depletion early in the cluster evolution leaves anet positive charge in the cluster core. An electrostatic po-tential, �o, then attracts the electrons. Electrons with energyless than zero ��o�0��Ho�0� are confined to the clusterpotential, and thus undergo periodic motion. The electrons,however, have some initial angular momentum, which actsas an additional effective potential �the second term in Eq.�21��. The effective potential � 1/r2� repels the electrons asthey approach the cluster center setting up a minimum orbitalradius. The minimum and maximum electron orbital radii are
the roots of Ho−q�o�r�−�2 /2mr2=0. We can define the fre-quency of electron oscillation between these two radii as theradial bounce frequency, given by
�r = ���rmin
rmax
mdr
pr�−1
, �22�
where pr�r ,Ho ,�� is obtained by solving Eq. �21� with Ho, �,and r�0� given. A rotational frequency can also be defined asthe time it takes an electron to rotate by 2� radians
�� =�r
� ��rmin
rmax
drm�
prr2� . �23�
These frequencies will be important in understanding the in-teraction between the laser field and the halo electrons. Inparticular there will be a strong interaction when the fieldfrequency equals the sum of integer multiples of the radialand rotational frequencies. This effect can lead to an en-hancement in the dipole moment at laser frequencies lowerthan typical cold plasma resonant dielectric frequency. Fig-ure 2 shows three example trajectories of electrons as theyrevolve around the cluster center.
C. Algorithm
In order to calculate how the perturbed cluster distribu-tion function, f1, and potential, �1, evolve in time, we utilizea �f algorithm.24 The distribution f1 is represented as a set ofparticles that follow in phase space the equilibrium trajecto-ries and have weights that vary in time calculated accordingto Eq. �13�. At every time step the particle contributions toJ1, the first order electron current density, are computed on aradial grid. The ei� dependence of all first order quantities,limits calculations to a radial grid. The quantity J1 is thenused to find the perturbed density through the continuityequation, and from the first order density we find the per-turbed potential. The potential is then used in Eq. �13� thatupdates the distribution function. The calculation continuesuntil we reach a maximum time determined by the desiredspectral width of the dipole spectrum.
Particles are distributed as follows: NA particles are ini-tially distributed randomly with a uniform distribution in�x ,y� and �vx ,vy� satisfying �x2+y2�L, and vx
2+vy2�vmax
2
=−2q��0� /m. Particles are given equal weight, proportionalto the area in velocity space that they represent �vmax
2 /NA.
FIG. 2. Three sample electron trajectories. The cluster radius here is 19 nm.
033105-5 Dielectric properties of laser exploded clusters Phys. Plasmas 14, 033105 �2007�
Downloaded 18 May 2007 to 129.2.106.35. Redistribution subject to AIP license or copyright, see http://pop.aip.org/pop/copyright.jsp

The particles that satisfy �o�0��Ho�0 are confined by thecluster potential and are tracked, whereas particles with Ho
�0 are counted in NA �to give the correct weighting� but arenot tracked. For the rest of this section we will refer to par-ticles that are trapped by the cluster potential and satisfy�o�0��Ho�0 as A particles.
The particles with Ho�0 were included in the equilib-rium distribution function, but do not contribute strongly tothe equilibrium density. However, the effect of eliminatingthese particles must be considered in the perturbation be-cause of the infinite gradient in the distribution function atthe energy at E=H0=0. To do this, we randomly distributeNB particles in �x ,y�, and set the magnitude of their velocityto be �v�=�2qe�o�r� /me. A random angle, �, is then chosento determine �vx ,vy�, where vx= �v�cos��� and vy = �v�sin���.These particles lie on the boundary in energy between beingtrapped by and escaping from the cluster. For the rest of thissection we refer to particles with Ho=0, as B particles.
The velocity v�t� and position �r�t� ,��t�� for each par-ticle is found by solving Hamilton’s equations. For ease ofcalculation, and to overcome the inherent numerical difficul-ties associated with the 1/r2 effective potential, we solveexplicitly for �x�t� ,y�t�� and �vx�t� ,vy�t��. The potential �o�r�is interpolated onto a Cartesian grid �o�x ,y�. The Cartesianorbits �x�t� ,y�t��, �vx�t� ,vy�t�� are then transformed back tocylindrical coordinates for use in later computation. Particlesthat reach the calculation boundary are made to undergospecular reflection. The reflection provides an energy clamp-ing to particles that have achieved energies Ho�0 throughnumerical noise. The reflection should not affect the orbitsignificantly, as the condition that �o�0��Ho�0 limits themaximum orbital radius to L, the length of the calculationbox.
For A and B particles, respectively, the contribution tothe first order distribution function �the time integral of Eq.�13�� at each time step is
f i,A�t� = q�o
t
vi�t�� · ��1�ri�t��,t��ei�i�t��dt��dfo
dE�
E=Ei
, �24�
f i,B�t� = − q�o
t
vi�t�� · ��1�ri�t��,t��ei�i�t��dt�fo�0�
q�o�0�, �25�
where the index i distinguishes the particle, and the factor of�o�0� in the B particle equation ensures �0
vmaxfo�0�d2v=1,and vmax=�2qe�o�0� /me. The integrand represents one elec-tron’s contribution to electrostatic heating as it movesthrough the first order potential on its equilibrium trajectory.The integral is then weighted by the likelihood of a particlepossessing the equilibrium energy Ei. The total distributionfunction is then written as the ensemble average of the indi-vidual particle contributions
f1�r,�,v,t� = ei��NA−1�
i=1
NA
gif i,A�t� + NB−1�
i=1
NB
gif i,B�t�� , �26�
where the function gi=gi�r−ri ,v−vi� determines how eachparticle’s contribution is distributed in phase space and sat-
isfies �ovmax�o
Lgid2rd2v=�L2qe�o�0� /me. In a similar manner,
we can construct the current density J1,
J1�r,�,t� = qe�o�0�ei�� �j=A,B
Nj−1�
i=1
Nj
vi�t�f i,j�t�hi�r − ri�� ,
�27�
where q�o�0�hi�r−ri� is the velocity integral of gi. With thecurrent density specified, the first order potential can be de-termined. We solve
�2��1�r,�,t��t
= 4� � · J1�r,�,t� . �28�
We use J1 as opposed to the electron density n1 because thisresults in a less noisy potential in the low temperature limit.Specifically, in the zero temperature limit the distributionfunction defined by Eq. �24� appears to diverge due to thefactor df0 /dE. However, the density is finite because of thecancellation of contributions from particles with velocities ofequal magnitude but opposite direction. This cancellation isbroken at small temperature because of the differing timehistories for particles tracing orbits in opposite directions.The difference at small temperature is proportional to theLaplacian of the potential. Thus, correctly calculating thedensity requires higher order accuracy in radial grid size incalculating the electric field in Eq. �24� than does calculatingthe current density. If we should want to know the perturbeddensity we can find it once the potential has been deter-mined. Specifically,
n1�r,�,t� =1
4�e�2�1�r,�,t� . �29�
The dipole moment px�t� is then found by employing Eq.�15�. A fast Fourier transform is then used to find px���.
IV. RESULTS
For our studies on the cluster dipole spectrum, we con-sider a cluster with a 38 nm diameter and an initial centerplasma density of 1.41023 cm−3. The maximum computa-tion radius is set to 80 nm, and we evolve 200 000 particles.We consider two ion density profiles, nion�r�, extracted fromthe previously mentioned PIC simulation �Fig. 3�. The PICsimulation consisted of a 38 nm argon cluster with a chargestate of Zi=8 and an initial center electron plasma density of1.41023 cm−3. The cluster was irradiated with an 800 nmwavelength laser pulse of peak intensity 51015 W/cm2 anda full width at half maximum of 100 fs. The first ion densityis taken before passage of the laser pulse, and has a sharpdensity gradient at the cluster radius. We will refer to thisdensity profile as the sharp ion density profile. The seconddensity occurs at 300 fs, which is 130 fs after the peak of thelaser pulse. This density profile will be referred to as thediffuse ion density profile. Both of these profiles are plottedin Fig. 3. For each density profile, we consider single tem-perature electron distributions, and examine the variation inthe dipole spectra with temperature.
033105-6 Palastro, Antonsen, and Gupta Phys. Plasmas 14, 033105 �2007�
Downloaded 18 May 2007 to 129.2.106.35. Redistribution subject to AIP license or copyright, see http://pop.aip.org/pop/copyright.jsp
A. Cold cluster limit
To validate the kinetic calculation, we compare the re-sults to a cold fluid calculation of the polarizabilities usingthe Poisson equation in the frequency domain
� · ��r,�� � �1 = 0, �30�
where ��r ,��=1−�p2�r� /�2 and �p
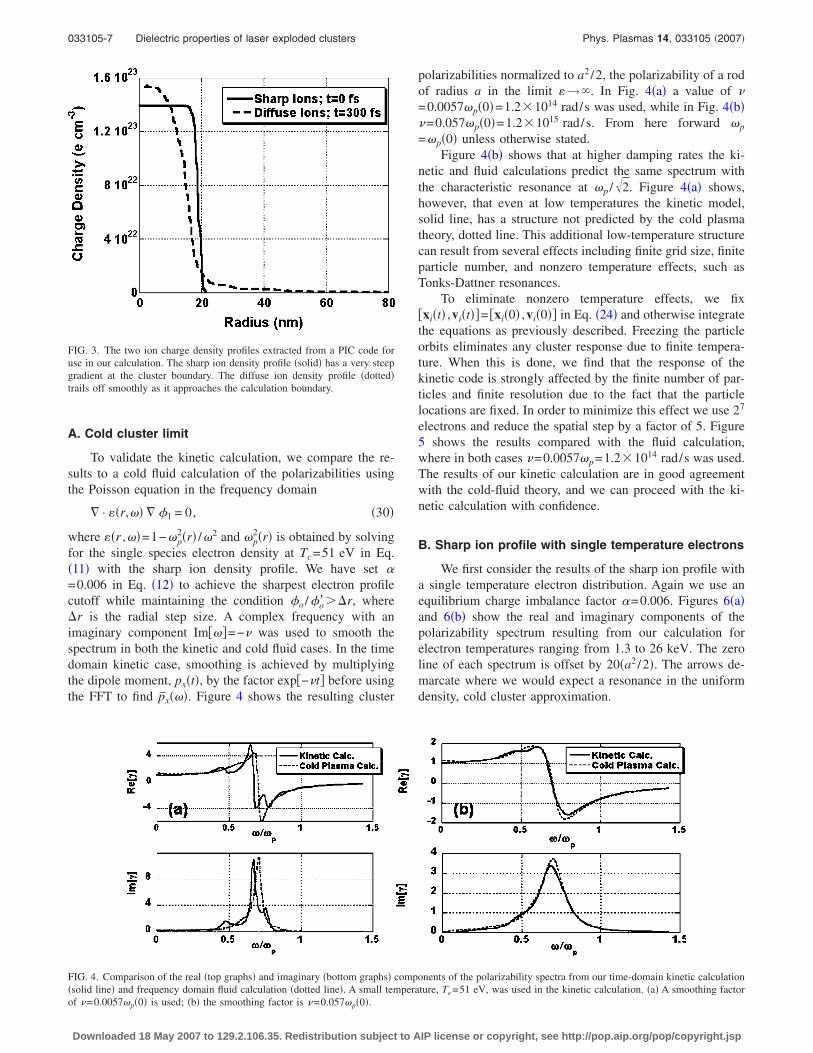
2�r� is obtained by solvingfor the single species electron density at Tc=51 eV in Eq.�11� with the sharp ion density profile. We have set �=0.006 in Eq. �12� to achieve the sharpest electron profilecutoff while maintaining the condition �o /�o���r, where�r is the radial step size. A complex frequency with animaginary component Im���=−� was used to smooth thespectrum in both the kinetic and cold fluid cases. In the timedomain kinetic case, smoothing is achieved by multiplyingthe dipole moment, px�t�, by the factor exp�−�t� before usingthe FFT to find px���. Figure 4 shows the resulting cluster
polarizabilities normalized to a2 /2, the polarizability of a rodof radius a in the limit �→ . In Fig. 4�a� a value of �=0.0057�p�0�=1.21014 rad/s was used, while in Fig. 4�b��=0.057�p�0�=1.21015 rad/s. From here forward �p
=�p�0� unless otherwise stated.Figure 4�b� shows that at higher damping rates the ki-
netic and fluid calculations predict the same spectrum withthe characteristic resonance at �p /�2. Figure 4�a� shows,however, that even at low temperatures the kinetic model,solid line, has a structure not predicted by the cold plasmatheory, dotted line. This additional low-temperature structurecan result from several effects including finite grid size, finiteparticle number, and nonzero temperature effects, such asTonks-Dattner resonances.
To eliminate nonzero temperature effects, we fix�xi�t� ,vi�t��= �xi�0� ,vi�0�� in Eq. �24� and otherwise integratethe equations as previously described. Freezing the particleorbits eliminates any cluster response due to finite tempera-ture. When this is done, we find that the response of thekinetic code is strongly affected by the finite number of par-ticles and finite resolution due to the fact that the particlelocations are fixed. In order to minimize this effect we use 27
electrons and reduce the spatial step by a factor of 5. Figure5 shows the results compared with the fluid calculation,where in both cases �=0.0057�p=1.21014 rad/s was used.The results of our kinetic calculation are in good agreementwith the cold-fluid theory, and we can proceed with the ki-netic calculation with confidence.
B. Sharp ion profile with single temperature electrons
We first consider the results of the sharp ion profile witha single temperature electron distribution. Again we use anequilibrium charge imbalance factor �=0.006. Figures 6�a�and 6�b� show the real and imaginary components of thepolarizability spectrum resulting from our calculation forelectron temperatures ranging from 1.3 to 26 keV. The zeroline of each spectrum is offset by 20�a2 /2�. The arrows de-marcate where we would expect a resonance in the uniformdensity, cold cluster approximation.
FIG. 3. The two ion charge density profiles extracted from a PIC code foruse in our calculation. The sharp ion density profile �solid� has a very steepgradient at the cluster boundary. The diffuse ion density profile �dotted�trails off smoothly as it approaches the calculation boundary.
FIG. 4. Comparison of the real �top graphs� and imaginary �bottom graphs� components of the polarizability spectra from our time-domain kinetic calculation�solid line� and frequency domain fluid calculation �dotted line�. A small temperature, Te=51 eV, was used in the kinetic calculation. �a� A smoothing factorof �=0.0057�p�0� is used; �b� the smoothing factor is �=0.057�p�0�.
033105-7 Dielectric properties of laser exploded clusters Phys. Plasmas 14, 033105 �2007�
Downloaded 18 May 2007 to 129.2.106.35. Redistribution subject to AIP license or copyright, see http://pop.aip.org/pop/copyright.jsp

The dielectric resonance peaks appearing in Fig. 6�b�show a temperature dependent spectral shift from the valueof the resonant frequency expected based on the cold plasma,uniform density model. Two effects contribute to this shift:the presence of a diffuse equilibrium electron density profileand the nonzero temperature correction to the electronplasma wave frequency. These effects tend to offset one an-other. The diffuse profile leads to a lowering of the resonantfrequency due to the spatial localization of the mode in thelower density periphery of the cluster, while the nonzerotemperature corrections to the plasma wave frequency, atleast for small temperatures, tend to increase the resonancefrequency. At Te=1.3 keV the spectrum has a redshift ofabout 0.05 �p; the temperature correction, which we estimateto be �� /�p=3/ �kda�2, where kd=�4�e2ne /T, is insignifi-cant at this temperature and the redshift is due to the diffuse
electron density profile. The redshift then decreases as thetemperature correction becomes more prominent, andreaches zero at Te=9.7 keV where the two effects have bal-anced. The shift then increases again to 0.1 �p at 26 keV.The increase in temperature has led to an increasingly diffuseelectron density �see the Appendix�, which begins to over-shadow the temperature corrections to the plasma dispersion.Accompanying the shift in frequency of the resonance, thereis also a noticeable temperature dependent broadening of thepeaks, with an almost indiscernible peak at 13 keV. Thisbroadening is due to the combination of the wave particleresonances that occur for particles orbiting the cluster andthe creation of the diffuse electron density profile.
A new feature, an enhancement of both the real andimaginary parts of the polarizability, appears in the spectrumat low frequencies, � 0.05 �p for temperatures greater than1.3 keV. This enhancement grows larger and extends tohigher frequencies as the temperature is increased from1.3 to 26 keV. This low frequency feature is not predicted bythe cold plasma approximation. Neither is it explained byassuming the cluster electrons respond adiabatically to theexciting field. To see this we rewrite Eq. �13�
df1
dt= − q�d�1
dt−
��1
�t� �fo
�E, �31�
and integrate over time assuming a harmonic time depen-dence for the potential
f1�r,�,t� = − Re�q��1�r,t�ei�
+ i��−
t
�1�r�t��,t��ei��t��dt�� �fo
�E� , �32�
where the integral is taken over an unperturbed orbit �r and �vary in time due to their evolution in the equilibrium poten-tial �o�. Because �1 varies with polar angle as ei�, the inte-grand will oscillate rapidly in time as the electrons revolvearound the cluster. As frequency goes to zero the contribu-
FIG. 5. Comparison of the imaginary component of the polarizability spec-tra from our time-domain kinetic calculation with frozen particles �solidline�, and frequency domain fluid calculation �dotted line�. In both cases asmoothing factor of �=0.0057�p�0� is used. The number of electrons usedwas 27 and the grid spacing was reduced by a factor 5 to eliminate noiseassociated with fixed particle location.
FIG. 6. Real �a�, and imaginary �b� polarizability spectra resulting from the sharp ion profile. Each spectrum has a vertical offset of 20�a2 /2� and correspondsto a different electron temperature as labeled on the right. The arrow demarcates where a cold-cluster dielectric resonance would be expected.
033105-8 Palastro, Antonsen, and Gupta Phys. Plasmas 14, 033105 �2007�
Downloaded 18 May 2007 to 129.2.106.35. Redistribution subject to AIP license or copyright, see http://pop.aip.org/pop/copyright.jsp

tion of the integral can then be considered negligible exceptfor particles whose radial and rotation frequencies satisfy theresonance condition
� = n�r ± ��, �33�
where the radial and angular rotation frequencies are definedin Eqs. �22� and �23�, and n is an integer. If we ignore thecontribution of these electrons �and the integral� we arrive atthe adiabatic approximation. In this approximation the per-turbed electron density is given by
n1�r,�� = Re�kd2�r��1�r�ei�� , �34�
where kd is the inverse Debye length for electrons, withkd�r�=�4�e2ne�r� /T, and ne being the equilibrium electrondensity profile. As a result, the Poisson equation in this limitbecomes
��2 − �s
kd,s2 �r���1�r�ei� = 0. �35�
For the sharp ion profile we can treat the radial dependenceof the Debye length as approximately uniform in the clusterr�a. We then find the solution for the potential outside thecluster to be
�1�r,�,�� = �− r +a2
r1 − �
1 + ��Er���ei�, �36�
where 0��� I1�kda� / �akdI1��kda���1. Comparing Eqs. �16�and �36� we find the polarizability to be given by �=a2�1−�� / �1+��. At low temperatures kda→ , �→0 andthe polarizability �→a2 the value for high dielectric constantcylinders. At high temperatures kda→0, �→1, and the po-larizability �→0. Thus, the observed increase in the polar-izability cannot be described by the adiabatic approximation.
To explain the additional structure in the polarizabilitywe must consider the second term in Eq. �32�, which repre-sents, at low frequency, the contribution to the perturbeddensity of particles whose equilibrium motion is resonantwith the wave frequency. The equilibrium orbits, up to theirphases, can be characterized by the energy and the angularmomentum Ho and �. In examining how the laser field inter-acts with electrons with different orbits, a more instructivechoice of variables are the frequencies �r�Ho ,�� and���Ho ,�� defined in Eqs. �22� and �23�. If an electron isdriven by the electric field, we expect electrons with frequen-cies, �r and ��, satisfying the resonant condition Eq. �33� torespond strongly to the field. The proper electron orbital fre-
quencies must then exist for the laser to excite a strong re-sponse. Figure 7 shows contours of ���Ho ,�� /�p and�r�Ho ,�� /�p in the energy versus angular momentum planefor Te=1.3 keV and Te=26 keV. A laser wavelength of800 nm corresponds to a contour level of � /�p=0.11. Theequilibrium distribution function is plotted on the left toshow at which energies electrons are concentrated.
The electron frequencies plotted, at energies in the bulkof the distribution function, have the same order of magni-tude as the frequencies of the structure seen in the polariz-abilities. Thus, it is reasonable to assume that resonanceswith these electrons are responsible for the observed struc-ture in the polarizability.
To identify which order of resonance is responsible for agiven frequency, we determine what choice of �Ho ,�� makesan electron resonant with the laser field. Figures 8�a� and8�b� show the resonant electrons bands in energy-angularmomentum space for Te=1.3 keV and � corresponding to awavelength of 800 nm and �p / �2, respectively. Here wehave plotted a point for each electron whose indicated com-bination of radial and angular frequencies comes within afactor of 0.02�p, the corresponding excitation frequency.
At the laser frequency, Fig. 8�a�, we see only the n=1bounce resonance contributes, while at the dielectric reso-
FIG. 7. Contours of electron radial �left� and angular �right� frequencies inthe energy-angular momentum plane. 800 nm represents a contour level of0.11. The top graphs are at 1.3 keV and the bottom graphs at 26 keV. Theequilibrium distribution function is plotted on the left to elucidate where theelectrons are concentrated.
FIG. 8. Resonant electron bands in theenergy-angular momentum plane forthe sharp ion profile and Te=1.3 keV.�a� Bands determined by the condition�=n�r−��±.02�p, where � corre-sponds to a wavelength of 800 nm.The width 0.02�p is chosen for illus-trative purposes. �b� Bands determinedby the condition �=n�r+��±0.02�p,where �=�p / �2. The speckles are anumerical artifact.
033105-9 Dielectric properties of laser exploded clusters Phys. Plasmas 14, 033105 �2007�
Downloaded 18 May 2007 to 129.2.106.35. Redistribution subject to AIP license or copyright, see http://pop.aip.org/pop/copyright.jsp

nant frequency, Fig. 8�b�, the n=2 and n=3 bounce reso-nances both contribute to the polarizability. The n=2 and n=3 bounces resonances, however, dephase more rapidly withrespect to the electric field than the n=1 resonance. For anelectron slightly off resonance, with a detuning, �, the phasedifference between the electron and applied electric fieldgrows as �nt. The higher n resonances will then contributeless to the polarizability than the n=1 resonance.
To understand the increasing amplitude of the low fre-quency response as a function of temperature, one must con-sider the work done by the laser field on the orbiting elec-trons �see Eqs. �23� and �24��. The work done by the laserfield on an electron �labeled with subscript i� in one cyclecan be written as
W = −q
m�
xi�t�
xi�t+TL�
� �1 · dli, �37�
where TL is the period of the laser. The value of W is deter-mined by both the profile of the perturbed electric field�−��1� and by the range of the electron orbit. The perturbedelectric field tends to be small in the core of the cluster whereit is shielded by the high-density plasma, and larger in thehalo region surrounding the cluster. Low energy electronstend to be confined to the core region where the perturbedfield is small, while high energy electrons can visit the haloregion. The general tendency is that as temperature increasesthere is an increase in the rms radius of the electron cloud
�shown in the Appendix� corresponding to an increase in thenumber of electrons visiting the halo region. These electronsexperience a stronger perturbed electric field and thus in-crease the polarizability of the cluster.
C. Diffuse ions with single temperature electrons
The polarizability results for the diffuse ion density pro-file calculations have markedly different properties thanthose of the sharp ion profile. Figures 9�a� and 9�b� show theimaginary and real components of the dipole spectrum, re-spectively, in the case of the diffuse density profile. The zeroline of each spectrum is offset by 20�a2 /2�.
The first thing we notice is that the dielectric resonancepredicted by the cold cluster approximation has nearly dis-appeared. The resonance is present, but much less visiblethan in the sharp density profile case. The redshift decreasesfrom 0.1 �p at 5.1 keV, to zero at 9.0 keV, and then in-creases again to about 0.2 �p at 26 keV. The large redshift ofthe standard dielectric peak results from a more diffuse elec-tron profile accompanying the diffuse ion profile. As in thesharp case, the redshift gets reduced as the temperature in-creases from 5.1 to 9 keV due to warm plasma dispersion.The redshift then increases again as the temperature increasealso results in a more diffuse equilibrium electron density.
The low frequency feature observed in the sharp profilecase is also present in the diffuse profile case. At an electrontemperature of 1.3 keV the low frequency resonance has de-
FIG. 9. Real �a�, and imaginary �b� polarizability spectra resulting from the diffuse ion profile. Each spectrum has a vertical offset of 20�a2 /2� and correspondsto a different electron temperature as labeled on the right. The arrow demarcates where a cold-cluster dielectric resonance would be expected.
FIG. 10. Resonant electron bands inthe energy-angular momentum planefor the diffuse ion profile with Te
=1.3 keV. �a� Bands determined bythe condition �=n�r−��±0.02�p,where � corresponds to a wavelengthof 800 nm. The width 0.02�p is cho-sen for illustrative purposes. �b� Bandsdetermined by the condition �=n�r
+��±0.02�p, where �=�p / �2. Thespeckles are a numerical artifact.
033105-10 Palastro, Antonsen, and Gupta Phys. Plasmas 14, 033105 �2007�
Downloaded 18 May 2007 to 129.2.106.35. Redistribution subject to AIP license or copyright, see http://pop.aip.org/pop/copyright.jsp

veloped two prominent absorption peaks. The low frequencyresponse broadens with increasing temperature. This is ex-plained by the increasing population of energetic electronsthat have higher orbital frequencies. The decreasing ampli-tude is a consequence of the interplay between factors con-tributing to the work done on the electrons Eq. �32�. Astemperature increases, the rms orbit size increases as shownin the Appendix. This allows more electrons into the haloregion where the perturbed field is stronger. However, withhigher temperature the shape of the perturbed field is modi-fied; the amplitude is reduced in the halo region. The result isthat in the diffuse profile case the second factor is strongerand the amplitude of the response drops.
Figures 10�a� and 10�b� show the resonant bands at1.3 keV for � corresponding to the laser frequency,�2�c /800 nm�, and �p / �2, respectively. With the diffuse ionprofile at 800 nm, there are many more electrons resonantwith the laser electric field for n=1 compared with the sharp
ion profile. The large number of electrons resonant with thefield also contributes to the relatively large polarizability atlow frequencies for the diffuse ion profile. At �p / �2 thereare far fewer resonant electrons for n=2 and n=3.
To highlight the differences between the single tempera-ture results for each density profile we examine the imagi-nary component of the dipole spectrum for the sharp ionsand diffuse ions with 1.3 and 26 keV electrons, respectively.Figure 11 shows the low frequency absorption peaks andnear absence, due to broadening, of the traditional dielectricresonance for the diffuse profile at 1.3 keV. The sharp ionprofile at 1.3 keV exhibits the traditional dielectric peak, al-beit redshifted. At 26 keV the sharp and diffuse ion profilesyield similar results.
D. Linear cluster polarizability throughout evolution
We now examine the linear polarizability of a cluster atdifferent times throughout its evolution with parameters de-scribed in the beginning of this section. At each time duringour PIC simulation we have found the cold and hot electrontemperature, fraction of each species, and equilibriumboundary electric field. Figure 12�a� shows the cold and hotelectron temperatures, while Fig. 12�b� shows the fraction ofhot electrons and electron rms radius normalized to the initialrms radius.
Both the hot and cold temperatures increase as the clus-ter gains energy from the electric field, until the laser inten-sity ramps down. The hot electrons gain energy from theirstrong interaction with the laser electric field; their largerorbital excursions take them outside the cluster core to aregion of high electric field. The hot electrons can then un-dergo the transit time resonance and steadily gain energy.19
The cold electrons obtain energy through collisions with theions, which are accelerated outward by the growing halo ofhot electrons. As the laser intensity ramps down, the powercoupled into the cluster begins to decline, and the hot elec-trons give up energy via acceleration of the ion core.
Figures 13�a� and 13�b� show the results of our kineticcalculation, where we have applied a smoothing function to
FIG. 11. Comparison of the imaginary component of the polarizability re-sulting from the sharp �dotted� and diffuse �solid� ion profile at two differenttemperatures. The top picture has Te=1.3 keV and the bottom Te=26 keV.
FIG. 12. �a� On the left axis, the intensity profile �solid� used in irradiating the cluster in the PIC simulation. On the right axis �log scale�, hot and cold electrontemperatures extracted from the PIC simulation as a function of time �dotted� right axis. �b� On the left axis �log scale�, the fraction of hot electrons extractedfrom the PIC simulation as a function of time �solid�. On the right axis, the rms electron radius of the cluster �dotted�.
033105-11 Dielectric properties of laser exploded clusters Phys. Plasmas 14, 033105 �2007�
Downloaded 18 May 2007 to 129.2.106.35. Redistribution subject to AIP license or copyright, see http://pop.aip.org/pop/copyright.jsp

the results in the time domain with a damping constant of0.018 �p. Each spectrum is offset by 10�a2 /2�. The dielectricresonance at �p / �2 starts relatively broad and further broad-ens throughout the cluster evolution. The dielectric reso-nance starts redshifted at 54 fs, becomes increasingly red-shifted until 188 fs, and then blueshifts from 188 to 215 fs.The early redshifting results from the core electrons that con-tribute the bulk of the plasma density, while maintaining alow temperature �Fig. 12�. The first order thermal correctionto the plasma dispersion is thus small, and the redshift con-tinues to increase as the cluster electrons become more dif-fuse. At 188 fs the number of hot electrons has become ap-preciable and their temperature is high enough to contributea thermal correction to the cold plasma dispersion, resultingin the blueshift. The expansion of the cluster and increase intemperature continue to compete throughout the rest of thecluster evolution leading to a nonmonotonic spectral shift.For times later than 295 fs the cluster has begun to explodeand the plasma frequency of the cluster core begins to drop.The redshift then transitions to an actual change in the di-electric resonant frequency.
At low frequencies we see the enhancement of the po-larizability due to the electron bounce resonance. The in-crease in temperature and number of hot electrons as thecluster evolves provides a stronger interaction of the clusterwith the laser field, providing the increased enhancementover time. The hot electrons, having larger orbital excur-sions, leave the cluster core where they experience the un-shielded laser electric field. The laser field does work on theelectrons resulting in the observed enhancement of the polar-izability.
V. CONCLUSIONS
We have developed a fully kinetic, two temperature, lin-ear model for the cluster polarizability in 2D. The Vlasov-Poisson system of equations was solved for the cluster equi-librium, and linearized with respect to the electric field fordetermining the cluster dipole response. In a cluster the elec-tron plasma frequency far exceeds the ion plasma frequency,and hence the ions are treated as frozen. Based on this
model, we have developed a code to solve for the clusterpolarizability. The code uses temperatures, ion densities, andboundary electric fields from a PIC simulation for determi-nation of the cluster equilibrium.19 In the large radius limitthe electric field was matched onto the applied laser field. Byapplying the laser field as an impulse we have determinedthe response of the cluster to all frequencies simultaneously.
The first order electron distribution function is found byintegrating the equilibrium electron orbits through the firstorder potential. As a result, this model accounts for the non-local response of individual electrons to an applied laserfield. The polarizability is calculated by determining the ratioof the dipole moment, based on the first order electron den-sity, and the applied electric field. The code was validated bycomparing the kinetic results of a uniform ion profile with asingle electron species at 51 eV to the results of a zero tem-perature fluid model.
We have calculated cluster polarizabilities for threecases. In the first case we used an essentially uniform iondensity, and varied the electron temperature while maintain-ing a fixed charge imbalance. The second case examined adiffuse ion profile for different electron temperatures. Thefinal case explored the linear cluster response at differenttimes during the cluster evolution. All of these results show astrong cluster response at frequencies much lower than thestandard dielectric resonance, �p /�2. We have concludedthat this response is due to the electron bounce resonance.The electron motion was shown to have two frequencies, aradial bounce frequency, and a rotational frequency. Whenthe proper frequency matching condition between the orbitalfrequencies and laser frequency is met, �=n�r±��, the laserfield is able to do a large amount of work on the electron.The electrons then have a larger effective orbital radius, andcontribute to an enhanced dipole moment. The amplitude andwidth of response is determined by the first order clusterpotential and the rms radius of electrons in the cluster. Typi-cally the low frequency response is due to the n=1 reso-nance. The bounce resonance also contributes to structure atfrequencies close to �p /�2 for n=2 and 3. The response atthese frequencies tends to be lower, however, as the detuning
FIG. 13. Real �a�, and imaginary �b� polarizability spectra at different times through the cluster evolution as labeled on the right. Each spectrum has a verticaloffset of 10�a2 /2�. The spectra were smoothed by a factor �=0.018�p. The arrow demarcates where a cold-cluster dielectric resonance would be expected.
033105-12 Palastro, Antonsen, and Gupta Phys. Plasmas 14, 033105 �2007�
Downloaded 18 May 2007 to 129.2.106.35. Redistribution subject to AIP license or copyright, see http://pop.aip.org/pop/copyright.jsp

between the frequencies gets amplified by the factor n.In addition to the structure contributed by the bounce
resonance, the standard dielectric response had a temperaturedependent spectral shift. This shift was the result of twocompeting effects: blueshifts from temperature corrections tothe cold plasma dispersion and redshifts due to a decrease inthe equilibrium electron density gradient with increasingtemperature. The resonance is also substantially broadenedby the combined effects of the diffuse ion density profile andelectron temperature.
During the evolution of the cluster, the amplitude of thelow frequency polarizability follows the heating of the clus-ter. As the temperature and number of the hot electrons risesthe low frequency amplitude increases. At late times, whenthe cluster has started to cool through expansion, the lowfrequency response decreases as the hot electron temperaturefalls. The high frequency dielectric resonance almost disap-pears at late times when a large number of hot electrons areable to shield the cluster core from the laser field.
ACKNOWLEDGMENT
The authors would like to thank J. Cooley for fruitfuldiscussions.
This work was supported by the National Science Foun-dation and the Department of Energy.
APPENDIX: TEMPERATURE DEPENDENCEOF RMS ORBITAL RADIUS
To see that the rms radius increases as a function oftemperature consider the integral definition of the rms radius
�r2�Te��rms = �0
r2no�r,Te�d2r . �A1�
Inserting the density found from the equilibrium Vlasovequation and differentiating with respect to Te we have
d
dTe�r2�Te�� =
qno
Te�
0
�d�o�r�dTe
−�o�r�
Te�r2eq�o�r�/Ted2r .
�A2�
In order for the rms radius to increase, then we can show thatd�q�o� /dTe−q�o /Te�0 for all radii. We rewrite this condi-tion equivalently as
d
dTeq�o
Te � 0. �A3�
We proceed by considering the Poisson equation in one di-mension. We can rewrite the equilibrium as the integralequation
� d�
q��8��nion ln��� − ne��=
r�Te
, �A4�
where we have used the substitution of variables �=eq�o/Te.We can then say that the integral above is some function
g�eq�o/Te�=r /�Te. Inverting and taking the log we haveq�o /Te=G�r /�Te�, where G is the function defined by tak-ing the operations described above. We can now rewrite thetemperature derivate in Eq. �A3� in terms of a radial deriva-tive. Our condition now becomes
−r
2Te
d
drq�o
Te � 0. �A5�
This condition holds for all solutions to our equilibrium Pois-son equation for all radii so long as the excess of charge ispositive �see Eq. �12��. Therefore the rms electron radiusincreases monotonically with temperature.
It is also worth noting that the increase in rms radiusfrom one temperature to the next becomes smaller andsmaller. We can see this by taking the second derivate of therms radius, which one can show is less than zero.
1O. F. Hagena and W. Obert, J. Chem. Phys. 56, 1793 �1972�.2T. Ditmire, R. A. Smith, J. W. G. Tisch, and M. H. R. Hutchinson, Phys.Rev. Lett. 78, 3121 �1997�.
3K. Y. Kim, I. Alexeev, V. Kumarappan, E. Parra, T. Antonsen, T. Taguchi,A. Gupta, and H. M. Milchberg, Phys. Plasmas 11, 2882 �2004�.
4T. D. Donnelly, T. Ditmire, K. Neuman, M. D. Perry, and R. W. Falcone,Phys. Rev. Lett. 76, 2472 �1996�.
5B. Shim, G. Hays, R. Zgadzaj, T. Ditmire, and M. Downer, Bull. Am.Phys. Soc. 51, 229 �2006�.
6K. Kim, I. Alexeev, T. M. Antonsen, A. Gupta, V. Kumarappan, and H. M.Milchberg, Phys. Rev. A 71, 011201 �2005�.
7I. Alexeev, T. M. Antonsen, K. Y. Kim, and H. M. Milchberg, Phys. Rev.Lett. 90, 103402 �2003�.
8T. Ditmire, R. A. Smith, R. S. Marjoribanks, G. Kulcsar, and M. H. R.Hutchinson, Appl. Phys. Lett. 71, 166 �1997�.
9V. Kumarappan, K. Y. Kim, and H. M. Milchberg, Phys. Rev. Lett. 94,205004 �2005�.
10E. Parra, I. Alexeev, J. Fan, K. Kim, S. J. McNaught, and H. M. Milch-berg, Phys. Rev. E 62, R5931 �2000�.
11T. Ditmire, T. Donnelly, R. W. Falcone, and M. D. Perry, Phys. Rev. Lett.75, 3122 �1995�.
12T. Ditmire, T. Donnelly, A. M. Rubenchik, R. W. Falcone, and M. D.Perry, Phys. Rev. A 53, 3379 �1996�.
13J. D. Jackson, Classical Electrodynamics �Wiley, New York, 1962�, p. 113.14M. V. Fomyts’kyi, B. N. Breizman, A. V. Arefiev, and C. Chiu, Phys.
Plasmas 11, 3349 �2004�.15T. Tajima, Y. Kishimoto, and M. C. Downer, Phys. Plasmas 6, 3759
�1999�.16H. M. Milchberg, S. J. McNaught, and E. Parra, Phys. Rev. E 64, 056402
�2001�.17A. Gupta, T. M. Antonsen, and H. M. Milchberg, Phys. Rev. E 70, 046410
�2004�.18M. Eloy, R. Azambuja, J. T. Mendonca, and R. Bingham, Phys. Scr., T
T89, 60 �2001�.19T. Taguchi, T. M. Antonsen, and H. M. Milchberg, Phys. Rev. Lett. 92,
205003 �2004�.20A. Gupta, T. M. Antonsen, T. Taguchi, and J. P. Palastro, Phys. Rev. E 74,
046408 �2006�.21F. Brunel, Phys. Rev. Lett. 59, 52 �1987�.22T. M. Antonsen, T. Taguchi, A. Gupta, J. P. Palastro, and H. M. Milchberg,
Phys. Plasmas 12, 056703 �2005�.23H. Goldstein, C. Poole, and J. Safko, Classical Mechanics �Addison-
Wesley, New York, 2002�, p. 70.24R. E. Denton and M. Kotschenreuther, J. Comput. Phys. 119, 283 �1995�.
033105-13 Dielectric properties of laser exploded clusters Phys. Plasmas 14, 033105 �2007�
Downloaded 18 May 2007 to 129.2.106.35. Redistribution subject to AIP license or copyright, see http://pop.aip.org/pop/copyright.jsp