ABSTRACT CAKMAK, ENES. Dielectric and ...
278
ABSTRACT CAKMAK, ENES. Dielectric and Electromechanical Properties of Polyurethane and Polydimethylsiloxane Blends and Nanocomposites. (Under the direction of Dr. Tushar K. Ghosh.) Conventional means of converting electrical energy to mechanical work are generally considered too noisy and bulky for many contemporary technologies such as microrobotic, microfluidic, and haptic devices. Dielectric electroactive polymers (D-EAPs) constitude a growing class of electroactive polymers (EAP) that are capable of producing mechanica work induced by an applied electric field. D-EAPs are considered remarkably efficient and well suited for a wide range of applications, including ocean-wave energy harvesters and prosthetic devices. However, the real-world application of D-EAPs is very limited due to a number of factors, one of which is the difficulty of producing high actuation strains at acceptably low electric fields. D-EAPs are elastomeric polymers and produce large strain response induced by external electric field. The electromechanical properties of D-EAPs depend on the dielectric properties and mechanical properties of the D-EAP. In terms of dielectric behavior, these actuators require a high dielectric constant, low dielectric loss, and high dielectric strength to produce an improved actuation response. In addition to their dielectric properties, the mechanical properties of D-EAPs, such as elastic moduli and hysteresis, are also of importance. Therefore, material properties are a key feature of D-EAP technology.
-
Upload
khangminh22 -
Category
Documents
-
view
1 -
download
0
Transcript of ABSTRACT CAKMAK, ENES. Dielectric and ...

ABSTRACT
CAKMAK, ENES. Dielectric and Electromechanical Properties of Polyurethane and Polydimethylsiloxane Blends and Nanocomposites. (Under the direction of Dr. Tushar K. Ghosh.)
Conventional means of converting electrical energy to mechanical work are generally
considered too noisy and bulky for many contemporary technologies such as microrobotic,
microfluidic, and haptic devices. Dielectric electroactive polymers (D-EAPs) constitude a
growing class of electroactive polymers (EAP) that are capable of producing mechanica work
induced by an applied electric field. D-EAPs are considered remarkably efficient and well
suited for a wide range of applications, including ocean-wave energy harvesters and
prosthetic devices. However, the real-world application of D-EAPs is very limited due to a
number of factors, one of which is the difficulty of producing high actuation strains at
acceptably low electric fields.
D-EAPs are elastomeric polymers and produce large strain response induced by external
electric field. The electromechanical properties of D-EAPs depend on the dielectric
properties and mechanical properties of the D-EAP. In terms of dielectric behavior, these
actuators require a high dielectric constant, low dielectric loss, and high dielectric strength to
produce an improved actuation response. In addition to their dielectric properties, the
mechanical properties of D-EAPs, such as elastic moduli and hysteresis, are also of
importance. Therefore, material properties are a key feature of D-EAP technology.

DE actuator materials reported in the literature cover many types of elastomers and their
composites formed with dielectric fillers. Along with polymeric matrix materials, various
ceramic, metal, and organic fillers have been employed in enhancing dielectric behavior of
DEs.
This work describes an effort to characterize elastomer blends and composites of different
matrix and dielectric polymer fillers according to their dielectric, mechanical, and
electromechanical responses. This dissertation focuses on the development and
characterization of polymer-polymer blends and composites from a high-k polyurethane (PU)
and polydimethylsiloxane (PDMS) elastomers. Two different routes were followed with
respect to elastomer processing: The first is a simple solution blending of the two types of
elastomers, and the second is based on preparation of composites from PU nanofiber webs
and PDMS elastomer. Both the blends and the nanofiber web composites showed improved
dielectric and actuation characteristics.

© Copyright 2014 Enes Cakmak
All Rights Reserved

Dielectric and Electromechanical Properties of Polyurethane and Polydimethylsiloxane Blends and their Nanocomposites
by Enes Cakmak
A dissertation submitted to the Graduate Faculty of North Carolina State University
in partial fulfillment of the requirements for the degree of
Doctor of Philosophy
Fiber & Polymer Science
Raleigh, North Carolina
2014
APPROVED BY:
_______________________________ ______________________________ Dr. Tushar K. Ghosh Dr. Richard J. Spontak Committee Chair ________________________________ ________________________________ Dr. Stephen Michielsen Dr. Joseph Tracy

ii
DEDICATION
To Mom and Dad,
It's impossible to thank them adequately for everything they have done.

iii
BIOGRAPHY
Enes Cakmak is a Ph.D. student in the Fiber and Polymer Science Department at North
Carolina State University. He received his B.S. and master's degree in Textile Engineering in
2003 and 2006, respectively, both from Süleyman Demirel University, Turkey. He joined
Süleyman Demirel University as a research assistant in 2005 and worked on applications of
new computer software techniques for weaving. He was awarded the Turkish Higher
Education Council Scholarship for his Ph.D. studies in the U.S. and joined North Carolina
State University to pursue his Ph.D. in Fiber and Polymer Science with a minor in Materials
Science and Engineering in 2009.

iv
ACKNOWLEDGMENTS
First and foremost, I sincerely thank Professor Tushar K. Ghosh for his patience and
direction during my doctoral program at North Carolina State University. He not only
provided the necessary guidance but also encouraged an unrestrained approach to research
that fostered an extremely creative environment, which allowed me to expand my knowledge
in many areas of polymer science.
I would also like to sincerely thank the members of my committee, Dr. Rich Spontak, Dr
Stephen Michielsen, and Dr. Joseph Tracy. Their knowledge and experience in this field
were essential in completing this project.
I thank to Dr. Julie Willoughby for her support and my colleagues Syamal, Ali, Krishna,
Mehmet and Xiaomeng for their helpful comments on my Ph.D. thesis.
I would like to acknowledge the financial support I’ve received from the Turkish government
and Süleyman Demirel University. I would especially like to thank the academic and
administrative staff of Süleyman Demirel University for their endorsements in all stages of
my doctoral studies and the Textile Engineering department staff for making necessary and
felicitous provisions for my career.
Finally, I am grateful to my wife, Yasemin, for her generous support; my son, Kerem, for his
cheery wave; and my parents and parents-in-law for their extensive support. Without their
sacrifice, this work would have never have been possible.

v
TABLE OF CONTENTS
LIST OF TABLES ................................................................................................................. ix
LIST OF FIGURES .................................................................................................................x
CHAPTER 1 Introduction ....................................................................................................1
1.1 References ...........................................................................................................................4
CHAPTER 2 Electroactive Polymers and Dielectric Elastomers .....................................8
Abstract .....................................................................................................................................8
2.1 Introduction ........................................................................................................................8
2.1.1 Ionic EAPs ...............................................................................................................11
2.1.2 Electronic EAPs .......................................................................................................16
2.2 Dielectric Elastomers .......................................................................................................21
2.2.1 Actuation Mechanism of D-EAPs ...........................................................................22
2.2.2 DE Materials ............................................................................................................25
2.2.3 D-EAP Electrodes ....................................................................................................30
2.2.4 Electromechanical Instability of D-EAPs ................................................................32
2.2.5 The Effect of Prestrain on D-EAPs .........................................................................32
2.2.6 Response Time of D-EAPs ......................................................................................36
2.2.7 DE-based Energy Harvesting ..................................................................................37
2.3 Summary ...........................................................................................................................38
2.4 References .........................................................................................................................38
CHAPTER 3 Dielectric Composites ...................................................................................52
Abstract ...................................................................................................................................52
3.1 Dielectric Properties of Polymers ...................................................................................52
3.1.1 Dielectric Constant and Polarization .......................................................................53
3.1.2 Dielectric Loss .........................................................................................................58
3.1.3 Dielectric Spectroscopy of Polymers .......................................................................60
3.1.4 Dielectric Breakdown ..............................................................................................62
3.1.5 Charge Transport in Polymers and Nanocomposites ...............................................65

vi
3.2 Dielectric Constant Enhancement ..................................................................................69
3.2.1 Interfacial Polarization .............................................................................................70
3.2.2 Coulomb Blockade (CB) Effect of Metal Nanoparticles .........................................72
3.3 Dielectric Polymer Nanocomposites ...............................................................................73
3.3.1 Polymer Nanocomposites ........................................................................................74
3.3.2 Ferroelectric Ceramic/Polymer Composites ............................................................75
3.3.3 Metal Filler-Polymer Composites ............................................................................82
3.3.4 Organic Filler-Polymer Composites ........................................................................89
3.4 High-Dielectric Constant Elastomer Composites .........................................................94
3.4.1 Ceramic Fillers .........................................................................................................94
3.4.2 All-Organic Composites ..........................................................................................96
3.4.3 Polymer Synthesis for Dielectric Elastomers ........................................................102
3.5 Dielectric Mixing Theories ............................................................................................103
3.6 Concluding Remarks .....................................................................................................108
3.7 References .......................................................................................................................110
CHAPTER 4 Synthesis and Phase Behavior of PDMS/PU Blends ...............................126
Abstract .................................................................................................................................126
4.1 Introduction ....................................................................................................................126
4.2 Materials and Experimental Methods .........................................................................136
4.2.1 Materials ................................................................................................................136
4.2.2 Polymer Blend Preparation ....................................................................................142
4.2.3 Compatibility Estimation .......................................................................................144
4.2.4 Dynamic Mechanical Property Characterization ...................................................145
4.2.5 Differential Scanning Calorimeter (DSC) Analysis ..............................................146
4.2.6 Fourier-Transform Infrared Spectroscopy (FTIR) Analysis ..................................147
4.2.7 Morphological Property Characterization .............................................................147
4.3 Results .............................................................................................................................148
4.3.1 Compatibility Estimation .......................................................................................148
4.3.2 Dynamic Mechanical Analysis (DMA) .................................................................149

vii
4.3.3 Differential Scanning Calorimetry (DSC) Analysis ..............................................156
4.3.4 FTIR Analysis ........................................................................................................161
4.3.5 Morphological Characterization ............................................................................166
4.3.6 Dielectric Characterization ....................................................................................171
4.3.7 Evaluation of Dielectric Properties ........................................................................174
4.4 Conclusions .....................................................................................................................175
4.5 References .......................................................................................................................176
CHAPTER 5 Electromechanical Response of Blends of PU and PDMS ......................189
Abstract .................................................................................................................................189
5.1 Introduction ....................................................................................................................190
5.2 Theoretical Background ................................................................................................194
5.3 Materials and Methods ..................................................................................................197
5.3.1 Materials ................................................................................................................197
5.3.2 Blend Preparation ..................................................................................................199
5.3.3 Dielectric Characterization ....................................................................................200
5.3.4 Mechanical Characterization .................................................................................201
5.3.5 Electromechanical Characterization ......................................................................201
5.4 Results and Discussion ...................................................................................................202
5.4.1 Mechanical Properties ...........................................................................................202
5.4.2 Electromechanical Properties ................................................................................207
5.4.3 Actuator Performance ............................................................................................215
5.5 Conclusions .....................................................................................................................218
5.6 References .......................................................................................................................219
CHAPTER 6 Electromechanical Response of PU-PDMS Composite Films ................227
Abstract .................................................................................................................................227
6.1 Introduction ....................................................................................................................227
6.2 Materials and Methods ..................................................................................................231
6.2.1 Materials ................................................................................................................231
6.2.2 Composite Preparation ...........................................................................................233

viii
6.1.1 Dielectric Characterization ........................................................................................235
6.2.3 Mechanical Characterization .................................................................................236
6.2.4 Electromechanical Characterization ......................................................................236
6.2.5 Morphological Characterization ............................................................................237
6.3 Results and Discussion ...................................................................................................237
6.3.1 Morphology ...........................................................................................................238
6.3.2 Dielectric Properties ..............................................................................................238
6.3.3 Mechanical Properties ...........................................................................................240
6.3.4 Electromechanical Properties ................................................................................242
6.4 Conclusions .....................................................................................................................249
6.5 References .......................................................................................................................250
CHAPTER 7 Summary and Future Work ......................................................................255
7.1 Summary .........................................................................................................................255
7.2 Future Work ...................................................................................................................256
7.3 References .......................................................................................................................257

ix
LIST OF TABLES
Table 2.1 Comparison of alloy, ceramic, and polymer actuators. .......................................... 10
Table 2.2 Comparison of ferroelectric actuator performance. ................................................ 19
Table 2.3 Actuation response of common dielectric elastomers. ........................................... 29
Table 4.1 PDMS matrix elastomer composition comparison of types I and type II for blend
materials formulation. ........................................................................................................... 140
Table 4.2 Ecoh (internal energy) and Vg (internal molar volume) of constitutes of PU and
PDMS. ................................................................................................................................... 148
Table 4.3 Glass transition temperature (Tg) of polymer blends and their pure polymer
constitutes. ............................................................................................................................ 155
Table 4.4 Crystallinity and crystallinity peak temperatures of elastomers with different
PDMS/PU ratios in casting solutions. ................................................................................... 158
Table 4.5 FTIR assignments of PU and PDMS polymers. ................................................... 162
Table 6.1 Mechanical properties of the neat and composite film samples. .......................... 241
Table 6.2 Mechanical properties of the neat and composite film samples. .......................... 249

x
LIST OF FIGURES
Figure 2.1 Multi-field coupling of smart materials/structures .................................................. 9
Figure 2.2 Actuation mechanism of an IPMC. ....................................................................... 13
Figure 2.3 Example of actuation displacement of an IPMC over time ................................... 13
Figure 2.4 Polyaniline, a conjugated polymer: leucoemeraldine (y = 1), emeraldine (y = 0.5),
and pernigraniline (y = 0). ...................................................................................................... 14
Figure 2.5 CNT-bending actuator ........................................................................................... 15
Figure 2.6 PVDF. Left: tg+tg-; right: all trans ........................................................................ 17
Figure 2.7 The reorientation of liquid crystals bonded to an elastomer network. .................. 21
Figure 2.8 Schematic representation of D-EAPs’ actuation mechanism. ............................... 22
Figure 2.9 Effects of hardener amount on actuation strain for DC3481 silicone elastomer ... 28
Figure 2.10 A circular actuator with fixture. The elastomer is attached to a circular fixture
after a nominal prestrain application. ...................................................................................... 33
Figure 2.11 Mechanical effects of prestrain on actuation performance: a) mechanical
deformation, b) electrical deformation, c) electrical deformation with prestrain. .................. 34
Figure 2.12 Actuation behavior of PDMS elastomers under various strains (a) Strain vs
electric field for PDMS actuators. The dotted line drawn perpendicular to 40V/µm is guide
for eye. The numbers at the tops of the plots show the level of prestrain. (b) Effect of
prestrain levels on electrical breakdown (PDMS elastomer). Strain-prestrain plot was plotted
from reference. ........................................................................................................................ 35
Figure 2.13 Relative actuation performance versus electrical field for various prestrained
PDMS films. ........................................................................................................................... 36

xi
Figure 2.14 Speed response plots of a) PDMS, b) acrylic elastomer actuators. ..................... 37
Figure 3.1 Schematic representation of the five types of polarizations: a) Pelectronic, b) Pionic,
c) Pmolecular, d) Pinterfacial, e) Phyperelectronic .................................................................................. 55
Figure 3.2 Dielectric behavior versus frequency. ................................................................... 58
Figure 3.3 Dielectric loss spectra of polymethylacrilate. ....................................................... 61
Figure 3.4 A wide variety of charge transports in an insulator. .............................................. 67
Figure 3.5 a) Schematic representation of p- and n-type regions of an insulating polymer; b)
the accumulation of heterocharges and homocharges over an insulator in the first 10 sec of
voltage application under various electrical fields. Right: cathode; left: anode. .................... 68
Figure 3.6 Stern diffuse double layer produced by nanoparticles on a charged surface within
a dielectric composite. ............................................................................................................ 69
Figure 3.7 Effect of particle interface size (in nm) on intensity of physical properties. ........ 70
Figure 3.8 Increase of interface volume (a) Relationship between filler diameter versus
interface volume, representation of relationship given in plot. (b) In image A is filler B is
matrix. ..................................................................................................................................... 71
Figure 3.9 The O’Konski model assumes a conductive interface layer on a particle: (a) E = 0,
(b) E � 0. ................................................................................................................................. 72
Figure 3.10 a) Schematic representation of a Coulomb blockade; b) model of the structure as
two capacitors in a series; c) capacitance performance versus voltage results computed
theoretically. ............................................................................................................................ 73
Figure 3.11 TEM image of BaTiO3/PI composite film made through in situ polymerization
with BaTiO3. ........................................................................................................................... 79
Figure 3.12 Electrical field alignment of fillers in a polymer composite. .............................. 81

xii
Figure 3.13 Dielectric behavior of silver (20 nm) epoxy nanocomposites. ............................ 85
Figure 3.14 Curing of composite samples under external magnetic and electrical fields. ..... 87
Figure 3.15 Effect of Ni-C core-shell particle weight fraction and external fields on dielectric
constant and resistivity. ........................................................................................................... 88
Figure 3.16 Surface conductivity of PDPH polymer: (a) V-I characteristics; (b) sample with
two polymer layers (1st line in plot (a)); (c) sample with one polymer layer, where the
electrodes are on the surface of the polymer (2nd in the plot (a)); (d) sample with one polymer
layer, where the electrodes are under the polymer film (3rd in the plot (a)). .......................... 93
Figure 3.17 Actuation performances of NBR elastomer composite with the addition of
varying a) DOP, b) TiO2 concentrations. ................................................................................ 96
Figure 3.18 Dielectric constant vs. actuation strain for CPO-PDMS elastomer composites109.
a) Dielectric constant-CuPc weight concentration- plot b) Strain-electric field plot. ............. 97
Figure 3.19 Schematic of oligomer copper-phthalocyanine (CuPc). ...................................... 98
Figure 3.20 Actuation response of a) thick, b) thin samples of polyurethane-carbon black
elastomer composites .............................................................................................................. 99
Figure 3.21 Representation of periodic layered-design EAPs for FE analysis. .................... 102
Figure 3.22 The geometry for modelling core-shell filled composites for their dielectric
behavior: (a) particle, (b) interphase, and (c) matrix parts in dielectric composites. ........... 107
Figure 4.1 Chemical Formulation PDMS elastomer networks, Type I (a,b,c) and Type II
(d,e,f). Polymer (a) is a hydride functional PDMS fluid, crosslinker (b) is a multi-functional
crosslinker, (c) is a PDMS elastomer network, (d) is hydroxyl functional PDMS fluid,
crosslinker (e) is a multi-functional crosslinker, and (f) is the PDMS elastomer network. The
catalyst is tin, and the reaction takes place in a humid environment. ................................... 141

xiii
Figure 4.2 Possible routes of interaction between PDMS and PU elastomers: (a) schematic of
network formation of Type I elastomer; (b) schematic of network formation of Type II
elastomer; (c) chemical structure of 3-iocyanatopropyltriethoxy-silane crosslinker; (d)
chemical structure of polyurethane elastomer with end groups shaded. .............................. 142
Figure 4.3 Schematic of blend elastomer preparation: (a) mixing PU/THF and PDMS/THF
mixture and addition of the PDMS crosslinking agent to the mixture for film formation, (b)
use of planetary mixer for overall mixing and curing film preparation. ............................... 144
Figure 4.4 DMFA Analysis of Type I PDMS and Type II PDMS and blend: (a) Storage
modulus and loss modulus with varying frequency of Type I elastomers, (b) tan(δ) of blends
for varying frequency of Type I elastomers, (c) storage modulus and loss modulus with
varying frequency for Type II elastomers, (d) tan (δ) of blends for varying frequency Type II
elastomers. Symbols are as follows: (●) represents pure PDMS; (■) represents 10/90
PU/PDMS blends; and (◆) represents 20/80 PU/PDMS blends. Open symbols correspond
to the loss modulus of the samples. ...................................................................................... 150
Figure 4.5 DMTA Analysis of homopolymers of PU, Type I PDMS, and Type II PDMS.
Storage modulus and tan(δ) were plotted from -130 oC to 200 oC. PU sample breaks at ca.
120 oC. Red line (―) represents the Type I PDMS; blue line (―) represents the Type II
PDMS; green line (―) represents PU elastomer. ................................................................. 151
Figure 4.6 DMA Analysis of Type I elastomer and its blends. Red line (―) represents pure
PDMS; blue line (―) represents the 10 PU wt% concentration blend sample; green line (―)
represents the 20 PU wt% concentration blend sample: (a) storage modulus and loss modulus
with varying temperature from -130 °C to 200 °C for PDMS elastomer Type I and blends
with 10 and 20 wt% PU concentrations; (b) storage modulus and loss modulus with varying
temperature from -130 °C to 200 °C for PDMS elastomer Type II and blends with 10 and 20
wt% PU concentrations. ........................................................................................................ 152

xiv
Figure 4.7 DSC Analysis of Types I and II elastomer and their blends. Red (―) represents
pure PDMS; blue line (―) represents PU polymer; green line (―) represents 20 PU wt%
concentration blend sample; and black line (―) represents 40 PU wt% concentration blend
sample: (a) storage modulus and loss modulus with varying temperature from -120 °C to 200
°C for PDMS elastomer Type I and its blends with 20 wt% and 40 wt% concentrations; (b)
storage modulus and loss modulus with varying temperature from -120 °C to 200 °C for
PDMS elastomer Type II and its blends with 20 and 40 wt% concentrations. ..................... 157
Figure 4.8 FTIR Spectrum for Type I PDMS, PU, and its blends. Red (―) represents pure
PDMS; blue (―) represents pure PU; green (―) represents 20 PU wt% concentration Type I
blend. ..................................................................................................................................... 163
Figure 4.9 FTIR Spectrum for Type II PDMS, PU, and its blends: red (―) represents pure
PDMS; blue (―) represents pure PU; green (―) represents 20 PU wt% concentration Type II
blend. ..................................................................................................................................... 164
Figure 4.10 Morphological views of PU/PDMS blend elastomers with (a) representative 10%
PU filler concentration and (b) spherical PU distributed throughout the PDMS matrix. (image
taken from 10 wt% PU / Type I PDMS blends.) .................................................................. 167
Figure 4.11 Representative morphological electron microscope images of PU/PDMS blend
elastomers with (a) a film cross-section of 2% PU filler concentration; (b) spherical 10% PU
fillers distributed throughout the PDMS matrix; (c) spherical 20% PU fillers distributed
throughout the PDMS matrix; (d) spherical and ovoid 40% PU fillers distributed throughout
the PDMS matrix. ................................................................................................................. 168
Figure 4.12 Morphological cross-sections of blend Type I elastomers. Images (a) and (b)
show the dispersion of spherical PU elastomer fillers throughout the PDMS matrix; this
points to the separation of spherical PU fillers from the PDMS matrix. These images were
taken after a fracture of blends occurred in liquid nitrogen. The interphases between the
species are pointed out in the images above. ........................................................................ 169

xv
Figure 4.13 Morphology of blend elastomers with 2 wt% PU concentration: (a) cross-
sectional view of Type II elastomer blends and (b) spherical PU fillers diffused throughout
PDMS. ................................................................................................................................... 170
Figure 4.14 Analysis of morphological cross-sectional images of blends for both Type I and
Type II elastomers. SEM images were analyzed for filler dimensions: (a) Type I distribution
of size of filler diameter blends and (b) Type II distribution of approximate filler size
diameter blends. .................................................................................................................... 171
Figure 4.15 The dielectric constant (efective permitivity, ε′) as a function of frequency for
Type I blends. (▼)PU, (∆) 40 wt% PU, (◇) 20 wt% PU, (□) 10 wt% PU, (◌) 2 wt% PU,
(▲)PDMS. ............................................................................................................................ 172
Figure 4.16 Dielectric loss, (tan Δ) as a function of frequency for the Type II blends. (▼)PU,
(∆) 40 wt% PU, (◇) 20 wt% PU, (□) 10 wt% PU, (◌) 2 wt% PU, (▲)PDMS. ................... 173
Figure 4.17 Effective permittivity as a function of weight fraction of polyurethane (a) at a
low-frequency measurement (100 Hz) and (b) at a high-frequency measurement (106 Hz).
The dashed lines represent the theoretically predicted results based on weight concentration.
Dashed lines represent (—) series, (---) logarithmic, (-∙-) parallel, and (---) Maxwell Garnet
theoritical prediction of mixing for dielectric constant, in order from bottom to top. Data
connected with dots serve guide to eye. ................................................................................ 174
Figure 5.1 A circular actuator preparation from elastomers: (a) application of prestrain to a
DE, (b) operation principle for D-EAP actuators, (c) fractured cross-section electron
microscope image of a 5 wt% composition blend elastomer. PU fillers are 1-2 um in size and
spherical in shape. ................................................................................................................. 193
Figure 5.2 Scheme of blend elastomer preparation. Mixing of the PU/THF and PDMS/THF
mixtures and addition of the PDMS crosslinking agent to the mixture for film formation. . 200

xvi
Figure 5.3 Mechanical properties of PU and PDMS samples: Stress-strain curve for pristine
PU and PDMS elastomers: The red dot (●) Type I PDMS elastomer; blue square (■) Type II
PDMS elastomer; and green plus (+) represents PU elastomer. ........................................... 203
Figure 5.4 Mechanical properties of blends. (a) Young’s modulus (filled symbols) of the
blend elastomer versus PU weight concentration. The open red circles (●) represent the Type
I blend elastomers’ tensile modulus; the filled blue squares (■) represent the Type II blend
elastomers’ tensile modulus. (b) Ultimate strain (open symbols) values for blend elastomers.
The open red circles (○) represent the Type I blend elastomers’ tensile strain; the open blue
squares (□) represent the Type II blend elastomers’ tensile strain. ...................................... 204
Figure 5.5 The dependence of actuation strain on electric field or the the Type I blend
elastomers for various filler concentrations (wt%): (a) actuation strain versus electrical field
for films of Type I PDMS (▲), Type I blends of 2 wt% PU (□) , 10 wt% (△), 20 wt% (◇),
40 wt% PU compositions (◌). Type I PDMS (▲) reached to a maximum actuation strain of
~25 at ~180 V/µm, which was excluded from the plot. Lines are guides for eye. (b)
Electromechanical breakdown field versus PU weight percentage for Type I blends. All lines
serve as guide for eye. ........................................................................................................... 207
Figure 5.6 Dielectric strength of the Type I blend elastomers and the Type I PDMS
elastomer. The dielectric breakdown electrical fields were plotted from electromechanical
actuation tests of the elastomers. The dashed lines serve to connect data points. (b) Dielectric
constant of blends versus PU weight concentration. Dashed lines represent (—) series, (---)
logarithmic, (-∙-) parallel, and (---) Maxwell Garnet theoritical prediction of mixing for
dielectric constant, in order from bottom to top. .................................................................. 209
Figure 5.7 The dependence of actuation strain for the Type II blend elastomers at various
filler concentrations: (a) actuation strain versus electrical field for concentrations (Pure Type
II, 20 wt% and 40 wt%) (b) electromechanical breakdown field versus PU weight percentage
for the Type II blends for 50 V/µm. ...................................................................................... 210

xvii
Figure 5.8 Actuation strain versus electrical field for (a) Type I and (b) Type II blends.
(a)Type I PDMS (▲), (□) Type I blends of 2 wt% PU , (△) 10 wt%, (◇) 20 wt%, (◌) 40 wt%
PU concentrations. (b) Pure Type II PDMS, 20 wt% and 40 wt% PU concentrations. ........ 211
Figure 5.9 (a) Dielectric strength of the blends and the PDMS elastomer. The dielectric
breakdown electrical fields were plotted from the ultimate electromechanical actuations of
the elastomers. Red open dots (○) represent the Type I blends’ tensile strains; blue open
squares (□) represent the Type II blends’ tensile strains. (b) Young’s modulusof the blends
elastomer versus PU weight concentration. Red filled dots (●) represent the Type I blends’
tensile modulus; blue filled squares (■) represent the Type II blends’ tensile modulus. ..... 212
Figure 5.10 Dielectric strength of the blend elastomers and the PDMS elastomer: (a)
dielectric constant versus PU weight percentage in the Type II blends and b) actuation strain
at 60 V/µm as a function of PU weight concentration. Breakdown electrical fields were
plotted based on electromechanical actuation tests of elastomers. The solid and dashed lines
serve to connect. .................................................................................................................... 213
Figure 5.11 The actuator performance of blends: (a) electromechanical coupling efficiency
(K2), (b) compressive (Maxwell) stress, (c) electromechanical energy density given by
−PMaxwell(1+sz)/2 on a unit volume basis, and (d) elastic energy density (EL) displayed in
terms of PU weight concentration. In all cases, the magnitude of the electric field is 60 V/µm.
The solid and dashed lines are linear fits to the data; these serve as guides for the eye. ...... 215
Figure 6.1 (a) A dielectric elastomer actuator and its actuation mechanism ; (b) DE circular
actuator configuration. .......................................................................................................... 231
Figure 6.2 Analysis of an electrospun PU fiber web: (a) an SEM image of fibers (the
nanofibers after mixing in to hexane solvent is shown in the inset image and (b) analysis of
fiber diameter distribution. Fibers had an average diameter of 125 nm. .............................. 232
Figure 6.3 Preparation steps of the nanofiber composite elastomer films. ........................... 234

xviii
Figure 6.4 Preparation of nanofiber composite: (a) electrospinning of PU, (b) infusion of
PDMS into PU fiber webs, (c) 3D schematic of final composite structure, and (d) cross-
section image of elastomer composite; nanofibers and part of fibers are an apparent in the
image. .................................................................................................................................... 235
Figure 6.5 Cross-sectional view of the PU-PDMS nanofiber composite: (a) low-
magnification view of a composite film’s cross-section and (b) high-magnification image of
composite films. Inset image shows a single PU electrospun fiber edge. ............................ 238
Figure 6.6 Dielectric properties of fiber-infused composites: (a) effective permittivity as a
function of frequency; (b) dielectric loss factor, tan(Δ), as a function of PU fibers. ............ 239
Figure 6.7 Actuation strain versus electric field for (a) Type I and (b) Type II PU/PDMS
composite films. .................................................................................................................... 243
Figure 6.8 Plots of actuator performance of composites: (a) electromechanical coupling
efficiency (K2); (b) compressive (Maxwell) stress; (c) electromechanical energy density, as
given by [−𝑃𝑃𝑃𝑃𝑃𝑃𝑃𝑃𝑃𝑃𝑃𝑃𝑃𝑃𝑃𝑃𝑃𝑃𝑃𝑃2] on a unit-volume basis; (d) electric energy density, EL, [−𝑌𝑌𝑃𝑃𝑃𝑃 −
𝑃𝑃𝑙𝑙1 + 𝑃𝑃𝑃𝑃, displayed in terms of PU weight concentration. For all plots, the magnitude of the
electric field was 50 V/µm. The lines serve as visual guides to eye. .................................... 245

1
CHAPTER 1 Introduction
Electroactive polymers (EAPs) change their shape under an applied electric field. Dielectric
elastomers (DEs) form a class of EAPs that offer highly promising electromechanical
characteristics and are particularly suitable for many of today’s and future technologies.
Dielectric electroactive polymer (D-EAP) actuators are known for their unique properties of
large actuation stress (up to 7Pa)1, large actuation strain (>200%)2–8, high specific energy
density (~0.15 J/g)1, high coupling efficiency, fast response time (<3 sec)6, and reliable
actuation control9,10. They are also lightweight, flexible, easy to process, and inexpensive.
DEs have been used to create low cost, lightweight, and noiseless mechanisms in the
emerging technologies of bio-inspired robots11–13, prosthetic devices14,15, adaptive
structures16, electroactive fluid pumps17,18, conformable skins, refreshable braille devices19,20,
autofocus lens positioners21,22, speakers, shape and texture systems23,24, active smart
textiles15, sensors25, and energy-harvesting systems26–36. The use of DEs in these diverse
fields requires interdisciplinary expertise in chemistry, materials science, electronics, applied
mechanics, and computer science.
Actuators made of dielectric elastomers are basically parallel plate capacitors with a passive
elastomer film separating two compliant electrodes. The electromechanical response of a the
resulting D-EAP actuator depends largely on both its dielectric and mechanical properties.
The dielectric constant of an elastomer affects the charge storage properties of the actuator
and, as a result, the stress/strain generated by the material. The dielectric elastomer’s
mechanical properties, such as stiffness, are particularly important in translating stress into

2
material strain and therefore are a key factor in impedance matching of the actuator and the
system.
Ideal DE materials should have the mechanical properties of elastomers along with a high
dielectric constant and low dielectric loss. They should have high energy density and
dielectric breakdown strength. However, most common elastomers (e.g., silicone and
polyurethane) have relatively low dielectric constant, so ceramics, metals, and organic
materials with significantly higher dielectric properties have been introduced to a variety of
polymer matrices to fabricate composites with enhanced electrical and mechanical properties.
In general, the results reported in the literature paint a mixed picture. In most cases,
significant improvement in the elastomer’s dielectric constant was accompanied by
unacceptable increase in dielectric loss and/or in stiffness of the material.
Polymer-polymer blends and composite systems offer a promising route in the development
of materials with improved dielectric behavior because of their ease of processing, low cost,
low weight, and potentially better compatibility. In comparison with ceramic and metallic
filled composites, polymer-polymer systems seem to offer a more attractive route for the
development of D-EAP materials because of their potential compatibility in mechanical
properties.
The work described in this thesis aims to develop a material with improved dielectric
behavior as well as acceptable mechanical properties for use in dielectric elastomer actuator
applications. The approach in this research includes the use of a relatively high-dielectric

3
constant polymer, polyurethane (PU), as a filler in the forms of blends and nanofibers in two
types of polydimethylsiloxane (PDMS) matrix material.
This dissertation is organized such that each chapter represents a potential publication. All
chapters, with the exceptions of 2-3 are written in the form of reviews or research articles. A
short description of each follows;
Chapter 1. Introduces the thesis topic of elastomer blends and composites as dielectric
elastomers.
Chapter 2. Includes a literature review on electroactive polymers, with particular emphasis on
dielectric elastomers.
Chapter 3. Includes a literature review of dielectric materials and polymer composites, with
particular focus on dielectric elastomer materials; also includes classification of these
materials in terms of composite formation and application.
Chapter 4. Describes the synthesis and dielectric properties of the blends of polyurethane and
polydimethylsiloxanes investigated in this research.
Chapter 5. Describes the electromechanical properties of the blends of polyurethane and
polydimethylsiloxanes investigated in this research.
Chapter 6. Presents the results and a discussion of the fabrication and characterization of
nanofiber-based elastomer composites formed from polyurethane nanofibers and
polydimethylsiloxane elastomers.
Chapter 7. Summarizes the findings of this study.

4
1.1 References
1. Pelrine, R., Kornbluh, R., Pei, Q. & Joseph, J. High-speed electrically actuated
elastomers with strain greater than 100%. Science 287, 836–839 (2000).
2. Ma, W. & Cross, L. E. An experimental investigation of electromechanical response
in a dielectric acrylic elastomer. Appl. Phys. Mater. Sci. Process. 78, 1201–1204
(2004).
3. Carpi, F., Mazzoldi, A. & De Rossi, D. High-strain dielectric elastomer for actuation.
in Smart Struct. Mater. 2003 Electroact. Polym. Actuators Devices EAPAD 5051,
419–422 (2003).
4. Jordi, C., Schmidt, A., Kovacs, G., Michel, S. & Ermanni, P. Performance evaluation
of cutting-edge dielectric elastomers for large-scale actuator applications. Smart
Mater. Struct. 20, 075003 (2011).
5. Goulbourne, N. C., Mockensturm, E. M. & Frecker, M. I. Electro-elastomers: Large
deformation analysis of silicone membranes. Int. J. Solids Struct. 44, 2609–2626
(2007).
6. Michel, S., Zhang, X. Q., Wissler, M., Löwe, C. & Kovacs, G. A comparison between
silicone and acrylic elastomers as dielectric materials in electroactive polymer
actuators. Polym. Int. 59, 391–399 (2010).
7. O’Halloran, A., O’Malley, F. & McHugh, P. A review on dielectric elastomer
actuators, technology, applications, and challenges. J. Appl. Phys. 104, 071101–10
(2008).
8. Zhu, L. H., Zhu, X. L., E, S. J., Hui, A. F. & Cao, J. B. Influence of prestrain on
output characteristic of dielectric elastomer film actuators. Key Eng. Mater. 455, 81–
86 (2010).

5
9. Shankar, R., Ghosh, T. K. & Spontak, R. J. Dielectric elastomers as next-generation
polymeric actuators. Soft Matter 3, 1116 (2007).
10. Stoyanov, H., Kollosche, M., Risse, S., McCarthy, D. N. & Kofod, G. Elastic block
copolymer nanocomposites with controlled interfacial interactions for artificial
muscles with direct voltage control. Soft Matter 7, 194 (2011).
11. Anderson, I. A., Ieropoulos, I. A., McKay, T., O’Brien, B. & Melhuish, C. Power for
robotic artificial muscles. Mechatronics, IEEE/ASME Transactions on 16, 107–111
(2011).
12. Hyouk Ryeol Choi et al. Biomimetic soft actuator: design, modeling, control, and
applications. IEEE/ASME Transactions on Mechatronics 10, 581– 593 (2005).
13. Taya, M. Bio-inspired design of intelligent materials. in Smart Structures and
Materials 5051, 54–65 (2003).
14. Biddiss, E. & Chau, T. Dielectric elastomers as actuators for upper limb prosthetics:
Challenges and opportunities. Med. Eng. Phys. 30, 403–418 (2008).
15. Carpi, F. & De Rossi, D. Electroactive polymer-based devices for e-textiles in
biomedicine. Inf. Technol. Biomed. IEEE Trans. On 9, 295–318 (2005).
16. Prahlad, H. et al. Programmable surface deformation: thickness-mode electroactive
polymer actuators and their applications. in Electroactive Polymer Actuators and
Devices 5759, 102–113 (2005).
17. Arthur, G. G., McKeon, B. J., Dearing, S. S., Morrison, J. F. & Cui, Z. Manufacture
of micro-sensors and actuators for flow control. Microelectron. Eng. 83, 1205–1208
(2006).

6
18. Carpi, F., Menon, C. & De Rossi, D. Electroactive elastomeric actuator for all-
polymer linear peristaltic pumps. IEEE/ASME Trans. Mechatron. 15, 460–470
(2010).
19. Chakraborti, P. et al. A compact dielectric elastomer tubular actuator for refreshable
Braille displays. Sens. Actuators Phys. 179, 151–157 (2012).
20. Mazzone, A., Zhang, R. & Kunz, A. Novel Actuators for Haptic Displays Based on
Electroactive Polymers. in Proceedings of the ACM Symposium on Virtual Reality
Software and Technology 196–204 (ACM, 2003).
21. Choi, S. T., Lee, J. Y., Kwon, J. O., Lee, S. & Kim, W. Varifocal liquid-filled
microlens operated by an electroactive polymer actuator. Opt. Lett. 36, 1920–1922
(2011).
22. Shian, S., Diebold, R. M. & Clarke, D. R. Tunable lenses using transparent dielectric
elastomer actuators. Opt. Express 21, 8669–8676 (2013).
23. Ouyang, G., Wang, K., Henriksen, L., Akram, M. N. & Chen, X. Y. A novel tunable
grating fabricated with viscoelastic polymer (PDMS) and conductive polymer
(PEDOT). Sens. Actuators Phys. 158, 313–319 (2010).
24. Ouyang, G. M., Wang, K. Y. & Chen, X. Y. Enhanced electro-mechanical
performance of TiO2 nano-particle modified polydimethylsiloxane (PDMS) as
electroactive polymers. in Solid-State Sensors 614–617 (2011).
25. Toth, L. Design and development of dielectric elastomer transducers with dual
actuation and sensory functionality. (University of Toronto, 2002).
26. Davies, D. K. Charge generation on dielectric surfaces. J. Phys. Appl. Phys. 2, 1533–
1537 (1969).

7
27. Lo, H. C., Mckay, T., O’Brien, B. M., Calius, E. & Anderson, I. Circuit design
considerations for regulating energy generated by dielectric elastomer generators. in
SPIE Proceedings 7946, 79760C–79760C–8 (2011).
28. Koh, S. J., Keplinger, C., Li, T., Bauer, S. & Suo, Z. Dielectric elastomer generators:
How much energy can be converted? Mechatron. IEEE/ASME Trans. 16, 33–41
(2011).
29. Jean-Mistral, C., Basrour, S. & Chaillout, J.-J. Dielectric polymer: scavenging energy
from human motion. in Electroactive Polymer Actuators and Devices 6927, 1–16
(SPIE, 2008).
30. Putson, C. et al. Effects of copper filler sizes on the dielectric properties and the
energy harvesting capability of nonpercolated polyurethane composites. J. Appl.
Phys. 109, 024104 (2011).
31. Guyomar, D. et al. Electrostrictive energy conversion in polyurethane
nanocomposites. J. Appl. Phys. 106, 014910 (2009).
32. Beeby, S. P., Tudor, M. J. & White, N. M. Energy harvesting vibration sources for
microsystems applications. Meas. Sci. Technol. 17, R175–R195 (2006).
33. Cao, J. et al. in Advanced Electrical and Electronics Engineering (ed. Lee, J.) 201–
207 (Springer, 2011).
34. Ogden, R. & Steigmann, D. Mechanics and electrodynamics of magneto-and electro-
elastic materials. 527 (Springer, 2011).
35. Kang, G., Kim, K.-S. & Kim, S. Note: Analysis of the efficiency of a dielectric
elastomer generator for energy harvesting. Rev. Sci. Instrum. 82, 046101 (2011).
36. McKay, T. G., O’Brien, B. M., Calius, E. P. & Anderson, I. A. Soft generators using
dielectric elastomers. Appl. Phys. Lett. 98, 142903 (2011).

8
CHAPTER 2 Electroactive Polymers and Dielectric Elastomers
Abstract
This literature review outlines the most current research on electroactive polymers (EAPs), a
category of smart materials that exhibit physical changes when subjected to an electrical
field, with particular focus on dielectric elastomer transducers (sensors, actuators, energy
generators, etc.). The review begins with a general discussion of dielectric elastomer
actuators and continues with a more detailed discussion of their mechanism of actuation and
performance. The dielectric behavior of materials and polymers is discussed, with particular
emphasis on dielectric composites.
2.1 Introduction
Electroactive materials constitute a class of “smart” materials—that possess one or more
qualities that can be significantly altered by external stimuli. These include piezoelectrics,
shape-memory materials, electro- and magneto-strictive materials, superconductors,
pyroelectrics, photostriction-active materials, and photo-ferroelectrics. The idea of using
smart materials as in situ sensors and actuators for a wide variety of engineering applications
emerged in the mid-1980s. Figure 2.1 displays the multi-field stimuli and responses of these
materials.

9
An electroactive material responds to an external electrical stimulus with a change in a
certain property in a reproducible and stable manner. This type of material, which is
emerging as one of the largest and most fundamental subgroups of active materials, includes
organic transistors, photovoltaic cells, and electroluminescent materials. In this review, as is
widely accepted in the field, the broader term electroactive material is used to refer to
materials that serve as electromechanical transducers and produce stress and strain as a result
of electrical input. As defined here, electroactive materials therefore include shape-memory
alloys, polymers, and some ceramics. Electroactive ceramics produce small strains (~1%) but
have the advantage of high and precise stress generation1–3. Shape-memory alloys are known
for high stress, long response time, and hysteresis4–6. Electroactive polymers (EAPs) are
Figure 2.1 Multi-field coupling of smart materials/structures7.

10
lightweight, relatively inexpensive, and mechanically robust, and they exhibit a rapid
response time. The force generated by EAPs is less than that generated by ceramics and
metal alloys, but EAPs are capable of producing larger displacements. A broad comparison
of various electroactive materials is presented in Table 2.1.
The use of polymeric materials has increased in almost every part of our lives due to their
remarkable properties (i.e., low weight, low cost, and ease of processing) and other benefits.
Polymer composites have had applications in many areas of engineering as replacements for
Table 2.1 Comparison of alloy, ceramic, and polymer actuators7.
Property EAC SMA EAP
Areal actuation strain (%) 0.1-3 < 8 > 200
Blocking force (MPa) 30-40 7000 1-3
Actuation speed (sec) 10-6-1 1-100 10-6-100
Mass density (g/cm3) 6-85 5-6 0.9-2.5
Electrical field (V/µm) 50 n/aa 100-300
Power consumption (W) 1 1 10-3
Material property Fragile Elastic Elastic, resilient
a SMAs are not field-driven actuators

11
metals, ceramics, and glasses. One particular emerging field that stands to benefit greatly
from polymeric composites is that of electroactive actuator materials.
The actuation mechanism of EAPs relies on electrostatic forces, electrostriction, ion
insertion, and molecular conformational changes. EAPs are broadly classified into one of two
different groups—ionic and electronic—according to their actuation mechanism.
2.1.1 Ionic EAPs
Actuation of the ionic type of EAP occurs through ion displacement within the polymer upon
application of electrical bias. The actuation rate of ionic EAPs is relatively slow, but
compared to the electronic types of electroactive polymers, these usually require low voltage
to operate (or to hold the displacement). However, constant energy must be applied to ionic
EAPs to keep the system in an active state. Ionic EAPS include ionic polymer gels, ionic
polymer-metal composites (IPMCs), conductive polymers, and carbon nanotubes.
2.1.1.1 Ionic Polymer Gels
Ionic polymer gels, a class of ionic EAPs, carry ionic groups in the main or side chain, and
these ionic groups are counterbalanced by oppositely charged ions. These ions can diffuse in
and out of the polymer chains under an electrical field, with the formation of an alkaline
environment on the cathode side and an acidic environment on the anode side. The change of
the gel’s pH results in an ionic repulsion of like charges and serves to swell the polymer
chains. This chain and gel swelling is the actuation mechanism in this type of actuator.
Common polymers in this group include polyacrylic acid, polymethacrylic acid, polystyrene
sulfonic acid, and polyvinylphosphonic acid7,8.

12
2.1.1.2 Ionic Polymer-Metal Composites
Ionic polymer-metal composites (IPMCs) are bending actuators made of ionic polymers.
They consist of a perfluorinated ionomer polymer membrane and metal electrodes. The
polymer membrane is a solvent-swollen material, and the electrodes have a coating of metal,
such as Platinum. The membrane materials for IPMCs are often Nafion (sulfonated
tetrafluoroethylene-based fluoropolymer-copolymer) and Flemion (perfluorocarboxylate).
IPMCs require an ionic liquid or wet operating condition. Ionic liquid tetra-n-
butylammonium (TBA+) is also used to prepare IPMCs; Na+, K+, Li+, and Cs+ are typical
cations for the water solution.
When a cantilever strip of a solvated Nafion-based IPMC sample is subjected to an electric
potential of several volts (1-3 V) applied across its faces, it bends toward the anode with
stresses of 30 MPa and strains of 3%. This operation is described in Figure 2.2. Under the
same electrical potential, a backward relaxation is observed in these materials after they
reach maximum strain. The actuation and backward relaxation response are plotted in Figure
2.3.
The mechanical bending of the IPMC composite strip produces charge storage that is
opposite to the charge generation mechanism of fuel cells9. Typical actuation strains of ~10%
have been reported under an average applied voltage of 5 V 10. IPMCs have been proposed
for use in biomedical, aerospace, and oceanic robotics applications. They can serve as
vibration-sensing transducers, motion sensors, tactile sensors, micro pumps, fuel cells, and

13
hydrogen sensors11,12. IPMCs also display self-sensing of actuation achieved by evaluating
the electrical potential during actuation13,14.
2.1.1.3 Conductive Polymer Actuators
Conductive electroactive polymer actuators are conjugated polymers. They are capable of
alterations in chemical, electrical, and mechanical (shape, size, etc.) properties under an
Figure 2.2 Actuation mechanism of an IPMC13.
Figure 2.3 Example of actuation displacement of an IPMC over time11.

14
electrical impulse10. Conductive polymer actuators operate in an electrolyte environment.
Actuation is caused by the ingress and egress of ions, contained in an electrolyte bath, into
and out of the porous structure of the polymer. The process is driven by the conducting
polymer working as an electrode, along with another suitable nonreactive counter-
electrode15. Under a typical operating voltage of 1-5 V, first the addition of the ion causes the
polymer to swell, and then the removal of the ion causes the entire system to contract during
the redox cycles. This swelling and contraction causes the bending deformation16. The
chemical structure of a common conductive polymer, polyaniline, is shown in Figure 2.4.
The ratio of blocks determines the conductivity of the polyaniline.
Conducting polymer actuators have been reported to produce stresses of around 40 MPa with
a power-to-mass ratio of about 39 W/kg17. The actuation strain produced by conducting
polymer actuators is not more than 2%17. This strain limitation is due to ionic diffusion rates
inside the polymer and a limiting molecular backbone conformation under ionic diffusion18.
In addition to the low voltage requirement, the linear strain characteristics of conductive
Figure 2.4 Polyaniline, a conjugated polymer: leucoemeraldine (y = 1), emeraldine (y =
0.5), and pernigraniline (y = 0).

15
polymer actuators make them useful for precise motion control in many applications in
biomedicine and other fields18.
2.1.1.4 Carbon Nanotubes
Carbon nanotubes (CNTs) are hollow cylindrical particles that have extreme mechanical and
electrical properties due to their chemical structure and geometrical form. Typically the
CNTs have outer diameters in the range of 5-100nm and lengths in the range of 0.3-3 μm19.
As actuators, CNTs, immersed in an electrolyte solution (e.g., NaCl), act as
electromechanical active electrodes. Upon the application of electrical potential between the
CNTs and a counter-electrode, ions are attracted to the nanotubes, leading to the
accumulation of charges on the CNT surface. These charges are balanced by the electronic
charge within the CNTs, and the accumulation of the charges on the CNT surface leads to an
increase in the C-C bond length of the nanotube. This increase results in a bending actuation
as depicted in Figure 2.5.
The theoretically predicted limitation of axial strain is 1% for double-layer electrolyte CNT
actuators20, however a 0.2% axial strain was reported recently in an observed experimental
Figure 2.5 CNT-bending actuator 22.

16
actuation20,21. CNT actuators provide higher stress than any ferroelectrics or any natural
muscle, at around a 1 V potential20,22, and have very small actuation strains. Compared to
CNT actuators, graphene paper actuators made of two layers reportedly produced three times
more actuation strain, around 0.8%15. Response time is slow for both systems because of the
liquid electrolytes used23.
The charge injection to CNT actuators is implemented using solid electrolytes, which
increases response time and potential application areas. A randomly and magnetically
oriented buckypaper24 produced from single-walled CNTs has been tested up to 1500 V. A
fast response with 0.22% strain has been reported using magnetically aligned CNTs under
positive bias. A maximum of 10% bending actuation strain has been theoretically predicted
for this buckypaper CNT actuator23.
2.1.2 Electronic EAPs
Electronic EAPs are active polymers that respond to compressive electrostatic forces when
placed between two electrodes. Electronic EAPs require higher voltages to operate and
produce faster responses than ionic EAPs. Their actuation mechanism is also distinct from
that of ionic EAPs and can be either electrostatic or electrostrictive.
The two main groups of electronic EAPs are ferroelectric polymers and dielectric elastomers.
2.1.2.1 Ferroelectric Polymers
Ferroelectric polymers are crystalline polar polymers that maintain a permanent electric
polarization of dipoles. They generate strain due to spontaneous reverse polarization of
permanent dipoles under electrical fields. These crystalline polar polymers produce potential

17
with the application of compression in a process known as piezoelectricity. While non-
centrosymmetric materials exhibit piezoelectricity, nonconductive crystals and dielectric
materials display spontaneous and permanent electric polarization, called ferroelectricity, in
which an external electric field reverses the permanent polarization25,26.
In ferroelectric polymers, randomly oriented dipoles are aligned through the application of an
electrical field. This alignment of dipoles leads to a change in molecular transformation and,
as a result, a change in the length of the polymer, as shown in Figure 2.6. The cumulative
increase in molecular length induces a strain along a particular axis and is known as
electrostriction. This ferroelectric behavior is observed in ferroelectric materials in
temperatures below their Curie temperatures.
Poly-vinylidene fluoride (PVDF), polytrifluoroethylene, and odd-numbered nylons are
examples of ferroelectric polymers. PVDF and its copolymers have been widely studied for
Figure 2.6 PVDF. Left: tg+tg-; right: all trans.

18
their ferroelectric properties. These substances’ highly crystalline structure increases their
moduli and mechanical energy density. Recently, the typical 2% electrostrictive actuation of
P(VDF-TrFE) was increased to 4% by using electron irradiation to induce trans and gauche
formation in all chains of the ferroelectric polymer27. Moreover, the use of blends has
increased the dielectric constant of these materials by up to 300 at a frequency of 1 MHz.
Ferroelectric materials’ linear strain behavior also makes them useful as sensors and
transducers within the limits of their voltages27. Table 2.2 gives detailed information about
the PVDF molecular actuation system and achieved strain energy densities.
The configuration of a ferroelectric actuator is identical to that of other electronic EAPs. A
ferroelectric polymer surface coated with compliant electrodes forms the actuator. These
materials are often considered as high-dielectric constant fillers for the production of high-
dielectric constant composites.

19
2.1.2.2 Other Electrostrictive Polymers
Electrostrictive actuator materials—electronic EAPs similar to ferroelectric polymers—have
many benefits, including easy methods of production and high actuation performance. Graft
elastomers, electrostriction papers, and liquid crystal elastomers (LCEs) are examples of
electrostrictive materials.
Graft elastomers consist of a flexible backbone and grafted side crystal structures. The
electric field produces polar regions over the crystalline side chains. The orientations of
crystal regions move the polymer backbone and lead to actuation. These actuators show up to
a 4% actuation strain9.
Table 2.2 Comparison of ferroelectric actuator performance9.
Material Y(GPa) Typicalsm Ysm2/2(J/cm3) Ysm2/2p(J/kg)
Piezoceramic 64 0.1% 0.13 4.25
Magnetostrictor 100 0.2% 0.12 21.16
Pzn-Pt Single Crystal 7.7 1.7% 1 131
Polyurethane Elastomer 0.02 4% 0.016 13
P(VDF-TrFE)
Ferroelectric Polymer
0.38 4% 0.3 160

20
Electrostrictive paper is a chemically modified paper used for electrostriction. The
application of an electrical field produces a bending displacement within the paper. The
actuation efficiency varies depending on voltage, frequency, and assembly adhesives.
Electrostrictive paper is used in various applications, such as flexible speakers, sound-
absorbing materials, and smart shape-control devices.
Liquid crystal elastomers are elastomeric composites with liquid crystals fixed to elastomer
chains. Their actuation mechanism is triggered by heat, an electric field, or UV light28–30. The
actuation involves bending or shrinking, depending on the type of stimulus. The shrinking
actuation mechanism is occurred with a phase transition between nematic and isotropic
phases of mesogens28. The phase transition changes the elastomer network configuration, as
depicted in Figure 2.7. One cycle of an actuation takes approximately 20 sec31. The electrical
fields needed for liquid crystal elastomers are up to two orders of magnitude smaller (1.5 to
25 MV/m) than those needed for dielectric electroactive polymer (D-EAP) or ferroelectric
polymers, and dielectric constant enhancement decreases this further29. The achieved strain is
4%, much smaller than that achieved by thermally actuated types of LCEs (45%)29.

21
2.2 Dielectric Elastomers
Dielectric elastomers (DEs) are electronic EAPs formed from insulating polymer networks
with highly deformable mechanical properties and produce large strains induced by applied
electrical fields. Dielectric electroactive polymers (D-EAP) are known for their unique
properties of high actuation stress (up to 7 Pa)32, high actuation strain (>200%)33–39, high
specific energy density (~0.15 J/g)32, high coupling efficiency, fast response time (<3 sec)37,
and reliability40,41. They are also lightweight, flexible, easy to process, and inexpensive. They
offer tremendous potential for use in emerging technologies such as bio-inspired robots42–45,
prosthetic devices46,47, adaptive structures48, electroactive fluid pumps49,50, conformable
skins, refreshable Braille devices51,52, autofocus lens positioners53,54, speakers, shape and
texture systems55,56, active smart textiles47, sensors57, and energy harvesting systems58–68.
Figure 2.7 The reorientation of liquid crystals bonded to an elastomer network31.

22
2.2.1 Actuation Mechanism of D-EAPs
D-EAPs consist of a DE film sandwiched between two compliant electrodes. Figure 2.8
illustrates the D-EAPs actuation mechanism. When an electric potential is applied between
the compliant electrodes, the attraction between the oppositely charged electrodes and the
repulsion of like charges along the same electrode result in a compressive stress (PMaxwell)
that acts normal (i.e., perpendicularly) to the DE film surface. The normal pressure (primarily
Maxwell pressure) serves to compress the membrane in the z-direction and generates strains
in the x- and y-directions. The primary actuation mechanism is Maxwell stress produced by
the electrostatic forces between the two electrodes38,41,69,70.
As Figure 2.8 shows, the actuation mechanism for a D-EAP is comprised of a dielectric
elastomer membrane and two compliant electrodes.
Figure 2.8 Schematic representation of D-EAPs’ actuation mechanism.

23
The Maxwell pressure is expressed as follows:
𝑃𝑃𝑃𝑃𝑃𝑃𝑃𝑃𝑃𝑃𝑃𝑃𝑃𝑃𝑃𝑃 = 𝜀𝜀0𝜀𝜀𝑟𝑟𝐸𝐸2 = 𝜀𝜀0𝜀𝜀𝑟𝑟(𝑣𝑣/𝑃𝑃)2 Equation 2.1
where v/z = E is the electric field, 𝜀𝜀0 is the permittivity of free space, 𝜀𝜀𝑟𝑟 is the relative
dielectric constant of the membrane, v is the voltage, and z is the elastomer membrane
thickness.
The voltage required to achieve a target electrostatic pressure can be reduced by decreasing
the thickness of the elastomer film. For small strain conditions, the strain in the thickness
direction (z) can be expressed as follows:
Equation 2.2
where Y is the Young’s modulus of the elastomer membrane.
The stress and the resulting strain depend critically on the dielectric constant of the
membrane and its elastic modulus. The applied voltage and membrane thickness are the
design parameters of a DE actuator. Although electric field is a significant parameter, it is
subject to severe safety-related limitations in actuator design. The voltage limit is determined
by safety issues, and the thickness limits are determined by design and processing
constraints. A typical combination of thickness and voltage limits still produces electric
fields as high as 10-100 V/μm, which is a safety concern. Since the Young’s modulus of the
DE membrane can be controlled to match the stress-strain required for a given application,
the dielectric constant of the elastomer membrane is the only parameter to optimize for
actuation performance.

24
Potential methods for improving the dielectric constant of a DE are the same as for general
dielectric polymer composites and so include similar drawbacks. In addition to a high
dielectric constant, desirable properties of DEs include low viscos component of
viscoelasticity and low dielectric loss.
Energy density, defined as maximum energy output per cycle of an unconstrained actuator, is
a crucial actuator performance parameter. Energy density is expressed as follows:
Equation 2.3
where 𝑃𝑃𝑎𝑎 is the energy density of the actuator, p is the Maxwell pressure, Y is Young’s
modulus of the elastomer, and 𝑃𝑃𝑧𝑧 is the actuation strain in the thickness direction.
If a linear stress-strain relation is assumed for both low strains and high strains, the actuation
energy density (𝑃𝑃𝑎𝑎) can be expressed as follows:
Equation 2.4
by replacing 𝑃𝑃𝑧𝑧 in Equation 2.4 with Equation 2.2. Actuation energy density is given as
follows32,70:
Equation 2.5
Equation 2.5 shows the importance of the modulus of elasticity in determining energy
density. By fine-tuning mechanical and electrical properties so that viscous loss and
dielectric loss are minimized, efficiency of these materials as DEs can be increased. Thus, the
2( )a z ze ps Y s= =

25
level of actuation achieved can be increased by increasing the permittivity of the elastomer
(given by the product of the dielectric constant, k, and the permittivity of free space), of the
applied electric field, or of both.
2.2.2 DE Materials
Acrylics (3M VHB series)35,37,60,71––76, silicones36,77–81, poly-butadiene copolymers40,82–85,
interpenetrating networks86,87, isoprenes88, polyurathenes89–92, and block-copolymers82,83,85
are common DE materials. Of these, acrylics and silicones have been most often explored.
Although a wide variety of homopolymers have been considered as candidates for D-EAP
applications, three dielectric media in particular show technological promise. These include
VHB tape (an acrylic adhesive), silicone elastomers, and polyurethanes.
The most common dielectric material investigated for use as a DE is the VHB acrylic
pressure-sensitive adhesive film manufactured by 3M. This film is a closed-cell, chemically
cross-linked amorphous polyacrylate network, and it exhibits one of the largest actuation
strains in this class of materials. For this reason, it is often considered the benchmark for
dielectric EAPs. VHB film contains a combination of soft, branched aliphatic groups and
light cross-linking of the acrylic polymer chains32,93. The acrylic elastomer is transparent,
highly weather-resistant, and thermally stable in the -10 °C to 80 °C temperature range. It is
mechanically stable, with a Young’s modulus of 1-3 MPa, and can be stretched to 36 times
its initial area. The VHB acrylic material has been shown to produce an electromechanical
efficiency of around 90% and axial strains of 60-70%. A high blocking stress of 7.2 MPa and
an elastic energy density of 3.4 MJ/m3 have also been reported for these films33,94,95.

26
The actuator preparation of a VHB acrylic film is easier than for other elastomer films
because of its double-sided sticky surface. The surface stickiness of acrylic film makes the
application of electrodes and prestrain to films simple and easy.
Silicones are polymers with highly flexible Si-O backbones and organic groups that are
attached directly to the silicon atom via silicon-carbon bonds. Silicones can have linear,
branched, or cross-linked structural forms. There are different types of silicones based on the
presence of functional groups: dimethyl silicone elastomers, vinyl silicone elastomers, phenyl
silicone elastomers, nitrile silicone elastomers, fluorosilicone elastomers, borosilicones, and
silicone carbides. The commercial silicone elastomers are highly cross-linked
macromolecules of polydimethylsiloxane (PDMS) that have a high degree of flexibility.
Silicone elastomers have an array of useful properties, including high free volume, a high
degree of chemical inertness, high resistance to weathering, good dielectric strength, and low
surface tension, in addition to thermal and oxidative stability and an extremely low glass
transition temperature (-123 °C). These physical properties, including elastic behavior,
remain relatively unchanged over a wide range of temperatures. However, the mechanical
properties of pure PDMS are usually poor at room temperature—for example, tensile
strength is relatively low for chemically cross-linked PDMS networks. In order to develop
useful properties, very high molecular weights or the incorporation of silica filler and a
vulcanization process are required. Silicone films can be easily processed using spin-coating
or solution-casting methods.

27
The commercial silicones are formed from three chemical components: polymer, hardener,
and silica particles. These three components are formulated in a two-part system, depending
on the cross-linking mechanism of silicone. Silica fillers are used in either one or both of
these parts as nucleating agents to improve mechanical properties96.
Silicone elastomer actuators have the desirable properties of fast response time and high
efficiency. The chemistry and molecular weight of the polysiloxanes also influence actuation
performance. Operating temperatures of silicones range from -65-240 °C, and the stability of
silicone actuators has been demonstrated from -15-150 °C. Silicones are less sensitive to
environmental degradation than acrylic elastomers. The most common commercial-grade
silicone elastomers are CF 19-21 from NuSil, Dow Corning HS3, Slygard 186, DBJB
Enterprises TC-5005, and Wacker Elastosil RT 62536,37,97–99.
Silicones show actuation strains of up to 120%, an efficiency of 80%, and an energy density
of 750 kJ/m3. They have a faster response time than acrylics32,37,81, and they also have a
dielectric constant of ~3, with a very low dielectric loss of ~0.005 (100 kHz). Silicone D-
EAPs can also operate over a wide temperature range.
Silicone elastomers’ mechanical behavior varies with the type and amount of added cross-
linker. A higher number of methylene groups in the hardener increases the number of
reactive sites in the main polymer chain and so decreases the polymer’s flexibility98. Silicone
elastomers are mechanically tunable materials with some amount of silica or hardener in their
composition. The actuation behavior of silicone with various hardeners is reported by Zhang
et al.98 and is displayed in Figure 2.9.

28
Thermoplastic polyurethanes (TPUs) are a versatile group of multi-phase segmented
polymers that have excellent mechanical and elastic properties, high abrasion, and high
chemical resistance. TPUs are physically cross-linked polymers composed of hard and soft
segments. The ratio of the hard to soft segments is an important factor of the polymer’s
mechanical and electrical properties.
TPU elastomer is an electrostrictive polymer composed of a chain of organic units joined by
urethane links. These links combine two bi- or higher functional monomers. The actuation
stress of PU is high as a result of its high dielectric constant (𝜀𝜀𝑃𝑃𝑃𝑃 = 8). However, its actuation
stress is not transferred to strain in dielectric elastomer actuator form because of the stiffness
of the polymer network. The highest applied electric field shown so far is 5 V/µm, which is
quite small due to the material’s high dielectric loss, which, in turn, is caused by free ions
from residues of the polymerization process100.
Figure 2.9 Effects of hardener amount on actuation strain for DC3481 silicone
elastomer100.

29
The actuation strain produced by a PU elastomer has both electrostrictive and electrostatic
components. Depending on the elastomer’s mechanical properties, the electrostrictive
coefficient (Q) varies from 150-450 ×10–18 m2/V2, and the dielectric constant varies from 4-8.
The contribution of Maxwell stress is higher at temperatures above room temperature90.
In recent years, triblock copolymers have been employed as thermoplastic dielectric
elastomers. They exhibit excellent electromechanical properties, including large actuation
strains and high coupling efficiency (>90%)88. Block copolymers of thermoplastic elastomers
Table 2.3 Actuation response of common dielectric elastomers85.
Dielectric Elastomer
Elastic Energy Density,
J/cm3
Pressure, MPa
Strain, %
Young’s Modulus,
MPa
Electric Field, V/µm
Dielectric Constant
Coupling Efficiency
%
Silicone Nusil CF19-2186 0.22 1.36 32 1.0 235 2.8 54
Silicone DC HS3 0.026 0.13 41 0.125 72 2.8 64 Silicone DC Sylgard 186 0.082 0.51 32 0.7 144 2.8 54
Polyurethane Deerfield PT6100S
0.087 1.6 11 17 160 7.0 21
Fluorosilicone DC 730 0.055 0.39 28 0.5 80 6.9 48
Fluoroelastomer Lauren L143HC 0.0046 0.11 8 2.5 32 12.7 15
Isoprene Natural Rubber 0.0059 0.11 11 0.85 67 2.7 21
SEBS161 Copolymer 5-30w% Midblock
0.151 - Areal 180
0.007-0.163 133 1.7-2 80
SEBS217 Copolymer 5-30w% Midblock
0.139 - Areal 245
0.002-0.133 98 2-2.2 92

30
have attracted attention as dielectric transducers—unlike silicone and acrylic elastomers, they
are physically cross-linked structures that exhibit a variety of morphologies. Shankar et al.88
found that the actuation performance of triblock copolymer organogel elastomers with
swollen midblock-selective solvent exceeded that of an acrylic film. The authors reported
actuation areal strains of 250% with an electrical field of 22 V/μm, with 5 weight percent of
midblock polymer composition. Their work shows the benefits of tailoring Young’s modulus
for better actuation strains, because the dielectric constant of the copolymer gel (2.0-2.2) did
not change substantially85. Additionally, these elastomer gels present better actuation strain
than either acrylic or silicone elastomers under various prestrains101. Table 2.3 reports
common dielectric elastomer materials used as D-EAP materials.
2.2.3 D-EAP Electrodes
The performance of a D-EAP depends significantly on electrode quality. An electrode for a
D-EAP must maintain two properties: compliance to the elastomer and conductivity. An
ideal electrode material should be mechanically compatible with the dielectric elastomer in
that it imposes no constraint.
Schlaak et al.102 summarized the important parameters for electrode material design as
follows:
• High compliance
• Low resistance under planar extension
• High surface under large strain to ensure high electrostatic charges
• Good adhesion to the dielectric membrane layer

31
• Easy manufacturing
After the electrode charging completes, the response time of an actuator depends on the
viscoelastic properties of the dielectric membrane. High conductivity is another important
property that increases the response speed of an actuator103. Conductivities as low as
10−3 S/cm could be accepted for electrode materials.
Metallic paints (e.g., silver grease or paint) are one of the most common materials used for
DE actuator electrodes due to their ease of application, high compliance, affordability, and
strong adhesion to dielectric membranes38,40,40,104,105. Sputtered metal layers have also been
studied as compliant electrodes. However, even with patterning enhancements, surface
cracks adversely affect conductivity under application of high strains106–109. Self-healing
silver sputter electrodes reportedly produce up to 50% areal strains with high reliability79.
Dry graphite and carbon powders have been used on tacky surfaces (e.g., VHB acrylic tapes),
and elastomer composites of these organic fillers with low cross-linking densities show good
properties as spray electrodes110. Geometric wrinkling performed on an elastomer surface
before electrode application has been shown to improve electrode and actuator
performance111, and the application of silicone oil to elastomeric composite electrodes has
been shown to have an increase on actuator lifetime102,112–114.
Another recently proposed electrode system consists of CNT electrodes with self-repairing
properties. Local spots on these electrodes burn out when “shorted”; however, the process is
so quick and generates so little heat energy that the dielectric remains intact113,115.

32
2.2.4 Electromechanical Instability of D-EAPs
Electromechanical instability, also known as pull-in instability, is a type of breakdown that
results in a dramatic decrease in polymer thickness and an increase in electric field. Such
instability leads to catastrophic failure and has most often been observed in power
transmission cables. Electromechanical instability can be mitigated by pre-stretching an
elastomer, designing an elastomer of interpenetrating networks, swelling an elastomer with a
solvent, or spraying charge on an electrode-free elastomer83,86,101,116.
Vargantwar et al. demonstrated that selectively swollen acrylic triblock copolymers can
enhance the actuation of a polymer without any prestrain101. Rontgen’s electrode-free charge
sprays were demonstrated to act as effective D-EAP electrodes without pull-in
instability116,117.
2.2.5 The Effect of Prestrain on D-EAPs
Prestrain is routinely applied to DE films during the fabrication of the DE actuator. The
application of prestrain requires homogeneous deformation of the elastomer. A circular
fixture is used for prestrain application, depending on the actuator configuration, as depicted
in Figure 2.10. The introduction of prestrain significantly increases the maximum strain and
pressures that can be generated from a dielectric elastomer actuator because it causes strain-
softening of the elastomer film and eliminates the film’s electromechanical
instabilities32,39,87,94,118–121.

33
An elastomer with covalent cross-links can have varying degrees of flexibility. Highly
flexible polymer chains undergo large deformations, whereas less flexible ones become fully
stretched under a pretension. Fully stretched elastomers behave like rigid structures with
minimal deformation, as depicted in Figure 2.11(a). The applied electrical field produces a
compressive strain, as depicted in Figure 2.11(b), and the effect of strain-softening can be
observed in this structure. The negative effect of strain-softening on actuation can be
prevented either by applying a prestrain or by making structural changes in the elastomer
material122.
The amount of prestrain that is applied to an elastomer also determines the buckling behavior
of the elastomer film during actuation. D-EAP buckling is a signal of insufficient prestrain in
a dielectric elastomer actuator and indicates that the stress in the thickness direction is not
sufficient to exceed the electrode boundary stresses.
Figure 2.10 A circular actuator with fixture. The elastomer is attached to a circular fixture
after a nominal prestrain application.

34
Pelrine and colleagues demonstrated a dramatic increase in actuation strain, pressure, and
energy density of dielectric elastomer films as the result of increasing prestrain in acrylic and
silicone elastomers32,123. They reported a biaxial prestrain of 200-400% for acrylic (VHB
4905 by 3M) to achieve optimal actuation. Although biaxial strains do not typically display a
preferred actuation direction, uniaxial prestrains direct the actuation primarily in the softer
(or lower prestrain) direction32. Higher amounts of prestrain stiffen the polymer, limiting
actuation performance. Koh et al. predicted the theoretical required optimal prestrain, taking
into account electromechanical instability and strain softening. Their predictions have been
empirically supported by actuation experiments using acrylic films122.
Figure 2.11 Mechanical effects of prestrain on actuation performance: a) mechanical
deformation, b) electrical deformation, c) electrical deformation with prestrain122.

35
The application of prestrain thins the film and increases its breakdown strength32,94,123 by
eliminating electromechanical instabilities. Figure 2.12 shows the influence of unidirectional
prestrain on a PDMS elastomer. The increasing prestrain stiffens the film and decreases
actuation performance. A nominal prestrain has a positive effect on electrical breakdown of
silicone elastomer dielectric actuators. Figure 2.13 plots nominal thickness strain versus
prestrain levels124.
Figure 2.12 Actuation behavior of PDMS elastomers under various strains (a) Strain vs
electric field for PDMS actuators. The dotted line drawn perpendicular to 40V/µm is
guide for eye. The numbers at the tops of the plots show the level of prestrain100. (b)
Effect of prestrain levels on electrical breakdown (PDMS elastomer). Strain-prestrain plot
was plotted from reference100.
a) b)
0
5
10
15
20
40 58 72 82
Stra
in (%
)
Prestrain

36
Prestrain application to a DE elastomer material also increases the size and weight of the
actuator because the application requires a frame125. It can also degrade the desired properties
of the DE, as the DE undergoes prolonged stress relaxation over long periods of inactivity.
Polymer interpenetrating networks have been used as prestrain-free D-EAP materials due to
their locked molecular structure126,127. These elastomers maintain internal prestrain in their
free form.
2.2.6 Response Time of D-EAPs
The response time of an actuator depends on two main factors. The first is the conductivity of
the electrodes, which can introduce delay into charge and discharge characteristics. The
second factor is the viscosity of the elastomer. Figure 2.14 compares acrylic and silicone
elastomer response times. Silicone elastomers reach their maximum actuation strain in 3 sec,
whereas acrylic elastomers can take up to 3 min to reach maximum strain98.
Figure 2.13 Relative actuation performance versus electrical field for various prestrained
PDMS films126.

37
2.2.7 DE-based Energy Harvesting
Energy harvesting using dielectric elastomers is based on converting mechanical work to
electrical energy. Dielectric elastomer generators (DEGs) are flexible, lightweight candidates
for energy-scavenging systems60.
Research on the use of DEGs in energy harvesting has increased recently. McKay et al.68
report that initial charges of 2kV can generate up to 0.5kV of output voltages. Jean Mistral et
al.61 and Cohen et al.9 report 0.1–0.4mJ/g of energy harvesting from DEGs manufactured
using VHB acrylic film.
Several proposed energy-harvesting application areas for elastomers include wind tunnels,
human motions 61, ocean waves 64, highways, and ultrasound energy sources128. The energy
conversion mechanism of DEGs is similar to that of D-EAPs. DEGs are kept in a deformed
state, and free charges are confined to electrodes in their inactive state. The voltage increases
in a capacitive system because of the reverse deformation of the elastomer. DEGs are
Figure 2.14 Speed response plots of a) PDMS, b) acrylic elastomer actuators100.

38
supported with a circuit to capture the excess charges and keep the system at optimum
potential59,70.
2.3 Summary
This review has focused on electroactive polymers and dielectric elastomer actuators. Special
attention has been given to dielectric elastomers and dielectric elastomer actuators.
2.4 References
1. Badr, B. M. & Ali, W. G. Applications of Piezoelectric Materials. Adv. Mater. Res.
189-193, 3612–3620 (2011).
2. Heywang, W., Lubitz, K. & Wersing, W. Piezoelectricity: evolution and future of a
technology. (Springer, 2008).
3. Zhang, P. Industrial control technology: a handbook for engineers and researchers.
(William Andrew, 2008).
4. Juan, J. S., No, M. L. & Schuh, C. A. Nanoscale shape-memory alloys for ultrahigh
mechanical damping. Nat Nano 4, 415–419 (2009).
5. Lagoudas, D. C. Shape memory alloys: modeling and engineering applications.
(Springer, 2008).
6. Hamilton, R. F. Investigations into the physical mechanisms that facilitate
transformation hysteresis in shape memory alloys. (ProQuest, UMI Dissertation
Publishing, 2011).
7. Carpi, Kornbluh, R., Sommer-Larsen, P., Rossi, D. D. & Alici. Guest editorial
introduction to the focused section on electroactive polymer mechatronics.
IEEE/ASME Trans. Mechatron. 16, 1–8 (2011).

39
8. Kim, K. J. & Tadokoro, S. Electroactive Polymers for Robotic Applications: Artificial
Muscles and Sensors. (Springer Science & Business Media, 2007).
9. Bar-Cohen, Y. Electroactive polymer (EAP) actuators as artificial muscles. (SPIE
Press, 2004).
10. Tiwari, R. & Garcia, E. The state of understanding of ionic polymer metal composite
architecture: a review. Smart Mater. Struct. 20, 083001 (2011).
11. Anand, S. V., Arvind, K., Bharath, P. & Roy Mahapatra, D. Energy harvesting using
ionic electro-active polymer thin films with Ag-based electrodes. Smart Mater.
Struct. 19, 045026 (2010).
12. Zamani, S. & Nemat-Nasser, S. Controlled actuation of Nafion-based ionic polymer-
metal composites (IPMCs) with ethylene glycol as solvent. in Electroactive Polymer
Actuators and Devices 5385, 0277–786X/04 (SPIE Press).
13. Kruusamäe, K. et al. Self-sensing ionic polymer-metal composite actuating device
with patterned surface electrodes. Polym. Int. 59, 300–304 (2010).
14. Kobayashi, T. & Omiya, M. Frequency response of IPMC actuator with palladium
electrode. in Electroactive Polymer Actuators and Devices 7976, 797614–797614–7
(SPIE Proceedings, 2011).
15. Xie, X., Bai, H., Shi, G. & Qu, L. Load-tolerant, highly strain-responsive graphene
sheets. J. Mater. Chem. 21, 2057 (2011).
16. Pei, Q. & Inganäs, O. Electrochemical applications of the bending beam method; a
novel way to study ion transport in electroactive polymers. Solid State Ion. 60, 161–
166 (1993).

40
17. Madden, P. G. A., Madden, J. D. W., Anquetil, P. A., Vandesteeg, N. A. & Hunter, I.
W. The relation of conducting polymer actuator material properties to performance.
IEEE J. Ocean. Eng. 29, 696–705 (2004).
18. Anquetil, P. A. et al. Thiophene-based conducting polymer molecular actuators. in
Proc SPIE 4695, 424–434 (2002).
19. Reich, S., Thomsen, C. & Maultzsch, J. Carbon nanotubes: basic concepts and
physical properties. (Wiley-VCH, 2004).
20. Baughman, R. H. et al. Carbon nanotube actuators. Science 284, 1340 (1999).
21. Yun, Y. et al. A multi-wall carbon nanotube tower electrochemical actuator. Nano
Lett. 6, 689–693 (2006).
22. Baughman, R. H. et al. Carbon Nanotube Actuators. Science 284, 1340–1344 (1999).
23. Chen, I.-W. P., Liang, Z., Wang, B. & Zhang, C. Charge-induced asymmetrical
displacement of an aligned carbon nanotube buckypaper actuator. Carbon 48, 1064–
1069 (2010).
24. Gonnet, P. et al. Thermal conductivity of magnetically aligned carbon nanotube
buckypapers and nanocomposites. Curr. Appl. Phys. 6, 119–122 (2006).
25. Fukada, E. Ferroelectric polymers: a special issue of the journal phase transitions.
(Taylor & Francis US, 1989).
26. Nalwa, H. S. Ferroelectric polymers. (CRC Press, 1995).
27. Zhang, Q. M., Bharti, V. & Zhao, X. Giant electrostriction and relaxor ferroelectric
behavior in electron-irradiated poly(vinylidene fluoride-trifluoroethylene) copolymer.
Science 280, 2101 –2104 (1998).

41
28. Yu, Y. & Ikeda, T. Soft actuators based on liquid‐crystalline elastomers. Angew.
Chem. Int. Ed. 45, 5416–5418 (2006).
29. Ji, Y., Huang, Y. Y., Rungsawang, R. & Terentjev, E. M. Dispersion and alignment
of carbon nanotubes in liquid crystalline polymers and elastomers. Adv. Mater. 22,
3436–3440 (2010).
30. Yang, H., Ye, G., Wang, X. & Keller, P. Micron-sized liquid crystalline elastomer
actuators. Soft Matter 7, 815 (2011).
31. Warner, M. & Terentjev, E. M. Liquid crystal elastomers. (Oxford University Press,
USA, 2003).
32. Pelrine, R., Kornbluh, R., Pei, Q. & Joseph, J. High-speed electrically actuated
elastomers with strain greater than 100%. Science 287, 836–839 (2000).
33. Ma, W. & Cross, L. E. An experimental investigation of electromechanical response
in a dielectric acrylic elastomer. Appl. Phys. Mater. Sci. Process. 78, 1201–1204
(2004).
34. Carpi, F., Mazzoldi, A. & De Rossi, D. High-strain dielectric elastomer for actuation.
in Smart Struct. Mater. 2003 Electroact. Polym. Actuators Devices EAPAD (ed. Bar-
Cohen, Y.) 5051, 419–422 (SPIE, 2003).
35. Jordi, C., Schmidt, A., Kovacs, G., Michel, S. & Ermanni, P. Performance evaluation
of cutting-edge dielectric elastomers for large-scale actuator applications. Smart
Mater. Struct. 20, 075003 (2011).
36. Goulbourne, N. C., Mockensturm, E. M. & Frecker, M. I. Electro-elastomers: Large
deformation analysis of silicone membranes. Int. J. Solids Struct. 44, 2609–2626
(2007).

42
37. Michel, S., Zhang, X. Q., Wissler, M., Löwe, C. & Kovacs, G. A comparison between
silicone and acrylic elastomers as dielectric materials in electroactive polymer
actuators. Polym. Int. 59, 391–399 (2010).
38. O’Halloran, A., O’Malley, F. & McHugh, P. A review on dielectric elastomer
actuators, technology, applications, and challenges. J. Appl. Phys. 104, 071101–10
(2008).
39. Zhu, L. H., Zhu, X. L., E, S. J., Hui, A. F. & Cao, J. B. Influence of prestrain on
output characteristic of dielectric elastomer film actuators. Key Eng. Mater. 455, 81–
86 (2010).
40. Shankar, R., Ghosh, T. K. & Spontak, R. J. Dielectric elastomers as next-generation
polymeric actuators. Soft Matter 3, 1116 (2007).
41. Stoyanov, H., Kollosche, M., Risse, S., McCarthy, D. N. & Kofod, G. Elastic block
copolymer nanocomposites with controlled interfacial interactions for artificial
muscles with direct voltage control. Soft Matter 7, 194 (2011).
42. Anderson, I. A., Ieropoulos, I. A., McKay, T., O’Brien, B. & Melhuish, C. Power for
robotic artificial muscles. Mechatron. IEEE/ASME Trans. On 16, 107–111 (2011).
43. Hyouk Ryeol Choi et al. Biomimetic soft actuator: design, modeling, control, and
applications. IEEE/ASME Trans. Mechatron. 10, 581– 593 (2005).
44. Goethals, P. & Leuven, K. U. Tactile feedback for robot assisted minimally invasive
surgery: an overview. Department of Mechanical Engineering KU Leuven, Tech. Rep
(2008).
45. Taya, M. Bio-inspired design of intelligent materials. in Smart Structures and
Materials 5051, 54–65 (2003).

43
46. Biddiss, E. & Chau, T. Dielectric elastomers as actuators for upper limb prosthetics:
Challenges and opportunities. Med. Eng. Phys. 30, 403–418 (2008).
47. Carpi, F. & De Rossi, D. Electroactive polymer-based devices for e-textiles in
biomedicine. Inf. Technol. Biomed. IEEE Trans. On 9, 295–318 (2005).
48. Prahlad, H. et al. Programmable surface deformation: thickness-mode electroactive
polymer actuators and their applications. in Electroactive Polymer Actuators and
Devices (ed. Bar-Cohen, Y.) 5759, 102–113 (SPIE Proceedings, 2005).
49. Arthur, G. G., McKeon, B. J., Dearing, S. S., Morrison, J. F. & Cui, Z. Manufacture
of Micro-sensors and Actuators for Flow Control. Microelectron. Eng. 83, 1205–1208
(2006).
50. Carpi, F., Menon, C. & De Rossi, D. Electroactive elastomeric actuator for all-
polymer linear peristaltic pumps. IEEE/ASME Trans. Mechatron. 15, 460–470
(2010).
51. Chakraborti, P. Development of a Refreshable Prototype Actuator Using Silicone
Dielectric Elastomer Actuator (DEA). (North Carolina State University, 2010).
52. Mazzone, A., Zhang, R. & Kunz, A. Novel actuators for haptic displays based on
electroactive polymers. in Proc. ACM Symp. Virtual Real. Softw. Technol. - VRST 03
196 (2003). doi:10.1145/1008653.1008688
53. Choi, S. T., Lee, J. Y., Kwon, J. O., Lee, S. & Kim, W. Varifocal liquid-filled
microlens operated by an electroactive polymer actuator. Opt. Lett. 36, 1920–1922
(2011).
54. Tang, H. Smart lens made of dielectric elastomer: simulation study. Bull. Am. Phys.
Soc. 56, (2011).

44
55. Ouyang, G., Wang, K., Henriksen, L., Akram, M. N. & Chen, X. Y. A novel tunable
grating fabricated with viscoelastic polymer (PDMS) and conductive polymer
(PEDOT). Sens. Actuators Phys. 158, 313–319 (2010).
56. Ouyang, G. M., Wang, K. Y. & Chen, X. Y. Enhanced electro-mechanical
performance of TiO2 nano-particle modified polydimethylsiloxane (PDMS) as
electroactive polymers. in Solid-State Sensors, Actuators and Microsystems
Conference 614–617 (2011).
57. Toth, L. Design and development of dielectric elastomer transducers with dual
actuation and sensory functionality. (National Library of Canada, 2002).
58. Davies, D. K. Charge generation on dielectric surfaces. J. Phys. Appl. Phys. 2, 1533–
1537 (1969).
59. Lo, H. C., Mckay, T., O’Brien, B. M., Calius, E. & Anderson, I. Circuit design
considerations for regulating energy generated by dielectric elastomer generators. in
SPIE Proceedings 7946, 79760C–79760C–8 (2011).
60. Koh, S. J. ., Keplinger, C., Li, T., Bauer, S. & Suo, Z. Dielectric elastomer generators:
how much energy can be converted? Mechatron. IEEE/ASME Trans. On 16, 33–41
(2011).
61. Jean-Mistral, C., Basrour, S. & Chaillout, J.-J. Dielectric polymer: scavenging energy
from human motion. in Electroact. Polym. Actuators Devices EAPAD 2008 10 March
2008 6927, 692716–1 (SPIE - The International Society for Optical Engineering,
2008).
62. Putson, C. et al. Effects of copper filler sizes on the dielectric properties and the
energy harvesting capability of nonpercolated polyurethane composites. J. Appl.
Phys. 109, 024104 (2011).

45
63. Guyomar, D. et al. Electrostrictive energy conversion in polyurethane
nanocomposites. J. Appl. Phys. 106, 014910 (2009).
64. Beeby, S. P., Tudor, M. J. & White, N. M. Energy harvesting vibration sources for
microsystems applications. Meas. Sci. Technol. 17, R175–R195 (2006).
65. Cao, J. et al. in Advanced Electrical and Electronics Engineering (ed. Lee, J.) 201–
207 (Springer Berlin Heidelberg, 2011).
66. Ogden, R. & Steigmann, D. Mechanics and Electrodynamics of Magneto-And
Electro-Elastic Materials. 527, (Springer Verlag, 2011).
67. Kang, G., Kim, K.-S. & Kim, S. Note: Analysis of the efficiency of a dielectric
elastomer generator for energy harvesting. Rev. Sci. Instrum. 82, 046101 (2011).
68. McKay, T. G., O’Brien, B. M., Calius, E. P. & Anderson, I. A. Soft generators using
dielectric elastomers. Appl. Phys. Lett. 98, 142903 (2011).
69. Madden, J. D. W. et al. Artificial muscle technology: physical principles and naval
prospects. IEEE J. Ocean. Eng. 29, 706–728 (2004).
70. Pelrine, R. et al. High-field deformation of elastomeric dielectrics for actuators.
Mater. Sci. Eng. C 11, 89–100 (2000).
71. Pei, Q. Artificial muscles based on synthetic dielectric elastomers. in Annual
International Conference of the IEEE Engineering in Medicine and Biology Society,
2009. EMBC 2009 6826–6829 (2009). doi:10.1109/IEMBS.2009.5334480
72. Jan, A. et al. Broadening the actuation temperature range for acrylic dielectric
elastomers. ASME Conf. Proc. 2009, 283–287 (2009).

46
73. Kollosche, M., Stoyanov, H., Ragusch, H. & Kofod, G. Dependence on boundary
conditions for actuation characteristics of dielectric elastomer actuators. in 7642, 1–9
(2010).
74. Lochmatter, P. Electromechanical model for static and dynamic activation of
elementary dielectric elastomer actuators. in Proc. SPIE 61680,1–13 (2006).
doi:10.1117/12.657873
75. Kofod, G., Stoyanov, H. & Gerhard, R. Multilayer coaxial fiber dielectric elastomers
for actuation and sensing. Appl. Phys. A 102, 577–581 (2010).
76. Zhao, X. & Suo, Z. Theory of dielectric elastomers capable of giant deformation of
actuation. Phys. Rev. Lett. 104, 178302 (2010).
77. Jordan, G. et al. Actuated micro-optical submount using a dielectric elastomer
actuator. IEEE/ASME Trans. Mechatron. 16, 98–102 (2011).
78. Son, S. & Goulbourne, N. C. Dynamic response of tubular dielectric elastomer
transducers. Int. J. Solids Struct. 47, 2672–2679 (2010).
79. Low, S. H. & Lau, G. K. High actuation strain in silicone dielectric elastomer
actuators with silver electrodes. 7976, 797636–797636–11 (2011).
80. Ahnert, K., Abel, M., Kollosche, M., Jørgensen, P. J. & Kofod, G. Soft capacitors for
wave energy harvesting. Journal of Materials Chemistry 21, 14492 (2011).
81. Araromi, O. A. et al. Spray deposited multilayered dielectric elastomer actuators.
Sens. Actuators Phys. 167, 459–467 (2011).
82. Shankar, R., Ghosh, T. K. & Spontak, R. J. Electroactive nanostructured polymers as
tunable actuators. Adv. Mater. 19, 2218–2223 (2007).

47
83. Shankar, R., Ghosh, T. K. & Spontak, R. J. Electromechanical response of
nanostructured polymer systems with no mechanical pre‐strain. Macromol. Rapid
Commun. 28, 1142–1147 (2007).
84. Shankar, R., Ghosh, T. K. & Spontak, R. J. Mechanical and actuation behavior of
electroactive nanostructured polymers. Sens. Actuators Phys. 151, 46–52 (2009).
85. Shankar, R., Krishnan, A. K., Ghosh, T. K. & Spontak, R. J. Triblock copolymer
organogels as high-performance dielectric elastomers. Macromolecules 41, 6100–
6109 (2008).
86. Goulbourne, N. C. A constitutive model of polyacrylate interpenetrating polymer
networks for dielectric elastomers. Int. J. Solids Struct. 48, 1085–1091 (2011).
87. Li, B. et al. Effect of mechanical pre-stretch on the stabilization of dielectric
elastomer actuation. J. Phys. Appl. Phys. 44, 155301 (2011).
88. Puvanatvattana, T. et al. Electric field induced stress moduli in
polythiophene/polyisoprene elastomer blends. React. Funct. Polym. 66, 1575–1588
(2006).
89. Huang, C., Zhang, Q. M. & Bhattacharya, K. All-organic dielectric-percolative three-
component composite materials with high electromechanical response. Appl. Phys.
Lett. 84, 4391 (2004).
90. Zhang, Q. M., Su, J., Kim, C. H., Ting, R. & Capps, R. An experimental investigation
of electromechanical responses in a polyurethane elastomer. J. Appl. Phys. 81, 2770–
2776 (1997).
91. Guillot, F. M., Jarzynski, J. & Balizer, E. Measurement of electrostrictive coefficients
of polymer films. J. Acoust. Soc. Am. 110, 2980 (2001).

48
92. Wang, H. et al. The origins of electromechanical response in polyurethane
elastomers. in Proc. Ninth IEEE Int. Symp. Appl. Ferroelectr. 1994ISAF 94 182–185
(IEEE, 1991). doi:10.1109/ISAF.1994.522333
93. Österbacka, R., An, C. P., Jiang, X. M. & Vardeny, Z. V. Two-dimensional electronic
excitations in self-assembled conjugated polymer nanocrystals. Science 287, 839 –
842 (2000).
94. Kofod, G., Sommer-Larsen, P., Kornbluh, R. & Pelrine, R. Actuation response of
polyacrylate dielectric elastomers. J. Intell. Mater. Syst. Struct. 14, 787 –793 (2003).
95. Plante, J.-S. & Dubowsky, S. Large-scale failure modes of dielectric elastomer
actuators. Int. J. Solids Struct. 43, 7727–7751 (2006).
96. Yim, A. & St. Pierre, L. E. The effect of interfacial energy on heterogeneous
nucleation in the crystallization of polydimethysiloxane. J. Polym. Sci. [B] 8, 241–
245 (1970).
97. Gallone, G., Carpi, F., De Rossi, D., Levita, G. & Marchetti, A. Dielectric constant
enhancement in a silicone elastomer filled with lead magnesium niobate–lead titanate.
Mater. Sci. Eng. C 27, 110–116 (2007).
98. Zhang, X., Wissler, M., Jaehne, B., Breonnimann, R. & Kovacs, G. Effects of
crosslinking, prestrain, and dielectric filler on the electromechanical response of a
new silicone and comparison with acrylic elastomer. in 5385, 78–86 (2004).
99. Lotters, J. C., Olthuis, W., Veltink, P. H. & Bergveld, P. The mechanical properties of
the rubber elastic polymer polydimethylsiloxane for sensor applications. J.
Micromechanics Microengineering 7, 145–147 (1997).
100. Kofod, G. Dielectric elastomer actuators. Tech. Univ. Den. Ph.D. Thesis (2001).

49
101. Krishnan, A. S., Vargantwar, P. H., Ghosh, T. K. & Spontak, R. J. Electroactuation of
solvated triblock copolymer dielectric elastomers: Decoupling the roles of mechanical
prestrain and specimen thickness. J. Polym. Sci. Part B Polym. Phys. 49, 1569–1582
(2011).
102. Schlaak, H. F., Jungmann, M., Matysek, M. & Lotz, P. Novel multilayer electrostatic
solid state actuators with elastic dielectric (Invited Paper). in Electroactive Polymer
Actuators and Devices 5759, 121–133 (2005).
103. Delille, R. Novel compliant electrodes based on platinum salt reduction. in
Proceedings of SPIE 6168, 61681Q–61681Q–11 (2006).
104. Mockensturm, E. M. & Goulbourne, N. Dynamic response of dielectric elastomers.
International Journal of Non-Linear Mechanics 41, 388–395 (2006).
105. Pelrine, R., Kornbluh, R. & Kofod, G. High-strain actuator materials based on
dielectric elastomers. Adv. Mater. 12, 1223–1225 (2000).
106. Trujillo, R., Mou, J., Phelan, P. E. & Chau, D. S. Investigation of electrostrictive
polymers as actuators for mesoscale devices. Int. J. Adv. Manuf. Technol. 23, 176–
182 (2004).
107. Urdaneta, M. G., Delille, R. & Smela, E. Stretchable electrodes with high
conductivity and photo-patternability. Adv. Mater. 19, 2629–2633 (2007).
108. Lacour, S. P., Wagner, S., Huang, Z. & Suo, Z. Stretchable gold conductors on
elastomeric substrates. Appl. Phys. Lett. 82, 2404 (2003).
109. Rosset, S., Niklaus, M., Dubois, P. & Shea, H. R. Large-stroke dielectric elastomer
actuators with ion-implanted electrodes. Microelectromechanical Syst. J. Of 18,
1300–1308 (2009).

50
110. Kujawski, M., Pearse, J. D. & Smela, E. Elastomers filled with exfoliated graphite as
compliant electrodes. Carbon 48, 2409–2417 (2010).
111. Watanabe, M., Shirai, H. & Hirai, T. Wrinkled polypyrrole electrode for electroactive
polymer actuators. J. Appl. Phys. 92, 4631 (2002).
112. Kujawski, M., Pearse, J. & Smela, E. PDMS/graphite stretchable electrodes for
dielectric elastomer actuators. in 7642, 76420R–76420R–9 (2010).
113. Frackowiak, E., Metenier, K., Bertagna, V. & Beguin, F. Supercapacitor electrodes
from multiwalled carbon nanotubes. Applied Physics Letters 77, 2421–2423 (2000).
114. Yuan, W. et al. New electrode materials for dielectric elastomer actuators. in
Electroact. Polym. Actuators Devices EAPAD 2007 (ed. Bar-Cohen, Y.) 6524,
65240N–12 (SPIE, 2007).
115. Yuan, W. et al. Self-clearable carbon nanotube electrodes for improved performance
of dielectric elastomer actuators. in Electroactive Polymer Actuators and Devices
6927, 69270P–69270P–12 (SPIE Proceedings, 2008).
116. Keplinger, C., Kaltenbrunner, M., Arnold, N. & Bauer, S. Rontgen’s electrode-free
elastomer actuators without electromechanical pull-in instability. Proc. Natl. Acad.
Sci. 107, 4505–4510 (2010).
117. Li, B., Zhou, J. & Chen, H. Electromechanical stability in charge-controlled dielectric
elastomer actuation. Appl. Phys. Lett. 99, 244101 (2011).
118. Wissler, M. & Mazza, E. Modeling of a pre-strained circular actuator made of
dielectric elastomers. Sens. Actuators Phys. 120, 184–192 (2005).
119. Palakodeti, R. & Kessler, M. R. Influence of frequency and prestrain on the
mechanical efficiency of dielectric electroactive polymer actuators. Mater. Lett. 60,
3437–3440 (2006).

51
120. Zhao, X. & Suo, Z. Method to analyze electromechanical stability of dielectric
elastomers. Appl. Phys. Lett. 91, 061921 (2007).
121. Kofod, G. The static actuation of dielectric elastomer actuators: how does pre-stretch
improve actuation? J. Phys. Appl. Phys. 41, 215405 (2008).
122. Koh, S. J. A. et al. Mechanisms of large actuation strain in dielectric elastomers. J.
Polym. Sci. Part B Polym. Phys. 49, 504–515 (2011).
123. Kornbluh, R. D., Pelrine, R., Pei, Q., Oh, S. & Joseph, J. Ultrahigh strain response of
field-actuated elastomeric polymers. in Smart Struct. Mater. 2000 Electroact. Polym.
Actuators Devices EAPAD (ed. Bar-Cohen, Y.) 3987, 51–64 (SPIE, 2000).
124. Dielectric Elastomers as Electromechanical Transducers: Fundamentals, Materials,
Devices, Models and Applications of an Emerging Electroactive Polymer
Technology. (Elsevier Science, 2008).
125. Brochu, P. & Pei, Q. Advances in dielectric elastomers for actuators and artificial
muscles. Macromol. Rapid Commun. 31, 10–36 (2010).
126. Brochu, P., Niu, X. & Pei, Q. Acrylic interpenetrating polymer network dielectric
elastomers for energy harvesting. in SPIE Proceedings 7976, 797606–797606–8
(2011).
127. Ha, S. M., Yuan, W., Pei, Q., Pelrine, R. & Stanford, S. Interpenetrating polymer
networks for high-performance electroelastomer artificial muscles. Adv. Mater. 18,
887–891 (2006).
128. Cha, S. et al. Porous pvdf as effective sonic wave driven nanogenerators. Nano Lett.
11, 5142–5147 (2011).

52
CHAPTER 3 Dielectric Composites
Abstract
In this literature review, the dielectric behavior of materials and polymers is discussed, with a
focus on the general characteristics of dielectric composites. The dielectric laws and
corresponding formulae—which describe homogeneous and composite materials including
state-of-the-art nano-engineered dielectric materials—are explored. The effects of fillers—
such as ceramics, metals, and organic substances that have exceptional properties on
dielectric polymer composites—are discussed with respect to several engineering
applications. Dielectric elastomer composites are also reviewed, and the effects of high-
dielectric constant materials on actuation performance are discussed. Finally, a set of theories
for characterizing the insulating properties of polymer composites and their dielectric
constants are described and analyzed.
3.1 Dielectric Properties of Polymers
Dielectrics are insulating materials that do not conduct electricity. When such a material is
placed between the electrodes of a parallel-plate capacitor, it brings about an increase in
capacitance and exhibits a reversible orientation of molecules and electrons. This behavior is
demonstrated under both low and high electrical fields. While low electrical field properties
are related to chemical composition, high electrical fields properties are characteristics of
dielectric strength. Under low electrical fields, it is possible to measure the dielectric
constant, the dissipation factor, and the electrical conductivity of a dielectric. A high
electrical field yields information about electric discharge, dielectric breakdown, and arc
resistance1.

53
3.1.1 Dielectric Constant and Polarization
The dielectric constant (denoted as k or ε) of a material is the ratio of the electrical
permittivity of the material to the permittivity of vacuum and thus is a dimensionless
quantity. The dielectric constant is also the ratio of the two capacitance measurements of
parallel plate electrodes with and without insulating material placed between the electrodes.
The polarization of the substance between parallel plate capacitors produces a disparity
between two capacitance measurements, resulting in a capacitance increase. The relationship
between capacitance, substance geometry, and dielectric constant is given in Equation 3.1.
The measure of electric charge storage in a dielectric is known as capacitance, C, and is
calculated as follows:
𝐶𝐶 =ε0ε𝑟𝑟𝐴𝐴𝑡𝑡
Equation 3.1
where 𝜀𝜀0 is the dielectric constant of the free space (8.854×10⁻¹² F/m), A is the area of the
electrical conductor, t is the thickness of the dielectric layer, and 𝜀𝜀𝑟𝑟 is the dielectric constant
of the medium.
The dielectric constant measurement varies with frequency of alternating current,
temperature, and voltage because, as a bulk property, the molecular structure of the material
influences its charge storage and polarization under different conditions. The dielectric
constant under the equilibrium electric field is known as the static dielectric constant, or low-
frequency dielectric constant.

54
An increase in the frequency of the external electrical field during measurement is followed
by a lag attributable to the dielectric relaxations in the medium. The dielectric constant of a
medium is proportional to the total relaxations (i.e., polarizations) in the medium:
𝜀𝜀 ∝ 𝑃𝑃𝑛𝑛𝑛𝑛𝑛𝑛 Equation 3.2
where 𝑃𝑃𝑛𝑛𝑛𝑛𝑛𝑛 is the net polarization of the system and 𝜀𝜀 is the dielectric constant of the
medium.
In dielectric materials, unlike in conductors, charges are tightly held with associated protons.
An electric field results in polarization that stores energy inside the material. Net polarization
in a material results from the cumulative effect of the following five types of polarizations:
Electronic
Ionic
Molecular (dipole)
Interfacial (space-charge) polarization2–5
Hyperpolarization6–8
These five polarization types are represented in Figure 3.1 and are described in more detail
below. The equation for net polarization is as follows:
Equation 3.3

55
Electronic polarization (𝑃𝑃𝑛𝑛𝑒𝑒𝑛𝑛𝑒𝑒𝑛𝑛𝑟𝑟𝑒𝑒𝑛𝑛𝑒𝑒𝑒𝑒) is the displacement of electron clouds relative to the
center of the atom under electrical fields. This displacement happens over a remarkably short
period of time—about 10-15 sec. The dielectric contribution of electronic polarization is small
compared to that of other polarization mechanisms, since the movements of the contributing
electrons are small. Electronic polarization is calculated as follows:
Figure 3.1 Schematic representation of the five types of polarizations: a) Pelectronic, b)
Pionic, c) Pmolecular, d) Pinterfacial, e) Phyperelectronic
(a)
(b)
(c)
(d)
(e)

56
Equation 3.4
where r is the radius of the electron cloud around an atom2,5.
Ionic polarization (𝑃𝑃𝑒𝑒𝑒𝑒𝑛𝑛𝑒𝑒𝑒𝑒) is a shift of electrons within ionic substances. Specifically, it is an
ionic movement from atoms that have extra charges, such as alkali halides, under electrical
fields. These extra charges add up to an electronic polarization, and the movements store
energy and increase material capacitance. Ionic polarization occurs around 10-15 sec and
influences the dielectric constant to a lesser extent than does electronic polarization 1,2,5,9.
Equation 3.5
Molecular polarization (𝑃𝑃𝑚𝑚𝑒𝑒𝑒𝑒𝑛𝑛𝑒𝑒𝑚𝑚𝑒𝑒𝑎𝑎𝑟𝑟), also known as dipolar polarization, occurs in substances
that contain permanent dipole movement resulting from the unbalanced sharing of electrons
by atoms within a molecule. The rotations of the permanent dipoles enable alignment with
the external electric field, causing orientation polarization. Depending on the amount of
frictional resistance present, a 10-12-10-15 sec frequency range is characteristic of this type of
polarization. Even with zero electrical field conditions, molecular orientations cause local
polarization to appear2,5, as represented in Equation 3.6.
Equation 3.6
Interfacial polarization (𝑃𝑃𝑒𝑒𝑛𝑛𝑛𝑛𝑛𝑛𝑟𝑟𝑖𝑖𝑎𝑎𝑒𝑒𝑒𝑒𝑎𝑎𝑒𝑒) is a common phenomenon when materials with phase
boundaries and voids are under alternating electrical fields. The accumulated charges at the

57
interphase of a transitional region create interfacial polarization. Trapped charges move with
changes in frequency and depend on the interface bonding and interphase structure. The
typical frequency range for this type of polarization is 10-3 -103 sec2–5.
Hyper-electronic polarization (𝑃𝑃ℎ𝑦𝑦𝑦𝑦𝑛𝑛𝑟𝑟𝑦𝑦𝑒𝑒𝑒𝑒𝑎𝑎𝑟𝑟𝑒𝑒𝑧𝑧𝑎𝑎𝑛𝑛𝑒𝑒𝑒𝑒𝑛𝑛) is a long-range molecular polarization
observed in polymers and biopolymers. This type of polarization has been observed in highly
aromatized eka-conjugated polymers (polyacene quinone radical [PAQR] polymers) that
carry untied electrons and hole-type carriers. Long-range traveling of untied electrons along
the polymer chain is the main cause of this nomadic molecular polarization. Hyper-electronic
polarization is of greater magnitude than electronic polarization, and its characteristics
include remnant magnetization, metallic conductivity, and unusual pressure sensitivity.
Hyper-electronically polarizable materials exhibit high dielectric constants—up to 100,000—
which makes them highly desirable for use in developing novel dielectric and optical
materials10.
Hyper-polarization has also been observed in biomacromolecules. One such substance is the
highly polarizable biological molecule elastine which is found in the human ear. This
molecule is responsible for converting sound vibrations to neuroelectrical signals11. The
frequency dependency of each polarization mechanism is shown in Figure 3.2.
The dielectric constant of a non-polar material is proportional to square of its refractive
index. However, this relation can rarely be observed experimentally because the two
measurements are frequency-dependent and measured in different frequencies.

58
3.1.2 Dielectric Loss
Dielectric loss is the imaginary part of the complex dielectric constant, and it provides
information about the electrical inefficiency of a dielectric material. The dielectric constant
and dielectric loss together form a complex number that indicates the relative actual
polarizations and actual losses of a dielectric system.
Equation 3.7
The imaginary part of this number is calculated from the response delay of capacitance under
an applied electric field. This delay is frequency-dependent and is shown as loss tangent,
tan(δ), or dissipation, D. The quality factor, Q, is another representation of dissipation in a
dielectric system. Q is the inverse of the dissipation factor.
Figure 3.2 Dielectric behavior versus frequency.

59
Equation 3.8
Considering the effect of conductivity, the dielectric constant is expressed as follows:
Equation 3.9
and the dissipation is expressed as:
Equation 3.10
where ε’ and ε” are the real and imaginary parts of the dielectric permittivity, respectively; σ
is the electrical conductivity of the materials; f is the frequency; and Q is the quality factor of
the dielectric substance.
Dielectric losses arise from conductivity, molecular relaxations, polarizations, and interfacial
polarizations in the material. Conduction loss, attributed to the DC electrical conductivity of
the material, represents the flow of the actual charge through the dielectric materials.
Interfacial loss originates from the excessively polarized interface induced by the fillers,
more specifically from the movement or rotation of the atoms or molecules in an alternating
electric field. The losses arising from ionic conductivity and relaxations of polarizations are
depicted in Figure 3.2. Any high-dielectric constant material is a candidate for use in most
capacitor applications if the dielectric loss has a small value—i.e., 0.01 or lower.

60
3.1.3 Dielectric Spectroscopy of Polymers
Dielectric spectroscopy is an instrumental method of exploring molecular structure,
conformation, and dynamics through inferences from dielectric responses over varying
frequencies and temperatures. Dielectric spectroscopy has been used to:
• document the dielectric behavior of well-known polymers,
• relate mechanical, NMR, relaxation, and dielectric properties,
• gather more information about dielectric relaxation of polymers through comparison
of results with theoretical values,
In dielectric spectroscopy, applying an alternating electrical field, 𝐸𝐸𝑤𝑤, results in the
polarization, P, of the material. The polarizations inside the material give molecular-level
information about the test material based on changes in the electrical field over a wide
frequency range.
Since dielectric elastomer transducers are amorphous, the dielectric behavior of amorphous
polymers is particularly noteworthy. Amorphous polymers show dielectric loss spectra of α-
relaxation, β-relaxation, and normal-mode relaxation. Normal-mode relaxation occurs over
frequencies below the α-relaxation peak. It is explained by complete chain motion of the
polymer.

61
β, α, and normal-mode relaxation all have unique relaxation rates, relaxation strengths, and
loss-peak shapes. β-relaxation is based on local dipole movements, and its relaxation rate
shows Arrhenius-like behavior, as shown in Figure 3.3. The β-relaxation loss peak is
symmetric and is 4 to 6 decays wide. A temperature increase decreases the width of the β-
relaxation loss peak. Although β-relaxation has been observed below temperature 𝑇𝑇𝑔𝑔,
broadband studies also show β-relaxation occurring at temperatures above 𝑇𝑇𝑔𝑔 .
α-relaxation loss refers to the glass transition of material at a dielectric frequency of 10-3 Hz
and corresponds to the 𝑇𝑇𝑔𝑔 value of differential scanning calorimeter (DSC) measurement.
The glass transition temperature depends on micro-Brownian segmental motions of the
chains. For bulk polymers, intermolecular interactions also contribute to α-relaxation. The
Figure 3.3 Dielectric loss spectra of polymethylacrilate12.

62
relaxation rate is described by the Vogel-Fulcher-Tammann (VFT) equation for amorphous
polymers. The α-relaxation peak has an asymmetric shape with a width of 2-6 decays,
depending on the measurement temperature and cross-linking density of the polymer.
Increasing the temperature decreases α-relaxation and merges the α- and β-relaxation peaks.
Dielectric normal-mode relaxation is observed in polymers that have parallel dipole side
groups on their polymer backbone. The parallel-placed dipoles in the polymer chain and the
chain relaxations contribute to this relaxation. This relaxations provide information about the
structure and dynamics of the polymer chains. Dielectric loss data are analyzed with the
Cole-Cole, Cole-Davidson, and Fuoss-Kirkwood functions, all of which provide better
representations of the origins of molecular-level relaxation than that provided by frequency-
dependent raw dielectric data12–14.
3.1.4 Dielectric Breakdown
Dielectric strength is an intrinsic property that characterizes any homogeneous, pure material
and is measured through the application of high voltage to the dielectric material for a short
period. Electrical breakdown is the catastrophic failure of solid or liquid insulators under
such high-voltage electrical fields. In a dielectric breakdown test, several breakdown
mechanisms can be observed:
3.1.4.1 Erosion Breakdown
There are defects in the forms of voids and cavities within the dielectric material and/or in
the boundaries between the electrode and the solid. These voids usually have lower
breakdown strengths than the dielectric medium itself. While the field intensity in the cavity

63
is higher than in the dielectric material, voids reduce the permittivity of the filling medium,
causing its dielectric erosion.
3.1.4.2 Streamer Breakdown
In a dielectric system, as an electron enters the conduction band of the dielectric at the
cathode, it moves toward the anode under the electrical field. The electron releases energy
via electron collisions. In some cases, the free path before a collision is long, and, as a result,
an additional electron is produced after collision. Eventually, after many repetitions, a gas-
like electron avalanche forms. Streamer theory explains that dielectric breakdown begins
after this avalanche reaches a crucial size.
3.1.4.3 Edge Breakdown and Treeing
In insulation systems in which the solid is electrically stressed within another solid or gas
material, the weaker medium will influence breakdown voltage to a greater extent than the
stronger medium. This breakdown from weaker substance to stronger substance results in the
formation of a single discharge channel, leading to the formation of a tree-like structure.
3.1.4.4 Electromechanical Breakdown
The application of high voltage increases the electrostatic attraction and repulsion of surface
charges insulator, resulting in stress in the thickness direction of an insulator. Before
dielectric breakdown, this stress is in equilibrium with mechanical compressive stress at the
outside of a material along the thickness axis. If the electrostatic pressure is higher than the
mechanical stress, then electromechanical breakdown will occur. This breakdown works as a
constraint, playing a significant role in determining the limits of an electrostatic actuator.

64
3.1.4.5 Thermal Breakdown and Tracking
Dielectric loss is a significant parameter in selecting the materials for insulation applications.
Dielectric losses cause heat production in the medium due to polarization and conductivity.
Because heat enhances the conductivity of the medium, dielectric loss ultimately leads to
material instability and thermal breakdown.
Tracking is the formation of a conducting path across a surface of insulation as a result of
degradation. This degradation takes the form of carbonization and volatilization of the
insulating material due to heat created by tiny sparks. Adding suitable fillers to a polymer
inhibits carbonization and reduces tracking rates. Polymer structure also affects tracking
rates.
For a dielectric material, charge capacity is limited by dielectric breakdown field limits. The
maximum electrical field before breakdown determines the breakdown charge capacity, or
breakdown Maxwell pressure, for a dielectric elastomer:
Equation 3.11
where 𝐸𝐸𝑏𝑏𝑟𝑟𝑛𝑛𝑎𝑎𝑏𝑏 is the electrical field at the point of material breakdown. 𝐸𝐸𝑏𝑏𝑟𝑟𝑛𝑛𝑎𝑎𝑏𝑏 is lower for
polymer composites than for pure polymers, displaying a substantial decrease in material
dielectric strength.
A very rough schematization of dielectric breakdown voltage limits can be calculated if the
polymer is assumed to be a purely elastic, homogeneous material at low strains. Under such

65
conditions, and in the case of Maxwell-stress actuation, the nominal breakdown field of the
material is given by the following equation:
Equation 3.12
where ε‘ is the dielectric permittivity of the material, Y is its elastic modulus, 𝑉𝑉𝑏𝑏𝑟𝑟𝑛𝑛𝑎𝑎𝑏𝑏 is the
breakdown voltage of the sample, and 𝑑𝑑0 is its thickness at rest. This equation shows that
increasing the dielectric permittivity of a polymer leads to a decrease in its dielectric
strength. A local field theory of dielectric media assumes that the local breakdown field of
the matrix is the same, with the matrix breakdown field in the composite form15:
Equation 3.13
However, Equation 3.13 is correct if the polymer is assumed to be homogeneous; polymer
composites also follow this relation16. Moreover, dielectric mixing rules must be taken into
account if these equations are to be applied to polymer composites.
3.1.5 Charge Transport in Polymers and Nanocomposites
There are two types of carriers in polymers: electrons (holes) and ions. The free volume
amount is important for ionic charge transport in polymers; a decrease has been reported in
ionic conductivity under pressure17, resulting from a decrease in free volume.
Charge transport in an insulating system, J, is measured by current density and depends on
electrical field, E, and conductivity, σ:

66
Equation 3.14
For metals and semiconductors, σ is calculated as follows:
Equation 3.15
where e is the elementary charge of a proton (1,602×10-12 C); µn and µp are the mobility of
electrons and holes, respectively; n is the concentration of electrons; and p is the
concentration of holes.
While well-known equations such as Equation 3.14 and Equation 3.15 fit all materials
universally, these equations are also well suited for describing polymers. However, for a
polymer, both amorphous and crystalline regions must be accounted for to understand charge
transport. In crystalline regions, charge delocalization is possible, and charges are expelled to
amorphous regions, where it is possible to observe hole movements18.
In semi-crystalline polymers, such as polyethylene, transport mechanisms depend on
different regions. While crystalline regions show evidence of injections, combinations, and
anion electron generation, amorphous regions show evidence of charge-trapping and space
charges18. Various mechanisms of electrical transportation for polymer insulators are
summarized in Figure 3.4.

67
Understanding the distribution of charges along the cross-section of a dielectric medium is
extremely important for understanding the high-voltage behavior of polymers and their
composites. For a parallel-plate capacitor, electrodes behave like n+, while the insulator has
more holes and is considered p-. As holes and electrons combine, the excess electrons
produce a space charge, called a “homocharge,” that gathers around the cathode. The anode
has a large quantity of negative space charges due to hole injection, which causes field
enhancement at this electrode. This negative field enhancement is known as “heterocharge”
(see Figure 3.5).
Figure 3.4 A wide variety of charge transports in an insulator18.

68
The Stern layer consists of the atom layers responsible for charge accumulation on electrode
surfaces and particle surfaces (see Figure 3.6). This structure has a significant impact on
dielectric measurements and mechanisms because of electrode polarization and electric field
distribution18–20.
Figure 3.5 a) Schematic representation of p- and n-type regions of an insulating polymer;
b) the accumulation of heterocharges and homocharges over an insulator in the first 10 sec
of voltage application under various electrical fields. Right: cathode; left: anode19.
(a)
(b)

69
3.2 Dielectric Constant Enhancement
One of the major challenges in the development of dielectric elastomer actuators is the high
electrical field requirement—actuating these elastomer films requires voltages of up to 400
V/μm. This high electrical field requirement is typically addressed by lowering the electrical
field in a number of ways, one of which is to use dielectric fillers to increase the dielectric
constant so as to reduce the required field for a certain strain. Other common methods used to
increase the dielectric constant of a medium include making use of the interfacial
polarization and Coloumb Blockade. These methods are discussed in later sections.
Figure 3.6 Stern diffuse double layer produced by nanoparticles on a charged surface
within a dielectric composite18.

70
3.2.1 Interfacial Polarization
Interfacial polarizations arise around the fillers or defects in a dielectric. Dielectric fillers
with dimensions below 200nm have different properties than do those with larger size fillers.
(This difference is reviewed further in Sections 4.3.1 and 4.3.2.) The scaling law that applies
to comparable quantities does not represent the nanodielectric composites. Since interfaces
dominate dielectric behavior at nano-size, they become extremely important for
nanodielectrics4.
Over a gradient between two materials, interface properties can have a gradually changing
impact, or the interface can have characteristics distinct from those of the two materials
themselves. This behavior is shown in Figure 3.7 Intensity, 𝐼𝐼1, shows the behavior of
properties like concentration of materials and energy density. These properties show a
gradual change throughout the interphase. 𝐼𝐼2 type properties, such as metal-dielectric contact
Figure 3.7 Effect of particle interface size (in nm) on intensity of physical properties4.

71
and electron concentration (depicted in Figure 3.8), electron hole concentration, mechanical
stress, and interfacial surface energy show a peak behavior throughout the transition between
the two materials.
These interface properties become meaningful when long-range forces are around 10nm. The
influence of the interface can be controlled by a reduction in particle size and an increase in
volumetric concentration. The surface conductivity of the particle interfaces also influences
the dielectric constant, ε, by producing dipoles at low frequencies21,22.
Figure 3.8 Increase of interface volume (a) Relationship between filler diameter versus
interface volume, representation of relationship given in plot. (b) In image A is filler B is
matrix4.

72
The O’Konski model4 explains the induced dipoles along the surface of a particle and the
interphase polarizations between the dielectric filler and the polymer matrix. The long-range
movement of charges around the filler results in accumulation of like charges around the
particle, the whole charge distribution in media become heterogeneous under varying
electrical fields. Figure 3.9(b) depicts the distribution of surface charges varying with
electrical field.
3.2.2 Coulomb Blockade (CB) Effect of Metal Nanoparticles
The Coulomb blockade is the increase in resistance at low-bias voltages in a metal-polymer
composite. The metal nanoparticles in a matrix can present a blockade to electrons because
of an island-sea arrangement, observed as a single electron tunnel junction. The dielectric
loss of the conductive filler-polymer composite shows evidence of single-electron tunneling
inside a polymer matrix23,24. These conductive nanoparticles behave like an infinite number
of series capacitors inside the polymer matrix (see Figure 3.10 for a representation of this
model). Furthermore, these particles increase the capacitance and resistance of the polymer
Figure 3.9 The O’Konski model assumes a conductive interface layer on a particle: (a) E
= 0, (b) E � 04.

73
composite due to electron blockades. Lu et al.25 report that silver nanoparticles, in situ-
synthesized in an epoxy resin, show lower dielectric loss than a pristine polymer with lower
concentrations due to the effect of the Coulomb blockade.
3.3 Dielectric Polymer Nanocomposites
Nanodielectrics are dielectric materials consisting of more than one species, at least one of
which is less than 100nm dimensions in size21,22,26–28. Nanodielectrics differ from other
dielectric composites in the following ways29:
• They have higher dielectric constants.
• They display a linear increase in breakdown with increasing filler concentration.
• They display a higher endurance strength than that of their matrix and fillers.
Figure 3.10 a) Schematic representation of a Coulomb blockade; b) model of the structure
as two capacitors in a series; c) capacitance performance versus voltage results computed
theoretically26.
c)

74
Because of their relatively high energy density, low cost, high reliability, high electric
breakdown field, and low dielectric loss, dielectric polymer nanocomposites are of interest in
many applications, including electrical energy storage, electronic packaging, high energy-
density applications30,31, and electrical insulation.
The preferred process for working with high-k dielectric composite fillers is to convert them
into nanodielectrics by introducing nanoparticles. These dielectric composites can help
achieve thinner dielectric films, which result in higher capacitances. Therefore, more
nanoparticles of ceramic, metallic, or even organic semiconductors have recently been
introduced into the preparation of high-k dielectric materials32–39.
Polymer nanocomposites can be processed using any one of four known methods:
• In situ polymerization
• Melt blending
• The solvent casting method
• The sol-gel method
The in situ polymerization and melt blending methods are the most commonly used
techniques for manufacturing thermosetting and thermoplastic polymers and nanoparticles.
3.3.1 Polymer Nanocomposites
The main advantage of in situ polymerization of composites is that it enables grafting of
nanofillers onto polymer chains or side groups. This technique is particularly useful for the
preparation of insoluble and thermally unstable polymers, which cannot be processed through
75
solution or melt methods. Depending on the polymer’s required molecular weight and
molecular weight distribution, chain transfer, radical, anionic, and ring-opening metathesis
polymerizations can be used for in situ polymerization processing.
Melt blending is a method for processing thermoplastic polymers through high temperatures.
The main advantages of this technique are fast processing times and simplicity. Amorphous
polymers can be processed above their glass transition temperature, and semi-crystalline
polymers show softening behavior above their melting temperatures.
The solvent casting method is all solution-processing method. It follows these processing
steps:
• Dispersion of particles in either a solvent or a polymer solution through energetic
agitation.
• Mixing of nanoparticles and polymers in a solution through energetic agitation
• Controlled evaporation of a solvent, which leaves a composite film
3.3.2 Ferroelectric Ceramic/Polymer Composites
High-k ceramics have been widely investigated as fillers for polymer composites in various
dielectric applications, such as embedded capacitors, dielectric elastomers, and energy

76
storage. A ceramic dielectric filler is classified as belonging to one of three different
categories depending on its permittivity:
• Low permittivity (ε up to 15)
• Medium permittivity (ε between 15 and 500)
• High permittivity (ε between 500 and 20,000)
BaTiO3 is an example of a high-permittivity material. TiO2 lies in the medium range, while
silicates are in the low-permittivity range30. Incorporation of ceramic fillers into a polymer
matrix increases the composite dielectric constant, which is calculated from the ratio of the
polymer matrix volume to the ceramic filler volume. The composite dielectric constant
therefore lies somewhere between the polymer dielectric constant and the ceramic dielectric
constant. This method of incorporating ceramic fillers into a polymer matrix combines the
advantages of polymer properties and polymer processing with the advanced dielectric
properties of ceramics such as lead titanium oxide (PbTiO3), lead zirconate titanate
(Pb(Zr,Ti)O3), PMN-PT (Pb(Mg1/3Nb2/3O3) ± PbTiO3), lead magnesium niobate-lead titanate
(PMN-PT), barium titanate (BaTiO3), and titanium dioxide (TiO2). Although both filler and
matrix components have unique properties, combining matrix and filler in a composite and
retaining the properties of each in their entirety is challenging.
Incorporation of ceramic fillers into a polymer matrix increases the composite dielectric
constant, which is calculated from the ratio of the polymer matrix volume to the ceramic
filler volume. The composite dielectric constant therefore lies somewhere between the
polymer dielectric constant and the ceramic dielectric constant. This method of incorporating
77
ceramic fillers into a polymer matrix combines the advantages of polymer properties and
polymer processing with the advanced dielectric properties of ceramics such as lead titanium
oxide (PbTiO3), lead zirconate titanate (Pb(Zr,Ti)O3), PMN-PT (Pb(Mg1/3Nb2/3O3) ±
PbTiO3), lead magnesium niobate-lead titanate (PMN-PT), barium titanate (BaTiO3), and
titanium dioxide (TiO2). Although both filler and matrix components have unique properties,
combining matrix and filler in a composite and retaining the properties of each in their
entirety is challenging.
In its early phase, polymer dielectric research focused on incorporating micron-sized
ceramics into polymer matrices. Larger ceramic fillers exhibit considerably higher
permittivity than nanoparticles due to the effect of the crystal structure of ceramic fillers.
Additionally, the polymer morphology is not affected for larger ceramic-polymer
composites: End-chain or side-chain structure is not hindered by ceramic fillers40–42.
Because of their highly polar crystal structure, barium titanate (BaTiO3) fillers allow for the
production of reasonably high-dielectric constant composites. Particle size affects the
cooperative movements of dipoles and can change the alteration of particle crystal structures
from tetragonal to cubic or pseudocubic. The particle’s size affects the crystal structure of the
ceramic. Thus, this change in size results in the phonon softening of a particle, which
contributes to the spontaneous polarization of the material41. This crystal structure
modification is because of BaTiO3’s low permittivity.
Kakimato et al.40 used barium titanate to study the effect of particle size on dielectric
composites. Their results show that the dielectric constants of BaTiO3 suspensions from large

78
BaTiO3 fillers (>300nm) do not increase, while the dielectric constant of suspensions does
increases with smaller particle sizes, of 70-200nm. The dielectric constant of BaTiO3 is
reported to be around 1,500 for BaTiO3 suspensions at 70nm, so this particle size of 70nm is
the optimum particle size for BaTiO3 because it has the highest dielectric constant for
nanoparticles40,42.
Increasing the amount of ceramic filler in a polymer composite is an effective method for
obtaining a high-k composite. A drawback of this method, however, is the loss of the unique
and desirable properties of pure polymers, such as low modulus and low flexibility. Poor
dispersion of particles, poor adhesion at the particle/matrix interface, and trapped air in the
composite may cause undesirable problems in polymer composites43.
However, due to their crystal structures and sizes, not all nanoparticles show the cumulative
effect of polarization shown by micron-sized particles. The nanofillers have a higher ratio of
surface area to volume than other fillers, and they display an increase in dielectric constant.
Ceramic nanofillers lead to improved homogeneous internal charge distribution within a
composite material and increased material dielectric strength20,44. Ceramic nanofillers also
affect polymer cohesive energy density and free volume.
Nelson et al.45 studied 23-nm and micron-sized TiO2 fillers in an epoxy-based matrix. A
pulsed electroacoustic measurement method was developed to determine the inner charge
distribution of a polymer composite. In inner charge distribution experiments, researchers
observed that the theory of interfacial polarization did not explain the organization of TiO2 in
composites. Extremely small TiO2 particles move together with the polymer host under an

79
electrical field. A 10% loading was suggested for nanoparticles to provide optimally improve
in a composite’s mechanical and electrical properties20.
Nanoparticle dispersion and the adhesion between the nanoparticles and the polymer matrix
were increased using several techniques, including in situ polymerization of particles in the
matrix and surface functionalization of the nanoparticles46–48. Core-shell structures, as shown
in Figure 3.11, were obtained by applying electrostatic forces to the surfaces of barium
titanate nanoparticles49. Core-shell nanoparticles were also used, and the matrix was prepared
through in situ polymerization. These techniques improved the polymer composites by
increasing the dielectric constant of these films; their mechanical properties and dielectric
loss values were comparable to those of neat polymers50.
Imperfections in the dielectric and mechanical properties of polymer-ceramic composites
occur due to a lack of interfacial bonding between the ceramic particles and the polymer
Figure 3.11 TEM image of BaTiO3/PI composite film made through in situ
polymerization with BaTiO351.
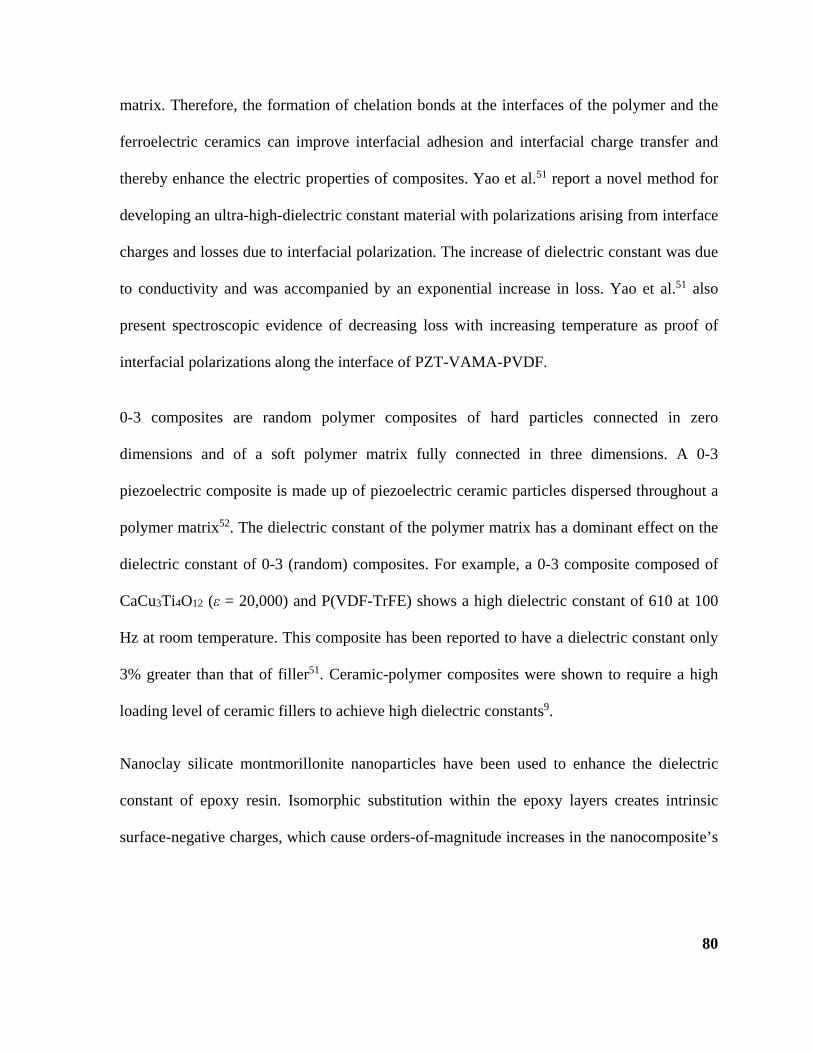
80
matrix. Therefore, the formation of chelation bonds at the interfaces of the polymer and the
ferroelectric ceramics can improve interfacial adhesion and interfacial charge transfer and
thereby enhance the electric properties of composites. Yao et al.51 report a novel method for
developing an ultra-high-dielectric constant material with polarizations arising from interface
charges and losses due to interfacial polarization. The increase of dielectric constant was due
to conductivity and was accompanied by an exponential increase in loss. Yao et al.51 also
present spectroscopic evidence of decreasing loss with increasing temperature as proof of
interfacial polarizations along the interface of PZT-VAMA-PVDF.
0-3 composites are random polymer composites of hard particles connected in zero
dimensions and of a soft polymer matrix fully connected in three dimensions. A 0-3
piezoelectric composite is made up of piezoelectric ceramic particles dispersed throughout a
polymer matrix52. The dielectric constant of the polymer matrix has a dominant effect on the
dielectric constant of 0-3 (random) composites. For example, a 0-3 composite composed of
CaCu3Ti4O12 (ε = 20,000) and P(VDF-TrFE) shows a high dielectric constant of 610 at 100
Hz at room temperature. This composite has been reported to have a dielectric constant only
3% greater than that of filler51. Ceramic-polymer composites were shown to require a high
loading level of ceramic fillers to achieve high dielectric constants9.
Nanoclay silicate montmorillonite nanoparticles have been used to enhance the dielectric
constant of epoxy resin. Isomorphic substitution within the epoxy layers creates intrinsic
surface-negative charges, which cause orders-of-magnitude increases in the nanocomposite’s

81
dielectric constant. These intrinsic charges have been reported to also improve ionic
conductivity53.
Bimodal distribution of ceramic nanoparticles within a matrix is a recognized way of
increasing the dielectric constant of polymer composites. Tummala et al.54 report that a
bimodal distribution of ceramic-epoxy composites yields a dielectric constant of 135 due to
the packing improvement.
Changing the spatial distribution of fillers in the polymer matrix can enhance the dielectric
properties of 0-3 composites. The application of an electric field to a polymer composite in
its pre-cured form, as shown in Figure 3.12, aligns nanoparticles according to field. These
composites are termed 1-3 composites when particles are aligned in the z-direction. Tomer et
al.55 investigated the effect of electrical field alignment of nanoparticles on the dielectric
constant of a composite material. In a 1-3 dielectric composite, orientation in the z-direction
increases the dielectric constant and decreases the dielectric loss. The application of an
Figure 3.12 Electrical field alignment of fillers in a polymer composite.

82
electric field in the x-y plane results in the alignment of nanoparticles parallel to this plane.
The electrical field-aligned composites have slightly higher dielectric constants and lower
dielectric losses than 0-3 composites55.
3.3.3 Metal Filler-Polymer Composites
The use of conductive fillers is an effective method for producing high-k materials.
Conductive fillers have been investigated for use in applications such as embedded
capacitors, supercapacitors, dielectric elastomers, antennas, sensors, and energy generators.
The adhesion strength between filler and matrix and the consequent balance in mechanical
properties cause this class of fillers to be preferred over polymer/ceramic composites.
Various types of metallic fillers, along with other conductive fillers, have been introduced for
the purpose of increasing the dielectric constant of polymer composites. Metal nanoparticles
such as nickel, cobalt, silver, aluminum, and steel—as well as organic conductive materials
such as carbon nanotubes, polyanilines, and polythiophenes—have been extensively
investigated as percolative dielectric materials. They have also been combined to form
multiphase percolative composite systems. Organic conductive fillers are discussed in the
next section of this review.
Composites containing metallic fillers exhibit extremely high dielectric constants, observed
in the vicinity of the critical filler concentration, which is known as the percolation threshold.
For polymer-conductive filler composites, the formation of conducting paths is explained by

83
percolation theory. The dielectric constant of a percolative composite system is expressed as
follows:
Equation 3.16
where 𝜀𝜀𝐷𝐷 is the dielectric constant of a polymer matrix, 𝜀𝜀𝑟𝑟 is the relative dielectric constant
of the insulating matrix, f is the percolation threshold concentration, and 𝑓𝑓𝑒𝑒 is the
concentration of actual filler.
The increase in dielectric constant for a percolative filler is presented by the power law:
Equation 3.17
where q is the critical exponent of the dielectric constant. Bergman and Imry56,57 derived
formula in Equation 3.17, which describes the behavior of this power law in the vicinity of
the percolation threshold:
Equation 3.18
where x + y = 1. Expression given in Equation 3.18 models the effects of metal clusters on
the dielectric constant and on conductivity, since polarization effects and electronic diffusion
vary inside clusters.
While the real part of the dielectric constant benefits from conductive fillers, the imaginary

84
part also increases dramatically due to conductive paths established inside the material. High
proximity and high contact of these metal fillers increase the dielectric constant and dielectric
loss. Above the percolation threshold, the composite will be a conductive one. This
drawback, the formation of percolation paths, has been addressed primarily through
manipulating the filler size and shape, tailoring the Ligand Shell metal core, and 3-1
dimensional aligning of the metal nanoparticles58.
As discussed earlier, space charge, interphase polarization, and Coulomb blockade effects
arise from this kind of polymer-filler integration. Exploiting this polarization in different size
regimes is practical. Dang et al.59 used 5-μm Ni particles to engineer a PVDF matrix as a
composite in the vicinity of a 0.18 percolation threshold. A large dielectric constant of more
than 400 and increased conductivities ranging from 10-9 S/m to 10-3 S/m were reported where
filler loadings were below percolation thresholds.
A nanoparticle supercapacitor polymer network is a polymer composite with a high dielectric
constant and high electrical resistance. It consists of metal nanoparticles in a polymer matrix
and shows a Coulomb blockade effect, the single-electron charging effect observed in
“island-sea” type structures, in which tunneling is isolated in localized electron regions. An
extremely small filler size increases resistance at the percolation threshold. Whereas filler
size and concentration increase a composite’s dielectric constant, the Coulomb blockade
effect decreases its dielectric loss. As seen in Figure 3.13, the effects of silver concentration
on dielectric constant and dielectric loss are significant in epoxy composites23.

85
The dielectric behavior of nanocomposites at concentrations below the percolation threshold
has been studied using a PVDF polymer matrix and steel fiber fillers with a diameter of 30
μm and a length of 500 μm. An increase in effective tunneling distances with one-
dimensional fillers was observed at low concentrations. The increase in dielectric constant
below percolation follows the power law of classical scaling theory, at 9.4 vol% of steel-fiber
filler60, with a boundary-level capacitance effect due to interface polarization. Dielectric loss
and electrical conductivity were observed to increase according to the power law at the
percolation threshold for metal fillers61,199.
ε𝑒𝑒𝛼𝛼(𝑓𝑓𝑒𝑒 − 𝑓𝑓𝑖𝑖𝑒𝑒𝑒𝑒𝑒𝑒𝑛𝑛𝑟𝑟)−𝑠𝑠,𝑓𝑓𝑒𝑒>𝑓𝑓𝑖𝑖𝑒𝑒𝑒𝑒𝑒𝑒𝑛𝑛𝑟𝑟 Equation 3.19
Interphase polarization was also calculated for filler surface area. For example, consistent
dielectric constants and dielectric losses over a high-frequency sweep (up to 10 MHz)
indicated a dipolar polarization in the system in polyimide (PI)-alumina nanocomposites. A
Figure 3.13 Dielectric behavior of silver (20 nm) epoxy nanocomposites25.

86
dipolar polarization in the interphase has been associated with particle surface area. PI-
alumina composite (in which alumina filler size is 10nm) exhibited an increase in dielectric
constant from 3.5 to 15 at 20 wt% concentration, primarily due to interphase polarizations.
This increase was verified through filler surface area calculation62.
The Gor’kov-Eliashberg effect, also known as the strand theory of metal nanoparticles, has
been observed in metallic nanowires under the application of electric fields. Percolation
effects increase the dielectric constants of composites tremendously under electrostatic
alignment, with the use of nanorods and nanowires of gold, silver, and polypyrroles. An
extremely high dielectric constant of 105 was observed63; this can be explained by strand
theory. Ultrafine metal particles were elongated to form metal filaments in the direction of
the electric field. According to strand theory:
ε ≈ (𝑞𝑞𝑠𝑠𝑃𝑃0)2 Equation 3.20
where qs is the Fermi-Thomas screening wave vector and l0 is the strand length of the fillers.
An application of bias voltage brings about the heating and alignment of the wires and forms
an assembly of ultrafine metal particles.

87
The simultaneous application of electric and magnetic fields to a polymer composite in the
course of matrix curing, as depicted in Figure 3.14, forms one- to three-dimensional
composites for metal nanoparticles. The DC resistivity, dielectric constant, and dielectric loss
of a composite are controlled through alignment of the fillers along the x- and y-axes. This
alignment increases the percolation threshold by decreasing the conductivity along the z-axis.
Phase velocity (v), electromagnetic radiation over the medium, is influenced by both the
permittivity (ε) and permeability (µ) of the medium, as follows64:
Equation 3.21
Zhang et al.33 studied filler anisotropy to improve anisotropy in the z-direction, with Ni-C
core-shell fillers under magnetic and electrical fields. The authors reported a decrease of
Figure 3.14 Curing of composite samples under external magnetic and electrical fields35.

88
three to four orders of magnitude in the resistivity of aligned composites. Increased dielectric
constants and dielectric losses were also reported at up to 10 wt% filler content. The
electrical field (E = 2 kV/mm) and magnetic field (B = 0.8 T) had a synergistic effect,
working together to maximize the conductivity. As a result, the decrease in inter-particle
distance caused electron hopping. These results are represented in Figure 3.1533.
A recent study used a polar matrix and a nonpolar matrix (PVDF and LDPE, respectively) to
investigate the effect of matrix properties on the composite dielectric constant. An
unexpected difference of two orders of magnitude in effective dielectric constant was found
along with comparable conductivity between the two matrix materials. These results
demonstrate that a polar matrix with a high dielectric constant creates an extremely high-
dielectric constant composite64.
Figure 3.15 Effect of Ni-C core-shell particle weight fraction and external fields on
dielectric constant and resistivity35.
(a) (b)

89
3.3.4 Organic Filler-Polymer Composites
In recent years, research investigating nanoelectronics and molecular electronics has
increased significantly. Researchers have shown a preference for using all-organic materials
in developing organic electronics. The primary goal in this field is to create thin, light,
flexible, and inexpensive organic electronics for use in sensors, displays, and solar cell
technologies. Many organic nanometer-scale materials are widely used as fillers for polymer
composites to manipulate the dielectric constant. Such materials include carbon black65,
carbon nanotubes66–70, fullerenes, conductive polymers, graphite, semiconductor
nanoparticles, nanowires71–75, and organic metallocenes.
Similar to metallic fillers, conductive organic fillers produce high-dielectric constant
nanocomposites with critical concentrations below the percolation threshold. For most of
these organic fillers, an increase in dielectric constant is accompanied by the adverse effects
of decreased dielectric strength and increased dielectric loss. As an example, an increase in
the diameter of carbon black filler improves the dielectric constant of a polymer
nanocomposite but decreases its dielectric strength. Also, a high concentration of carbon
black increases dielectric permittivity but has a significant detrimental effect on both
dielectric strength and dielectric loss76. Carbon black-filled (19 wt%) polyurethane
composites exhibit k values as high as 440077.
CNTs have also been investigated for use as polymer composite fillers in dielectric materials.
The percolation threshold of a carbon nanotube filler is less than that of a carbon black filler
because of the nanotubes’ low length-to-width ratio and high conductivity67–69,78. A

90
composite of 1.6 vol% multiwall carbon-nanotubes and poly-vinylidene fluoride has been
reported as having a approximate dielectric constant of 300 and a dielectric loss of around
0.468.
Conducting and semiconducting polymers, such as polyaniline (PANI)79–82, polythiophene75,
and polypyrole83, are frequently studied as conductive fillers in engineering dielectric
composites. Polyaniline has attracted special attention because of its high polymerization
yield, controllable electrical conductivity, good environmental stability, and relatively low
cost. Polyaniline in partially crystalline form shows a dielectric constant of up to 104 84.
Processing method is very important for nanocomposites. The dielectric behavior of
composites produced through the in situ polymerization method is entirely different from that
of composites produced through simple mixing. In situ processing of composites yields
dielectric constants of up to 1000, while simple mixing yields dielectric constants of less than
10. In situ formation gives the best homogeneity and dispersion and improves dielectric
properties with the help of interface polarization, electrode polarization, and ionic
conductivity. However, simple mixing of species can also decrease dielectric loss through
decrease of conductivity85. In situ processing can be used to form undoped polyaniline, a
process that relies on the use of alkali constitutes, and to transform conductive PANI
emeraldine salt into a nonconductive PANI emeraldine base. An acidic processing
environment was suggested by Lu et al.86 for PANI because the increase in the dielectric
constant these blends depends on the conductivity of PANI.

91
In summary, all organic percolative composites of polymers can produce extremely high
dielectric constants, resulting in high capacitances. Dielectric modulus calculations have also
been used to study the origins of these extremely high capacitances, which result from
electrode polarization87,88. The main advantage of calculating the electric modulus is
suppression of the effects of electrode polarization. The complex electric modulus is
calculated from the imaginary and real parts of the dielectric constant over a range of
frequencies by combining the two formulae in Equation 3.22 and Equation 3.23 as
89,179:
Equation 3.22
and
Equation 3.23
The conductivity of PANI-polymer composites ranges from 10-9 to 10-3 S/cm, with around 4
to 10 wt% filler content depending on the polymer matrix and filler content38. As seen in
Table 3.1, a dramatic increase in dielectric constant and loss in the vicinity of conductive
percolation has been reported for these composites. In addition, Lu et al.89 report extremely
high dielectric constants—up to 2980—which is explained by the presence of Maxwell-
Wagner polarization and higher charges carried by conductive fillers.

92
A relatively new approach to increasing the dielectric constant while sustaining low dielectric
loss has been to coat conducting nanofillers with an insulating layer36,70,90,91. Yang et al.
showed that coating multi-walled carbon nanotubes (MWCNT) with an insulating layer and
dispersing them in polystyrene increased the dielectric constant to more than 40, with a loss
tangent below 0.06 at room temperature70.
Table 3.1 Dielectric behavior of PANI/epoxy composites38.
PANI content 8 wt% 15 wt% 20 wt% 25 wt%
ε′ 10 192 916 2980
ε″ 0.08 0.48 0.55 0.48
Carbon nanotubes (CNT) were functionalized with Poly(styrene-b-(ethylene-co-butylene)-b-
styrene) (SEBS) and employed as high-dielectric constant fillers using a click coupling
method. These core-shell-structured CNTs were then dispersed to form CNT-SEBS
composites. These hetero structures have enhanced mechanical and dielectric properties92.
Another possible use of interface manipulation is in the formation of a conductive interface
between two insulating polymers. An interface of polar and nonpolar perovskites forms a
two-dimensional electron cloud between two crystal surfaces, and this formation results in
conductivity. Although the mechanism of this phenomenon has not yet been agreed upon93,

93
the phenomenon is observed in polar groups containing interphases due to the dipole
moments of these groups94. Polymers such as 3-(2-pyridyldithio) propionyl hydrazide
(PDPH) were used to test interphase conductivity165, since PDPH has high dipole moments.
The conductivities of these interphases as reported by Lu et al.95 are shown in Figure 3.16.
According to their results, these polymer interfaces are desirable for use in many electronic
applications, including in improving the dielectric behavior of polymeric materials.
Figure 3.16 Surface conductivity of PDPH polymer: (a) V-I characteristics; (b) sample
with two polymer layers (1st line in plot (a)); (c) sample with one polymer layer, where the
electrodes are on the surface of the polymer (2nd in the plot (a)); (d) sample with one
polymer layer, where the electrodes are under the polymer film (3rd in the plot (a))97.

94
3.4 High-Dielectric Constant Elastomer Composites
The most common dielectric elastomers are silicone, acrylic, and polyurethane. There are a
number of methods for increasing the permittivity of these materials, including incorporating
ceramic fillers, metal fillers, and organic fillers. High-k elastomer composites were discussed
in the section above in the context of actuator electromechanical properties.
3.4.1 Ceramic Fillers
Ceramic nanoparticles have been manipulated to enhance dielectric behavior of a dielectric
electroactive polymers (D-EAP). Zhang et al.96 report that the use of powder-sized (10-μm)
TiO2 with 30% concentration almost doubled the permittivity, transverse strain, and stress
performance of a PDMS composite actuator96. Particle size is very important in determining
dielectric behavior: Smaller (15-nm) TiO2 particles are reported as increasing the dielectric
constant by 350%, in contrast to the 170% increase obtained using 300-nm particles in
styrene-b-(ethylene-co-butylene)-b-styrene (SEBS) co-polymer. The ceramic filler of TiO2
increases the Young’s modulus by around 200% for nanoparticle fillers and 500% for micro-
particle composites of SEBS44. Barium titanate fillers produced the same level of increase in
PDMS at lower concentrations. The same trend has been observed with niobate-lead titanate
(PMN-PT) and elastomers, which produce lower stiffening than do micron-sized particles
due to the nanofillers’ spherical shape97. Ceramic fillers affect cross-linking density above
concentrations of 20%98.
The use of surfactants on TiO2 to increase dispersion decreases the dielectric performance of
a composite, suggesting that the surface phase is the main contributor to dielectric constant

95
enhancement44. The coating of TiO2 nanoparticles, with silicone oil specifically, enhances a
composite’s dielectric properties (dielectric constant and loss) as well as its mechanical
properties. More specifically, the layer of silicone oil at the surface of the TiO2 reduces the
composite’s dielectric loss by limiting Maxwell-Wagner polarizations and decreases its
elastic modulus due to surface interactions18. Incorporation of ceramic filler increases a
composite’s electrical breakdown48,49,99, ; however, when ceramic filler is incorporated into a
D-EAP, electrical breakdown decreases44,97,100.
The host-guest type of ceramic fillers (TiO2-silicone oil) was developed to address the low-
dielectric strength problem18. Polyethylene glycol (PEG, a surfactant), when administered to
TiO2 as a filler with 30% concentration, has been reported to decrease actuation response
time from 9 µs to 3 µs101. Drying ceramic fillers increases the rate of electrical
breakdown98,102,103. The contribution of ceramic fillers to critical electrical field
improvements and elastomer actuation stabilities has been verified both theoretically and
experimentally104.
Nguyen et al.105 studied the role of cross-link density and plasticizer (dioctyl phthalate, or
DOP) in dielectric enhancement as well as in the variation of the elastic modulus using TiO2
loadings on a NBR polymer composite. In their experiments, the elastic modulus of the
synthetic elastomer decreased when the content of the DOP increased because the plasticizer
weakened the carbon chain’s connection in the elastomer. The elastic modulus first increased
when the TiO2 content increased from 0 to 20 phr (parts per hundred rubber) but then
decreased when the TiO2 content increased from 20 to 40 phr. The authors concluded that

96
DOP negatively affects dielectric loss and breakdown due to an increase in small molecular
polarizations105.
The presence of DOP fillers in the NBR matrix decreases electrical breakdown limits. As
seen in Figure 3.17(b), TiO2 fillers enhance radial strain and working electric field until a
concentration of 30 phr is reached105.
3.4.2 All-Organic Composites
Experimentally, an exceptionally large increase in permittivity has been observed in the
vicinity of the percolation threshold for conductive fillers in polymers. This percolation
effect was described in previous sections. Cameron et al.77 studied graphite fillers in
polyurethane polymer networks to understand the percolation behavior of graphite in
actuators. Their results showed a 25-fold reduction in electrical field, with approximately 18
vol% loadings below the percolation threshold. These composites exhibited an increase in
Figure 3.17 Actuation performances of NBR elastomer composite with the addition of
varying a) DOP, b) TiO2 concentrations107.
(a) (b)
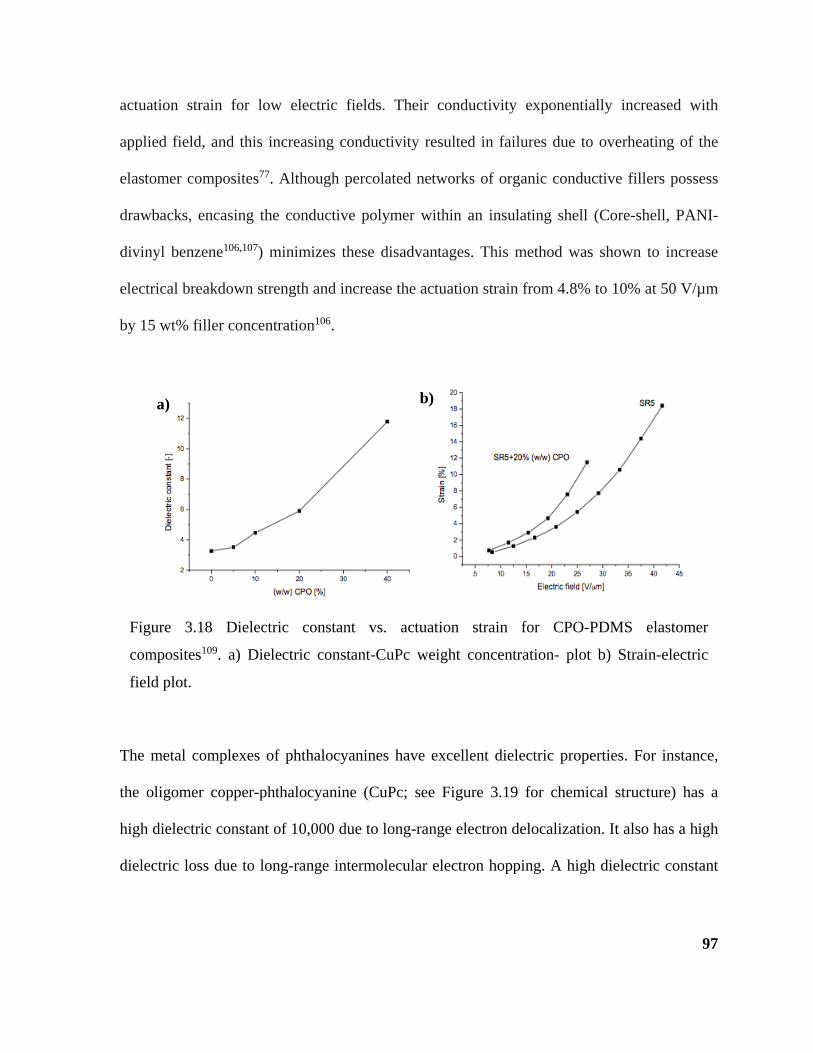
97
actuation strain for low electric fields. Their conductivity exponentially increased with
applied field, and this increasing conductivity resulted in failures due to overheating of the
elastomer composites77. Although percolated networks of organic conductive fillers possess
drawbacks, encasing the conductive polymer within an insulating shell (Core-shell, PANI-
divinyl benzene106,107) minimizes these disadvantages. This method was shown to increase
electrical breakdown strength and increase the actuation strain from 4.8% to 10% at 50 V/µm
by 15 wt% filler concentration106.
The metal complexes of phthalocyanines have excellent dielectric properties. For instance,
the oligomer copper-phthalocyanine (CuPc; see Figure 3.19 for chemical structure) has a
high dielectric constant of 10,000 due to long-range electron delocalization. It also has a high
dielectric loss due to long-range intermolecular electron hopping. A high dielectric constant
Figure 3.18 Dielectric constant vs. actuation strain for CPO-PDMS elastomer
composites109. a) Dielectric constant-CuPc weight concentration- plot b) Strain-electric
field plot.
a) b)
98
of 400108 with a PVDF matrix and a dielectric constant of 11 with a PDMS (SR5)109 matrix
has been observed from 40 wt% loading of CPO-polymer composites at low frequencies (as
shown in Figure 3.18). PDMS-based composites exhibit lower actuation rates than that of
virgin PDMS due to early breakdown. The increase of PVDF-CPO composite actuator strain
is reported to be 2% in the thickness direction109,110. According to Zhang et al.109, non-
uniform field distribution in heterogeneous media has been shown to increase the strain
responses of actuators as well as cause conformation changes and molecular reorientation in
CPO under large external fields.
Guiffard et al.111 studied the effects of charge trapping on the electrode surface as well as
space-charge polarizations using high-dielectric constant organic fillers. Thin films of these
composites exhibit a higher actuation strain, as depicted in Figure 3.20. This result is
explained by the electric field distribution originating from space charges and being injected
Figure 3.19 Schematic of oligomer copper-phthalocyanine (CuPc).

99
into polymer surfaces through the electrodes. These injected charges also increase Maxwell
stress and electrostriction pressures. Another study concerning the PANI/P(VDF-TrFE-
CTFE) composite demonstrated a 25% total strain originating from heterogeneous field
distribution112.
The polymer form of CuPc (poly(CuPc)) has a higher—almost tenfold—impact on the
stiffening of PDMS elastomer composite due to filler-matrix interactions. This stiffening
decreases the actuation performance of the high-dielectric constant material113. A composite
of a low-modulus matrix and a low-percolative filler—e.g., Dow Corning HS IV (0.23 MPa)
and high-aspect ratio SWCNT—has been reported to increase actuation performance114.
Huang et al. report that a three-component PANI-CPO-PU composite produced 10%
thickness strain, four times higher than that produced by CPO-CPO and eight times higher
than that produced by pure polyurethane115. The effective elastic modulus of the composite
Figure 3.20 Actuation response of a) thick, b) thin samples of polyurethane-carbon black
elastomer composites113.
(a) (b)

100
materials and the uneven distribution of electric field over the samples are two main reasons
for the high actuation generation of a three-component system.
Risse et al.116 synthesized a dielectric elastomer actuator material from dipole (N-Allyl-N-
methyl-4-nitroanilin) grafted PDMS. This material has been reported to cause an increase in
dielectric constant from 3.3 to 6.0 and a decrease in modulus from 1.7 MPa to 0.3 MPa,
depending on composition of dipoles. Because electrical breakdown decreases with the
addition of dipoles (130 V/μm to 50 V/μm), the end use of this composite actuator material is
limited to low electrical field applications.
Polymer blending is another method of making unique polymer structures with desireble
dielectric properties. Polymer blending has received attention recently as a method for
studying D-EAP materials. In a study of polymer blending on polyurethane and PDMS
materials, Gallone et al.97 compared silicone, polyurethane, and blends they created using
both inorganic and organic fillers in order to understand the transducing mechanisms of
dielectric electroactive polymers. Interestingly, the incorporation of PU polymer in silicone
at a 40% concentration ratio caused a relatively high dielectric constant of 15 at low
frequency measurements due to Maxwell-Wagner interphase polarization of blend species.
Accompanying this increase was a substantial increase in dielectric loss, which was due to
increases from ionic conductivity. The ionic conductivity increased because of monomer
species that remained during the PU polymerizatio97.

101
In Gallone et al.’s experiments, an entirely organic poly(methylmethacrylate)/b-poly(n-
butylacrylate)/b-poly(methyl methacrylate) triblock co-polymer was produced with micro-
phase separations in various solvents. The use of solvent-altered domains resulted in the
production of a controllable elastic modulus and dielectric constant. The toluene-processed
films showed radial strains as high as 10% under 4-KV/mm electric fields as well as
corresponding enhancements in dielectric and mechanical properties117.
The dielectric properties, elastic moduli, and electromechanical responses of silicone
dielectric elastomers have been composited with carbon black (CB) and BaTiO3. When
compared with single filler/rubber composites, these three-component nanocomposites have
been shown to exhibit complex behavior, possibly due to the interactions between the two
kinds of fillers. The increase in concentration of CB (BaTiO3) would play a destructive role
in the network structure formed by fillers. In this three-component composite, the BaTiO3
particles were reported to have high dielectric permittivity, which the electrical networks
created by the CB particles contributed to118. A maximum electromechanical strain of ca. 8 %
was achieved at mass fractions of 𝑚𝑚𝐶𝐶𝐶𝐶 = 0.03 and 𝑚𝑚𝐶𝐶𝐵𝐵 = 0.06 for this composite at ca. 30
V/µm. The resultant electromechanical strain may be attributable to the large dielectric
permittivity in the three-component nanocomposites.
Rudykh et al.119 found that the positioning and dimensions of micro-structured composites
significantly affected actuator performance, with the use of block-copolymers for the
fabrication of elastomers. Finite-element analysis demonstrated that a tenfold increase in the
coupling efficiency of a composite dielectric elastomer actuator is achievable using the

102
angular lamination method (see Figure 3.21 for model design) to fabricate the dielectric
elastomer actuator materials. The proposed laminates can consist of acrylic and polyaniline
polymers119.
3.4.3 Polymer Synthesis for Dielectric Elastomers
In recent studies, modifying elastomer polymers and cross-linkers at the molecular level has
been shown to enhance the permittivity of a silicone matrix for dielectric electroactive
polymers. Kussmaul et al.120 studied functional cross-linkers with different chemical groups.
A trifunctional vinyl cross-linker was modified to produce various cross-linkers with
particular functionalities depending on chemical structure. Incorporating these functional
cross-linkers created polydimethylsiloxane (PDMS) networks with better mechanical and
physical properties. For example, a 0.25 weight percent of the push-pull dipole ethynyl-4-
nitrobenzene increased the dielectric permittivity of PDMS by 35% due to the cross-linker’s
dipolar nature. The authors120, through fluorescence microscopy tests, also demonstrated the
functionalization of polymer networks by fluorine-based cross-linkers and the wide
dispersion of cross-linkers throughout the PDMS network.
Figure 3.21 Representation of periodic layered-design EAPs for FE analysis121.

103
A similar modification is main-chain dipole attachment. In this process, a push-pull dipole is
synthesized to be compatible with the silicone cross-linking chemistry, allowing for direct
grafting to the cross-linker molecules in a one-step film formation process. This method
prevents agglomeration and yields elastomer films that are homogeneous down to the
molecular level. The dipole-to-silicone network grafting reaction was confirmed by
Kussmaul et al.120,121 using Fourier-transform infrared spectroscopy (FTIR). The chemical,
thermal, mechanical, and electrical properties of films with dipole contents ranging from 0
wt% to 13.4 wt% were thoroughly characterized in this study. Dipole grafting modified the
permittivity and stiffness of PDMS, resulting in a sixfold increase in actuation strain
compared to the actuation strain of neat polymers observed in a comparable electrical
field120,121.
3.5 Dielectric Mixing Theories
Simple mixing equations predict the dielectric constant of a polymer composite from the
behaviors of the pure polymer matrix and the filler, given volume fractions of each
component. Several equations describe the effective dielectric constant of a mixture;
empirical equations include the Maxwell Garnett (MG) equation, the Bruggeman equation,
the Hanai-Bruggeman equation, and the empirical Lichtenecker mixture equation2,122–125.
Lichtenecker’s logarithmic mixture formula describes a practical approach for determining
the dielectric constant of a homogenous material123. This empirical formula for multiphase
composites is as follows:

104
Equation 3.24
where 𝜀𝜀𝑛𝑛𝑖𝑖𝑖𝑖 is the relative dielectric constant of the composite and 𝜀𝜀𝑒𝑒 is the component
dielectric constant. The Lichtenecker model also includes parallel series mixing models and
cubic models for use in extreme cases122. Maxwell-Wagner-Sillars polarization occurs at the
boundaries of distinctive materials at meso and macro scales, causing a higher charge
separation relative to pure materials. This charge separation can be estimated from atomic
and molecular contribution models, and it results in a higher dielectric loss2. The Sillars
equation is:
Equation 3.25
Finally, the Maxwell-Garnett equation is as follows:
Equation 3.26
Nonhomogeneous materials including suspensions or colloids, phase-separated polymers,
blends, and polymer composites are considered Maxwell-Wagner-Sillars materials. The
dielectric constant of such a material is predicted using Equation 3.26. However, this
equation is not useful for predicting the dielectric constant of materials when there is
disparity among the components’ dielectric constants or in conditions where filler loading

105
levels are too high2,126. The Maxwell-Wagner formula was altered to create a universal
formula, shown in Equation 3.27 below, by the addition of factor v, which describes the
effect of filler geometry on mixing nature127.
Equation 3.27
A ν of 0 returns this formula to the Maxwell-Wagner-Sillars formula and the Lorentz-Lorenz
polarizations formula.
Consistently, ν = 2 gives the Bottcher equation (Equation 3.29) or the Bruggeman mixing
formula for lamellae and disc fillers (Equation 3.28). ν = 3 gives a quasi-crystalline
approximation derived by Gyorffy, Korringa, and Mills126,127.
The Bruggeman equation is as follows:
Equation 3.28
The Bottcher equation is as follows:
Equation 3.29
The preceding mixture models assume the fillers are shaped like individual spheres and do
not take into account interactions between these spheres. However, the electric field that

106
arises from the interaction of fillers becomes significant with increasing filler concentration.
The Jayasundere and Smith model takes into consideration inter-particle interaction effects
on dielectric behavior, a consideration which is especially important for random
composites128. This model has been widely used to model ceramic-polymer mixtures129–132.
The Jayasundere and Smith equation is as follows:
Equation 3.30
The Jayasundere-Smith equation is especially applicable to low-volume fractions. For high-
volume concentration of ceramic fillers, the Effective Medium Theory (EMT) mixing rules
have been especially useful. These rules can be applied to insulating fillers with volume
fractions of up to 0.5 in order to determine both dielectric constant and dielectric loss, with
10% maximum deviation128,133–135. EMT has also been used to understand percolated
composites. The theoretical calculations are reported to be consistent with experimental
results3,136. The EMT equations are as follows:
Equation 3.31

107
Equation 3.32
Vo et al.137 considered the particle interphase on dielectric constant calculations. Their
model, shown in Figure 3.22, also incorporated particle overlaps and high weight
concentrations and closely fits the experimental data137,138.
Ab initio simulations are considered to be another precise method for modeling and
calculating the dielectric constants of materials and composites47,57,139. These simulations
have led to several significant inferences about nanodielectrics. According to Liping et al.140,
polymer-metal oxide interphases do not show a large gap, and delocalization occurs within
only a few atomic layers confined to the metal-oxide side. The effective permittivity depends
on the chain packing density of polymers. The nanofiller-induced free volume in
nanocomposites could be a dominant factor in reducing the effective permittivity of
Figure 3.22 The geometry for modelling core-shell filled composites for their dielectric
behavior: (a) particle, (b) interphase, and (c) matrix parts in dielectric composites139.

108
nanocomposites140.
3.6 Concluding Remarks
This review has focused on dielectric elastomers and their dielectric properties. Special
attention was given to polymer nanocomposites with high dielectric constants as well as to
the principles of dielectrics and dielectric behavior enhancements.
There is great demand for novel materials for use in dielectric elastomer applications, in
which high k, low dielectric loss, and ease of processing are key features. A number of
materials, such as ceramics, metals, and organic compounds, were reviewed for their ability
to increase dielectric constants.
The dielectric constants of ceramic-polymer composites are not dependent on frequency and
temperature. However, their dielectric permittivity is often low, even if a high loading of
ceramic particles is incorporated. Moreover, their breakdown strength is weak if the ceramic
particles are not surface-treated.
Metal-polymer composites follow the percolation threshold for their dielectric behavior. A
dramatic increase was reported in the dielectric constant below the percolation threshold of
these composites. These metal fillers were reported to decrease actuation performance
tremendously due to low dielectric strength of composites. However, it is worth noting that
they have presented an actuation strain increase under low electric fields.
Matrix-filler interactions and filler size are extremely important for the electrical and
dielectric properties of metal- and ceramic-filled polymer composites. Polar matrices have

109
reportedly caused a higher increase in dielectric constant than nonpolar matrices in their
composites.
Interphasic regions are crucial to the dielectric properties of materials. As particle size
decreases, interphase volume increases logarithmically. It is worth exploring the synergy
between different types of fillers and the potential of using core-shell fillers in order to attain
high-k polymer composites with other excellent mechanical properties.
Considering nano-dielectric phenomena is important when designing high-dielectric constant
materials. Inclusion of a core-shell structured filler is another important way to promote
dispersion of the filler throughout the polymer and the interfacial interactions between them.
A core-shell filler also increases filler-polymer compatibility, which improves the
mechanical properties of the composite and increases the dispersion of filler material in the
polymer matrix. Improved dispersion also increases the specific surface area of the filler. The
use of a core-shell structured filler, either metal or ceramic, instead of an unstructured filler
increases the dielectric constant of a composite and decreases its dielectric loss.
Uniform dispersion of nanoparticles throughout a nanocomposite is essential to achieving
improved dielectric properties and reproducibility since nanoparticle agglomeration leads to
undesirable electrical and mechanical material properties. Dispersion may also minimize
defects or voids in the composite, which can degrade breakdown strength and therefore
overall energy density.
In general, the above-mentioned properties are also applicable to elastomer composites.

110
Dielectric elastomer actuators generally require softer elastomer composites than do other
polymer composite applications. Most elastomers exhibit a decrease in hardness due to a
lower average molecular weight and a lesser degree of cross-linking. It is possible to
optimize the elastomer’s mechanical properties after achieving a satisfactory dielectric
constant.
The application of this knowledge to dielectric elastomer networks results in improved
dielectric constant and thus improved actuation performance. The mechanical properties of
D-EAPs also affect actuation performance, including Young’s modulus. This improvement in
dielectric constant has been observed to take the form of higher actuation strain and higher
blocking force performance. All organic and custom-synthesized elastomers have also been
revived as D-EAP materials. These materials possess a higher dielectric strength than do their
composite counterparts. Blends, conductive polymers, and dipole-grafted elastomer networks
have been proposed as D-EAP materials.
3.7 References
1. Van Krevelen, D. W. & Te Nijenhuis, K. in Properties of Polymers (Fourth Edition)
(eds. by, D. W. V. K. & Nijenhuis, K. T.) 319–354 (Elsevier, 2009). at
<http://www.sciencedirect.com/science/article/pii/B978008054819700011X>
2. Das-Gupta, D. K. in Encyclopedia of RF and Microwave Engineering (John Wiley &
Sons, Inc., 2005). at <doi/10.1002/0471654507.eme072/abstract>
3. Liu, X., Wu, Y., Wang, X., Li, R. & Zhang, Z. Effect of interphase on effective
permittivity of composites. J. Phys. Appl. Phys. 44, 115402 (2011).

111
4. Lewis, T. J. Interfaces are the dominant feature of dielectrics at the nanometric level.
Dielectr. Electr. Insul. IEEE Trans. On 11, 739–753 (2004).
5. Griffiths, D. J. Introduction to Electrodynamics. (Addison Wesley, 1999).
6. Clays, K. et al. Enhancement of the molecular hyperpolarizability by a
supramolecular amylose-dye inclusion complex, studied by hyper-Rayleigh scattering
with fluorescence suppression. Chem. Phys. Lett. 293, 337–342 (1998).
7. Hartman, R. D. & Pohl, H. A. Hyperelectronic polarization in macromolecular solids.
J. Polym. Sci. Part A‐1 Polym. Chem. 6, 1135–1152 (1968).
8. Guo, M. Investigations of novel high dielectric materials and new mechanisms.
(University of Michigan, 2009).
9. Shan, X. High dielectric constant 0-3 ceramic-polymer composites. (Auburn
University, 2009).
10. Pohl, H. Giant polarization in high polymers. J. Electron. Mater. 15, 201–203 (1986).
11. Urry, D. W. et al. Elastin: a representative ideal protein elastomer. Philos. Trans. R.
Soc. Lond. B. Biol. Sci. 357, 169–184 (2002).
12. Kremer, F. & Schönhals, A. Broadband Dielectric Spectroscopy. (Springer, 2002).
13. Runt, J. P. & Fitzgerald, J. J. Dielectric spectroscopy of polymeric materials:
fundamentals and applications. (An American Chemical Society Publication, 1997).
14. Hedvig, P. Dielectric spectroscopy of polymers. (John Wiley & Sons Inc, 1977).
15. Blythe, A. R. & Bloor, D. Electrical properties of polymers. (Cambridge University
Press, 2005).

112
16. Dang, Z.-M. et al. Fundamentals, processes and applications of high-permittivity
polymer–matrix composites. Prog. Mater. Sci. 57, 660–723 (2012).
17. Ieda, M. Electrical Conduction and Carrier Traps in Polymeric Materials. IEEE
Trans. Electr. Insul. EI-19, 162–178 (1984).
18. Stoyanov, H., Kollosche, M., Risse, S., McCarthy, D. N. & Kofod, G. Elastic block
copolymer nanocomposites with controlled interfacial interactions for artificial
muscles with direct voltage control. Soft Matter 7, 194 (2011).
19. Lewis, T. J. A Model for Nano-composite Polymer Dielectrics under Electrical
Stress. in IEEE International Conference on Solid Dielectrics, 2007. ICSD ’07 11–14
(2007). doi:10.1109/ICSD.2007.4290740
20. Nelson, J. K. & Fothergill, J. C. Internal charge behaviour of nanocomposites.
Nanotechnology 15, 586–595 (2004).
21. Nelson, J. K. Overview of nanodielectrics: Insulating materials of the future. in
Electrical Insulation Conference and Electrical Manufacturing Expo, 2007 229–235
(2007). doi:10.1109/EEIC.2007.4562626
22. Frechette, M. F., Trudeau, M. L., Alamdar, H. D. & Boily, S. Introductory remarks on
nanodielectrics. Dielectr. Electr. Insul. IEEE Trans. On 11, 808–818 (2004).
23. Li, Y., Pothukuchi, S. & Wong, C. P. Development of a novel polymer-metal
nanocomposite obtained through the route of in situ reduction and its dielectric
properties [capacitor applications]. in Electronic Components and Technology
Conference, 2004. Proceedings. 54th 1, 507–513 Vol.1 (2004).
24. Seneor, P. et al. Principle of a variable capacitor based on coulomb blockade of
nanometric-size clusters. Europhys. Lett. EPL 65, 699–704 (2004).

113
25. Lu, J., Moon, K.-S., Xu, J. & Wong, C. P. Synthesis and dielectric properties of novel
high-K polymer composites containing in-situ formed silver nanoparticles for
embedded capacitor applications. J. Mater. Chem. 16, 1543 (2006).
26. Tanaka, T. Dielectric nanocomposites with insulating properties. Dielectr. Electr.
Insul. IEEE Trans. On 12, 914–928 (2005).
27. Danikas, M. G. & Tanaka, T. Nanocomposites-a review of electrical treeing and
breakdown. Electr. Insul. Mag. IEEE 25, 19–25 (2009).
28. Fréchette, M. F. & Reed, C. W. On molecular dielectrics in their role in shaping and
controlling nanodielectrics. in Electrical Insulation and Dielectric Phenomena, 2006
IEEE Conference on 333–337 (2006).
29. Smith, R. C., Liang, C., Landry, M., Nelson, J. K. & Schadler, L. S. The mechanisms
leading to the useful electrical properties of polymer nanodielectrics. IEEE Trans.
Dielectr. Electr. Insul. 15, 187–196 (2008).
30. Nalwa, H. S. Handbook of low and high dielectric constant materials and their
applications. volume 1: materials and processing. voume 2: phenomena, properties
and applications. (Academic Press, 1999).
31. Chu, B. et al. A dielectric polymer with high electric energy density and fast
discharge speed. Science 313, 334 –336 (2006).
32. Zhang, Z. et al. New silicone dielectric elastomers with a high dielectric constant. in
Modeling, Signal Processing, and Control for Smart Structures. 6926 (SPIE, 2008).
33. Zhang, B., Xie, C., Hu, J., Wang, H. & Gui, Y. Novel 1-3 metal nanoparticle/polymer
composites induced by hybrid external fields. Compos. Sci. Technol. 66, 1558–1563
(2006).

114
34. Bai, Y., Cheng, Z.-Y., Bharti, V., Xu, H. S. & Zhang, Q. M. High-dielectric-constant
ceramic-powder polymer composites. Appl. Phys. Lett. 76, 3804 (2000).
35. Li, J. et al. Nanocomposites of ferroelectric polymers with TiO2 nanoparticles
exhibiting significantly enhanced electrical energy density. Adv. Mater. 21, 217–221
(2009).
36. Yuan, J.-K. et al. High dielectric permittivity and low percolation threshold in
polymer composites based on SiC-carbon nanotubes micro/nano hybrid. Appl. Phys.
Lett. 98, 032901 (2011).
37. Saha, S. K., DaSilva, M., Hang, Q., Sands, T. & Janes, D. B. A nanocapacitor with
giant dielectric permittivity. Nanotechnology 17, 2284–2288 (2006).
38. Tabellout, M., Fatyeyeva, K., Baillif, P.-Y., Bardeau, J.-F. & Pud, A. A. The
influence of the polymer matrix on the dielectric and electrical properties of
conductive polymer composites based on polyaniline. J. Non-Cryst. Solids 351,
2835–2841 (2005).
39. Shen, Y., Lin, Y., Li, M. & Nan, C.-W. High dielectric performance of polymer
composite films induced by a percolating interparticle barrier layer. Adv. Mater. 19,
1418–1422 (2007).
40. Kakimoto, M. et al. Polymer-ceramic nanocomposites based on new concepts for
embedded capacitor. Mater. Sci. Eng. B 132, 74–78 (2006).
41. Uchino, K., Eiji Sadanaga & Terukiyo Hirose. Dependence of the crystal structure on
particle size in barium titanate. J. Am. Ceram. Soc. 72, 1555–1558 (1989).
42. Leonard, M. R. & Safari, A. Crystallite and grain size effects in BaTiO3. in
Applications of Ferroelectrics, 1996. ISAF ’96., Proceedings of the Tenth IEEE
International Symposium on 2, 1003–1005 vol.2 (1996).

115
43. Brochu, P. & Pei, Q. Advances in dielectric elastomers for actuators and artificial
muscles. Macromol. Rapid Commun. 31, 10–36 (2010).
44. Mc Carthy, D. N., Risse, S., Katekomol, P. & Kofod, G. The effect of dispersion on
the increased relative permittivity of TiO2/SEBS composites. J. Phys. Appl. Phys. 42,
145406 (2009).
45. Nelson, J. K. Dielectric polymer nanocomposites. (Springer, 2009).
46. He, Q., Wu, L., Gu, G. & You, B. Preparation and characterization of Acrylic/Nano-
TiO2 composite latex. High Perform. Polym. 14, 383–396 (2002).
47. Moya, J. S., Lopez-Esteban, S. & Pecharromán, C. The challenge of ceramic/metal
microcomposites and nanocomposites. Prog. Mater. Sci. 52, 1017–1090 (2007).
48. Scolan, E. & Sanchez, C. Synthesis and characterization of surface-protected
nanocrystalline titania particles. Chem. Mater. 10, 3217–3223 (1998).
49. Dang, Z. M., Song, H. T., Lin, Y. Q. & Ma, L. J. High and low dielectric permittivity
polymer-based nanobybrid dielectric films. in Journal of Physics: Conference Series
152, 012047 (2009).
50. Dang, Z.-M. et al. Advanced calcium copper titanate/polyimide functional hybrid
films with high dielectric permittivity. Adv. Mater. 21, 2077–2082 (2009).
51. Yao, J. et al. Enhancement of dielectric constant and piezoelectric coefficient of
ceramic–polymer composites by interface chelation. J. Mater. Chem. 19, 2817
(2009).
52. Hossack, J. A. & Auld, B. A. Improved modeling of 0:3 composite materials. in
Ultrasonics Symposium, 1995. Proceedings., 1995 IEEE 2, 945–949 vol.2 (1995).

116
53. Williams, E. P. M. et al. Dielectric nanocapacitance effect of thermoset polymeric
matrix nanocomposites. J. Polym. Sci. Part B Polym. Phys. 42, 1–4 (2004).
54. Windlass, H., Raj, P. M., Balaraman, D., Bhattacharya, S. K. & Tummala, R. R.
Colloidal processing of polymer ceramic nanocomposite integral capacitors. Electron.
Packag. Manuf. IEEE Trans. On 26, 100–105 (2003).
55. Tomer, V., Randall, C. A., Polizos, G., Kostelnick, J. & Manias, E. High- and low-
field dielectric characteristics of dielectrophoretically aligned ceramic/polymer
nanocomposites. J. Appl. Phys. 103, 034115–7 (2008).
56. Bergman, D. J. & Imry, Y. Critical behavior of the complex dielectric constant near
the percolation threshold of a heterogeneous material. Phys. Rev. Lett. 39, 1222
(1977).
57. Bergman, D. J. The dielectric constant of a composite material--A problem in
classical physics. Phys. Rep. 43, 377–407 (1978).
58. Nicolais, L. & Carotenuto, G. Metal-polymer nanocomposites. (John Wiley and Sons,
2005).
59. Dang, Z. ‐M, Lin, Y. ‐H & Nan, C. ‐W. Novel ferroelectric polymer composites with
high dielectric constants. Adv. Mater. 15, 1625–1629 (2003).
60. Li, Y.-J., Xu, M., Feng, J.-Q. & Dang, Z.-M. Dielectric behavior of a metal-polymer
composite with low percolation threshold. Appl. Phys. Lett. 89, 072902 (2006).
61. Panda, M., Srinivas, V. & Thakur, A. K. On the question of percolation threshold in
polyvinylidene fluoride/nanocrystalline nickel composites. Appl. Phys. Lett. 92,
132905 (2008).

117
62. Murugaraj, P., Mainwaring, D. & Mora-Huertas, N. Dielectric enhancement in
polymer-nanoparticle composites through interphase polarizability. J. Appl. Phys. 98,
054304 (2005).
63. Saha, S. K. Nanodielectrics with giant permittivity. Bull. Mater. Sci. 31, 473–477
(2008).
64. Panda, M., Srinivas, V. & Thakur, A. K. Role of polymer matrix in large
enhancement of dielectric constant in polymer-metal composites. Appl. Phys. Lett. 99,
042905 (2011).
65. Annadurai, P., Mallick, A. K. & Tripathy, D. K. Studies on microwave shielding
materials based on ferrite‐ and carbon black‐filled EPDM rubber in the X‐band
frequency. J. Appl. Polym. Sci. 83, 145–150 (2002).
66. Yu, C., Masarapu, C., Rong, J., Wei, B. & Jiang, H. Stretchable supercapacitors based
on buckled single‐walled carbon‐nanotube macrofilms. Adv. Mater. 21, 4793–4797
(2009).
67. Baughman, R. H., Zakhidov, A. A. & de Heer, W. A. Carbon nanotubes—the route
toward applications. Science 297, 787 (2002).
68. Wang, L. & Dang, Z.-M. Carbon nanotube composites with high dielectric constant at
low percolation threshold. Appl. Phys. Lett. 87, 042903 (2005).
69. Breuer, O. & Sundararaj, U. Big returns from small fibers: A review of
polymer/carbon nanotube composites. Polym. Compos. 25, 630–645 (2004).
70. Yang, Y., Gupta, M. C., Dudley, K. L. & Lawrence, R. W. Novel carbon
nanotube−polystyrene foam composites for electromagnetic interference shielding.
Nano Lett. 5, 2131–2134 (2005).

118
71. Shimomura, T., Akai, T., Abe, T. & Ito, K. Atomic force microscopy observation of
insulated molecular wire formed by conducting polymer and molecular nanotube. J.
Chem. Phys. 116, 1753 (2002).
72. Shimomura, T. et al. Conductivity measurement of insulated molecular wire formed
by molecular nanotube and polyaniline. Synth. Met. 153, 497–500 (2005).
73. Cacialli, F. et al. Cyclodextrin-threaded conjugated polyrotaxanes as insulated
molecular wires with reduced interstrand interactions. Nat Mater 1, 160–164 (2002).
74. Grigoras, M. & Stafie, L. Electrically insulated molecular wires. Supramol. Chem. 22,
237–248 (2010).
75. Qiu, L. et al. Organic thin‐film transistors based on polythiophene nanowires
embedded in insulating polymer. Adv. Mater. 21, 1349–1353 (2009).
76. Nelson, P. N. & Hervig, H. C. High dielectric constant materials for primary voltage
cable terminations. IEEE Trans. Power Appar. Syst. 103, 3211–3216 (1984).
77. Cameron, C. G., Underhill, R. S., Rawji, M. & Szabo, J. P. Conductive filler:
elastomer composites for Maxwell stress actuator applications. in 5385, 51–59
(2004).
78. Kerr, C. J., Huang, Y. Y., Marshall, J. E. & Terentjev, E. M. Effect of filament aspect
ratio on the dielectric response of multiwalled carbon nanotube composites. J. Appl.
Phys. 109, 094109 (2011).
79. Soares, B. G., Leyva, M. E., Barra, G. M. O. & Khastgir, D. Dielectric behavior of
polyaniline synthesized by different techniques. Eur. Polym. J. 42, 676–686 (2006).
80. Joo, J. et al. Microwave dielectric response of mesoscopic metallic regions and the
intrinsic metallic state of polyaniline. Phys. Rev. B 49, 2977 (1994).

119
81. Meng, C., Liu, C., Chen, L., Hu, C. & Fan, S. Highly flexible and all-solid-state
paperlike polymer supercapacitors. Nano Lett. 10, 4025–4031 (2010).
82. Yan, X. Z. & Goodson, T. High dielectric hyperbranched polyaniline materials. J.
Phys. Chem. B 110, 14667–14672 (2006).
83. Deligöz, H. & Tieke, B. Conducting composites of polyurethane resin and
polypyrrole: solvent‐free preparation, electrical, and mechanical properties.
Macromol. Mater. Eng. 291, 793–801 (2006).
84. Joo, J. et al. Charge transport of the mesoscopic metallic state in partially crystalline
polyanilines. Phys. Rev. B 57, 9567 (1998).
85. Chwang, C.-P., Liu, C.-D., Huang, S.-W., Chao, D.-Y. & Lee, S.-N. Synthesis and
characterization of high dielectric constant polyaniline/polyurethane blends. Synth.
Met. 142, 275–281 (2004).
86. Lu, J., Moon, K.-S., Kim, B.-K. & Wong, C. P. High dielectric constant
polyaniline/epoxy composites via in situ polymerization for embedded capacitor
applications. Polymer 48, 1510–1516 (2007).
87. Dutta, P., Biswas, S. & De, S. K. Dielectric relaxation in polyaniline-polyvinyl
alcohol composites. Mater. Res. Bull. 37, 193–200 (2002).
88. Yu, S., Hing, P. & Hu, X. Dielectric properties of polystyrene–aluminum-nitride
composites. J. Appl. Phys. 88, 398 (2000).
89. Korzhenko, A. A. et al. Dielectric relaxation properties of poly(ethylene-
terephthalate)-polyaniline composite films. Synth. Met. 98, 157–160 (1998).
90. Kim, J.-B., Yi, J.-W. & Nam, J.-E. Dielectric polymer matrix composite films of
CNT coated with anatase TiO2. Thin Solid Films 519, 5050–5055 (2011).

120
91. Yuen, S.-M. et al. Preparation, morphology, mechanical and electrical properties of
TiO2 coated multiwalled carbon nanotube/epoxy composites. Compos. Part Appl. Sci.
Manuf. 39, 119–125 (2008).
92. Yadav, S. K., Mahapatra, S. S., Cho, J. W. & Lee, J. Y. Functionalization of
multiwalled carbon nanotubes with poly(styrene-b-(ethylene-co-butylene)-b-styrene)
by click coupling. J. Phys. Chem. C 114, 11395–11400 (2010).
93. Chambers, S. A. Understanding the mechanism of conductivity at the
LaAlO3/SrTiO3(001) interface. Surf. Sci. 605, 1133–1140 (2011).
94. Popović, Z. S., Satpathy, S. & Martin, R. M. Origin of the two-dimensional electron
gas carrier density at the LaAlO3 on SrTiO3 interface. Phys. Rev. Lett. 101, 256801
(2008).
95. Gadiev, R. M. et al. The conducting polymer/polymer interface. Appl. Phys. Lett. 98,
173305 (2011).
96. Carpi, F. & Rossi, D. D. Improvement of electromechanical actuating performances
of a silicone dielectric elastomer by dispersion of titanium dioxide powder. IEEE
Trans. Dielectr. Electr. Insul. 12, 835–843 (2005).
97. Gallone, G., Carpi, F., De Rossi, D., Levita, G. & Marchetti, A. Dielectric constant
enhancement in a silicone elastomer filled with lead magnesium niobate–lead titanate.
Mater. Sci. Eng. C 27, 110–116 (2007).
98. Böse, H., Uhl, D., Flittner, K. & Schlaak, H. Dielectric elastomer actuators with
enhanced permittivity and strain. in 7976, 79762J–79762J–13 (2011).
99. Das-Gupta, D. K. & Doughty, K. Polymer-ceramic composite materials with high
dielectric constants. Thin Solid Films 158, 93–105 (1988).

121
100. Tangboriboon, N., Sirivat, A., Kunanuruksapong, R. & Wongkasemjit, S.
Electrorheological properties of novel piezoelectric lead zirconate titanate
Pb(Zr0.5,Ti0.5)O3-acrylic rubber composites. Mater. Sci. Eng. C 29, 1913–1918
(2009).
101. Ouyang, G. M., Wang, K. Y. & Chen, X. Y. Enhanced electro-mechanical
performance of TiO2 nano-particle modified polydimethylsiloxane (PDMS) as
electroactive polymers. in Solid-State Sensors, Actuators and Microsystems
Conference (TRANSDUCERS), 2011 16th International 614–617 (2011).
doi:10.1109/TRANSDUCERS.2011.5969778
102. Andres Perez, N., Sylvestre, A., Auge, J. L., Do, M. T. & Rowe, S. Dielectric
spectroscopy in Silicone Rubber Incorporating Nanofillers. in 2006 IEEE Conference
on Electrical Insulation and Dielectric Phenomena 453–456 (2006).
doi:10.1109/CEIDP.2006.311967
103. Steeman, P. A. M., Maurer, F. H. J. & van Es, M. A. Dielectric monitoring of water
absorption in glass-bead-filled high-density polyethylene. Polymer 32, 523–530
(1991).
104. Liu, L., Liu, Y., Zhang, Z., Li, B. & Leng, J. Electromechanical stability of electro-
active silicone filled with high permittivity particles undergoing large deformation.
Smart Mater. Struct. 19, 115025 (2010).
105. Nguyen, H. C. et al. The effects of additives on the actuating performances of a
dielectric elastomer actuator. Smart Mater. Struct. 18, 015006 (2009).
106. Molberg, M. et al. High Breakdown Field Dielectric Elastomer Actuators Using
Encapsulated Polyaniline as High Dielectric Constant Filler. Adv. Funct. Mater. 20,
3280–3291 (2010).

122
107. Opris, D. M., Crespy, D., Lowe, C., Molberg, M. & Nuesch, F. Phthalocyanine and
encapsulated polyaniline nanoparticles as fillers for dielectric elastomers. in
Electroactive Polymer Actuators and Devices (EAPAD) 2009 7287, 72870L–8 (SPIE,
2009).
108. Zhang, Q. M. et al. An all-organic composite actuator material with a high dielectric
constant. Nature 419, 284–287 (2002).
109. Zhang, X., Wissler, M., Jaehne, B., Breonnimann, R. & Kovacs, G. Effects of
crosslinking, prestrain, and dielectric filler on the electromechanical response of a
new silicone and comparison with acrylic elastomer. in 5385, 78–86 (2004).
110. Huang, C., Ren, K., Zhang, S., Xia, F. & Zhang, Q. M. High dielectric constant
polymer nano-composites actuator materials. in 2005 12th International Symposium
on Electrets, 2005. ISE-12 91– 94 (IEEE, 2005). doi:10.1109/ISE.2005.1612326
111. Guiffard, B., Seveyrat, L., Sebald, G. & Guyomar, D. Enhanced electric field-induced
strain in non-percolative carbon nanopowder/polyurethane composites. J. Phys. Appl.
Phys. 39, 3053–3057 (2006).
112. Huang, C. & Zhang, Q. Enhanced dielectric and electromechanical responses in high
dielectric constant all‐polymer percolative composites. Adv. Funct. Mater. 14, 501–
506 (2004).
113. Szabo, J. P. et al. Elastomeric composites with high dielectric constant for use in
Maxwell stress actuators. in Smart Structures and Materials 2003: Electroactive
Polymer Actuators and Devices (EAPAD) 5051, 180–190 (SPIE, 2003).
114. Underhill, R. S. & Michalchuk, B. W. Carbon nanotube-elastomer composites for use
in dielectric polymer actuators. in International Conference on MEMS, NANO and
Smart Systems 369–370 (2005). doi:10.1109/ICMENS.2005.32

123
115. Huang, C., Zhang, Q. M. & Bhattacharya, K. All-organic dielectric-percolative three-
component composite materials with high electromechanical response. Appl. Phys.
Lett. 84, 4391 (2004).
116. Risse, S., Kussmaul, B., Krüger, H., Waché, R. & Kofod, G. DEA material
enhancement with dipole grafted PDMS networks. in Electroactive Polymer
Actuators and Devices (eds. Bar-Cohen, Y. & Carpi, F.) 7976, 79760N–79760N–7
(SPIE, 2011).
117. Jang, Y., Kato, T., Ueki, T. & Hirai, T. Performance of PMMA-PnBA-PMMA
dielectric film actuator with controllable phase morphology. Sens. Actuators Phys.
168, 300–306 (2011).
118. Zhao, H., Xia, Y.-J., Dang, Z.-M., Zha, J.-W. & Hu, G.-H. Composition dependence
of dielectric properties, elastic modulus, and electroactivity in (carbon black-
BaTiO3)/silicone rubber nanocomposites. J. Appl. Polym. Sci. 127, 4440–4445
(2013).
119. Rudykh, S., Lewinstein, A., Uner, G. & deBotton, G. Giant enhancement of the
electromechanical coupling in soft heterogeneous dielectrics. Appl. Phys. Lett. 102,
151905 (2013).
120. Kussmaul, B., Risse, S., Wegener, M., Kofod, G. & Krüger, H. Novel DEA materials
by chemical grafting of silicone networks on molecular level. in Proc. of SPIE Vol
8340, 83400Y–1 (2012).
121. Kussmaul, B., Risse, S., Wegener, M., Kofod, G. & Krüger, H. Matrix stiffness
dependent electro-mechanical response of dipole grafted silicones. Smart Mater.
Struct. 21, 064005 (2012).
122. Montgomery, C. Technique of microwave measurements. (McGraw-Hill Book Co.,
1947).

124
123. Simpkin, R. Derivation of lichtenecker’s logarithmic mixture formula from
maxwell’s equations. IEEE Trans. Microw. Theory Tech. 58, 545–550 (2010).
124. Wagner, K. W. Erklärung der dielektrischen Nachwirkungsvorgänge auf Grund
Maxwellscher Vorstellungen. Arch. Für Elektrotechnik 2, 371–387 (1914).
125. Carpi, F., Rossi, D. D., Kornbluh, R., Pelrine, R. E. & Sommer-Larsen, P. Dielectric
Elastomers as Electromechanical Transducers: Fundamentals, Materials, Devices,
Models and Applications of an Emerging Electroactive Polymer Technology.
(Elsevier, 2011).
126. Sihvola, A. H. & Pekonen, O. P. M. Effective medium formulae for bi-anisotropic
mixtures. J. Phys. Appl. Phys. 29, 514–521 (1996).
127. Shivola, A. H. Self-consistency aspects of dielectric mixing theories. IEEE Trans.
Geosci. Remote Sens. 27, 403–415 (1989).
128. Jayasundere, N. & Smith, B. V. Dielectric constant for binary piezoelectric 0-3
composites. J. Appl. Phys. 73, 2462 (1993).
129. Cho, S.-D., Lee, S.-Y., Hyun, J.-G. & Paik, K.-W. Comparison of theoretical
predictions and experimental values of the dielectric constant of epoxy/BaTiO3
composite embedded capacitor films. J. Mater. Sci. Mater. Electron. 16, 77–84
(2005).
130. Joseph, T., Uma, S., Philip, J. & Sebastian, M. T. Electrical and thermal properties of
PTFE-Sr2ZnSi2O7 composites. J. Mater. Sci. Mater. Electron. 22, 1000–1009
(2010).
131. Xu, J., Bhattacharya, S., Pramanik, P. & Wong, C. P. High dielectric constant
polymer-ceramic (Epoxy varnish-barium titanate) nanocomposites at moderate filler
loadings for embedded capacitors. J. Electron. Mater. 35, 2009–2015 (2006).

125
132. Solomon, S. SmAlO3+Ba(Zn1/2Nb2/3)O3: microwave ceramic composite. J. Mater.
Sci. Mater. Electron. 22, 1203–1207 (2011).
133. Yang Rao, Jianmin Qu, Marinis, T. & Wong, C. P. A precise numerical prediction of
effective dielectric constant for polymer-ceramic composite based on effective-
medium theory. IEEE Trans. Compon. Packag. Technol. 23, 680–683 (2000).
134. Poon, Y. M. & Shin, F. G. A simple explicit formula for the effective dielectric
constant of binary 0-3 composites. J. Mater. Sci. 39, 1277–1281 (2004).
135. Hu, Y., Zhang, Y., Liu, H. & Zhou, D. Microwave dielectric properties of
PTFE/CaTiO3 polymer ceramic composites. Ceram. Int. 37, 1609–1613 (2011).
136. Webman, I. Effective-medium approximation for diffusion on a random lattice. Phys.
Rev. Lett. 47, 1496 (1981).
137. Vo, H. T. & Shi, F. G. Towards model-based engineering of optoelectronic packaging
materials: dielectric constant modeling. Microelectron. J. 33, 409–415 (2002).
138. Todd, M. G. & Shi, F. G. Validation of a novel dielectric constant simulation model
and the determination of its physical parameters. Microelectron. J. 33, 627–632
(2002).
139. Sareni, B., Krähenbühl, L., Beroual, A. & Brosseau, C. Ab Initio simulation approach
for calculating the effective dielectric constant of composite materials. J. Electrost.
40-41, 489–494 (1997).
140. Yu, L. First principles studies of interface dielectric properties of polymer/metal-
oxide nanocomposites. (North Carolina State University, 2009).

126
CHAPTER 4 Synthesis and Phase Behavior of PDMS/PU Blends
Abstract
This paper first reviews the phase behavior of polymers and interpenetrating networks,
focusing on the synthesis and development of elastomer materials from polymer blends
consisting of polydimethylsiloxane (PDMS) and polyurethane (PU). PDMS and PU were
blended reactively for this study. The polymers’ physical and chemical characteristics, as
well as the interactions between the blend species, were investigated.
All synthesis materials, production methods, and characterization methods are explained in
detail below. The characteristics of the blend materials, such as their chemical structures and
mechanical properties, are discussed. In this study, various compositions were characterized
using DMA, DSC, FTIR, SEM, and dielectric spectroscopy. The blend systems studied in
this work display two glass transition temperatures (Tg) and indicate macro phase separation.
The blends exhibited increased dielectric constants and mechanical properties with respect to
pure PDMS elastomers.
4.1 Introduction
The processes of polymer mixing, alloying, and blending involve combining species of
molecules into a single final product. A number of polymers can possibly form boundless
combinations of self-organized polymer blends with outstanding specific properties, such as
engineered band gaps1, pattern ability2,3, and high energy density (dielectric constant)4. Due
to these properties, polymer blends have found applications in such areas as

127
nanolithography2,3,5 and the manufacturing of photovoltaic devices6, transistors7,
supercapacitors4, and optoelectronic devices8.
A polymer mixture formation with one polymer synthesized or cross-linked in the presence
of the other is called an interpenetrated polymer network (IPN)9. The process of making an
IPN is known as reactive blending, and the resulting blends differ from other polymer blends
and mixtures in two ways: Creep and flow are hindered, and continuity of one of the phases
is required.
IPNs are classified as either sequential or simultaneous according to their network formation
order10. Sequential IPNs are formed through in situ polymerization in already crosslinked and
swollen elastomer networks. Simultaneous IPNs are those in which the monomers or pre-
polymers and crosslinking agents for the synthesis of both networks are mixed together. The
reactions are carried out simultaneously. The crosslinking reaction should proceed according
to different mechanisms to avoid chemical interaction between macromolecules of the two
networks.
IPNs can be prepared in several ways. Firstly, they can be prepared as an in situ synthesis of
distinctive polymer species that are not forming a copolymer network in the same
environment. Secondly, they can be prepared through a process in which polymer species are
blended with each other and crosslinks are formed among the same polymer species. Finally,
the third method is a combination of the first two methods: the formation of an IPN through
synthesis of a species inside the second polymer species, resulting in what is known as

128
known as a semi-IPN. Semi-IPN formation begins with linear polymer chains that are then
cured as blend formation proceeds.
In these formations, the crosslinks that create IPNs can be either chemical or physical. Along
with chemical crosslinks, physical intermolecular polar interactions, and donor–acceptor
interactions, crosslinks originating from other molecular configurations—including crystals,
ion clusters, and hard blocks of block copolymers—play a very important role in network
formation11.
In situ IPNs are more stable than polymer blends because of the curing process through
which they are created12–14. In situ IPNs have a phase-separated morphology that depends on
the fraction of each species present, on thermodynamic interactions, and on reaction kinetics
and the rate of forming networks. The thermodynamics of mixing the two components
determine the morphologies of curing blend systems. Micro heterogeneous phase separation
of blends follows curing to form the final structure. The curing of polymers can also result in
an imposed compatibility as compared to usual blends, and the resulting materials exhibit
good dimensional stability over time15,16.
The dynamics of in situ IPN phase formation follow thermodynamic rules and are consistent
with chemical crosslinking reactions at the same time. Rosenberg et al.17 studied the phase
behavior of in situ IPNs used as curing systems. The growth of the chain fragment molecular
mass renders species incompatible after a certain conversion degree. This incompatibility
among species is reported to begin in the early stages of a reaction (1 to 8 percent
conversion) as molecular weight increases. The transition from compatibility to

129
incompatibility proceeds during the reaction as the molecules grow. After critical conversion,
polymers follow the semi-IPN phase diagram. The phases, which correspond to the moment
at which the elastic forces of the networks fix the phase separation, are called quasi-
equilibrium phases15.
The phase behavior of semi-IPN blends depends on the compatibility, or thermodynamic
interaction, between components; the kinetics of the curing reaction; the composition; the
mobility of the polymer chain; and the polymerization degree at time of gelation. These
system phases separate in concentrations smaller than those at which IPNs phase-separate. In
studying highly compatible blends of PMMA and PEO, in situ IPNs, and their semi IPN
formations Filip et al.18 observed a decrease in miscibility in semi-IPNs in comparison with
blends and reported that IPNs with a PEO concentration of 60 percent appeared transparent,
although semi-IPNs are transparent below 10 percent PEO content concentration.
The phase behavior of polymer blends determines blend and IPN properties. The
thermodynamic interactions discovered by Helmholtz19 control these blends’ self-assembled
phase behavior, and a balance between the free energy of the system and the enthalpic and
entropic factors together governs their phase dynamics20 (see Equation 4.1).
𝛥𝛥𝛥𝛥 = 𝛥𝛥𝛥𝛥 − 𝑇𝑇𝛥𝛥𝑇𝑇 Equation 4.1
Flory, Huggins, Scott, and Magat21–25 established a qualitative model, shown in Equation 4.2,
that assumes the lattice is incompressible (i.e., not dependent on T and P). The free energy of
a blend system, ΔGm, determines the phase separation dynamics of the polymer blend.
Equilibrium polymer-polymer phase behavior is controlled by molecular architecture, choice
130
of monomers, composition, and degree of polymerization. The incorporation of polymer
architecture into the general equation as symbols ф, N, and χ provides the basis for
determining the mixture of free energy, as shown in Equation 4.226:
𝛥𝛥𝛥𝛥𝑚𝑚𝑘𝑘𝐶𝐶𝑇𝑇
=ф𝑨𝑨𝑵𝑵𝑨𝑨
𝒍𝒍𝒍𝒍ф𝑨𝑨 +(𝟏𝟏 − ф𝑨𝑨)
𝑵𝑵𝑩𝑩𝒍𝒍𝒍𝒍(𝟏𝟏 − ф𝑨𝑨) + ф𝐴𝐴(1 − ф𝐴𝐴)𝜒𝜒
Equation 4.2
In the above equation, χ is the Flory-Huggins21–25 interaction parameter, a temperature-
sensitive parameter that contributes substantially to enthalpic level; kB is the Boltzmann
constant; N is the polymer repeat; and ф is the volume fraction in a random section of a
polymer chain on an incompressible lattice (фA + фB = 1)16.
The term on the left-hand side accounts for free energy, and ΔGm represents free energy per
segment. The first two terms on the right-hand side account for entropy of mixing, ΔSm,
which increases with mixing. Larger chains, higher N, show less mixing configurations
decrease ΔSm. The last term on the right-hand side represents the enthalpy of mixing, and the
value of the segmental interaction parameter in this term, χ, affects ΔGm. The parameter χ is a
combination of the enthalpy and excess entropy of a particular system and is determined
experimentally. This model in Equation 4.2 was further modified to include compressibility
(T, P)27–29,29 and van der Waals30 interaction effects on the χ parameter and to reveal the
effects of pressure on upper critical and lower critical solution transitions (UCST and LCST).
Nucleation-growth and spinodal decomposition in the cloud-point conversion are two phase
separation mechanisms for blends as well as IPNs. The nucleation and growth mechanism of
a system is driven by the thermodynamic stability of the system. It is mainly dependent on

131
the concentration dependence of the Gibbs free energy. If ∂2G/∂φ2 > 0, the system is
unstable, and instability manifests as large concentration fluctuations. On the other hand, if
∂2G/∂φ2 < 0, the system produces small fluctuations, resulting in a more heterogeneous phase
formation with smaller domain size26.
In these formations, the crosslinks that form IPNs can be either chemical or physical. Along
with chemical crosslinks, other aspects of chemical substances' interaction—including
physical intermolecular polar interactions, donor-acceptor interactions, crosslinks originating
from crystals, ion clusters, and hard blocks of block copolymers—play a very important role
in network formation11. In network systems capable of forming physical crosslinks, the
contribution of physical crosslinks to the effective network density is significant.
In situ IPNs are more stable than polymer blends because of their curing process12–14. They
have a phase-separated morphology that depends on the fraction of each species, the
thermodynamic interactions within the IPN, and its reaction kinetics and rate of forming
networks. The phase behavior of curing systems and IPNs is determined by the processes of
phase separation that take place during IPN formation. Micro heterogeneous phase separation
of blends follows curing to form the final IPN structure. The curing of polymers can result in
an increased compatibility over blends, and exhibit good dimensional stability over time15,16.
In general, the phase behavior of semi-IPN curing systems depends on the compatibility, or
thermodynamic interaction, among components as well as the curing reaction kinetics,
composition, mobility of the polymer chain, and polymerization degree at the time of

132
gelation. Semi-IPN curing systems were reported to phase-separate at lower concentrations
than IPNs.
Polymer blends, including IPNs, have been examined using small-angle X-ray, dynamic
mechanical analysis (DMA), transmission electron microscopy (TEM), scanning electron
microscopy (SEM), dielectric relaxation spectroscopy15, and optical imaging16,26,31. The
homogeneity of these systems can be observed directly from small-angle X-ray scattering.
Transmission electron microscopy, along with the staining of polymers, is used to reveal
blend morphology32. DMA is an indirect mechanical method of studying these systems to
understand their interphases. The curve of tensile loss factor, tan(δ), versus temperature
displays a single temperature peak between the neat polymers of blends. The curve of tensile
loss versus temperature exhibits two peaks, indicating the immiscible polymer
compositions20. Time-resolved light scattering and optical microscopy have been widely used
to study the phase-separation kinetics of heterogeneous systems because the material’s light
transmittance decreases and the blend transforms from translucent to opaque33.
Even the phase formation of a curing system is difficult to predict theoretically. Phase
formation has been studied through consideration of thermodynamic interactions,
crosslinking degree of network formations, and interfacial tension for sequential IPN
formation10.
Although IPNs and semi-IPNs are not in a state of thermodynamic equilibrium, miscibility
and compatibility are forced because each IPN or semi-IPN is considered to be in a quasi-
equilibrium position. Two-phase heterogeneous IPN systems display a degree of

133
interpenetration in the interface of the constituent species due to the reactive bonding of the
phases during IPN formation15,17,34,35.
The use of higher temperatures accelerates the curing mechanism for curing systems. A
curing system formed from PS and PDMS has been proven to reinforce the physical
properties of the system because of resulting changes in the crystal structures of elastomers36.
Even though the effect of temperature on IPN formation can be determined based on the
phase diagram of the curing system, the effect of temperature on miscibility is not yet fully
understood.
At high pressures, the onset point of phase separation moves toward higher conversion of
polymerization, and the mixture remains homogeneous at high molecular weight levels.
Synthesis pressure also affects rate of phase separation by reducing the mobility of the
polymer chains with reduced free volume18. This pressure’s effect on the mixture’s
interaction parameter is not known quantitatively, but compatibility is generally assumed to
increase at high pressure. The combined effects of increased compatibility and reduced rate
of phase separation alter the degree to which the two components mix according to
competition between the entropy and the standard Flory-Huggins term. Two possibilities
exist for UCST:
(1) Case I UCST: Due to competition between the processes represented by the entropy and
standard Flory-Huggins terms in Equation 4.2, the pressure has a destabilizing effect.
(2) Case II UCST: Due to differences in the energy parameters of each of the components30,
the pressure has a stabilizing effect.

134
The number of crosslinks and the amount of inter-network grafting37 are important factors in
the degree of phase separation34,35,38–41. Crosslinking increases component molecular weights
and changes the chain entropy and free energy, possibly driving the system from an initially
homogeneous, one-phase region to a two-phase region42. Grafting collagen (cellulose acetate
butyrate) to PDMS appears to enhance PDMS's thermomechanical and biomedical
properties37. The higher relative formation rate of the two partner networks can also increase
phase behavior36.
Polymer end groups also enhance the miscibility and phase behavior of blends in the cases of
polar and nonpolar mixing systems. Experiments with α,ω-trimethylsilyl PDMS (PDMS–
CH3), α,ω-propylamino PDMS (PDMS–NH2), and α,ω-propylcarboxy PDMS (PDMS–
COOH) showed different cloud point curves for each upon mixture with polystyrene. The
incorporation of amine end groups into PDMS shows an increased compatibility in
comparison with PDMS–CH3. The calculated binary interaction parameters show an
increasing trend as polarity increases43, suggesting that the repulsive nature of the
interactions within the PDMS backbone results in increased compatibility of polymers. The
strategy of using compatible chain end groups for low molecular weight polymers has been
adopted to formation of copolymers of immiscible polymers44.
Another method of improving the compatibility of two polymers is to use compatibilizer,
which are usually block or graft copolymers. Compatibilizer segments, which include
monomers of the polymers that are being blended, can reduce interfacial tension between
polymer species45. Zu et al.2 report that an interfacial tension reduction of 82% was achieved

135
by employing a diblock polymer of the same species for the interphase region. Weight
concentration of polymer and copolymer mixing order largely determined the amount of
reduction. Compatibilization results from entropic inhibition of phase separation into
micelles. The micelle formation at the copolymer interface and possible saturation limits the
compatibility of the polymers blends46. Wignall et al.47 have shown that phase separation can
be triggered by differences in the topologies of the two phases in polyolefin blends as well as
in polysiloxane blends.
Polydimethylsiloxane (PDMS) exhibits poor mechanical properties because of the weak
intermolecular interactions among its polymer chains. In order to enhance the mechanical
properties of PDMS elastomers, filler compounds48–50, copolymers51,52, and blending
methods32,53,54 have been utilized. PDMS is also incompatible with other polymers because
of its low solubility parameter and exceptional flexibility55. These properties make PDMS a
difficult polymer to use in non-equilibrium IPN architectures. PDMS form phase-separated
morphologies with polymers such as polyurethane56, polymethylmethacrylate57,
polystyrene53, polybutadiene53, polycarbonate58, and epoxy59. As noted, the majority of
blends of commercial polymers are phase-separated; however, phase-separated blends often
display useful mechanical and electrical properties that make them suitable for certain
applications.
Dielectric elastomers have been employed to produce field-induced actuators from soft
materials. Their performance is a result of the physical and chemical properties of materials.
Polymer blends60,61 and elastomer formulations62,63 have been preferred to polymer-ceramic

136
and polymer-metal nanocomposites64–66 for preparation of all organic elastomer actuator
materials61,67,68. The mechanical properties of nanocomposites restrict their use in dielectric
elastomers. Loading these composites with large amounts of ceramic filler causes high
dielectric constants, which regrettably leads to an unacceptable degree of stiffness66,69 and an
undesirably low composite electrical breakdown field. Conductive fillers, on the other hand,
form conductive paths in the elastomer, resulting in high dielectric loss and low dielectric
strength. Ultimately, this increase in stiffness or conductivity results in early electrical
breakdown of the actuator material for both filler types70,71. These polymer-polymer systems,
including polymer blends and elastomer formulations, offer lower overall stiffness and higher
dielectric breakdown strength.
In this work, dynamic, mechanical, and thermal behaviors of neat and reactive immiscible
blends of PU and PDMS have been investigated with two different chain end groups.
Interesting characteristics of PDMS, such as good insulation and the ability to maintain
elastomeric behavior over a wide range of temperatures, were a primary reason for selecting
a PDMS network as the matrix. However, due to the low dielectric behavior and low
mechanical properties of neat PDMS networks, a PU polymer-blending approach was
adopted to reduce these common problems.
4.2 Materials and Experimental Methods
4.2.1 Materials
Silicone (PDMS) and polyurethane (PU) materials were used as matrices and fillers,
respectively, for blend preparation. Two routes of elastomer formulation were adopted for
137
blend matrix preparation and were used to form Type I and II blend elastomers. The Type I
PDMS was commercially available Sylgard 186 (Dow Corning, NY), and the Type II matrix
was formulated in our lab. Thermoplastic poly(ether-urethane) (Elastollan 1180A, BASF) is
a thermoplastic elastomer sold in commercial pellet form. Elastollan 1180A, a relatively
high-dielectric constant polymer (𝜀𝜀 = 7.8 at 100 Hz), was used as dielectric filler in this
work. Tetrahydrofuran (Fisher Sci, USA), an excellent blending solvent, was used during the
process of blend preparation.
4.2.1.1 Matrix Materials
Chemical crosslinking of siloxanes can be accomplished through four types of common
commercial reactions72: 1) peroxide-induced free radical reactions, 2) condensation reactions,
3) hydro-silylation addition reactions, and 4) hydride silane/silanol reactions. In our
experiments, we used a hydro-silylation addition reaction for the Type I elastomer because of
this PDMS’s commercial availability and excellent electrical and mechanical properties.
In developing matrix elastomers with a formulated dielectric matrix (referred to here as
“Type II elastomers”), increased interphase compatibility of the matrix and filler was needed.
To achieve this, we employed a condensation (i.e., alkoxy-cure) reaction that entailed linking
hydroxyl-terminated siloxanes in the presence of a tin catalyst and developing crosslinking
through an isocyanate functional crosslinker (3-isocyanatopropyltriethoxy-silane)37,51,52,73–77.
These reactions were also reportedly observed with graft blending78. The hydroxyl-
terminated PDMS is compatible with PU in terms of network formation properties because
its polar end groups bring its solubility parameter close to that of PU.

138
Materials for Blends with the Type I Elastomer
The Type I elastomer used in this research is an addition-cure elastomer produced by Dow
Corning Co. under the name Sylgard 186. It is a two-part elastomer consisting of a hydride
functional silicone polymer and a vinyl-terminated crosslinker. It is formed using an addition
polymerization reaction initiated by a platinum catalyst.
The two parts of a Type I elastomer are known as Parts A and B. Part A consists of a vinyl
functional silicone fluid with a platinum catalyst and includes silica nanoparticles as
reinforcement fillers. Part B consists of a hydride functional crosslinker and inhibitor. A
platinum complex participates in a reaction that forms ethylene bridges between species. The
reaction rate depends on heat and lasts 24 hours. Ethylene bridges create elastomer networks
between the hydride functional crosslinker and the vinyl functional polymer. Consequently,
an elastomer with an ethyl-bridged elastomer network produces no byproduct in the closed
elastomer environment except H2 gas, which solubilizes in the polymer and quickly
outgasses to the environment with no observable bubbles. This reaction mechanism is
pictured below in Figure 4.1(a)-(c), and Table 4.1 provides the material information.
Materials for Blends with the Type II Elastomer
Our method for producing Type II elastomers with a hydroxyl-terminated PDMS based
network DMS S42 (Gelest, PA) was catalyzed with tin (45 ppm). Polymerization took place
at room temperature in a moist environment. The Type II elastomer is an alkoxy
condensation system consisting of a hydroxyl functional polymer and an isocyanate
functional crosslinker. Alkoxy condensation systems involve hydroxyl functional polymers

139
and alkoxy-functional crosslinking compounds. The alkoxy functional crosslinker undergoes
a hydrolysis step that results in a hydroxyl group, which then participates in a condensation
reaction with another hydroxyl group attached to the polymer. This reaction can proceed
without the assistance of the tin catalyst, but the catalyst amount increases the reaction rate40.
In producing Type II elastomers, we incorporated an isocyanate to increase the functionality
of the crosslinker and utilized an alkoxy mechanism to increase interphase adhesion between
polymer species. PU has a polar structure and a hydroxyl end group similar to the hydroxyl-
terminated PDMS polymer network. This was expected to increase compatibility to a
minuscule degree43. The isocyanate mono-functional group in the crosslinker was introduced
to increase the possible chemical interaction of PDMS polymers with PU elastomers during
network formation. This crosslinker can establish links with both PU and PDMS hydroxyl
end groups49. The isocyanate single-function group in the crosslinker is also reactive to the
PU elastomer side groups51,52,73–77. This procedure results in a tetra-functional network in
which the siloxane backbones join the PU elastomers together in the interphase regions of the
blends. This formulation of end group included structure for Type II elastomers is depicted in
Figure 4.2.
The polymer networks were prepared from the hydroxyl-terminated PDMS (Gelest, PA)
using tin as a catalyst. They were cured at room temperature. An example formulation of a
Type II elastomer is as follows:
10 g of PDMS fluid DMS S42 (Mw = 77.000),
5 μl crosslinker (Gelest, PA),

140
45 μl of tin catalyst.
All solvents were obtained from Sigma-Aldrich and used as received.
The formulation above was used for all blend compositions. The formulation of elastomers is
given in Table 4.1, and Figure 4.1(d), (e), and (f) depict the reaction mechanism for the Type
II elastomer.
Material PDMS Name PDMS Polymer Properties
Crosslinker Catalyst Reaction Mechanism
Reinforcement Filler
PDMS Type I
Sylgard 186 base, Dow Corning
Hydride e.g. Vinyl functional cross-linker
Platinum (Sigma Aldrich)
Two-part addition polymerization
Fumed silica
PDMS Type II
DMS S42, Gelest Hydroxyl e.g.
3-iocyanatopropyltriethoxy-silane
Tin (Sigma Aldrich)
Condensation reaction (alkoxy)
None
Table 4.1 PDMS matrix elastomer composition comparison of types I and type II for blend
materials formulation.

141
(e)
(d)
(f)
Figure 4.1 Chemical Formulation PDMS elastomer networks, Type I (a,b,c) and Type II
(d,e,f). Polymer (a) is a hydride functional PDMS fluid, crosslinker (b) is a multi-
functional crosslinker, (c) is a PDMS elastomer network, (d) is hydroxyl functional
PDMS fluid, crosslinker (e) is a multi-functional crosslinker, and (f) is the PDMS
elastomer network. The catalyst is tin, and the reaction takes place in a humid
environment.
(b)
(a)
(c)

142
4.2.2 Polymer Blend Preparation
In the blending of PDMS and PU, the large solubility differences between the two materials
make selecting the right co-solvent crucial. Specifically, the mechanical properties of the
blend elastomers are dependent on the blending co-solvents selected. PDMS is a non-polar
polymer with a low solubility parameter and is not soluble in polar solvents such as DMF,
NMP, and DMAc, which are good solvents for polyurethane. PDMS instead prefers solvents
such as THF, 2-ethoxyethyl ether (EEE), dioxane, and toluene.
(b) (a)
(c)
Figure 4.2 Possible routes of interaction between PDMS and PU elastomers: (a) schematic
of network formation of Type I elastomer; (b) schematic of network formation of Type II
elastomer; (c) chemical structure of 3-iocyanatopropyltriethoxy-silane crosslinker; (d)
chemical structure of polyurethane elastomer with end groups shaded.
(d)
143
We prepared the blends by simply mixing PDMS and PU in THF. The PDMS and PU
polymers were both dissolved in co-solvent THF in separate containers. The PDMS base part
was mixed with the THF solvent at room temperature for three hours. PU pellets were
dissolved in the THF solvent for 12 hours at 50 °C. The PDMS and PU solutions were mixed
using a magnetic stirrer. The crosslinker and catalyst of the PDMS matrix were added to the
final polymer mixture, and this mixture was processed using a high-shear mixer for one
minute. The sequence of magnetic stirring and planetary high-shear mixing was performed so
as to prevent premature curing of the PDMS system for the Type II elastomer matrix. The
mixture was then poured on Teflon substrates for film formation for mechanical and
dielectric characterization. These blends were also separately thinned to a thickness of 100
μm using a spin-coater for electromechanical characterization. The samples were then dried
in an oven, first at room temperature and later at 80 °C sequentially for 12 hours for solvent
evaporation and PDMS curing. The samples were then collected and prepared for
characterization. Figure 4.3 summarizes this process.

144
4.2.3 Compatibility Estimation
An estimate of the polymer-polymer interaction (χ) was calculated as in Equation 4.3:
𝜒𝜒 = 𝛽𝛽 +𝑉𝑉𝑅𝑅𝑇𝑇
|𝛿𝛿1 − 𝛿𝛿2| Equation 4.3
where β is the lattice constant, which was set to 0.34; R is the gas constant; T is the absolute
temperature; and δ1 and δ2 are the independent PU and PDMS solubilities, respectively.
These solubility parameters were calculated theoretically from the polymers’ cohesive energy
densities79, applying the group contributions method that takes into account PU’s hard and
soft segment ratio, along with the data from the thermodynamic tabulations of Fedors80. In
our calculations, we took into consideration the PDMS end groups and PU hard-to-soft
segmental ratio using Equation 4.4 to calculate our solubility parameter:
Equation 4.4
Figure 4.3 Schematic of blend elastomer preparation: (a) mixing PU/THF and
PDMS/THF mixture and addition of the PDMS crosslinking agent to the mixture for film
formation, (b) use of planetary mixer for overall mixing and curing film preparation.
(a) (b)

145
where V is molar volume , ρ is the polymer density; F is the molecular attraction constant;
and M is the molecular weight of the repeating unit. For PU, p = 1; for PDMS, p = 2.
4.2.4 Dynamic Mechanical Property Characterization
Dynamic mechanical analysis (DMA) measurements were carried out on the blends and on
the homopolymers of PU and PDMS, with frequency and temperature sweeps processed
separately. These analyses were conducted according to the ASTM Standard Guide (ASTM
D5026) using a tensile test fixture and rectangular geometry for each sample. The frequency
sweep experiments were performed over a range of 0.01 Hz to 100 Hz on a dynamic
mechanical analyzer RSA3 (TA Instruments, New Castle, DE) at room temperature for the
three different materials: PDMS, PU, and the blends. The gauge lengths of the specimens
were 25 mm over a cross-section of about 0.5 mm2. A control on the position with a prestrain
of 0.5 mm (corresponding to a strain of ±0.02) with a preload of 0.05 N was observed for
frequency tests. Thus, the samples were always in tension, even at the low points of the
cycles. Dynamic testing equipment software, Orchestrator (TA Instruments), calculated the
phase angle ϕ between the applied displacement and the measured force and used the
specimen shape to convert the stiffness and the phase information to provide the values of E′,
the storage modulus; E′′, the loss modulus; and tan(δ), the tangent of the phase angle.
The frequency response of the blends and their constituent polymers, E′ and E′′ with the
logarithmic frequency sweep, has been studied between 10.10-1 and 10.103 rad/sec to
understand the frequency-related dynamic behavior of blends.
146
To understand the viscoelastic response of the composites, a DMA with a temperature sweep
was conducted using a dynamic mechanical analyzer from TA Instruments (Q800). The tests
were performed in tension mode over a temperature range of (-125)-200 °C, with a heating
rate of 3 °C/min at a frequency of 1 Hz and a strain amplitude of 0.1%. Strain sweeps were
performed to ensure measurements were carried out within the limits of the linear response of
the materials, and all data acquired were subject to this limitation. The gauge length was 15
mm, and the specimen width was 6 mm. Dynamic elastic (E′) and loss (E′′) moduli were
recorded while the sample was heated. The glass transition temperatures (Tg) of the samples
were determined from the peaks of tan(δ). The DMTA data were analyzed using TA
Instruments Universal Analysis 2000 software.
4.2.5 Differential Scanning Calorimeter (DSC) Analysis
Thermal analyses of the blend elastomers were conducted using a TA Instruments
Differential Scanning Calorimeter (DSCs-Q2000) over a temperature range of -100-300 °C
with a heating rate of 10 °C/min under a nitrogen atmosphere. Two heating and cooling scan
cycles were performed within the operating range. The thermal history of the blended
samples was removed with the first cycle, and the melting temperature (Tm), the crystallinity
temperature (Tc), and enthalpy of fusion (ΔH) were determined from the second cycle. The
PDMS exhibited crystallization peaks in the DSC experiments. PDMS crystallinity was
calculated as the ratio of ΔH from this study to the ΔH at 100% crystallinity. The percent
crystallinity values of the polymers in the homoelastomers and blends were calculated using
Equation 4.581. The ΔH at 100% crystallinity of PDMS was defined as 37.43 J/g for the
enthalpy of fusion of PDMS48.

147
Equation 4.5
4.2.6 Fourier-Transform Infrared Spectroscopy (FTIR) Analysis
FTIR was performed on pure PDMS, pure PU, and the blend samples with 20% PU
concentration using a Perkin-Elmer Spectrum 100 spectrometer. A background scan and
eight subsequent measurement scans were performed for each sample. A diamond tip was
used in the spectrometer for better penetration of the elastomer. The 100 μm-thick samples
were examined under atmospheric pressure at a resolution of 4 cm−1. The data were collected
over a range of 400-4000 cm−1 and analyzed using OPUS 4.0 (Bruker Optics) software.
4.2.7 Morphological Property Characterization
The representative specimens of the blends were prepared for scanning with electron
microscopy (SEM) imaging. The blend elastomers were cross-fractured in liquid nitrogen,
and the samples were then coated with approximately 15nm of a gold/palladium (Au/Pd)
mixture. SEM imaging was performed using secondary electrons of a high-resolution field-
emission SEM (JSM-6400F, JEOL) operated at an accelerating voltage of 10 kV and a
magnification of 500x to 5000x to determine blend morphology. The images were analyzed
using the imageJ software package (developed by the NIH) to determine the PU species size
in the blends.
f c0f
1
00H HXw H∆×
∆−×
∆=
148
4.3 Results
4.3.1 Compatibility Estimation
The solubility parameters of the polymers were calculated using the values in Table 4.2. δType
I PDMS-CH3 was calculated to be 17.2 (J/cm3)1/2; δType II PDMS-OH was calculated to be 17.5
(J/cm3)1/2; and δPU was calculated to be 33.1 (J/cm3)1/2 43. Since the solubility parameters of
the two components differ by 15.3 (J/cm3)1/2 and 15.6 (J/cm3)1/2 for Types I and II (as
calculated by subtracting the PU and PDMS solubility parameters), respectively, these two
polymers are heterogeneous except under extreme conditions. These calculated results for
estimating results are consistent with the previous work of Yilgor et al.44 and similar to
experimental results obtained by Vlad et al.56. However we can say the effect of end groups
are negligible on polymer compatibility.
Index Units
Constitution Ecoh (J/mol) Vi (cm3/mol)
1 -COOH 27630 28.5
2 -CO- 17370 10.8
3 -CH2- 4937 16.1
4 -NH- 8370 4.5
5 >C6H5 31940 33.4
6 -CH3 4707 33.5
7 (-Si-O) -2CH3 243 0.99
8 -OH 29790 10
9 =CH2 4310 28.5
Table 4.2 Ecoh (internal energy) and Vg (internal molar volume) of polymer constitutes79.

149
4.3.2 Dynamic Mechanical Analysis (DMA)
The dynamic properties of PDMS and PU and their blends were analyzed under both
changing frequency (DMFA) and changing temperature (DMTA). The storage modulus and
mechanical loss factor, tan(δ), for the homopolymers and blends are given in Figure 4.5 and
Figure 4.6, respectively. Figure 4.4 shows the frequency response of polymer dynamic
mechanical properties.
A frequency sweep under isothermal conditions and a temperature sweep at constant
frequency were performed because the temperature sweep provides important information
about phase interactions whereas the frequency sweep gives information about the
mechanical and damping properties of blends. The PDMS-PU system was measured at an
increasing frequency of 0.1-100 rad/sec at constant room temperature. These data, plotted in
Figure 4.4, showed a stable storage modulus for all elastomers. The modulus of 0.4 MPa for
Type II PDMS increased up to 1.5 MPa for Type II blends. A loss modulus between 0.05 and
0.15 was also observed for the blends (see Figure 4.4). The slight increase in loss modulus
over the increasing frequency is typical for polymers and polymer blends. Over the frequency
interval, the modulus of each sample was constant while the loss tangent increased slightly.
Indeed, it is well known that the modulus of PU and PDMS homopolymers increases with
increasing both physical and chemical crosslink density82. The storage modulus of the 20
wt% PU/Type I PDMS blends was found to be higher than that of the 40 wt% PU/Type I
PDMS blends, while the Type II blend elastomers showed an increase in storage modulus for
both compositions. Overall damping properties were lower for Type II elastomers than for
Type I elastomers (see Figure 4.4(d) and Figure 4.4(b), respectively).

150
Figure 4.4 DMFA Analysis of Type I PDMS and Type II PDMS and blend: (a) Storage
modulus and loss modulus with varying frequency of Type I elastomers, (b) tan(δ) of
blends for varying frequency of Type I elastomers, (c) storage modulus and loss modulus
with varying frequency for Type II elastomers, (d) tan (δ) of blends for varying frequency
Type II elastomers. Symbols are as follows: (●) represents pure PDMS; (■) represents
10/90 PU/PDMS blends; and (◆) represents 20/80 PU/PDMS blends. Open symbols
correspond to the loss modulus of the samples.
(a) (b)
(c) (d)

151
Figure 4.5 DMTA Analysis of homopolymers of PU, Type I PDMS, and Type II PDMS.
Storage modulus and tan(δ) were plotted from -130 oC to 200 oC. PU sample breaks at
ca. 120 oC. Red line (―) represents the Type I PDMS; blue line (―) represents the Type
II PDMS; green line (―) represents PU elastomer.

152
Dynamic mechanical temperature data for the homonetworks are shown in Figure 4.5, and
data for the blended networks are shown in Figure 4.6. As would be expected due to the
glassy state of the polymer, the storage modulus (the left hand side of each panel in Figures
4.5 and 4.6) is high at low temperatures for both blends and homopolymers. As temperature
increases, the storage modulus decreases by two orders of magnitude due to the polymer’s
rubbery behavior. The loss tangent (the bottom plots in Figures 4.5 and 4.6) reaches its
maximum near the glass transition temperature (Tg). In the data for the PDMS samples,
presented in Figure 4.6, the first of the three peaks corresponds to the usual glass transition
Figure 4.6 DMA Analysis of Type I elastomer and its blends. Red line (―) represents
pure PDMS; blue line (―) represents the 10 PU wt% concentration blend sample; green
line (―) represents the 20 PU wt% concentration blend sample: (a) storage modulus and
loss modulus with varying temperature from -130 °C to 200 °C for PDMS elastomer
Type I and blends with 10 and 20 wt% PU concentrations; (b) storage modulus and loss
modulus with varying temperature from -130 °C to 200 °C for PDMS elastomer Type II
and blends with 10 and 20 wt% PU concentrations.
(a) (b)
10-3
10-2
10-1
100
101
102
103
104
0
0.2
0.4
0.6
0.8
1
1.2
-120 -80 -40 0 40 80 120 160 200
Sto
rage
Mod
ulus
(MP
a)
Temperature (oC)
tan.δ
10-3
10-2
10-1
100
101
102
103
104
0
0.2
0.4
0.6
0.8
1
1.2
1.4
-120 -80 -40 0 40 80 120 160 200
Sto
rage
Mod
ulus
(MP
a)
Temperature (oC)
tan.δ

153
temperature. As can be seen, PDMS Type I and II elastomers exhibit glass transition
temperatures of -111 °C and -112 °C, respectively. The Tg of blends remains unchanged as
PU wt% vary, indicating that the PDMS chains participating in the glass transition do not
change with silica content. For the PU homopolymer, a sharp peak in E″ with a maximum
between -30 °C and -15 °C (see Figure 4.5) is assigned to the glass transition of PU, with a
loss tangent peak occurring at -20.1 °C.
For PDMS elastomers, a second Tg (Tg2) has been observed at 60 °C to 100 °C above the
polymer’s Tg (i.e., Tg2 ∈ [Tg + 60 °C, Tg + 100 °C]). This Tg2 was observed in polymer
composites with high-surface area microfillers and nanofillers such as carbon black,
silica83,84, and ionomers85. The second Tg, Tg2, was -40.5 °C for Type I PDMS and -37.8 °C
for Type II PDMS. In literature this second peak was attributed to the Tg of the polymer layer
surrounding the particles85. A greater number of silica particles decreased the size and
maximum temperature of this peak86. Our experiments for Type I PDMS with silica fillers
found similar behavior but a smaller Tg2 (see Figure 4.5 for Type II PDMS), even without
silica fillers. Robertson et al.87 focused on the reasons for the existence of the second loss
tangent peak in polymer-particle composites. According to the authors, this second peak is
not the glass transition response of an immobilized polymer shell but rather is associated with
the suppression of flow relaxation (chain diffusion) of the polymer chains due to incomplete
terminal relaxation. Partially crosslinked unfilled polymer systems have also been reported to
produce the same higher-temperature tan(δ) peak (Tg2). However, according to report by
Robertson et al.87, since we observe second relaxation peak on Type I and Type II

154
elastomers, we can infere that there exist a small number of uncrosslinked chain end groups
that result in a second relaxation peak.
We observed a small shift in Tg to a temperature of approximately -31 °C for the blends of
both types and for all concentrations. These blend Tgs surpassed the observed second Tg of
PDMS polymers and showed a higher blend Tg for all compositions. All Tg measurements for
these samples are displayed in Table 4.3. Additionally, the loss modulus followed the same
trend as the storage modulus: plateauing as temperature increased at the same points at which
storage modulus decreased sharply before leveling off. These points correspond to the
polymers’ transition from a glassy state to a rubbery state.

155
A significant improvement in the physical properties of Type II PDMS and its blends was
achieved by incorporating the polyurethane polymer. The elastic modulus of this network
was significantly improved, from 0.2 MPa to 1 MPa. Storage and loss tangent versus
temperature data for the blends are plotted in Figure 4.6. The curves in both plates ((a) for
Type I and (b) for Type II) show the shifted Tg at approximately -31 °C for the PU and at -
111 °C for both the Type I and Type II PDMS. Since the temperatures of the transitions in
Polymer Composition (wt %) Tg (°C) Tg2 (°C) Tg-blends (°C)
PU -20.4
Type I PDMS -111.3 -40.5
Type I +10% PU -110.0 -30.5
Type I + 20% PU -111.2 -31.4
Type I + 40% PU -110.2 -30.1
Type II PDMS -112.1 -37.8
Type II + 10% PU -112.2 -30.1
Type II+ 20% PU -112.3 -30.2
Type II + 40% PU -112.4 -29.0
Table 4.3 Glass transition temperature (Tg) of polymer blends and their pure polymer
constitutes. The temperature data was calculated from the tan(δ) peaks in Figure 4.6.

156
the blend are identical to those in the homonetworks, the two polymers are incompatible, and
the blend is phase-separated.
4.3.3 Differential Scanning Calorimetry (DSC) Analysis
DSC analyses of the blends, PU, and PDMS are provided in Figure 4.7. These plots were
created from the measurements taken during the second heating cycle, which ran from -90 °C
to 260 °C. A PDMS elastomer generally exhibits four DSC peaks during the second heating
cycle: (1) the glass transition, (2) an exothermal crystalline formation (cold crystallization),
(3) the endothermic melting of one crystalline form, and (4) the other crystalline form of the
polymer88. Aranguren et al.48 report that this crystallization during the heating cycle displays
peak dependencies on cooling and heating rates. In our experiments, we observed a single
endotherm crystallization peak for both PDMS types and their blends. A single
crystallization peak, without a cold-crystallization peak, is proof of an existing one-crystal
form, with quite perfectly formed crystals89. A cold crystallization has generally been
observed in linear PDMS networks88. Cold-crystallization peaks were absent in the
measurements we obtained during the second heating run (see Figure 4.7), indicating that the
samples were cured.

157
Figure 4.7 DSC Analysis of Types I and II elastomer and their blends. Red (―) represents
pure PDMS; blue line (―) represents PU polymer; green line (―) represents 20 PU wt%
concentration blend sample; and black line (―) represents 40 PU wt% concentration
blend sample: (a) storage modulus and loss modulus with varying temperature from -120
°C to 200 °C for PDMS elastomer Type I and its blends with 20 wt% and 40 wt%
concentrations; (b) storage modulus and loss modulus with varying temperature from -120
°C to 200 °C for PDMS elastomer Type II and its blends with 20 and 40 wt%
concentrations.
(a) (b) (E
ndo
Up)

158
The noticeable peaks in Figure 4.7 represent endothermic melting of a single crystalline
form. These thermograms show a single large peak around -50 °C, attributed to the
crystallization of PDMS networks and indicating a complete chemically crosslinked polymer
network90. Such single large peaks present in thermograms indicate a complete chemically
crosslinked polymer network87, with peaks around -50 °C related to crystallization of PDMS
networks.
Incorporating silica fillers did not significantly affect the main Tg of cured and uncured
PDMS networks or the segmental mobility of polymer chains. However, ΔCp is reported to
be around 1/4 of that of the uncured polymer38 with around 0.140 J/g°C for cured PDMS
samples. The literature reports an increase in heterogeneous nucleation crystallization and a
Polymer Type ΔHm (J/g)
Xc (%) Overall ΔXc (%)
PDMS phase ΔXc (%)
Xc Peak (°C)
PU 15,4 -22.4
Type I neat PDMS 41 - - -40.5
Type I +10% PU %-11 %-1 -30.5
Type I + 20% PU 12.1 32 %-22 %-2 -31.4
Type I + 40% PU 7.8 21 %-50 %-2 -30.1
Type II neat PDMS 23.3 62 - -37.8
Type II+ 10% PU -30.1
Type II+ 20% PU 18.4 49 %-31 %-0.5 -30.2
Type II + 40% PU 12.9 35 %-43 %-1 -29.0
Table 4.4 Crystallinity and crystallinity peak temperatures of elastomers with different
PDMS/PU ratios in casting solutions. These calculations are based on the data presented in
Figure 4.7

159
decrease in general crystallization with incorporation of silica fillers. This different results
reported in the in the literature is repported to be a result of differences in silica filler
interface chemistry48.
In our DSC results, provided in Figure 4.7, there were fewer crystals in the PDMS with silica
fillers because the presence of silica fillers is only in Type I PDMS, it has lower heat of
fusion, and less amount of crystals. The crystals in Type II elastomers showed internal
stresses increased by the crystal formation occurring during heating cycles.
In general, the heat of fusion is reported to decrease with increasing silica concentration and
crosslinking density, because crosslinking decreases both the extent and the stability of the
crystal phase48. Silica decreases the measured heat, but it also interferes with the
crystallization process and affects ΔHfs values because the polymer loops and chain ends
cannot crystallize when attached to solid surfaces due to topological constraints. As a result,
the bound elastomer reaches a lower degree of crystallization than the pure polymer. This
effect is similarly observed in our results: The Type I blends showed a smaller crystallization
peak for each composition and smaller ΔHfs values in pure form. It can be concluded from
the DSC data reported in Figure 4.7(a)-(b) that the Type II blends had a higher number of
crystals than the Type I blends.
In DCS of PU and PDMS, polymers were shown to be disrupted over a 250-450 °C
temperature range, depending on hard and soft segment degradation91–93. In our experiments,
PU endotherms were around 260 °C (see Figure 4.7(a)-(b)). There was a fluctuation in heat
of fusion at about 200 °C.

160
The calculated crystallinity of each composition is listed in Table 4.4. The data show that the
crystallinity of PDMS was reduced negligibly by the incorporation of PU. The depressed
crystallization in the PDMS/PU blends was attributed to the higher compatibility between
PDMS and PU chains in another study94. However in our work, crystallinity in the PDMS
phase showed a decrease around 1-2% for Type I blends and around 1% for Type II blends.
This results suggests that the PDMS polymer crystal structure is not slightly to not affected
by PU phase.
The crystalline melting temperatures of the blends were not significantly different from those
displayed by the pure PDMS sample. The crystalline fusion enthalpies of the blends
decreased with PU content, as shown in Table 4.4. Because these peaks at around -50 °C
(shown in Figure 4.7(a)-(b)) represent an overlap of second-segmental PDMS movement and
of PU Tg, a complete evaluation of these samples was not possible. However, we were able
to obtain more information in this temperature region from our DMA data: the polymer
blends maintained their pristine individual polymer characteristics.
The DSC curves of the PDMS-PU blend are a simple superposition of the DSC curves of the
respective pure polymers, indicating an absence of significant interactions between PU and
PDMS. The PU was observed to exhibit two Tg temperatures, one originating from soft
segments and the other from hard segments. A Tg of -20.1 °C for the PU elastomer in DSC
was observed. The glass transition of PU at -20 °C could be clearly observed in DMA, as
discussed earlier, but became unobservable as PDMS endothermic crystallization at -41 °C
became dominant in both type of blends.

161
PDMS blends have been reported to phase-mix with soft segments of other polymers95.
However, we observed a phase separation for both types of blends and all compositions. The
lower glass transition temperature of the blends, around 1 °C, resembled that of PDMS,
indicating little to no mixing of the PU soft segments into the PDMS domain. Crystallization
changes in the PDMS phase of the blends, provided in Table 4.4, confirm this result.
4.3.4 FTIR Analysis
FTIR band assignments for PU and PDMS are provided in Table 4.5. FTIR data plots for the
Type I PDMS, Type II PDMS, PU, and blends are provided in Figure 4.8 and Figure 4.9.
The FTIR spectra of the ether-based PU are shown in Figure 4.8. Generally, the chemical
composition of the polyurethane is based on the hard-segment (urethane-group) crystalline
domain and the soft-segment (polyether or polyester) amorphous phase96. FTIR spectra of
PU display the following peaks: The hard segments of PU was at 1729 cm-1 urethane (non-
hydrogen-bonded) and 1701 cm-1 urethane (hydrogen-bonded) The amide II and amide III
bands for polyurethanes appeared at 1537 cm-1 and 1230 cm-1, respectively. The hydrogen-
bonded urethane N-H stretch occurred at 3326 cm-1. The bands at 2963 cm-1, 2903 cm-1, and
2875 cm-1 were linked to symmetric and asymmetric –CH2– and –CH3 groups, while the
bands at 1597 cm-1 and 1413 cm-1 were ascribed to the aromatic carbon-carbon double
bonding97.
The presence of the urethane structure can be verified by the FTIR peaks at 1530 cm-1, which
were due to NH bending; at 1703 cm-1, due to the carbonyl stretching; and at 3320 cm-1, due
to the NH stretching from the urethane linkage. Additionally, polyether urethane was

162
identified by the band at 1082 cm-1, which represents the ether (C–O–C) linkage98, and by the
peak at 1220 cm-1.
Table 4.5 FTIR assignments of PU and PDMS polymers96–99.
PU Assignments PDMS Assignments 3326 ν (N–H) (H-bonded) 2960 ν (C–H) in CH3 2940 νa (C–H) in CH2 1260 δ (C–H) in Si-CH3 2855 νs (C–H) in CH2 1080 νa (Si–O–Si) in Si-O-Si 1729 ν (C=O) urethane non-bonded 1016 νs (Si–O–Si) in Si-O-Si 1701 ν (C=O) urethane H-bonded 790 ρ (C–H) in Si-CH3 1597 ν (C–C) aromatic ring 1530 ν (C–N) + δ (N-H) amide II 1414 ν (C–C) aromatic ring 1313 ν (C–N) + δ (N-H) 1220 ν (C–N) + δ (N-H) amide III 1115 νa (C–O–C) aliphatic ether 1082 ν (C–O–C) in hard segment (O=C–O–C) urethane linkage
ν=stretching mode, νa =asymmetric stretching, νs =symmetric stretching, δ= in-plane
bending or scissoring, ρ=in-plane bending or rocking,

163
Figure 4.8 FTIR Spectrum for Type I PDMS, PU, and its blends: red (―) represents pure PDMS; blue (―)
represents pure PU; green (―) represents 20 PU wt% concentration Type II blend.
0
0.2
0.4
0.6
0.8
1
5001000150020002500300035004000
PUType I PDMSType I Blend (20 % PU)
Inte
nsity
Wavenumber (cm-1)
3326 (N-H)
2940 (C-H) in CH2
1729 (C=O) urethane non-bonded
1701 (C=O) urethane H-Bonded
1082 (C-O-C) in hard segment
476 Hydrogen isocyanate
1530 amide III
1537 (Amide II)
1016 Si-O-Si
1080 C-O-C
790 Si-CH3

164
Figure 4.9 FTIR Spectrum for Type II PDMS, PU, and its blends: red (―) represents pure PDMS; blue (―)
represents pure PU; green (―) represents 20 PU wt% concentration Type II blend.
0
0.2
0.4
0.6
0.8
5001000150020002500300035004000
Type II PDMSPUType II Blend (20 % PU)
Inte
nsity
Wavenumber (cm -1)
1082 (C-O-C) in hard segment
3326 (N-H)
2940 (C-H) in CH2
1729 (C=O) urethane non-bonded
1701 (C=O) urethane H-Bonded
1670 bonded urethane (C=O)

165
Two types of PDMS are depicted separately in Figure 4.8 and Figure 4.9 for Type I and Type
II blends, respectively. In Figure 4.8, the intensive bands at 1016 cm-1 and 1080 cm-1
correspond to the Si–O–Si and C–O–C groups. The absorption band at around 790 cm-1 is
attributable to the Si–CH3 linkage. The CH3 bending and rocking peaks are apparent at 1260
and 801 cm-1, respectively.
Type I elastomers exhibited peaks near 960 cm-1 and 470 cm-1 these peaks were attributed in
literature to PDMS-containing vinyl end groups present in the elastomer after the hydro-
silylation reaction100. These peaks also confirm the crosslinking of Type I PDMS and its
blends.
FTIR of Type II PDMS elastomers, plotted in Figure 4.9, did not exhibit a peak pattern
differing substantially from that of Type I elastomers in Figure 4.8, confirming that the final
chemical structures of Type II and Type I elastomers are similar, with the exception of the
vinyl double bonds observed in Type I elastomers. In Type I blends, carbonyls that were not
involved in hydrogen bonding are apparent near 1732 cm-1, and those associated with poorly
ordered hydrogen bonding can be observed at 1720 cm-1. In Type I elastomer blend systems,
we also observed non-hydrogen bonded carbonyls at 1729 cm-1 and poorly hydrogen-bonded
carbonyl groups near 1701 cm-1. All peaks associated with hydrogen bonding carbonyl
groups were found to be negligible in Type II elastomer blends.
Silanol groups, generally recognized as hydration sites, are expected to give rise to strong
absorption bands in infrared spectra, mainly in the range of 3800-3200 cm-1. Hydrogen
bonding shifts the OH wave number to a lower value and broadens the absorption band101. As

166
shown in Figure 4.9, Type II blends exhibited flattened PU hydration sites due to the absence
of hydrogen bonding between PU and Type II PDMS networks.
The FTIR data for Type II PDMS and its blends shown in Figure 4.9 did not display a peak at
2270 cm-1, which represents –NCO groups of crosslinker, which could be consumed in
network formation.
In general, the FTIR spectrum of blends in Figure 4.8 and Figure 4.9 was similar to those of
constituting PDMS. Confirming the chemical interaction of PU and PDMS species using
FTIR spectroscopy was not possible.
4.3.5 Morphological Characterization
We used SEM to discover the morphological properties of the elastomer blends. The SEM
images are provided in Figure 4.10 through Figure 4.13. The blend morphologies of the Type
I and Type II blend samples show the uniform distribution of the spherical PU phases
throughout the PDMS matrix, as also shown in Figure 4.10(a). In general, the domains of
immiscible polymer blends are round in shape, which serves to minimize interfacial area.

167
As we examined the blend images, we observed that the density of spherical PU fillers
distributed throughout each sample increased as PU concentration increased. We compared
10%, 20%, and 40 wt% PU/PDMS blends to understand the PU filler size in PDMS (see
Figure 4.11).
We also noticed an increase in average filler size with the increase in filler weight
concentration(Figure 4.11) The distribution of the fillers was also analyzed for a large
number of samples through image analysis to fully explore the relationship between PU
concentration and PU filler size; in short, filler size increased with the increase in filler
concentration. In terms of morphology, fillers were spherical for low-concentration (10-20%)
blends but became ovoid as filler concentration increased to 40%. This change in shape may
be owing to result of solvent removal process. These results are reported in Figure 4.11(a)-
(d). In Figure 4.11(a), we observe spherical PU fillers, each measuring less than 1 μm in
diameter for 2 wt% concentration. Figure 4.11(b) reveals spherical PU fillers from 10 wt%
Figure 4.10 Morphological views of PU/PDMS blend elastomers with (a) representative
10% PU filler concentration and (b) spherical PU distributed throughout the PDMS
matrix. (image taken from 10 wt% PU / Type I PDMS blends.)
(a) (b)

168
concentration blends with an average diameter of 2.5 μm. Figure 4.11 (c) shows the 20 wt%
concentration fillers with an average diameter of 4.5 μm, and Figure 4.11(d) shows the blend
having 40 wt% PU concentration with an average diameter of 8 μm fillers.
Figure 4.11 Representative morphological electron microscope images of PU/PDMS
blend elastomers with (a) a film cross-section of 2% PU filler concentration; (b) spherical
10% PU fillers distributed throughout the PDMS matrix; (c) spherical 20% PU fillers
distributed throughout the PDMS matrix; (d) spherical and ovoid 40% PU fillers
distributed throughout the PDMS matrix.
(a)
(b)
(a)
(d) (c)

169
The cross-section in Figure 4.12(a) shows the interfaces of the PU and PDMS in a blend.
This representative image of a spherically shaped single filler was taken from 10 wt% blend
Type I shows the PDMS matrix separation from PU fillers during the fracture tearing of
samples. The blend samples were fractured after being soaked in liquid nitrogen; Figure
4.12(b) shows the PU filler fractured out from the PDMS matrix.
Increasing weight concentration of PU in the Type I and Type II blends was found to
correspond with denser distribution of the spherical PU fillers. Average filler size also
increased with increased filler concentration. The increase in PU weight concentration
affected the elastomers’ surface morphology, as shown in Figure 4.11(a)-(d). The cross
Figure 4.12 Morphological cross-sections of blend Type I elastomers. Images (a) and (b)
show the dispersion of spherical PU elastomer fillers throughout the PDMS matrix; this
points to the separation of spherical PU fillers from the PDMS matrix. These images were
taken after a fracture of blends occurred in liquid nitrogen. The interphases between the
species are pointed out in the images above.
(a) (b)

170
sections of the blends were also analyzed using ImageJ software to determine the average
filler size. These data are plotted in Figure 4.14.
The Type II blends were also characterized using SEM microscopy. In contrast to what the
Type I blends showed in the interphase images, the Type II blends, displayed in Figure
4.13(a), exhibited the matrix diffused with the spherical shapes of the PU elastomer phase.
Figure 4.13(b) shows the PU and PDMS interface in Type II blends.
According to the SEM results, the PU phases were relatively uniformly dispersed throughout
the PDMS matrix at low weight concentrations. However, at a high weight PU concentration,
the filler dimensions increased and the uniformity of PU size decreased. A plot of these
effects is provided in Figure 4.149. Klempner et al.9 observed similar results related to the
phase behavior of blends with respect to PU concentration.
Figure 4.13 Morphology of blend elastomers with 2 wt% PU concentration: (a) cross-
sectional view of Type II elastomer blends and (b) spherical PU filler edges diffused to
PDMS.
-----------2µm---------- -----------30µm----------
(b) (a)

171
4.3.6 Dielectric Characterization
The dielectric constant (efective permitivity) of Type I blends are given in Figure 4.15. In
this figure, all blends of PU and PDMS showed a significant increase in dielectric constant
with the increasing wt % of PU in blends. This improvement was greater in blends with low
PU weight concentrations than in elastomers with high PU weight concentrations.
Specifically, the increase in dielectric constant for the blends with a PU load of 5 wt% was
higher than for the blends with weights of 20% and 40%. This difference can be explained by
superior dispersion of PU throughout the PDMS at lower PU weight concentrations.
Figure 4.14 Analysis of morphological cross-sectional images of blends for both Type I
and Type II elastomers. SEM images were analyzed for filler dimensions: (a) Type I
distribution of size of filler diameter blends and (b) Type II distribution of approximate
filler size diameter blends.
(a) (b)

172
In the plots of the PU filler size data provided in Figure 4.14, lower weight concentrations
showed smaller filler sizes. The relationship between filler size and the increase in dielectric
constant can be a proof of interfacial polarization between the PU and PDMS polymers.
The dielectric constants of the PU elastomer and blend composites showed a slight decrease
from low frequency to high frequency. This decrease can be attributed to the increase in
dielectric loss of blends in high frequencies (plotted in Figure 4.16). This comparison was
found to be even more consistent for 40% PU blends and can be attributed to the higher
dielectric loss in these samples.
Figure 4.15 The dielectric constant (efective permitivity, ε′) as a function of frequency
for Type I blends. (▼)PU, (∆) 40 wt% PU, (◇) 20 wt% PU, (□) 10 wt% PU, (◌) 2 wt%
PU, (▲)PDMS.

173
The elastomer blends containing PU and the pure PU displayed higher dielectric dissipation
than the pure PDMS at high frequencies. The same trend was observed for dielectric
constant. The dielectric dissipation for all blends decreased as frequency increased.
In literature60, the PU-PDMS composites and the pure PU elastomer showed higher dielectric
loss values than the PDMS elastomer. The dielectric loss of PU elastomers has been reported
to increase due to α-relaxation and ionic conductivity102. The dielectric tan(Δ) versus
frequency behavior versus frequency that we plotted in Figure 4.16 for PU is comparable to
that described in the literature102. For high concentrations blends exhibited higher dielectric
losses than the pure PDMS elastomer. In fact, all of the polymer blends exhibited low
Figure 4.16 Dielectric loss, (tan Δ) as a function of frequency for the Type II blends.
(▼)PU, (∆) 40 wt% PU, (◇) 20 wt% PU, (□) 10 wt% PU, (◌) 2 wt% PU/PDMS blends,
(▲)PDMS.

174
dielectric loss, a highly desirable quality for dielectric composites. The tan(Δ) values
reported in Figure 4.16 were less than 0.06 for all elastomer compositions at frequencies 20
to 106 Hz. Their low losses and high dielectric constants relative to pure PDMS make these
materials good candidates for use as actuators in dielectric insulation applications.
4.3.7 Evaluation of Dielectric Properties
Figure 4.17 is a plot of dielectric constant versus PU wt% at frequencies of (a) 100 Hz and
(b) 106 Hz. We also superimposed the theoretical rule of mixture curves over the
experimental measurement points of the blends to explore the underlying mechanisms of the
(b) (a)
Figure 4.17 Effective permittivity as a function of weight fraction of polyurethane (a) at
a low-frequency measurement (100 Hz) and (b) at a high-frequency measurement (106
Hz). The dashed lines represent the theoretically predicted results based on weight
concentration. Dashed lines represent (—) series, (---) logarithmic, (-∙-) parallel, and (--)
Maxwell Garnet theoritical prediction of mixing for dielectric constant, in order from
bottom to top. Data connected with dots serve guide to eye.
2.5
3
3.5
4
4.5
5
5.5
0 10 20 30 40
Die
lect
ric C
onst
ant (ε)
PU Concentration (wt %)
2.5
3
3.5
4
4.5
5
0 10 20 30 40
Die
lect
ric C
onst
ant (ε)
PU Concentration (wt %)

175
blends’ dielectric constant. Greater improvement in blend composite dielectric behavior was
observed for low-frequency blend compositions than for high-frequency compositions. The
values of the low-frequency dielectric constant for both high and low frequencies dielectric
constants did not follow any of the therotical predictions while values were even higher than
the Maxwell Garnet model predictions.
Because improvement of effective permittivity was prominent in low-frequency regions, we
can infer that the interphase properties of these blends had a positive impact on dielectric
properties.
4.4 Conclusions
The mechanical and elastomeric properties of silicone networks are improved through the
synthesis of semi-interpenetrating networks of poly (dimethylsiloxane)/polyurethane. The
miscibility of two polymers was studied with the goal of improving the mechanical and
dielectric properties of their blends. Two types of PDMS elastomers with varying chemical
structures and crosslinking mechanisms were investigated for their dynamic mechanical,
thermal, dielectric, and chemical properties. Type I PDMS blends had decreased mechanical
properties as compared to pure Type I PDMS, while Type II blends displayed increased
mechanical properties as compared to pure Type II PDMS. The effects of Type II
formulation on a blend’s electromechanical properties will be discussed in Chapter 5.
The homopolymers of PDMS and PU were transparent, whereas all of the blended IPNs of
the PDMS-PU systems were opaque, indicating phase separation. The miscibility
calculations and the results of the dynamic mechanical analysis confirmed the

176
incompatibility and immiscibility of these two polymers. The blended semi-IPNs of the
PDMS-PU systems formed phase-separated polymer pairs because they displayed two Tgs
similar to the glass transition temperatures of both homopolymers. PDMS-PU semi-IPN
blends showed an increase of up to 5.2 at low-frequency measurements and 4.5 at high-
frequency measurements. These blends therefore have an advantage over pure PDMS
elastomers in terms of dielectric constant.
The promise of blending approach lies in the fact that the increase in dielectric constant did
not significantly increase the dielectric loss and stiffness of the blend elastomers. The high
shear mixing were the keys to creating a blend film with a higher dielectric constant and low
loss. Although, the dielectric loss of the blends increased; satisfactory results were achieved
to evaluating them as dielectric elastomer actuator materials. These results will be presented
in Chapter 5.
4.5 References
1. Wong, F. et al. Changing molecular band offsets in polymer blends of
(P3HT/P(VDF–TrFE)) poly(3-hexylthiophene) and poly(vinylidene fluoride with
trifluoroethylene) due to ferroelectric poling. RSC Adv. 4, 3020–3027 (2013).
2. Zhu, S. et al. Confinement-induced miscibility in polymer blends. Nature 400, 49–51
(1999).
3. Jacobs, H. O. & Whitesides, G. M. Submicrometer patterning of charge in thin-film
electrets. Science 291, 1763–1766 (2001).
4. Dang, Z.-M., Yuan, J.-K., Yao, S.-H. & Liao, R.-J. Flexible nanodielectric materials
with high permittivity for power energy storage. Adv. Mater. 25, 6334–6365 (2013).

177
5. Ding, Y., Garland, S., Howland, M., Revzin, A. & Pan, T. Universal nanopatternable
interfacial bonding. Adv. Mater. 23, 5551–5556 (2011).
6. Li, G. et al. High-efficiency solution processable polymer photovoltaic cells by self-
organization of polymer blends. Nat. Mater. 4, 864–868 (2005).
7. Hamilton, R. et al. High-performance polymer-small molecule blend organic
transistors. Adv. Mater. 21, 1166–1171 (2009).
8. Wolfer, P. et al. Solution structure: defining polymer film morphology and
optoelectronic device performance. J. Mater. Chem. C 2, 71–77 (2013).
9. Klempner, D. Advances in Interpenetrating Polymer Networks. (CRC Press, 1994).
10. Sperling, L. H. & Mishra, V. The current status of interpenetrating polymer networks.
Polym. Adv. Technol. 7, 197–208 (1996).
11. Siegfried, D. L., Thomas, D. A. & Sperling, L. H. A reexamination of
polystyrene/polystyrene homo interpenetrating polymer networks: aspects of relative
network continuity and internetwork coupling. Macromolecules 12, 586–589 (1979).
12. Lipatov, Y. S. & Alekseeva, T. T. in Phase-Separated Interpenetr. Polym. Netw. 1–
227 (Springer Berlin Heidelberg, 2007).
13. Fichet, O., Vidal, F., Darras, V., Boileau, S. & Teyssié, D. in Silicon Based Polym.
(eds. Ganachaud, D. F., Boileau, D. S. & Boury, P. B.) 19–28 (Springer Netherlands,
2008).
14. Lee, D. S. & Kim, S. C. Polyurethane interpenetrating polymer networks (IPN’s)
synthesized under high pressure. 3. Morphology and Tg behavior of polyurethane-
polystyrene semi-IPN’s and linear blends. Macromolecules 17, 2222–2227 (1984).

178
15. Sánchez, M. S. et al. Forced compatibility in poly(methyl acrylate)/poly(methyl
methacrylate) sequential interpenetrating polymer networks. Polymer 42, 10071–
10075 (2001).
16. Xiao, H., Ping, Z. H., Xie, J. W. & Yu, T. Y. The synthesis and morphology of semi-
interpenetrating polymer networks based on polyurethane–polydimethylsiloxane
system. J. Polym. Sci. Part Polym. Chem. 28, 585–594 (1990).
17. Rozenberg, B. A. & Sigalov, G. M. Heterophase network polymers: synthesis,
characterization, and properties. (CRC Press, 2004).
18. Du Prez, F. E., Tan, P. & Goethals, E. J. Poly(ethylene oxide)/poly(methyl
methacrylate) (semi-)interpenetrating polymer networks: Synthesis and phase
diagrams. Polym. Adv. Technol. 7, 257–264 (1996).
19. Atkins, P. W. The laws of thermodynamics. (Oxford University Press, 2010).
20. Utracki L. A. in Interpenetr. Polym. Netw. 239, 77–123 (American Chemical Society,
1994).
21. Huggins, M. L. Some properties of solutions of long-chain compounds. J. Phys.
Chem. 46, 151–158 (1942).
22. Huggins, M. L. Theory of solutions of high polymers. J. Am. Chem. Soc. 64, 1712–
1719 (1942).
23. Huggins, M. L. Thermodynamic properties of solutions of long-chain compounds.
Ann. N. Y. Acad. Sci. 43, 1–32 (1942).
24. Flory, P. J. Principles of polymer chemistry. (Cornell University Press, 1953).

179
25. Scott, R. L. & Magat, M. The thermodynamics of high‐polymer solutions: i. the free
energy of mixing of solvents and polymers of heterogeneous distribution. J. Chem.
Phys. 13, 172–177 (1945).
26. Bates, F. S. Polymer-polymer phase behavior. Science 251, 898–905 (1991).
27. Eichinger, B. E. & Flory, P. J. Thermodynamics of polymer solutions. Part 4.—
Polyisobutylene and n-pentane. Trans. Faraday Soc. 64, 2066–2072 (1968).
28. Flory, P. J. Statistical thermodynamics of liquid mixtures. J. Am. Chem. Soc. 87,
1833–1838 (1965).
29. Flory, P. J., Orwoll, R. A. & Vrij, A. Statistical thermodynamics of chain molecule
liquids. i. an equation of state for normal paraffin hydrocarbons. J. Am. Chem. Soc.
86, 3507–3514 (1964).
30. Masnada, E. M., Julien, G. & Long, D. R. Miscibility maps for polymer blends:
Effects of temperature, pressure, and molecular weight. Journal of Polymer Science
Part B: Polymer Physics 52, 419–443 (2013).
31. Alekseeva, T. T. Phase-Separated Interpenetrating Polymer Networks. (Springer,
2007).
32. Majumdar, P. & Webster, D. C. Surface microtopography in siloxane–polyurethane
thermosets: the influence of siloxane and extent of reaction. Polymer 48, 7499–7509
(2007).
33. Kulkarni, A. S. & Beaucage, G. Reaction induced phase-separation controlled by
molecular topology. Polymer 46, 4454–4464 (2005).
34. Briber, R. M. & Bauer, B. J. Effect of crosslinks on the phase separation behavior of a
miscible polymer blend. Macromolecules 21, 3296–3303 (1988).

180
35. Nevissas, V., Widmaier, J. M. & Meyer, G. C. Effect of crosslink density and
internetwork grafting on the transparency of polyurethane/polystyrene
interpenetrating polymer networks. J. Appl. Polym. Sci. 36, 1467–1473 (1988).
36. Faghihi, F., Morshedian, J., Razavi-Nouri, M. & Ehsani, M. Dynamic rheological and
mechanical behaviour of poly(dimethylsiloxane)/low density polyethylene immiscible
blends: interfacial modification via reactive blending. Iran. Polym. J. 17, 755–765
(2008).
37. Rezaei, S. M. & Mohd Ishak, Z. A. The biocompatibility and hydrophilicity
evaluation of collagen grafted poly(dimethylsiloxane) and poly (2-
hydroxyethylmethacrylate) blends. Polym. Test. 30, 69–75 (2011).
38. Zhou, P. et al. Interpenetrating polymer networks of poly (dimethyl siloxane–
urethane) and poly (methyl methacrylate). J. Polym. Sci. Part Polym. Chem. 31,
2481–2491 (1993).
39. Derouiche, A., Bettachy, A., Benhamou, M. & Daoud, M. Kinetics of microphase
separation in crosslinked polymer blends. Macromolecules 25, 7188–7191 (1992).
40. Cho, S. H., Andersson, H. M., White, S. R., Sottos, N. R. & Braun, P. V.
Polydimethylsiloxane-based self-healing materials. Adv. Mater. 18, 997–1000 (2006).
41. Inoue, T. Reaction-induced phase decomposition in polymer blends. Prog. Polym.
Sci. 20, 119–153 (1995).
42. Olabis, O. Polymer-polymer miscibility. (Elsevier, 2012).
43. Lee, M. H., Fleischer, C. A., Morales, A. R., Koberstein, J. T. & Koningsveld, R. The
effect of end groups on thermodynamics of immiscible polymer blends. 2. Cloud
point curves. Polymer 42, 9163–9172 (2001).

181
44. Yılgör, E. & Yılgör, İ. Hydrogen bonding: a critical parameter in designing silicone
copolymers. Polymer 42, 7953–7959 (2001).
45. Fang, L. et al. Precise pattern replication of polymer blends into nonuniform
geometries via reducing interfacial tension between two polymers. Langmuir 28,
10238–10245 (2012).
46. Hu, W., Koberstein, J. T., Lingelser, J. P. & Gallot, Y. Interfacial tension reduction in
polystyrene/poly(dimethylsiloxane) blends by the addition of poly(styrene-b-
dimethylsiloxane). Macromolecules 28, 5209–5214 (1995).
47. Wignall, G. D., Alamo, R. G., Londono, J. D., Mandelkern, L. & Stehling, F. C.
Small-angle neutron scattering investigations of liquid−liquid phase separation in
heterogeneous linear low-density polyethylene. Macromolecules 29, 5332–5335
(1996).
48. Aranguren, M. I. Crystallization of polydimethylsiloxane: effect of silica filler and
curing. Polymer 39, 4897–4903 (1998).
49. Hassanajili, S., Khademi, M. & Keshavarz, P. Influence of various types of silica
nanoparticles on permeation properties of polyurethane/silica mixed matrix
membranes. J. Membr. Sci. 453, 369–383 (2014).
50. Dewimille, L., Bresson, B. & Bokobza, L. Synthesis, structure and morphology of
poly(dimethylsiloxane) networks filled with in situ generated silica particles. Polymer
46, 4135–4143 (2005).
51. Joki-Korpela, F. & Pakkanen, T. T. Incorporation of polydimethylsiloxane into
polyurethanes and characterization of copolymers. Eur. Polym. J. 47, 1694–1708
(2011).

182
52. Bai, H.-C., Tao, L., Pang, Y.-J., Zhou, Y.-J. & Chen, J. Synthesis and characterization
of hydroxypropyl terminated polydimethylsiloxane-polyurethane copolymers. J.
Appl. Polym. Sci. 129, 2152–2160 (2013).
53. Hamurcu, E. E. & Baysal, B. M. Interpenetrating polymer networks of
poly(dimethylsiloxane) with polystyrene, polybutadiene and
poly(glycerylpropoxytriacrylate). Macromol. Chem. Phys. 196, 1261–1276 (1995).
54. Kim, P.-S., Lee, S.-W., Park, J.-W., Park, C.-H. & Kim, H. J. Kinetic and
characterization of UV-curable silicone urethane methacrylate in semi-IPN-structured
acrylic PSAs. J. Adhes. Sci. Technol. 27, 1866–1872 (2013).
55. Lucas, P. & Robin, J.-J. in Funct. Mater. Biomater. 111–147 (Springer Berlin
Heidelberg, 2007). at <http://link.springer.com/chapter/10.1007/12_2007_115>
56. Vlad, S., Vlad, A. & Oprea, S. Interpenetrating polymer networks based on
polyurethane and polysiloxane. Eur. Polym. J. 38, 829–835 (2002).
57. Turner, J. S. & Cheng, Y.-L. Morphology of PDMS−PMAA IPN membranes.
Macromolecules 36, 1962–1966 (2003).
58. Boileau Sylvie, Bouteiller Laurent, Khalifa Riadh Ben, Liang Yi & Teyssié
Dominique. in Silicones Silicone-Modif. Mater. 729, 383–394 (American Chemical
Society, 2000).
59. Yang, S. et al. Thermally resistant UV-curable epoxy–siloxane hybrid materials for
light emitting diode (LED) encapsulation. J. Mater. Chem. 22, 8874–8880 (2012).
60. Gallone, G., Galantini, F. & Carpi, F. Perspectives for new dielectric elastomers with
improved electromechanical actuation performance: composites versus blends.
Polym. Int. 59, 400–406 (2010).

183
61. Chwang, C.-P., Liu, C.-D., Huang, S.-W., Chao, D.-Y. & Lee, S.-N. Synthesis and
characterization of high dielectric constant polyaniline/polyurethane blends. Synth.
Met. 142, 275–281 (2004).
62. Kussmaul, B., Risse, S., Wegener, M., Kofod, G. & Krüger, H. Novel DEA materials
by chemical grafting of silicone networks on molecular level. in Proc SPIE Vol 8340,
83400Y–1 (2012).
63. Skova, A. L., Bejenariua, A., Bøgelundb, J., Benslimanec, M. & Egedea, A. D.
Influence of micro-and nanofillers on electro-mechanical performance of silicone
EAPs. in Proc SPIE Vol 8340, 83400M–1 (2012).
64. Xu, J., Bhattacharya, S., Pramanik, P. & Wong, C. P. High dielectric constant
polymer-ceramic (Epoxy varnish-barium titanate) nanocomposites at moderate filler
loadings for embedded capacitors. J. Electron. Mater. 35, 2009–2015 (2006).
65. Meng-Meng, L. et al. Dielectric properties of electrospun titanium
compound/polymer composite nanofibres. Chin. Phys. B 19, 028102 (2010).
66. Li Li et al. Novel polymer-ceramic nanocomposite based on new concepts for
embedded capacitor application (I). Compon. Packag. Technol. IEEE Trans. On 28,
754–759 (2005).
67. Carpi, F., Gallone, G., Galantini, F. & De Rossi, D. Silicone-poly(hexylthiophene)
blends as elastomers with enhanced electromechanical transduction properties. Adv.
Funct. Mater. 18, 235–241 (2008).
68. Carpi, F., Gallone, G., Galantini, F. & De Rossi, D. Enhancement of the
electromechanical transduction properties of a silicone elastomer by blending with a
conjugated polymer. in SPIE Proceedings (ed. Bar-Cohen, Y.) 6927, 692707–
692707–11 (2008).

184
69. Carpi, F. & Rossi, D. D. Improvement of electromechanical actuating performances
of a silicone dielectric elastomer by dispersion of titanium dioxide powder. IEEE
Trans. Dielectr. Electr. Insul. 12, 835–843 (2005).
70. Ouyang, G. M., Wang, K. Y. & Chen, X. Y. Enhanced electro-mechanical
performance of TiO2 nano-particle modified polydimethylsiloxane (PDMS) as
electroactive polymers. in 16th Int.Solid-State Sens. Actuators Microsyst. Conf. 2011
614–617 (2011).
71. Anquetil, P. A. et al. Thiophene-based conducting polymer molecular actuators. in
Proc SPIE 4695, 424–434 (2002).
72. Muzafarov, A. Silicon polymers. (Springer, 2010).
73. Tsige, M. et al. Interactions and structure of poly(dimethylsiloxane) at silicon dioxide
surfaces: Electronic structure and molecular dynamics studies. J. Chem. Phys. 118,
5132 (2003).
74. Karabela, M. M. & Sideridou, I. D. Effect of the structure of silane coupling agent on
sorption characteristics of solvents by dental resin-nanocomposites. Dent. Mater. 24,
1631–1639 (2008).
75. Seeni Meera, K. M., Murali Sankar, R., Jaisankar, S. N. & Mandal, A. B.
Physicochemical studies on polyurethane/siloxane cross-linked films for hydrophobic
surfaces by the sol–gel process. J. Phys. Chem. B 117, 2682–2694 (2013).
76. Park, S., Kim, J. S., Chang, Y., Lee, S. C. & Kim, C. A covalently interconnected
phosphazene–silicate network: synthesis and surface functionalization. J. Inorg.
Organomet. Polym. 8, 205–214 (1998).

185
77. Tingaut, P., Weigenand, O., Militz, H., Jéso, B. D. & Sèbe, G. Functionalisation of
wood by reaction with 3-isocyanatopropyltriethoxysilane: Grafting and hydrolysis of
the triethoxysilane end groups. Holzforschung 59, 397–404 (2005).
78. Park, J. H., Park, K. D. & Bae, Y. H. PDMS-based polyurethanes with MPEG grafts:
synthesis, characterization and platelet adhesion study. Biomaterials 20, 943–953
(1999).
79. Van Krevelen, D. W. & Te Nijenhuis, K. in Properties of Polymers (Fourth Edition)
(eds. by, D. W. V. K. & Nijenhuis, K. T.) 319–354 (Elsevier, 2009).
80. Fedors, R. F. A method for estimating both the solubility parameters and molar
volumes of liquids. Polym. Eng. Sci. 14, 147–154 (1974).
81. Mehta, A., Gaur, U. & Wunderlich, B. Equilibrium melting parameters of
poly(ethylene terephthalate). J. Polym. Sci. Polym. Phys. Ed. 16, 289–296 (1978).
82. Sekkar, V., Bhagawan, S. S., Prabhakaran, N., Rama Rao, M. & Ninan, K. N.
Polyurethanes based on hydroxyl terminated polybutadiene: modelling of network
parameters and correlation with mechanical properties. Polymer 41, 6773–6786
(2000).
83. Robertson, C. G., Lin, C. J., Rackaitis, M. & Roland, C. M. Influence of particle size
and polymer−filler coupling on viscoelastic glass transition of particle-reinforced
polymers. Macromolecules 41, 2727–2731 (2008).
84. Berriot, J., Montes, H., Lequeux, F., Long, D. & Sotta, P. Evidence for the shift of the
glass transition near the particles in silica-filled elastomers. Macromolecules 35,
9756–9762 (2002).

186
85. Tsagaropoulos, G. & Eisenburg, A. Direct observation of two glass transitions in
silica-filled polymers. Implications to the morphology of random ionomers.
Macromolecules 28, 396–398 (1995).
86. Tsagaropoulos, G. & Eisenberg, A. Dynamic mechanical study of the factors
affecting the two glass transition behavior of filled polymers. similarities and
differences with random ionomers. Macromolecules 28, 6067–6077 (1995).
87. Robertson, C. G. & Rackaitis, M. Further consideration of viscoelastic two glass
transition behavior of nanoparticle-filled polymers. Macromolecules 44, 1177–1181
(2011).
88. Clarson, S. J., Dodgson, K. & Semlyen, J. A. Studies of cyclic and linear
poly(dimethylsiloxanes): 19. Glass transition temperatures and crystallization
behaviour. Polymer 26, 930–934 (1985).
89. Zhang, D., Liu, Y., Shi, Y. & Huang, G. Effect of polyhedral oligomeric
silsesquioxane (POSS) on crystallization behaviors of POSS/polydimethylsiloxane
rubber nanocomposites. RSC Adv. 4, 6275 (2014).
90. Dollase, T., Spiess, H. W., Gottlieb, M. & Yerushalmi-Rozen, R. Crystallization of
PDMS: The effect of physical and chemical crosslinks. EPL Europhys. Lett. 60, 390
(2002).
91. Grassie, N. & Macfarlane, I. G. The thermal degradation of polysiloxanes—I.
Poly(dimethylsiloxane). Eur. Polym. J. 14, 875–884 (1978).
92. Grassie, N. & Zulfiqar, M. Thermal degradation of the polyurethane from 1,4-
butanediol and methylene bis(4-phenyl isocyanate). J. Polym. Sci. Polym. Chem. Ed.
16, 1563–1574 (1978).

187
93. Hwang, H.-D. & Kim, H.-J. Enhanced thermal and surface properties of waterborne
UV-curable polycarbonate-based polyurethane (meth)acrylate dispersion by
incorporation of polydimethylsiloxane. React. Funct. Polym. 71, 655–665 (2011).
94. Lue, S. J., Ou, J. S., Kuo, C. H., Chen, H. Y. & Yang, T.-H. Pervaporative separation
of azeotropic methanol/toluene mixtures in polyurethane–poly(dimethylsiloxane)
(PU–PDMS) blend membranes: Correlation with sorption and diffusion behaviors in
a binary solution system. J. Membr. Sci. 347, 108–115 (2010).
95. Patrício, P. S. O., de Sales, J. A., Silva, G. G., Windmöller, D. & Machado, J. C.
Effect of blend composition on microstructure, morphology, and gas permeability in
PU/PMMA blends. J. Membr. Sci. 271, 177–185 (2006).
96. Moroi, G. Preparation and characterization of polyesterurethane/copper
metallopolymers. React. Funct. Polym. 68, 268–283 (2008).
97. Kuan, H.-C. et al. Synthesis, thermal, mechanical and rheological properties of
multiwall carbon nanotube/waterborne polyurethane nanocomposite. Compos. Sci.
Technol. 65, 1703–1710 (2005).
98. Mrad, O. et al. A comparison of plasma and electron beam-sterilization of PU
catheters. Radiat. Phys. Chem. 79, 93–103 (2010).
99. Wang, F. Polydimethylsiloxane modification of segmented thermoplastic
polyurethanes and polyureas. (Thesis, Virginia Polytechnic Institute and State
University, 1998).
100. Esteves, A. C. C. et al. Influence of cross-linker concentration on the cross-linking of
PDMS and the network structures formed. Polymer 50, 3955–3966 (2009).

188
101. Bistričić, L., Baranović, G., Leskovac, M. & Bajsić, E. G. Hydrogen bonding and
mechanical properties of thin films of polyether-based polyurethane–silica
nanocomposites. Eur. Polym. J. 46, 1975–1987 (2010).
102. Tsonos, C., Apekis, L., Zois, C. & Tsonos, G. Microphase separation in ion-
containing polyurethanes studied by dielectric measurements. Acta Mater. 52, 1319–
1326 (2004).

189
CHAPTER 5 Electromechanical Response of Blends of PU and PDMS
Abstract
Chapter 4 described the blending of a thermoplastic polyurethane (PU) polymer with two
types of cross-linked polydimethylsiloxane (PDMS) elastomers. The characteristics of these
blend materials, such as their chemical structures and mechanical properties, were also
discussed in Chapter 4. In this chapter, electromechanical properties of the actuators prepared
from these blends are presented.
Results showed that the blending of a high-k PU into the PDMS dielectric elastomer Type I
increased the elastomer’s dielectric constant and decreased its dielectric breakdown strength.
This process also sharply reduced the elastomer’s elastic modulus, which contributed to its
large strain at low electric fields. The largest actuated strain found for the Type I elastomer
blends, 16%, was obtained at an electric field of 60 V/ µm with 30% actuator prestrain.
However, an increase in a material’s dielectric constant is a natural corollary to a decrease in
its dielectric strength, and this results in decreased actuation strain and energy density of the
actuator. This is believed to be due to such blend properties as phase incompatibilities in the
interphase morphologies. These incompatibilities in Type I blends resulted in low electrical
breakdown and decreased mechanical properties in the form of low actuation strength and
low electromechanical energy density.
We used another type of PDMS elastomer matrix, which we called Type II, to overcome the
interphase-related problems of dielectric strength and mechanical properties of blends. This
new blend of PU and Type II PDMS, with its increased actuation strain and energy density,

190
has great potential as a dielectric elastomer actuator material. In contrast to the Type I blends,
the Type II blends exhibited higher actuation strain due to their low Young’s modulus and
high electrical breakdown. The largest actuated strain found for the Type II elastomer blends,
27%, was obtained at an electric field of 90 V/µm with 30% actuator prestrain.
5.1 Introduction
Electroactive polymers (EAPs), one of the most promising groups of responsive materials
due to their high actuation performance, convert electrical energy to mechanical energy1–4.
EAPs can change shape or size in response to external electrical stimulation. In contrast to
other actuator materials, these polymers have mechanical and electrical properties that enable
easy processing and tunability5–8. While all electroactive polymers have these advantages, the
subset of dielectric elastomer materials and actuators are superior in cost, weight, shock
tolerance, ease of processing, scalability, and energy density.
Lightweight dielectric electroactive polymers (D-EAP) are one of the most promising kinds
of EAPs because of their particularly high actuation strain and ease of processing. These
properties may enable new performance improvements in bio-inspired robots9–12, prosthetic
devices4,13, adaptive structures14, fluid pumps15,16, refreshable braille actuators17,18, autofocus
lens positioners19,20, speakers21, shape and texture systems22,23, smart textiles13, and energy-
harvesting systems24–28.
In its simplest form, a D-EAP consists of a dielectric elastomer film placed between two
compliant electrodes to form a parallel plate capacitor, as shown in Figure 5.1(b). When an
electrical potential is applied to the electrodes, electrostatic attraction between the two

191
electrode surfaces causes deformation of the elastomer, which in turn creates a significant
change in the lateral plane of the dielectric elastomer film. In addition, the repulsion of like
charges on the individual electrodes leads to planar stretching of the film. The resulting
pressure in the thickness direction of the dielectric elastomer film—also known as the
Maxwell pressure—is calculated as follows:
PMaxwell = εε0 E2 = εε0 (v/z)2 Equation 5.1
where E is the electric field, ε0 is the permittivity of free space, εr is the relative dielectric
constant of the membrane, V is the voltage, and z is the elastomer membrane thickness. The
direction of the actuation strain is a function of the electrostatic pressure and the material’s
modulus in the thickness direction and is calculated as follows29:
sz = ‐
PMaxwellY = ‐
ε0εr(v/z)2
Y Equation 5.2
where sz is the thickness strain and Y is the Young’s modulus of the elastomer.
Much of the research investigating D-EAPs has been devoted to producing materials that can
convert electrical to mechanical energy efficiently (i.e., with minimal energy loss). The
fundamental properties of an actuator material are its relative dielectric constant (εr) and
Young’s modulus (Y) and the conductivity of the compliant electrodes. These properties can
be modified through polymer compositing that vary the amounts and kinds of fillers used and
thereby enable the desired interactions between composites.
In actuation of D-EAPs, both the dielectric constant and the electrical breakdown strength of
a material are of considerable importance. Increasing the electric field (E) by increasing the
material’s dielectric constant (εr) results in an increase in electrostatic pressure (PMaxwell).

192
Unfortunately, increasing the electric field is not desirable due to corresponding safety issues.
Therefore, the best approach to better actuator performance is to increase the dielectric
constant of the dielectric elastomer material. However, a material’s electrical breakdown
strength (Eb) is just as significant as its dielectric constant; the dielectric strength of a
composite determines ultimate actuation performance.
Applying initial prestrain is also an acceptable method for improving the electromechanical
performance of a D-EAP. While nominal prestrain is needed to evaluate D-EAP actuation
behavior, it also limits the material’s behavior by increasing hysteresis and thereby producing
a bulky actuator assembly.
Elastomer-based composites and blends have been effective in the development of high-
dielectric constant materials for actuator applications. Three principal materials exist that can
increase the dielectric constant of a polymer composite:
• High-dielectric constant ceramic fillers (e.g., TiO2)30–32
• Conductive fillers (e.g., carbonaceous particles)33–37
• Polymer blends and elastomer formulation38–40
The first two methods have disadvantages for D-EAP applications. High volumes of ceramic
filler lead to unacceptable degrees of stiffness and low breakdown of an elastomer’s electric
field32,41. Conductive fillers form conductive paths in the elastomer, resulting in high
dielectric loss and low dielectric strength. Using either type of filler causes early electrical
breakdown of the actuator material23,42.

193
D-EAP elastomers have produced commercially available materials in combination with the
above-mentioned fillers. Recently, dielectric elastomers have been formulated for dielectric
elastomer actuators to engineer an optimum material, one with a tunable dielectric constant
and tunable mechanical properties. These formulations have aided in the molecular-level
design of dielectric elastomers, taking into account the polymer-polar side groups for
dielectric enhancement as well as specific cross-linkers and fillers43,44.
Finally, the third method, polymer blending38–40, has also been used in the fabrication of D-
EAP. Polyurethane (PU) has been used as high-k filler in ground form45 as well as in situ
synthesized form in polydimethylsiloxane (PDMS) to improve the electromechanical
properties of the composites. PU has been demonstrated to increase the dielectric constant of
PDMS from 3 to 13, but these materials exhibited high dielectric loss45. Interpenetrating
polymer networks (IPNs) of acrylic elastomer and 1,6-hexanediol diacrylate were
(b) (a)
Figure 5.1 A circular actuator preparation from elastomers: (a) application of prestrain
to a DE, (b) operation principle for D-EAP actuators, (c) fractured cross-section
electron microscope image of a 5 wt% composition blend elastomer. PU fillers are 1-2
um in size and spherical in shape.
(c)
10μ

194
synthesized by Goulbourne et al.46 to demonstrate that prestrain of an actuator can be
preserved in the IPN structure. Recently, Krishna et al.6 reported the development of a PU
fiber-acrylic elastomer composite with high actuation stress and energy density.
In this research, a polymer/polymer blend with a high dielectric constant was formulated
without compromising dielectric loss or dielectric strength, thus demonstrating that the
electromechanical actuation response can be tailored to the application. This can be
accomplished by increasing the blend elastomer’s dielectric permittivity through simple
polymer blending to fabricate a reliable material. In our study, we used a simple mixture of
widely used D-EAP materials PDMS and PU.
In Chapter 4, we reported on the chemical and physical properties of PU and PDMS blends.
In this chapter, we describe the dielectric, mechanical, and electromechanical properties of
actuators prepared from these blends.
5.2 Theoretical Background
Maxwell pressure, coupling efficiency, and energy density are critical parameters for
evaluating actuator performance. We calculated these parameters from the dielectric
constants of the actuator materials and the actuation strains determined from the actuation
videos.
The actuation response of a D-EAP film is due to the Maxwell pressure (PMaxwell)
perpendicular to the film surface generated upon electrical stimulation47:
PMaxwell =1A
dUdz
Equation 5.3

195
Here, the PMaxwell is electrostatic pressure along the thickness direction, and z is the thickness
of the blend elastomer.
U =
Q2
2C=
Q2
εε0Axy
Equation 5.4
In Equation 5.4, U is the electrostatic potential of the capacitor, Q2 is the charge on the
plates, Axy is the lateral surface area undergoing compression, C is the capacitance of the D-
EAP actuator assembly (C = εrε0Axy/z), ε0 is the permittivity of free space, and εr is the
dielectric constant of the elastomer.
For materials with ideal elasticity, dU/dz is equal to the mechanical work that can be
performed by an actuator. The deformation of an elastomer during actuation is constant
volume deformation:
dV = zdAxy + Axydz = 0 Equation 5.5
Assuming the electrostatic energy completely transforms into Maxwell pressure,
PMaxwell =
Q2
εε0Axy
Equation 5.6
And the Maxwell pressure, as calculated as in Equation 5.6, can be simplified as follows:
PMaxwell = εε0 E2 Equation 5.7
Equation 5.7 is an abbreviated form of Equation 5.6 using E = Q/(ε0εAxy).

196
Based on assumptions and Equations 5.3 through 5.7, such actuator properties of elastomers
as Maxwell pressure, coupling efficiency, and energy density—key parameters for actuator
evaluation—were derived in literature29,47,48.
The coupling efficiency (K2) of an actuator is defined as the ratio of electrical energy
converted to mechanical work relative to the applied electrical energy. For elastomers
capable of isochoric deformation with negligible viscous losses, K2 is calculated as follows29:
K2 = ‐2sz‐sz2 Equation 5.8
where sz is elastomer thickness strain. The energy density (E) of an elastomer is calculated as
follows29:
E = Y[sz‐ln(1 + sz)] Equation 5.9
where Y is the compressive Young’s modulus and sz is, again, the thickness strain of the
elastomer.
The thickness direction strain (sz) is a factor of electrostatic pressure and modulus of actuator
(Pm = ‐Ysz) for small deformations (sz <20%). Since the deformation during the actuation is
linearly elastic, Hooke’s law of compression can be used to directly relate sz to the applied
electric field.
sz = ‐εε0
E2
Y
Equation 5.10
In Equation 5.10, Y depends on actuator prestrain and actuation strain; the deformation in the
thickness direction (sz) is calculated using the constant-volume equation after obtaining the

197
actuator areal deformation measurement. The in-plane strains and thickness of an ideal
elastomer are related to one another as follows:
(1 + sx)�1 + sy�(1 + sz) = 1 Equation 5.11
Additionally, if we assume that the actuation-induced deformation is isotropic and that sx =
sy = sxy, we can calculate the actuation strain from the lateral radial strain (as observed
during actuation) as follows:
sz = (1 + sxy)‐2‐1 Equation 5.12
Thus, we used the thickness-direction actuation strain (sz) to calculate the actuator
performance for blend elastomers.
The electromechanical sensitivity, β, gives information about general dependencies of
actuation strain under a specified electrical field. β was obtained by using Equation 5.1349 as
follows:
sz =
E2
‐εε0Y= βE2
Equation 5.13
5.3 Materials and Methods
Detailled information on these were preesnted in Chapter 4. Nevertheless, in order to put the
information presented in this chapter in context we mention a is a brief summary here.
5.3.1 Materials
We used two polymers for blend preparation: polyurethane (PU) and polydimethylsiloxane
(PDMS). As matrix materials, we used two types of PDMS, referred to as Type I and Type

198
II. We used commercially available PDMS Sylgard 186 with a hydro-silylation addition
reaction for the Type I elastomer due to its excellent electrical and mechanical properties. For
the Type II PDMS, we formulated hydride silane/silanol-based PDMS. For the PU we used
thermoplastic poly(ether-urethane) (Elastollan 1180A, BASF), which is available in
commercial pellet form and has a relatively high dielectric constant (ε = 7.8 at 100 Hz).
Tetrahydrofuran (Fisher Sciences, USA) was used as a blending solvent.
Sylgard 186, the Type I PDMS, is a two-part elastomer consisting of a hydride-functional
silicone polymer (part A) and a vinyl-terminated cross-linker (part B). A platinum complex
participates in the reaction, which forms ethylene bridges between polymer and cross-linker
through an additional polymerization reaction. Consequently, there was no byproduct in the
elastomer except H2 gas, which solubilizes in the polymer and so quickly outgasses to the
environment, leaving no observable bubbles. The rate of this reaction depends on applied
heat. Chapter 4, Section 2 described the reaction mechanism of this curing system.
The Type II elastomer used was an alkoxy condensation system consisting of a hydroxyl-
functional polymer (DMS S42, Gelest Co, PA) and an isocyanate-functional cross-linker.
Polymerization took place at room temperature atmospheric humidity. The alkoxy-functional
cross-linker underwent a hydrolysis step, which left a hydroxyl group. This hydroxyl group
then participated in a condensation reaction with another hydroxyl group attached to the
polymer.
The isocyanate mono-functional group in the cross-linker also served to increase the possible
chemical interaction of the PDMS polymers with the PU elastomers during network

199
formation—the cross-linker can establish links with both PU hydroxyl end groups and PDMS
hydroxyl end groups50. The isocyanate single-function group in the cross-linker is also
reactive with the PU elastomer side groups51–57, and this procedure results in a tetra-
functional network in which the siloxane backbones join the PU elastomers within the
interphase regions of blends. Additionally, the hydroxyl chain end groups of PDMS polymer
networks are thermodynamically more attractive to PU because of PU’s polar structure. This
behavior is expected to increase the miscibility of PDMS58.
Type II PDMS cures at room temperature. The formulation of Type II PDMS is as follows:
10 g PDMS fluid (DMS S42; Mw = 77,000 g/mol); 5 μl cross-linker (Gelest, PA); 45 μl tin
catalyst. This formulation was used for all Type II blend compositions.
For the matrix elastomers we formulated, we needed to increase the interphase compatibility
of the matrix and filler. To achieve this, we employed a condensation (i.e., alkoxy-cure)
reaction, which entailed linking hydroxyl-terminated siloxanes in the presence of a tin
catalyst and an isocyanate functional cross-linker (3-isocyanatopropyltriethoxy-silane)51–57,59.
5.3.2 Blend Preparation
The PDMS and PU polymers were dissolved separately in THF as a co-solvent. The PDMS
base part was mixed with the THF at room temperature for three hours, and the PU pellets
were dissolved in the THF for 12 hours at 50 °C. The PDMS mixture and the PU mixture
were combined and mixed using a magnetic stirrer. The cross-linker and catalyst of the
PDMS matrix were added to this final polymer mixture, which was then processed using a
high-shear mixer for 1 minute. (The magnetic stirring and high-shear mixing sequence were

200
used in order to prevent premature curing of the PDMS.) The mixture was then poured onto
Teflon substrates to form a film for mechanical and dielectric characterization. These blend
mixtures were also separately thinned down to a thickness of 100-200 μm using a spin-coater
for electromechanical characterization. The samples were dried in an oven at room
temperature for 12 hours to enable solvent evaporation and were cured at 80 °C for 12 hours
to facilitate network formation. The samples were then prepared for characterization. Figure
5.2 shows the experimental order of blending the PU and PDMS elastomers.
5.3.3 Dielectric Characterization
The dielectric behavior of the films was measured using an LCR meter (GW Instek LCR-
8101G) equipped with a parallel plate dielectric test fixture (Agilent 16451B). The LCR
meter was connected to a computer to perform the dielectric measurement over a frequency
range of 20 to 106 Hz at room temperature, which allowed us to measure sample impedance,
Figure 5.2 Scheme of blend elastomer preparation. Mixing of the PU/THF and
PDMS/THF mixtures and addition of the PDMS crosslinking agent to the mixture for film
formation.

201
capacitance, and resistance. The capacitance (C) and dielectric dissipation data for the
samples were collected, and the real (effective) dielectric constant (ε) was calculated from
the capacitance and thickness (t) of the sample using the following equation:
ε = Ct/A Equation 5.14
where A is electrode area. The real part of the relative dielectric constant was calculated from
capacitance values, and the dissipation factor was recorded from the the LCR meter.
5.3.4 Mechanical Characterization
Mechanical characterization of the composite elastomer films was performed using a uniaxial
tensile load frame (MTS-30G). The films were cut into 10 mm-by-50 mm rectangular strips.
The initial moduli of the blends were obtained from the initial region (5 percent strain) of
stress-strain data. The test rate was set to 5 mm/min, and gauge length was set to 25 mm.
5.3.5 Electromechanical Characterization
The electromechanical behavior of the blend samples was evaluated using a circular actuator
test. The actuators were prepared from these films as depicted in Figure 5.1(a).
The films were cut into 6 cm-diameter circles, which were then placed on the circular
fixtures under uniform pretension (30%) using equally spaced plastic grips with rubber tips.
These grips were assembled around the perimeter of a circular fixture with lock strip tapes
(3M). We created a circular active area at the center of each test specimen by applying
compliant silver paste electrodes (Chemtronics CircuitWorks, Kennesaw, GA) on both sides
of the specimen to form a D-EAP, as shown in Figure 5.1(b). The electrodes were connected

202
to a high-voltage power supply (Bertan 225-30R, Spellman High Voltage Electronics Corp.,
Hauppauge, NY) that was programmed through an automated-voltage trigger. The voltage
was increased by 500 V/s until the specimen underwent dielectric breakdown. As the voltage
increased, video of the electrode area (the active area) was recorded using a digital video
camera (DMK 23FM021, Imaging Source, NC). The resulting video was analyzed frame by
frame with ImageJ software (developed by the NIH) to determine the actuation strains at
given electrical potentials.
5.4 Results and Discussion
In Chapter 4, we discussed the properties of the elastomer blends along with their synthesis
and development from the incompatible polymer species PDMS and polyurethane. The PU
and PDMS were blended in the preparation of dielectric elastomer actuator materials. We
used DMA, DSC, FTIR, SEM, and dielectric spectroscopy to study the physical and
chemical characteristics of the polymer, as well as the interactions between the blend species,
for various compositions of PDMS-PU blends. The blends studied here displayed two glass
transition temperatures (Tgs), indicating micro-phase separation. The blends also exhibited
increased dielectric constants and improved mechanical properties as compared to pure
PDMS.
5.4.1 Mechanical Properties
We also tested the blend elastomers’ mechanical properties since they play a major role in
actuator performance assessment. Theoretically, the thickness strain of an actuator is sz, a
function of both the material’s dielectric constant and its compression modulus. An ideal

203
elastomer is incompressible and has a Poisson's ratio of 0.5, and so its electric field-induced
strains are small, with free boundary conditions.
One of the most important mechanical properties of a dielectric elastomer actuator is its
Young’s modulus. During the actuation of an elastomer, the Maxwell pressure generates an
in-plane extension, the magnitude of which depends on the elastomer’s mechanical
properties. The tensile behaviors (i.e., the stress-strain relationships) of the Type I and Type
II PDMS and PU films were plotted in Figure 5.3.
Figure 5.3 Mechanical properties of PU and PDMS samples: Stress-strain curve for
pristine PU and PDMS elastomers: The red dot (●) Type I PDMS elastomer; blue square
(■) Type II PDMS elastomer; and green plus (+) represents PU elastomer.
0
2
4
6
8
10
0 1 2 3 4 5 6
Stre
ss (M
Pa)
Tensile Strain (mm/mm)
PU
Type I PDMSType II PDMS

204
The initial modulus values were determined from the initial portion (0–5%) of the stress-
strain curve. The modulus values were 0.6 MPa for the Type I PDMS, 0.18 MPa for the Type
II PDMS, and 4.7 MPa for the PU.
The mechanical properties of the PU/PDMS blends were expected to improve as the PU
concentration increased due to PU’s high modulus. In this research, as plotted in Figure 5.4,
we observed a predicted increase in stiffness up to 10 wt% concentration of PU. In the Type I
blends, an increase in PU concentration did not significantly increase the blend’s mechanical
properties with respect to modulus and maximum stress. Moreover, these properties
Figure 5.4 Mechanical properties of blends. (a) Young’s modulus (filled symbols) of the
blend elastomer versus PU weight concentration. The open red circles (●) represent the
Type I blend elastomers’ tensile modulus; the filled blue squares (■) represent the Type II
blend elastomers’ tensile modulus. (b) Ultimate strain (open symbols) values for blend
elastomers. The open red circles (○) represent the Type I blend elastomers’ tensile strain;
the open blue squares (□) represent the Type II blend elastomers’ tensile strain.
(a) (b)

205
decreased for 10 wt% PU concentration. Furthermore, blends with a 40 wt% concentration of
PU became weaker and exhibited a lower modulus (0.4 MPa) than the PDMS elastomer.
These results, plotted in Figure 5.4(a), indicated an increase in Young’s modulus for Type I
blends circa 10 wt% PU concentration. For the PU concentrations above 10 wt%, the blends’
Type I mechanical properties; Young’s modulus and maximum strength decreased. The Type
II blends also showed a significant reduction in ultimate strain, from around 4.5 MPa to 2.3
MPa, with increasing PU weight concentration. Ultimate tensile stress decreased from 4.5
MPa to 0.9 MPa.
Type II PDMS exhibited a lower initial modulus and failure strain than Type I PDMS. The
mechanical properties of the Type II blends increased along with modulus and ultimate
tensile strain. Type II blends showed an increase from ca. 0.2 MPa to 0.6 MPa with
increasing PU weight concentration. Type II elastomer ultimate tensile strain also increased
from 3.3 to 4.5 with increasing PU weight concentration.
The results of these experiments, presented in Chapter 4, suggested no significant degree of
interphase mixing between PU and PDMS. Figure 5.4(a) and (b) plot Young’s modulus
versus PU concentration and ultimate tensile strain versus PU concentration, respectively.
The results make it clear that the mechanical strength and Young’s modulus of the Type I
blends decreased while the mechanical properties of the Type II blends increased with an
increase in PU wt% concentration. The results given in this chapter are concordant with the
results reported in Chapter 4, revealing that the Type I blends are immiscible and experience

206
lower interfacial adhesion. Type II blends also showed little to no phase mixing, and their
mechanical properties increased with the increase in PU content.
For Type I blends, the ultimate strain decreased with higher levels of PU content. This
decrease in both strength and modulus was a result of polymer phase separation and
interphase incompatibility between the polymer species. In Type I blends, the incompatibility
became more significant as the concentration of PU increased.
As shown in Figure 5.4, the Young’s moduli of the Type II PDMS and the Type II blends
were 0.18 MPa and 0.8 MPa, respectively, for 40 wt% concentration of PU. The tensile
properties of the Type II blends increased with the increasing PU concentration. The ultimate
strain of the Type II PDMS increased with increasing PU weight concentration, as shown in
Figure 5.4(b).
These increases in modulus and ultimate strain can be attributed to the phase properties of the
Type II blends and the interaction of the blend’s two species. However, there was no
evidence of phase mixing for Type I or Type II.

207
5.4.2 Electromechanical Properties
Figure 5.5(a) displays the actuation strains (sx) of the Type I blends as a function of actual
electrical field. The actuation strains of the blends were higher than that of the neat Type I
elastomer at all electrical fields. The control Type I PDMS (Sylgard 186, Dow Corning, NY)
exhibited outstanding dielectric strength (actual electrical field at actuator electrical
breakdown was circa 180 V/µm). This high dielectric strength eventually resulted in a higher
actuation strain of ~24%. However, the pure Type I PDMS did not exhibit a high actuation
strain at low electric fields.
Figure 5.5 The dependence of actuation strain on electric field or the the Type I blend
elastomers for various filler concentrations (wt%): (a) actuation strain versus electrical
field for films of Type I PDMS (▲), Type I blends of 2 wt% PU (□) , 10 wt% (△), 20
wt% (◇), 40 wt% PU compositions (◌). Type I PDMS (▲) reached to a maximum
actuation strain of ~25 at ~180 V/µm, which was excluded from the plot. Lines are guides
for eye. (b) Electromechanical breakdown field versus PU weight percentage for Type I
blends. All lines serve as guide for eye.
(a) (b)

208
The dielectric strengths for the Type I blends are plotted in Figure 5.5(b) as a function of
blend composition. The dielectric strengths of the blends of all concentrations were lower
than that of the Type I PDMS. The Type I blends with 2 weight percentage PU showed a
decrease in dielectric strength of almost 40% compared to the control sample. The dielectric
strength of these materials decreased to 100 V/µm with the incorporation of PU elastomer
filler. The decrease in electrical breakdown strength can be explained by the reduction in
mechanical modulus60.
The dielectric strength of the Type I blends with 40 wt% PU was less than 60% of that of the
Type I PDMS control sample. The dielectric strength of the blend elastomers decreased as
the weight concentration of the incorporated PU increased. The decreased dielectric strength
of the Type I blends limited the actuation performance of these actuators and resulted in a
lower actuation strain.
To facilitate comparison of the actuation response of various blend compositions, we plotted
the actuation strain as a function of PU content at an arbitrary electric field, 60 V/µm, as
shown in Figure 5.6(a). We compared this to a curve of dielectric constant versus
composition for the Type II blends and Type I PDMS (see Figure 5.6 (b)). The dielectric
constant increased with the increase in weight concentration; therefore, the actuation strain
improved for all blend elastomers as compared to the PDMS elastomer.

209
The improvement in actuation strain was a result not only of the increase in dielectric
constant but also of the decrease in Young’s modulus. The effect of elastomer modulus on
actuation response for the Type I blends with high PU composition ratios can be attributed
primarily to the blends’ decrease in stiffness (see Figure 5.4).
To understand the electromechanical properties of these elastomers, we compared the
effective dielectric constants of the elastomer blends at 100 Hz to the corresponding linear
actuation strains, sx, at an electric field of 60 V/µm. The relationship between dielectric
constant and actuation strain is explored in Figure 5.6. While actuation strain increased
Figure 5.6 Dielectric strength of the Type I blend elastomers and the Type I PDMS
elastomer. The dielectric breakdown electrical fields were plotted from electromechanical
actuation tests of the elastomers. The dashed lines serve to connect data points. (b)
Dielectric constant of blends versus PU weight concentration. Dashed lines represent (—)
series, (---) logarithmic, (-∙-) parallel, and (---) Maxwell Garnet theoritical prediction of
mixing for dielectric constant, in order from bottom to top.
(a) (b)
2.5
3
3.5
4
4.5
5
5.5
0 10 20 30 40
Die
lect
ric C
onst
ant (ε)
PU Concentration (wt %)
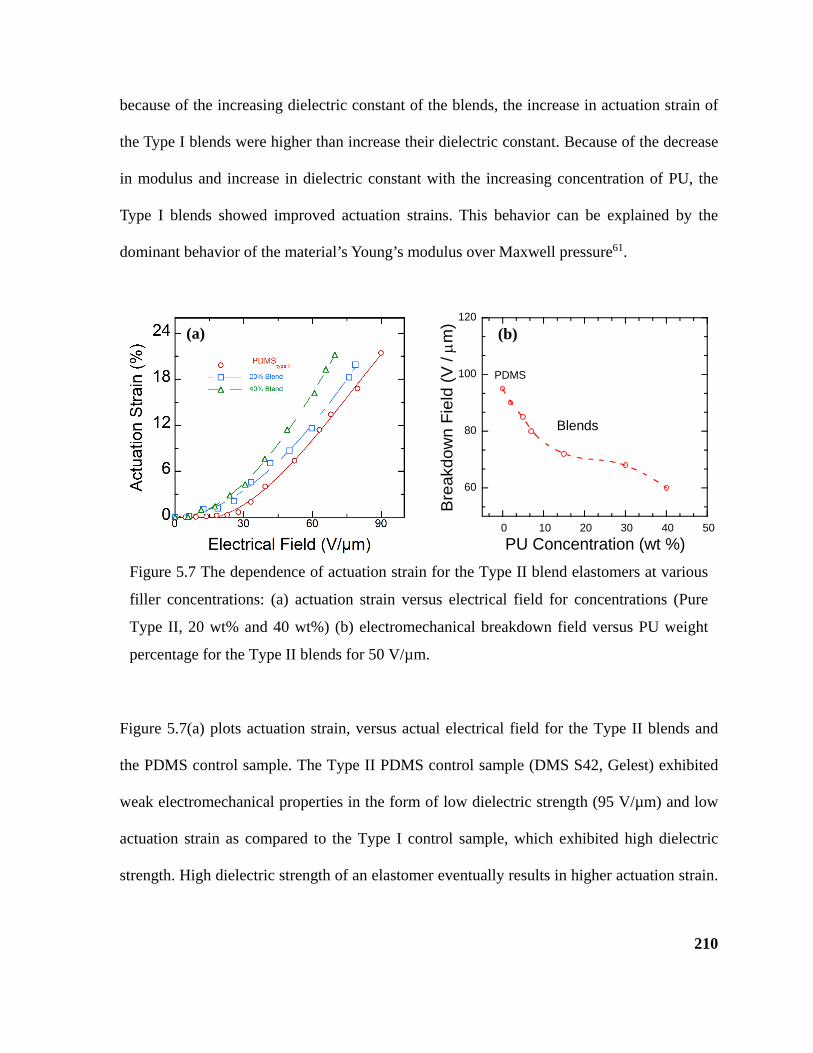
210
because of the increasing dielectric constant of the blends, the increase in actuation strain of
the Type I blends were higher than increase their dielectric constant. Because of the decrease
in modulus and increase in dielectric constant with the increasing concentration of PU, the
Type I blends showed improved actuation strains. This behavior can be explained by the
dominant behavior of the material’s Young’s modulus over Maxwell pressure61.
Figure 5.7(a) plots actuation strain, versus actual electrical field for the Type II blends and
the PDMS control sample. The Type II PDMS control sample (DMS S42, Gelest) exhibited
weak electromechanical properties in the form of low dielectric strength (95 V/µm) and low
actuation strain as compared to the Type I control sample, which exhibited high dielectric
strength. High dielectric strength of an elastomer eventually results in higher actuation strain.
Figure 5.7 The dependence of actuation strain for the Type II blend elastomers at various
filler concentrations: (a) actuation strain versus electrical field for concentrations (Pure
Type II, 20 wt% and 40 wt%) (b) electromechanical breakdown field versus PU weight
percentage for the Type II blends for 50 V/µm.
60
80
100
120
0 10 20 30 40 50
Bre
akdo
wn
Fiel
d (V
/ µm
)
PU Concentration (wt %)
PDMS
Blends
(a) (b)

211
For all blend concentrations, the dielectric strength was lower than that of PDMS. The
dielectric strength of the Type II blends also decreased as the PU weight concentration
increased. However, this dielectric strength decrease rate in Type II blends is lower than
Type I blends.
Compared to the pure PDMS, all PU/PDMS blends showed lower dielectric strength. Blends
with 2 wt% concentration of PU of Type I blends, breakdown strength decreased by around
50%. Therefore, the dielectric strength of these materials decreased with the incorporation of
more PU elastomer filler.
In conclusion, the incorporation of the PU elastomer was beneficial to the Type II blends: the
electrical breakdown fields of these blends were higher than those of the Type I blends. The
Figure 5.8 Actuation strain versus electrical field for (a) Type I and (b) Type II blends.
(a)Type I PDMS (▲), (□) Type I blends of 2 wt% PU , (△) 10 wt%, (◇) 20 wt%, (◌) 40
wt% PU concentrations. (b) Pure Type II PDMS, 20 wt% and 40 wt% PU concentrations.
(b) (a)

212
dielectric strength data for the Type I blends and the Type II blends are compared in Figure
5.9 By way of comparison at 60 V/µm electrical field, actuation strain as a function of weight
percentage of PU content is shown in Figure 5.11(a) and (b).
Similar to what was observed with Type I blends, mechanical properties has effect on
actuation performance of Type II blends. The high PU concentration Type II blends
displayed an increase in actuation strain attributable to an increase in dielectric strength and a
decrease in stiffness of the polymer blends.
(a) (b)
Figure 5.9 (a) Dielectric strength of the blends and the PDMS elastomer. The dielectric
breakdown electrical fields were plotted from the ultimate electromechanical actuations
of the elastomers. Red open dots (○) represent the Type I blends’ tensile strains; blue
open squares (□) represent the Type II blends’ tensile strains. (b) Young’s modulusof the
blends elastomer versus PU weight concentration. Red filled dots (●) represent the Type I
blends’ tensile modulus; blue filled squares (■) represent the Type II blends’ tensile
modulus.

213
In Figure 5.10, we analyze the electromechanical properties of these elastomers by
comparing the effective permittivity of composites at 100 Hz to the linear actuation strain, sx,
at a 60 V/µm voltage. The dielectric constant increased with the increase in weight
concentration; therefore, actuation strain improved for all blend elastomers relative to the
PDMS elastomer.
The relationship between relative permittivity and actuation strain is shown in Figure 5.10.
We compared the effective dielectric constants of the elastomer blends at 100 Hz with the
Figure 5.10 Dielectric strength of the blend elastomers and the PDMS elastomer: (a)
dielectric constant versus PU weight percentage in the Type I blends (Dashed lines
represent (—) series, (---) logarithmic, (-∙-) parallel, and (---) Maxwell Garnet theoritical
prediction of mixing for dielectric constant, in order from bottom to top. Data connected
with dots serve guide to eye.) and b) actuation strain at 60 V/µm as a function of PU
weight concentration. Breakdown electrical fields were plotted based on
electromechanical actuation tests of elastomers. The solid and dashed lines serve to
connect the data.
(b) (a)
2.5
3
3.5
4
4.5
5
5.5
0 10 20 30 40
Die
lect
ric C
onst
ant (ε)
PU Concentration (wt %)

214
corresponding linear actuation strains, sx, at 60 V/µm to understand these elastomers’
electromechanical properties. The increase in the blends’ dielectric constant also resulted in
increased actuation strain, as can be seen in Figure 5.10(b), the actuation responses of the
Type II blends increased from circa 9.5% to 14%.
In summary, it was found that polarization response and energy density were enhanced in
Type I and Type II blends containing PU (5 and 40 weight %). This enhancement is related to
the interface effect between the two polymers that comprised the blends. Their breakdown
field also decreased by about 90 V/µm, nearly 50%, due to the decrease in elastic modulus
brought about by blend interphase properties. The Type II blends showed a decrease in
electrical breakdown compared to the Type I blends. These results are summarized in Figure
5.9(b).

215
5.4.3 Actuator Performance
0
0.01
0.02
0.03
0.04
0.05
-10 0 10 20 30 40
Type I Blends
Type II Blends
Ene
rgy
Den
sity
(MJ/
m3 )
PU Concentration (wt %)
Figure 5.11 The actuator performance of blends: (a) electromechanical coupling
efficiency (K2), (b) compressive (Maxwell) stress, (c) electromechanical energy density
given by −PMaxwell(1+sz)/2 on a unit volume basis, and (d) elastic energy density (EL)
displayed in terms of PU weight concentration. In all cases, the magnitude of the electric
field is 60 V/µm. The solid and dashed lines are linear fits to the data; these serve as
guides for the eye.
10
20
30
40
50
60
-10 0 10 20 30 40
Type I Blends
Type II Blends
Cou
plin
g ef
ficie
ncy,
K2
(%)
PU Concentration (wt %)
0.08
0.12
0.16
0.2
0.24
0 8 16 24 32 40
Type I Blends
Type II Blends
Com
pres
sive
Stre
ss (M
Pa)
PU Concentration (wt %)
(b)
(c) (d)
(a)
0
0.01
0.02
0.03
0.04
0.05
0 8 16 24 32 40
Type I Blends
Type II BlendsE L (M
J/m
3 )
PU Concentration (wt %)

216
An important metric of D-EAP actuators is electromechanical coupling efficiency (K2),
related to energy conversion efficiency. This measure is plotted as a function of PU weight
concentration (wt%) in Figure 5.11(a) for pure Type I and Type II PDMS/PU blends at 60
V/µm. The pure PDMS sample exhibited a K2 of 15.82%. The K2 for the Type I blends
increased at a high rate, to 37.12% at 10 wt% concentration. At 40 wt%, K2 for the Type I
blends was 44.96%. The K2 for the Type II pure PDMS was 41.62%, and the K2 for the Type
II blends showed no significant change from this value, and dropped 10 wt%, before
beginning to rise a low rate at 20 wt%. From this value of K2, 46.78%, it rose slightly to
54.86 at 40 wt%.
Compressive stress, plotted in Figure 5.11(b), displayed a similar pattern as the
electromechanical coupling efficiency for both the Type I and Type II elastomers. The pure
PDMS exhibited a compressive stress of 0.121 MPa. Like K2, it rose steeply to 0.184 at 10
wt% and then began to level off to reach 0.221 MPa at 40 wt%. Unlike Type II’s K2,
however, Type II’s compressive stress follows a similar pattern to Type I’s compressive
stress. Type II pure PDMS exhibited a measure of 0.1084 MPa. From this level, it rose
steeply to 0.170858 at 10 wt% and then continued to increase as a function of wt% but at a
decreasing rate to end at 0.209453 at 40 wt%.
The energy densities of the blends are reported in Figure 5.11(c). The pure Type I PDMS
exhibited an energy density of 0.00523 MJ/m3; this increased to 0.010937 MJ/m3 in the 5
wt% PU blend. Not until the incorporated PU was at 20 wt% did the energy density increase
sharply from 0.021 MJ/m3 at 10 wt% to 0.027 MJ/m3 before ending at 0.330 MJ/m3 at 40

217
wt%. The pure Type II PDMS exhibited an energy density of 0.014 MJ/m3. Type II’s energy
density exhibited sharp increases at 10 wt% (0.019 MJ/m3) and 40 wt% (0.041 MJ/m3) and
exhibited much lower rates of increase between these two concentration levels.
Finally, we analyzed the elastic energy density (EL) of the blends. The pure Type I PDMS
exhibited an EL of 0.003045 MJ/m3. With the incorporation of PU, EL increased at a high rate
until it reached 0.0188 MJ/m3 at 10 wt% PU, at which point it leveled off. It continued to
increase but at a much lower rate; finally, at 40 wt%, EL was 0.024 MJ/m3, up from 0.024033
MJ/m3 at 20 wt%. The pure Type II PDMS exhibited an EL of 0.007 MJ/m3. At 2 wt%, this
value increased by almost 100% by 0.013MJ/m3, leveled off at 10 wt%, and then increased at
a to 0.047 MJ/m3 at 40 wt%.
Electromechanical sensitivity, β, was calculated using Equation 5.13. The Type I and Type II
blends were compared to their corresponding Type I and Type II PMDS control samples
using the following formula:
βr = βBlend / βPDMS Equation 5.15
where βr is the ratio of electromechanical sensitivity of a blend to that of the pure PDMS
material (Type I, 0.003; Type II, 0.008), a relative electromechanical sensitivity of the blends.
The Type I blends showed dramatic increase in relative sensitivities. The 5 wt%, 7 wt%, 10
wt%, and 40 wt% blends were 3.0, 4.5, 6.0, and 7.9 times the βPDMS, respectively. Type II’s
relative differences were not as dramatic but were nonetheless significant. The 5 wt%, 7

218
wt%, 10 wt%, and 40 wt% blends were 1.8, 1.4, 3.0, 4.5, and 6.0 times that of the pure
PDMS’s βPDMS, respectively.
In sum, the dielectric constant is as important as the initial Young’s modulus of an actuator
material in terms of effect on a dielectric elastomer’s actuator performance. In a similar
experiment by Zhao et al.62, plasticized PDMS/TiO2 composite, the actuation response of
high concentration PU-PDMS blends was attributed to both a decrease in polymer stiffness
and an increase in dielectric constant.
In our experiments, the increased breakdown strength was due to the decrease in Young’s
modulus and the decrease in matrix filler interactions.
5.5 Conclusions
In this chapter, the electromechanical properties of the PU/PDMS blend elastomers were
reported. When the high-permittivity PU polymer was blended with the PDMS, the enhanced
dielectric constant improved actuation strain. Polymer blend elastomer showed an icreased
dielectric constant. However, the dielectric strength of the blend elastomers was low due to
an incompatible blend formation.
These problems were studied through a different formulation of elastomer matrix. The
electromechanical properties of this second type of elastomer were also evaluated. Although
direct comparison of Type I and Type II was not entirely possible, we concluded that the
Type II elastomer formulation showed higher actuation strain and coupling efficiency due to
increased dielectric strength.

219
In conclusion, the electromechanical properties discussed thus far establish that the
PU/PDMS films are a better alternative than pure PDMS elastomers for D-EAP applications.
The method presented demonstrate that actuation strain of D-EAP actuators can be greatly
and conveniently enhanced through blending of a polymer that increases dielectric constant.
PU/PDMS composites exhibited higher actuation strain, energy density, and coupling
efficiency at relatively low electric fields when compared to control PDMS samples.
Therefore, PU/PDMS composites are suitable for low-electric field, energy-efficient
actuation, including use in micro-robotic systems, biomedical devices (e.g., active braille and
steerable catheters), and smart prosthetics.
5.6 References
1. Bar-Cohen, Y. Electroactive polymer (EAP) actuators as artificial muscles. (SPIE
Press, 2004).
2. Brochu, P. & Pei, Q. Advances in dielectric elastomers for actuators and artificial
muscles. Macromol. Rapid Commun. 31, 10–36 (2010).
3. O’Halloran, A., O’Malley, F. & McHugh, P. A review on dielectric elastomer
actuators, technology, applications, and challenges. J. Appl. Phys. 104, 071101–10
(2008).
4. Biddiss, E. & Chau, T. Dielectric elastomers as actuators for upper limb prosthetics:
Challenges and opportunities. Med. Eng. Phys. 30, 403–418 (2008).
5. Shankar, R., Ghosh, T. K. & Spontak, R. J. Electroactive nanostructured polymers as
tunable actuators. Adv. Mater. 19, 2218–2223 (2007).

220
6. Subramani, K. B., Cakmak, E., Spontak, R. J. & Ghosh, T. K. Enhanced electroactive
response of unidirectional elastomeric composites with high-dielectric-constant
fibers. Adv. Mater. 26, 2949–2953 (2014).
7. Shankar, R., Krishnan, A. K., Ghosh, T. K. & Spontak, R. J. Triblock copolymer
organogels as high-performance dielectric elastomers. Macromolecules 41, 6100–
6109 (2008).
8. Vargantwar, P. H., Shankar, R., Krishnan, A. S., Ghosh, T. K. & Spontak, R. J.
Exceptional versatility of solvated block copolymer/ionomer networks as
electroactive polymers. Soft Matter 7, 1651 (2011).
9. Anderson, I. A., Ieropoulos, I. A., McKay, T., O’Brien, B. & Melhuish, C. Power for
robotic artificial muscles. Mechatron. IEEE/ASME Trans. On 16, 107–111 (2011).
10. Hyouk Ryeol Choi et al. Biomimetic soft actuator: design, modeling, control, and
applications. IEEE/ASME Trans. Mechatron. 10, 581– 593 (2005).
11. Goethals, P. & Leuven, K. U. Tactile feedback for robot assisted minimally invasive
surgery: an overview. Dep. Mech. Eng. KU Leuven Tech Rep (2008).
12. Taya, M. Bio-inspired design of intelligent materials. in Proceedings of SPIE 5051,
54–65 (2003).
13. Carpi, F. & De Rossi, D. Electroactive polymer-based devices for e-textiles in
biomedicine. Inf. Technol. Biomed. IEEE Trans. On 9, 295–318 (2005).
14. Prahlad, H. et al. Programmable surface deformation: thickness-mode electroactive
polymer actuators and their applications. in Electroactive Polymer Actuators and
Devices (ed. Bar-Cohen, Y.) 5759, 102–113 (SPIE Proceedings, 2005).

221
15. Arthur, G. G., McKeon, B. J., Dearing, S. S., Morrison, J. F. & Cui, Z. Manufacture
of Micro-sensors and Actuators for Flow Control. Microelectron Eng 83, 1205–1208
(2006).
16. Carpi, F., Menon, C. & De Rossi, D. Electroactive elastomeric actuator for all-
polymer linear peristaltic pumps. IEEE/ASME Trans. Mechatron. 15, 460–470
(2010).
17. Chakraborti, P. et al. A compact dielectric elastomer tubular actuator for refreshable
Braille displays. Sens. Actuators Phys. 179, 151–157 (2012).
18. Mazzone, A., Zhang, R. & Kunz, A. Novel Actuators for Haptic Displays Based on
Electroactive Polymers. in Proceedings of the ACM Symposium on Virtual Reality
Software and Technology 196–204 (ACM, 2003). doi:10.1145/1008653.1008688
19. Choi, S. T., Lee, J. Y., Kwon, J. O., Lee, S. & Kim, W. Varifocal liquid-filled
microlens operated by an electroactive polymer actuator. Opt. Lett. 36, 1920–1922
(2011).
20. Tang, H. Smart lens made of dielectric elastomer: simulation study. Bull. Am. Phys.
Soc. 56, (2011).
21. Heydt, R., Kornbluh, R., Eckerle, J. & Pelrine, R. Sound radiation properties of
dielectric elastomer electroactive polymer loudspeakers. in 6168, 61681M–61681M–
8 (2006).
22. Ouyang, G., Wang, K., Henriksen, L., Akram, M. N. & Chen, X. Y. A novel tunable
grating fabricated with viscoelastic polymer (PDMS) and conductive polymer
(PEDOT). Sens. Actuators Phys. 158, 313–319 (2010).

222
23. Ouyang, G. M., Wang, K. Y. & Chen, X. Y. Enhanced electro-mechanical
performance of TiO2 nano-particle modified polydimethylsiloxane (PDMS) as
electroactive polymers. in Solid-State Sensors, Actuators and Microsystems
Conference 614–617 (2011).
24. Davies, D. K. Charge generation on dielectric surfaces. J. Phys. Appl. Phys. 2, 1533–
1537 (1969).
25. Lo, H. C., Mckay, T., O’Brien, B. M., Calius, E. & Anderson, I. Circuit design
considerations for regulating energy generated by dielectric elastomer generators. in
79760C–79760C–8 (2011). doi:10.1117/12.880723
26. Koh, S. J. ., Keplinger, C., Li, T., Bauer, S. & Suo, Z. Dielectric elastomer generators:
how much energy can be converted? Mechatron. IEEE/ASME Trans. On 16, 33–41
(2011).
27. Jean-Mistral, C., Basrour, S. & Chaillout, J.-J. Dielectric polymer: scavenging energy
from human motion. in Electroactive Polymer Actuators and Devices (EAPAD) 2008,
10 March 2008 6927, 692716–1 (SPIE - The International Society for Optical
Engineering, 2008).
28. Kang, G., Kim, K.-S. & Kim, S. Note: Analysis of the efficiency of a dielectric
elastomer generator for energy harvesting. Rev. Sci. Instrum. 82, 046101 (2011).
29. Dielectric Elastomers as Electromechanical Transducers: Fundamentals, Materials,
Devices, Models and Applications of an Emerging Electroactive Polymer
Technology. (Elsevier Science, 2008).
30. Xu, J., Bhattacharya, S., Pramanik, P. & Wong, C. P. High dielectric constant
polymer-ceramic (Epoxy varnish-barium titanate) nanocomposites at moderate filler
loadings for embedded capacitors. J. Electron. Mater. 35, 2009–2015 (2006).

223
31. Meng-Meng, L. et al. Dielectric properties of electrospun titanium
compound/polymer composite nanofibres. Chin. Phys. B 19, 028102 (2010).
32. Li Li et al. Novel polymer-ceramic nanocomposite based on new concepts for
embedded capacitor application (I). Compon. Packag. Technol. IEEE Trans. On 28,
754–759 (2005).
33. Saha, S. K., DaSilva, M., Hang, Q., Sands, T. & Janes, D. B. A nanocapacitor with
giant dielectric permittivity. Nanotechnology 17, 2284–2288 (2006).
34. Gangopadhyay, R. & De, A. Conducting Polymer Nanocomposites: A Brief
Overview. Chem. Mater. 12, 608–622 (2000).
35. Ferroelectric polymer/silver nanocomposites with high dielectric constant and high
thermal conductivity. Appl. Phys. Lett. 95, 242901–242901–3 (2009).
36. Xu, J. & Wong, C. P. Effect of the polymer matrices on the dielectric behavior of a
percolative high-k polymer composite for embedded capacitor applications. J.
Electron. Mater. 35, 1087–1094 (2006).
37. Yadav, S. K., Mahapatra, S. S., Cho, J. W., Park, H. C. & Lee, J. Y. Enhanced
mechanical and dielectric properties of poly(vinylidene fluoride)/polyurethane/multi-
walled carbon nanotube nanocomposites. Fibers Polym. 10, 756–760 (2010).
38. Carpi, F., Gallone, G., Galantini, F. & De Rossi, D. Silicone-poly(hexylthiophene)
blends as elastomers with enhanced electromechanical transduction properties. Adv.
Funct. Mater. 18, 235–241 (2008).
39. Carpi, F., Gallone, G., Galantini, F. & De Rossi, D. Enhancement of the
electromechanical transduction properties of a silicone elastomer by blending with a
conjugated polymer. in SPIE Proceedings (ed. Bar-Cohen, Y.) 6927, 692707–
692707–11 (2008).

224
40. Chwang, C.-P., Liu, C.-D., Huang, S.-W., Chao, D.-Y. & Lee, S.-N. Synthesis and
characterization of high dielectric constant polyaniline/polyurethane blends. Synth.
Met. 142, 275–281 (2004).
41. Carpi, F. & Rossi, D. D. Improvement of electromechanical actuating performances
of a silicone dielectric elastomer by dispersion of titanium dioxide powder. IEEE
Trans. Dielectr. Electr. Insul. 12, 835–843 (2005).
42. Anquetil, P. A. et al. Thiophene-based conducting polymer molecular actuators. in
Proc. SPIE 4695, 424–434 (2002).
43. Madsen, F. B., Dimitrov, I., Daugaard, A. E., Hvilsted, S. & Skov, A. L. Novel cross-
linkers for PDMS networks for controlled and well distributed grafting of
functionalities by click chemistry. Polym. Chem. 4, 1700 (2013).
44. Ma, W., Wu, L., Zhang, D. & Wang, S. Preparation and properties of 3-
aminopropyltriethoxysilane functionalized graphene/polyurethane nanocomposite
coatings. Colloid Polym. Sci. 291, 2765–2773 (2013).
45. Gallone, G., Galantini, F. & Carpi, F. Perspectives for new dielectric elastomers with
improved electromechanical actuation performance: composites versus blends.
Polym. Int. 59, 400–406 (2010).
46. Goulbourne, N. C. A constitutive model of polyacrylate interpenetrating polymer
networks for dielectric elastomers. Int. J. Solids Struct. 48, 1085–1091 (2011).
47. Pelrine, R. et al. High-field deformation of elastomeric dielectrics for actuators.
Mater. Sci. Eng. C 11, 89–100 (2000).
48. Pelrine, R., Kornbluh, R., Pei, Q. & Joseph, J. High-speed electrically actuated
elastomers with strain greater than 100%. Science 287, 836–839 (2000).
225
49. Pelrine, R. E., Kornbluh, R. D. & Joseph, J. P. Electrostriction of polymer dielectrics
with compliant electrodes as a means of actuation. Sens. Actuators Phys. 64, 77–85
(1998).
50. Hassanajili, S., Khademi, M. & Keshavarz, P. Influence of various types of silica
nanoparticles on permeation properties of polyurethane/silica mixed matrix
membranes. J. Membr. Sci. 453, 369–383 (2014).
51. Bai, H.-C., Tao, L., Pang, Y.-J., Zhou, Y.-J. & Chen, J. Synthesis and characterization
of hydroxypropyl terminated polydimethylsiloxane-polyurethane copolymers. J.
Appl. Polym. Sci. 129, 2152–2160 (2013).
52. Joki-Korpela, F. & Pakkanen, T. T. Incorporation of polydimethylsiloxane into
polyurethanes and characterization of copolymers. Eur. Polym. J. 47, 1694–1708
(2011).
53. Tsige, M. et al. Interactions and structure of poly(dimethylsiloxane) at silicon dioxide
surfaces: Electronic structure and molecular dynamics studies. J. Chem. Phys. 118,
5132 (2003).
54. Karabela, M. M. & Sideridou, I. D. Effect of the structure of silane coupling agent on
sorption characteristics of solvents by dental resin-nanocomposites. Dent. Mater. 24,
1631–1639 (2008).
55. Seeni Meera, K. M., Murali Sankar, R., Jaisankar, S. N. & Mandal, A. B.
Physicochemical studies on polyurethane/siloxane cross-linked films for hydrophobic
surfaces by the sol–gel process. J. Phys. Chem. B 117, 2682–2694 (2013).
56. Park, S., Kim, J. S., Chang, Y., Lee, S. C. & Kim, C. A covalently interconnected
phosphazene–silicate network: synthesis and surface functionalization. J. Inorg.
Organomet. Polym. 8, 205–214 (1998).

226
57. Tingaut, P., Weigenand, O., Militz, H., Jéso, B. D. & Sèbe, G. Functionalisation of
wood by reaction with 3-isocyanatopropyltriethoxysilane: Grafting and hydrolysis of
the triethoxysilane end groups. Holzforschung 59, 397–404 (2005).
58. Lee, M. H., Fleischer, C. A., Morales, A. R., Koberstein, J. T. & Koningsveld, R. The
effect of end groups on thermodynamics of immiscible polymer blends. 2. Cloud
point curves. Polymer 42, 9163–9172 (2001).
59. Rezaei, S. M. & Mohd Ishak, Z. A. The biocompatibility and hydrophilicity
evaluation of collagen grafted poly(dimethylsiloxane) and poly (2-
hydroxyethylmethacrylate) blends. Polym. Test. 30, 69–75 (2011).
60. Kollosche, M. & Kofod, G. Electrical failure in blends of chemically identical, soft
thermoplastic elastomers with different elastic stiffness. Appl. Phys. Lett. 96, 071904
(2010).
61. Ouyang, G., Wang, K. & Chen, X. Y. TiO2 nanoparticles modified
polydimethylsiloxane with fast response time and increased dielectric constant. J.
Micromechanics Microengineering 22, 074002 (2012).
62. Zhao, H., Wang, D.-R., Zha, J.-W., Zhao, J. & Dang, Z.-M. Increased electroaction
through a molecular flexibility tuning process in TiO2–polydimethylsilicone
nanocomposites. J. Mater. Chem. A 1, 3140 (2013).

227
CHAPTER 6 Electromechanical Response of PU-PDMS Composite Films
Abstract
Chapters 4 and 5 discussed the process of blending a thermoplastic polyurethane (PU)
polymer with two types of cross-linked polydimethylsiloxane (PDMS) elastomers as well as
the electromechanical properties of the blends. In this chapter, we will describe the fabrication
of a solution-cast PDMS film reinforced with electrospun PU nanofibers. As reported in previous
chapters, microscopic analysis showed uniform distribution of PU fibers throughout the PDMS
matrix without any dominant voids and with good filler-matrix interface. Moreover, the fiber
nanocomposites exhibited a significant increase in dielectric constant with increasing
concentration of PU fiber filler.
The maximum linear actuation strain for these composites was 26%, with 1.25 wt% filler
concentration. Additionally, the coupling efficiency was improved 45% for PDMS for 3.75
wt% PU fiber filler concentration at a 50 V/µm electric field.
6.1 Introduction
Electroactive polymers (EAPs) change their shape in response to electric stimulation1–8.
Moreover, EAPs are easy to process and lightweight, so they are considered excellent
material for such specialized applications as muscle-like actuators, biomimetic grippers, and
steerable catheters1–8. They have also been used in optical lenses, loudspeakers, haptic
displays, vibration damping systems, and pumps1,2,5–11.
An important class of EAPs, dielectric electroactive polymer (D-EAP), are superior to rigid
and striction-limited shape memory alloys, electroactive ceramics, and other electroactive

228
polymers because of their higher actuation strain and response speed and lower power
density and power usage and also they are especially resilient to damage.
The actuation mechanism of a dielectric elastomer depends mainly on the electrostatic
compression pressure (PMaxwell) between the compliant electrodes placed in parallel along the
elastomer’s thickness direction (z), as demonstrated in Figure 6.1(a). An elastomer film is
stretched and compressed by a voltage applied across these electrodes. The increasing charge
density increases the compression among negative charges in the two sides of the elastomer
as like charges on the elastomer surface move further from each other. These charges
generate the compression forces that are transferred to the elastomer in the lateral direction.
Thus, the lateral direction actuation is a result of electrical input, and this actuation requires
an elastomer film exhibiting a low modulus and high dielectric constant.
The utility of dielectric elastomer (DE) materials in most practical applications is limited by
the need to apply unacceptably high electric fields in order to obtain the desired actuation
performance. The most desirable route to overcome this limitation is to improve the dielectric
properties of the DE materials so as to increase the necessary stress/strain levels.
Incorporating high-permittivity materials into elastomers to form blends or composites has
been the most promising and facile route to improving the dielectric constant of potential DE
materials. The dielectric responses of elastomer composites containing ceramic or metal
particles and organic fillers have been investigated extensively.
229
In general, polymer-polymer systems are preferable to ceramic composites for D-EAP
applications because their constituents are likely to be more compatible. However,
miscibility and compatibility issues between two polymer species as well as the problems
inherent in formulating good elastomers are drawbacks to this approach.
The advantages PDMS include a broad usable temperature range; low chemical reactivity;
resistance to oxygen, ozone, and solar radiation; and good electric insulation12. However, it
has the disadvantages of a low dielectric constant and low fracture resistance.
All-organic polymer composites have been produced using several methods. Electrospinning
is one method used to construct three-dimensional surfaces through drawing of polymeric
solutions under high electric fields. Electrospun nanofibers have been investigated for use in
nanoscale devices13,14 because of their small uniform dimensions.
Electrospun fiber composites have also been produced for use in dielectric applications. In
general, the dielectric constants of electrospun fibers are very low because of their highly
porous structure. Dielectric constants of 1.5 to 2 have been reported for nanofiber mats with
80% porosity. Polymers exhibiting a high dielectric constant produce a fiber mat with a high
dielectric constant. A PVDF polymer with e = 6.8 was shown to have a minimum dielectric
constant of 2.04 because of its porous structure of 79%15.
An increase in fiber diameter increases the density of the electrospun fiber mat and therefore
its dielectric constant15. Removing air from the composite has also been shown to prevent a
decrease in the dielectric constant. (This was accomplished through filling voids with another
polymer or sintering the fiber mat and pelleting it under high pressures16.) Appropriate

230
wetting and infusion of the fiber web is extremely important because inclusion of air in the
polymer composite decreases its dielectric constant and degrades its mechanical properties.
Composites of carbon nanotube-polymer produced through electrospinning have reported to
exhibited a dielectric constant of approximately 6017,18. The advantage of electrospinning for
these composites having low dielectric loss with circa 0.05 even 25 vol% carbon nanotube
loadings.
Investigation of spinability of fillers such as carbon nanotubes, ceramics and metals for
electrospun fibers were investigated widely for various applications19,20. For dielectric
explorations, Khan et al. encapsulated carbon nanotubes and NiZn ferrite to
polyvinylpyrrolidone (PVP) and polyacrylonitrile fiber mats. Dielectric measurements show
significant an increase up to 8 from 3 for both composite fiber mats depending on filler
concentrations21,22. A rotational direction polarization and space charge polarization are
responsible for high dielectric constants up to 32 for polar polymer matrices23. The
carbonblack encapsulation experiment on electrospun mats show a decrease in single
electrospun fiber conductivity because of different charge transfer mechanisms of filler and
polymers24. The control of conductivity and dielectric loss is also suggested using ceramic
fillers25.

231
In this work, we incorporated electrospun fibers into an elastomeric matrix to enhance the
elastomer’s dielectric behavior. The resulting electrospun fiber composites showed improved
dielectric and electromechanical behavior as compared to the neat elastomer.
6.2 Materials and Methods
In this work, PDMS elastomer was used as the polymer matrix, and PU electrospun fiber web
was used as the filler.
6.2.1 Materials
6.2.1.1 Polyurethane Nanofibers
The polyurethane (PU) was commercial product Deerfield PT6110. PU film was cut into
small pieces and dissolved in a DMF/Chloroform (volume 50/50) solvent mixture for 6
hours. This polymer mixture was then transferred to an electrospinning syringe whose silver-
coated needle was connected to a high-voltage power supply (Gamma, Model ES30N, FL).
Then, an aluminum foil plate (for the collection of the resulting electrospun fiber) was
grounded. A syringe infusion (Gennie Scientific, Model 100, CT) controlled the polymer
(b)
Figure 6.1 (a) A dielectric elastomer actuator and its actuation mechanism ; (b) DE
circular actuator configuration.
1μm
(a)

232
solution’s feed rate through the syringe. After several trials, a feed rate of 80 µL/min was
determined to be optimal for fiber formation. A fibrous membrane of varying thickness was
deposited onto the collector plate as a result of electrospinning the PU solution under a high
voltage (24 kV) with the DMF/Chloroform solvent blend. A period of 10 to 40 minutes was
selected to spin varying amounts of nanofiber webs.
The electrospun nanofibers were dried at room temperature for 12 hours. The nanofiber webs
were deposited Au/Pd and then characterized using SEM microscopy (Phenom scanning
electron microscope), which allowed us to observe the nanofibrous structures.
Figure 6.2(a) is a representative image of an electrospun PU elastomer fiber web. As
determined through scanning electron microscopy (SEM), the fibrous membrane consisted of
(b) (a)
Figure 6.2 Analysis of an electrospun PU fiber web: (a) an SEM image of fibers (the
nanofibers after mixing in to hexane solvent is shown in the inset image and (b) analysis
of fiber diameter distribution. Fibers had an average diameter of 125 nm.
1μm
233
smooth fibers with a well-controlled average diameter of 125nm and a mean pore size of
about 0.65 µm. The distribution of fiber diameter is plotted in Figure 6.2(b). The PU
nanofiber webs were also mixed into hexane to test their endurance, and the nanofibers were
collected and imaged to observe the effect of the hexane on their morphology. The inset
image of Figure 6.2(a) illustrates the effect of the hexane on nanofibers. This and the other
nanofiber images were analyzed using ImageJ software (developed by the National Institutes
of Health, MA).
6.2.1.2 Matrix Materials
Chemically cross-linked PDMS was used as the matrix material in composite preparation.
For this we used two types of elastomers, as Chapters 4 and 5 described in detail.
6.2.2 Composite Preparation
The elastomer composites were prepared through infusion of PDMS into PU nanofibers,
which had been created through electrospinning. The preparation steps were as follows:
Following the electrospinning process, the nanofiber web samples were placed in petri dishes
without being separated from the aluminum foil film. The PDMS matrix was diluted with
hexane as the solvent (at a 4:1 hexane:PDMS weight ratio) using a magnetic bar stirrer. A
cross-linker and catalyst were then added to the PDMS solution to initiate elastomer network
formation. This mixture was then poured into PU electrospun nanofiber webs that had been
placed on petri dish molds 6 cm in diameter. Each petri dish substrate of PU nanofiber was
filled with 2 mg of PDMS matrix, as shown in Figure 6.4(b). Filler concentration in the
resulting PDMS elastomer composite fiber was approximately 1.25% to 5% weight. The

234
PDMS-infused nanofiber web composites were kept in sealed petri dishes at room
temperature for three days to allow for curing at a controlled evaporation rate. They were
then removed from the aluminum substrates. Their electrical, mechanical, electromechanical,
and morphological properties were then characterized. Figure 6.3 provides a flowchart of the
steps described above, and Figure 6.4 depicts them graphically.
Figure 6.3 Preparation steps of the nanofiber composite elastomer films.
1μm

235
6.1.1 Dielectric Characterization
The dielectric behavior of the composites was measured using an LCR meter (GW Instek
LCR-8101G). A 12 mm-diameter parallel plate capacitor was created by applying silver
paste electrodes (Chemtronics Circuit Works, Kennesaw, GA) to each side of the composites.
The LCR meter was programmed to take capacitance measurements over a frequency range
of 20 Hz to 106 Hz at room temperature, and the resulting impedance, capacitance, and
resistance of the samples were reported at each frequency. The capacitance and dissipation
(b)
(d)
Figure 6.4 Preparation of nanofiber composite: (a) electrospinning of PU, (b) infusion of
PDMS into PU fiber webs, (c) 3D schematic of final composite structure, and (d) cross-
section image of elastomer composite; nanofibers and part of fibers are an apparent in the
image.
(a)
(c)
1μm

236
data for the blend samples were collected, and their dielectric constants were calculated using
the following equation and the capacitance and thickness values:
ε = Ct/A Equation 6.1
where C is capacitance, t is elastomer thickness, and A is electrode area. The real part of the
relative dielectric constant was calculated from the capacitance measurement, and the
dissipation factor was directly collected from the equipment.
6.2.3 Mechanical Characterization
The mechanical properties of the electrospun nanofiber composite elastomer films were
analyzed through uniaxial tensile tests performed with a universal tensile tester MTS-30G
(Instron, PA). The rectangular (10 mm by 50 mm) composite film strips were placed in
instrument grips equipped with compressed air. The test speed was set to 5 mm/min, and the
gauge length was set to 25 mm. The initial moduli of the composites were obtained from the
initial region of stress-strain data.
6.2.4 Electromechanical Characterization
We tested the electromechanical properties of the matrix-infused electrospun fiber composite
elastomers by constructing a circular actuator. The actuation strain and electrical breakdown
properties of the composites were recorded as represented in Figure 6.1(b). The following
procedure was used to prepare the actuator. A uniform prestrain of 30% was applied to the
elastomer composites and held using a circular fixture. A circular active area was created at
the center of each test specimen by applying compliant silver paste electrodes (Chemtronics
CircuitWorks, Kennesaw, GA) on both sides of the specimen. The electrodes were extended
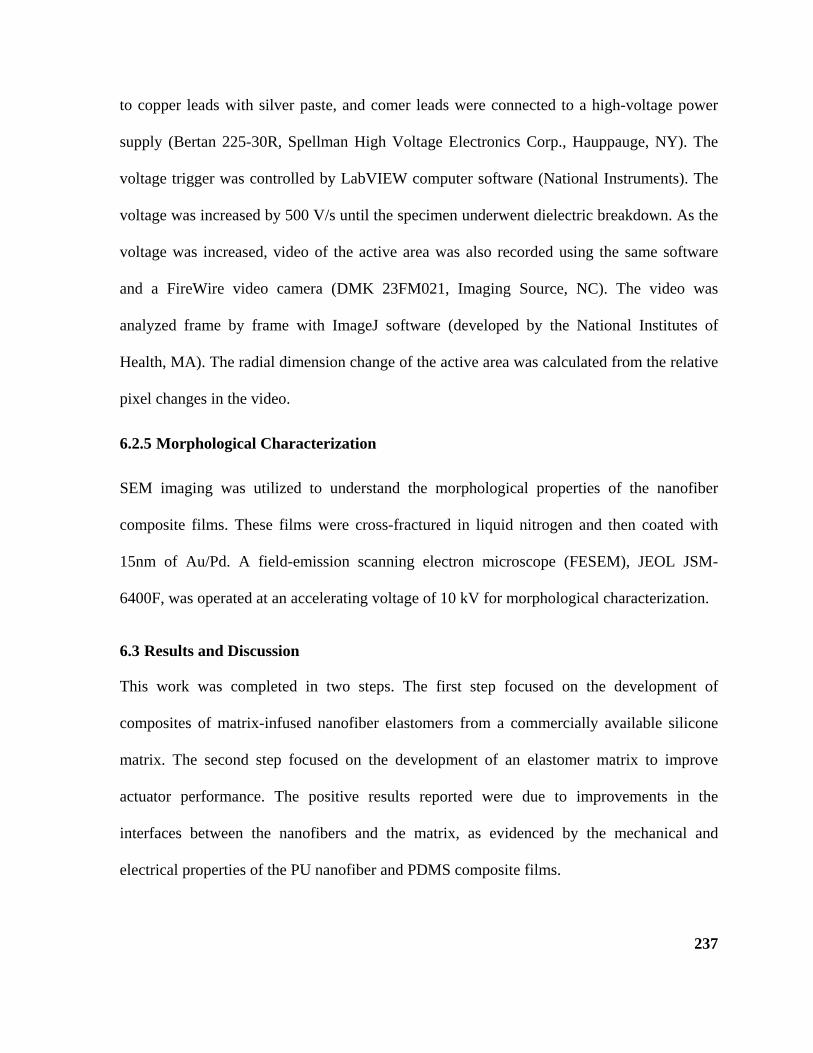
237
to copper leads with silver paste, and comer leads were connected to a high-voltage power
supply (Bertan 225-30R, Spellman High Voltage Electronics Corp., Hauppauge, NY). The
voltage trigger was controlled by LabVIEW computer software (National Instruments). The
voltage was increased by 500 V/s until the specimen underwent dielectric breakdown. As the
voltage was increased, video of the active area was also recorded using the same software
and a FireWire video camera (DMK 23FM021, Imaging Source, NC). The video was
analyzed frame by frame with ImageJ software (developed by the National Institutes of
Health, MA). The radial dimension change of the active area was calculated from the relative
pixel changes in the video.
6.2.5 Morphological Characterization
SEM imaging was utilized to understand the morphological properties of the nanofiber
composite films. These films were cross-fractured in liquid nitrogen and then coated with
15nm of Au/Pd. A field-emission scanning electron microscope (FESEM), JEOL JSM-
6400F, was operated at an accelerating voltage of 10 kV for morphological characterization.
6.3 Results and Discussion
This work was completed in two steps. The first step focused on the development of
composites of matrix-infused nanofiber elastomers from a commercially available silicone
matrix. The second step focused on the development of an elastomer matrix to improve
actuator performance. The positive results reported were due to improvements in the
interfaces between the nanofibers and the matrix, as evidenced by the mechanical and
electrical properties of the PU nanofiber and PDMS composite films.

238
6.3.1 Morphology
PU nanofibers possess a high surface area-to-volume ratio. Because of this, when we
incorporated them into our solution-cast silicone film, they exhibited a high surface area for
adhesion, which had the potential to improve the composite’s overall mechanical properties.
The SEM images displayed in Figure 6.5(a-b) show fiber-reinforced film composites with
nanofibers embedded in the silicone matrix. Both sides of the nanofibers are covered by the
PDMS matrix, further indicating the successful incorporation of nanofibers into the silicone.
6.3.2 Dielectric Properties
Dielectric constant data and tan(Δ) dissipation factor data were plotted for pure PDMS, pure
PU, and the PU/PDMS nanofiber films (see Figure 6.6). All matrix-infused electrospun fiber
composite elastomers showed significant improvement in dielectric constant with small
amounts of nanofiber filler (maximum of 5 wt%).
Figure 6.5 Cross-sectional view of the PU-PDMS nanofiber composite: (a) low-
magnification view of a composite film’s cross-section and (b) high-magnification image
of composite films. Inset image shows a single PU electrospun fiber edge.
5μ
(b) (a)
100μ
500nm

239
As can be seen in the dielectric constant versus frequency plot in Figure 6.6(b), the
composites’ dielectric constants increased in both the high- and low-frequency regions.
However, dielectric measurements taken at low frequencies were higher than those taken at
high frequencies for all samples. At low frequencies, the dielectric constants of the composite
elastomer films were found to be quite high for all weight concentrations. This can be
explained by these materials’ interfacial relaxation mechanism. The increase in interfacial
area of the filler also increases the polarizations in the composites28,29.
The composite and pure PU elastomer samples displayed higher dielectric dissipation than
the neat PDMS at high frequencies. In the composites, dielectric constant decreased as
frequency increased. Elastomer composites containing PU and the pure PU elastomer had
higher dielectric losses than the pure PDMS elastomer at high frequencies; this behavior
affected dielectric constant of composites and resulted in the dielectric constant decrease at
Figure 6.6 Dielectric properties of fiber-infused composites: (a) effective permittivity as a
function of frequency; (b) dielectric loss factor, tan(Δ), as a function of PU fibers.
2
3
4
5
10 102 103 104 105 106
PDMS%1.25 PU-PDMS Comp%3.75 PU-PDMS Comp PU
Frequency (Hz)
'ε
0
0.04
0.08
0.12
0.16
0.2
0.24
0.28
10 102 103 104 105 106
PDMS
%1.2
PU
%2.5
Frequency (Hz)
tan ∆
(a) (b)

240
high frequencies. The increase in tan(Δ) was high, especially for low-frequency dielectric
measurements.
Since the improvement in effective permittivity was greater in the low-frequency region, we
can infer that the interphase properties of these composites have a positive effect on dielectric
properties. The results in the dielectric loss of the composites for low frequency was also
high.
6.3.3 Mechanical Properties
The mechanical properties of nanofiber composites play a major role in actuation strain and
in the energy density characteristics of fiber composite films. The mechanical properties of
the neat and composite samples used in this study were also characterized and are shown in
Table 6.1.

241
Inclusion of PU in the composites resulted in a significant increase in tensile strength
compared to that of pure PDMS. As determined from stress-strain behavior, the initial
modulus values for Type I and Type II neat PDMS were 0.65 MPa and 0.18 MPa,
respectively. When PU was included at 1.25 wt%, these values increased to 0.78 MPa and
0.45 MPa. At the highest percentage weight of PU, 3.75 %, these values were 1.05 MPa and
0.95 MPa, respectively. Therefore, tensile modulus showed a significant increase as
percentage of PU increased.
The Type I and Type II elastomer silicone films (e.g., neat PDMS) exhibited falling rate
curves until failure occurred, with average tensile strengths of 3.6 ± 0.7 MPa and 2.2 ± 0.7
MPa, respectively. When PU was introduced, these increased, ranging from 7.5 ± 1.2 MPa
Table 6.1 Mechanical properties of the neat and composite film samples.
Sample Tensile strength (MPa)
Strain at break (%)
Tensile modulus (MPa)
Tensile strength (MPa)
Strain at break (%)
Tensile modulus (MPa)
Neat PU web 5.8 ± 1.5 510 ± 125 2.29 ± 0.24
Type Type I Type II
Neat PDMS (control) 3.6 ± 0.7 500 ± 60 0.65 ± 0.11 2.2 ± 0.7 350 ± 52 0.18 ± 0.11
1.25 PU/PDMS type I composite
7.5 ± 1.2 660 ± 40 0.78 ± 0.21 6.5 ± 1.3 550 ± 40 0.45 ± 0.14
2.5 PU/PDMS type I composite
8.1 ± 1.2 720 ± 40 0.92 ± 0.15 7.1 ± 0.9 580 ± 40 0.65 ± 0.22
3.75 PU/PDMS type I composite
8.2 ± 1.2 740 ± 50 1.05 ± 0.25 7.5 ± 1.3 600 ± 50 0.85 ± 0.15

242
and 6.5 ± 1.3 MPa at 1.25 percentage weight to 8.2 ± 1.2 MPa and 7.5 ± 1.3 MPa at 3.75
percentage weight for Types I and II, respectively.
Likewise, as shown in Table 6.1, tensile strain increased with the introduction of PU into the
composite. The PU fiber-reinforced silicone films showed linear curves from 0-300% strain;
the curves then leveled off until failure. Pure Type I and Type II PDMS exhibited tensile
strains of 500 ± 60 % and 350 ± 52 %, respectively. As percentage weight of PU in the
PDMS blends increased and ranged from 1.25 to 3.75, Type I and Type II tensile strains
ranged from 660 ± 40% to 740 ± 50% and 550 ± 40% to 600 ± 50%, respectively.
The results of our study therefore confirm that the mechanical properties of the Type I and
Type II silicone films improve significantly with the addition of PU nanofibers as nanofillers.
6.3.4 Electromechanical Properties
The previous section looked at the improvement in the mechanical properties of films that
produced from nanofiber composites of PU and PDMS. This section will report the effects on
the blends’ electromechanical properties, summarized in Figure 6.7.
243
For the Type I and Type II PDMS and composite elastomers created as part of our study,
Figure 6.7(a-b) plot actuation strain (sx) against true electric field. In general, the actuation
strain results were similar to those for the control sample for all composite concentrations.
However, composite dielectric strength decreased with increasing PU nanofiber filler weight
concentration. The composites maximum actuation strain decreased from 20% to 10% with
the increase in fiber weight concentration from 1.25% to 3.75%.
As shown in Figure 6.7(b), the actuation strain results for the Type II composite samples
were also very similar to those for the control sample for all composite concentrations. Here
too, composite dielectric strength decreased as PU nanofiber filler weight concentration
increased. The maximum actuation strain of the composites decreased from 10% to 8% as
fiber weight concentration increased from 1.25% to 3.75%.
Figure 6.7 Actuation strain versus electric field for (a) Type I and (b) Type II PU/PDMS
composite films.
(a) (b)

244
All PU/PDMS composites showed lower dielectric strengths than that of pure PDMS. The
dielectric strengths of these materials decreased further with the introduction of more PU
nanofibers. The data used for calculations was recorded under the following conditions: εr
was measured at 100 Hz, and Y was calculated at 30% strain of elastomers from stress-strain
curves.

245
Another important metric by which to evaluate the performance of a D-EAP actuator is
electromechanical coupling efficiency, which is similar to energy conversion efficiency.
Figure 6.8(a) provides a plot of coupling efficiency as a function of PU weight concentration
0
0.005
0.01
0.015
0.02
0.025
0.03
0 1 2 3 4
Type I Composites
Type II Composites
E L (MJ/
m3 )
PU Concentration (wt %)
0
0.005
0.01
0.015
0.02
0 1 2 3 4
Type I Composites
Type II Composites
Ener
gy D
ensi
ty (M
J/m
3 )
PU Concentration (wt %)
15
20
25
30
35
40
45
50
-1 0 1 2 3 4
Type I Composites
Type II Composites
Cou
plin
g ef
ficie
ncy,
K2 (%
)
PU Concentration (wt %)
Figure 6.8 Plots of actuator performance of composites: (a) electromechanical coupling
efficiency (K2); (b) compressive (Maxwell) stress; (c) electromechanical energy density,
as given by [−𝑃𝑃𝑀𝑀𝑎𝑎𝑀𝑀𝑤𝑤𝑛𝑛𝑒𝑒𝑒𝑒𝑃𝑃𝑧𝑧 2⁄ ] on a unit-volume basis; (d) electric energy density, EL,
[−𝑌𝑌[𝑃𝑃𝑧𝑧 − 𝑃𝑃𝑙𝑙(1 + 𝑃𝑃𝑧𝑧)], displayed in terms of PU weight concentration. For all plots, the
magnitude of the electric field was 50 V/µm. The lines serve as visual guides to eye.
(b)
(c) (d)
(a)
0.05
0.06
0.07
0.08
0.09
0.1
0.11
0 1 2 3 4
Type I Composites
Type II Composites
Com
pres
sive
Stre
ss (M
Pa)
PU Concentration (wt %)

246
for the Type I and Type II composites created in the course of this study. For both Type I and
Type II PDMS, Figure 6.8(a) plots the coupling efficiencies of the composites and of pure
PDMS, which acted as the control in this analysis. Pure Type I PDMS had a coupling
efficiency of 15.82%, and the Type I composites with 1.25% and 2.5% concentrations of PU
exhibited coupling efficiencies of 18.04 and 20.79%, respectively.
The composites made from Type II PDMS exhibited a similar improvement in coupling
efficiency. With a Kfor pure Type II PDMS of 23.71%, the K2 values of the composites with
1.25%, 2.5%, and 3.5% concentrations of PU were 29.16%, 34.13%, and 46.78%,
respectively. Noting that the 3.5%-concentration composite exhibited almost a 100% increase
in coupling efficiency over the pure Type II PDMS sample.
Both the Type I and Type II composites showed a similar improvement in Maxwell stress, or
compressive pressure, over the pure PDMS control at 50 V/µm. These values for pure Type I
and Type II PDMS were 0.0620 MPa and 0.0553 MPa, respectively. The Type I composites’
values ranged from 0.0881 MPa at 1.25% concentration PU to 0.1058 MPa at 3.5%
concentration PU. The Type II composites exhibited slightly lower values, ranging from
0.0836 MPa at 1.25% concentration PU to 0.1013 MPa at 3.5% concentration PU. For both
Type I and Type II composites, therefore, Maxwell stress was an increasing with the
increasing concentration of PU.
Composite energy density also increased as a function of increasing concentration of PU (see
Figure 6.8(c)), and Type II values always exceeded Type I values. For Type I and Type II
pure PDMS, energy density was 3.30E-05 MJ/m3 and 5.06E-05 MJ/m3, respectively. For the

247
Type I composites, energy density ranged from 3.78-05 MJ/m3 at 1.25% concentration PU to
4.4E-05 MJ/m3 at 2.5% concentration PU. Type II composite energy density ranged from
5.062E-05 MJ/m3 at 1.25% concentration PU to 10.81E-05 MJ/m3 at 3.75% concentration
PU. As can be seen in Figure 6.8(c), energy density increased at a constant rate until 2.5%
concentration PU; it then increased sharply at 3.75% concentration PU, at which point it
represented greater than a 100% improvement over the pure PDMS sample’s energy density.
Electromechanical sensitivity, β, was calculated using Equation 5.13. The electromechanical
sensitivities for the Type I and Type II composites were compared to their corresponding pure
PMDS control samples using the following formula:
βr =
ββPDMS
Equation 6.2
where β is the electromechanical sensitivity of a composite, βPDMS is the electromechanical
sensitivity of the pure PDMS material (Type I, 0.0030; Type II, 0.0020), and βr is the relative
electromechanical sensitivity of the composite to that of the pure PDMS sample. Calculated
using data recorded under the following conditions: εr was measured at 1000 Hz, and Y was
measured at 0% or 0.5% strain.
As with the other measures of physical properties discussed, β was an increasing with the
increasing PU wt% in the composite. Among Type I composites, βr ranged from 1.59 for the
1.25% concentration PU composite to 2.57 for the 2.5% concentration PU composite. The
improvement in electromechanical sensitivity was even more pronounced for the Type II
composites: The 1.25% concentration sample exhibited a value 4 times that of Type II pure

248
PDMS, the 2.5% concentration 8 times that of pure PDMS, and the 3.75% concentration 27
times that of pure PDMS. This increase represented a near exponential rate of growth in β as
a function of PU wt% concentration.
The actuation performance for nanofiber composites were compared to other composite
dielectric elastomer actuators in Table 6.2. According to this table, we can conclude that
nanofiber PU/PDMS nanocomposites present a higher dielectric strength and lower Young’s
modulus than ceramic-elastomer composites. PU/PDMS composites also showed a higher
dielectric strength than conductive filler-elastomer composites.

249
6.4 Conclusions
In this chapter, we described our fabrication of solution-cast PDMS film reinforced with
electrospun polyurethane nanofiber and discussed the electromechanical, mechanical, dielectric,
and morphological properties of the resulting composite films. PDMS was solution-cast inside
Table 6.2 Mechanical properties of the neat and composite film samples.
Type (specific) Modulus εr Concentration EBreakdown
Maximum strain Prestrain
(Mpa) (%) (V/µm) (%) (%)
VHB491026 2 4.7 — ~235 60 300
PDMS 1.270 2.5 — 40 12 30 PDVB@PANi–PDMS 27 5.4 7.7 42.3 11 30
(CB-BaTiO3)/PDMS28 1.9 10 CB 0.03, BT
0.60(wt) 30 6.1 30
P3HT–PDMS29 0.046 14 6 (wt) 8.5 0.02 0 PMN–PDMS30 17.3 36 108.1 <7 - Dipoles–PDMS(Sylgard 184)31
0.85 6.15 10,7 61 ~2.8 -
Dipoles–PDMS(Elastosil) 31 0.14 5.56 10.7 30.7 ~2.5 -
PDMS-PDVB32 11.7 ~7.7 max:31.7(vol) 50 0.85 -
PDMS-PDVB32 0.5 ~3.3 optimum:15 (vol) 50.9 10 -
PU-PDMS (in-situ syn)33 ~16,
tanΔ>1 40 (wt) 5.5 2.5 -
PU-PDMS (PU as nanofibers) ~0.9 ~4.6 3.75 (wt) 45 10 30
BaTiO3–PDMS 12.8 39.3 205.5 2.6 - TiO2–PDMS34 0.85 4.9 9 (vol) 60 ~8 - TiO2–PDMS (plasticized)34 ~0.2 3.8 4 (vol) 35 18 -
PZT – TPE35 ~0.1 ~6 80 (wt) 20.6 ~7 - The data have been reported from cited references for conditions that result in the best
actuation behavior.

250
PU nanofibers. The dielectric constant and Young’s modulus of the nanofiber composite films
were increased. The dielectric properties and mechanical properties influenced actuator
performance. The nanocomposite elastomers had desirable dielectric constant values but high
dielectric loss; the dielectric strength of the composite films decreased with increasing
percentage of nanofiber composition.
In summary, we have shown that nanofiber composites were able to improve the actuation
behavior of PDMS elastomers in terms of coupling efficiency and energy density at a given
electric field. These nanofiber composite elastomers can be produced and used in many
engineering applications.
6.5 References
1. Bar-Cohen, Y. Electroactive polymer (EAP) actuators as artificial muscles. (SPIE
Press, 2004).
2. Pelrine, R., Kornbluh, R., Pei, Q. & Joseph, J. High-speed electrically actuated
elastomers with strain greater than 100%. Science 287, 836–839 (2000).
3. Zhang, Q. M. et al. An all-organic composite actuator material with a high dielectric
constant. Nature 419, 284–287 (2002).
4. Baughman, R. H. et al. Carbon nanotube actuators. Science 284, 1340–1344 (1999).
5. Mirfakhrai, T., Madden, J. D. W. & Baughman, R. H. Polymer artificial muscles.
Mater. Today 10, 30–38 (2007).
6. Shankar, R., Ghosh, T. K. & Spontak, R. J. Dielectric elastomers as next-generation
polymeric actuators. Soft Matter 3, 1116 (2007).

251
7. Carpi, F., Gallone, G., Galantini, F. & De Rossi, D. Enhancing the dielectric
permittivity of elastomers. (Elsevier, 2008).
8. Brochu, P. & Pei, Q. Advances in dielectric elastomers for actuators and artificial
muscles. Macromol. Rapid Commun. 31, 10–36 (2010).
9. Biddiss, E. & Chau, T. Dielectric elastomers as actuators for upper limb prosthetics:
challenges and opportunities. Med. Eng. Phys. 30, 403–418 (2008).
10. Goulbourne, N., Frecker, M. I., Mockensturm, E. M. & Snyder, A. J. Modeling of a
dielectric elastomer diaphragm for a prosthetic blood pump. in 5051, 319–331 (2003).
11. Ahnert, K., Abel, M., Kollosche, M., Jørgensen, P. J. & Kofod, G. Soft capacitors for
wave energy harvesting. J. Mater. Chem. 21, 14492–14497 (2011).
12. Florian, P., Jena, K. K., Allauddin, S., Narayan, R. & Raju, K. V. S. N. Preparation
and characterization of waterborne hyperbranched polyurethane-urea and their hybrid
coatings. Ind. Eng. Chem. Res. 49, 4517–4527 (2010).
13. Liu, H., Kameoka, J., Czaplewski, D. A. & Craighead, H. G. Polymeric nanowire
chemical sensor. Nano Lett. 4, 671–675 (2004).
14. Liu, H., Reccius, C. H. & Craighead, H. G. Single electrospun regioregular poly(3-
hexylthiophene) nanofiber field-effect transistor. Appl. Phys. Lett. 87, 253106 (2005).
15. Li, Y. et al. Ultra-low dielectric performance of polymer electrospun nanofiber mats.
Appl. Phys. A 100, 207–212 (2010).
16. Dagdeviren, C. & Papila, M. Dielectric behavior characterization of a fibrous-
ZnO/PVDF nanocomposite. Polym. Compos. 31, 1003–1010 (2010).

252
17. Liu, H. et al. Carbon nanotube array/polymer core/shell structured composites with
high dielectric permittivity, low dielectric loss, and large energy density. Adv. Mater.
23, 5104–5108 (2011).
18. Tijing, L. D. et al. Improved mechanical properties of solution-cast silicone film
reinforced with electrospun polyurethane nanofiber containing carbon nanotubes.
Appl. Surf. Sci. 264, 453–458 (2013).
19. Li, X. et al. Preparation and dielectric property investigation of ferrocene/poly(vinyl
pyrrolidone) composite membranes. J. Nanosci. Nanotechnol. 9, 704–708 (2009).
20. Bashouti, M., Salalha, W., Brumer, M., Zussman, E. & Lifshitz, E. Alignment of
Colloidal CdS Nanowires Embedded in Polymer Nanofibers by Electrospinning.
ChemPhysChem 7, 102–106 (2006).
21. Khan, W. S., Asmatulu, R. & Eltabey, M. M. Dielectric properties of electrospun pvp
and pan nanocomposite fibers at various temperatures. J. Nanotechnol. Eng. Med. 1,
041017–6 (2010).
22. Im, J. S., Kim, J. G., Lee, S.-H. & Lee, Y.-S. Effective electromagnetic interference
shielding by electrospun carbon fibers involving Fe2O3/BaTiO3/MWCNT additives.
Mater. Chem. Phys. 124, 434–438 (2010).
23. Vijayakumar, G. N. S., Devashankar, S., Rathnakumari, M. & Sureshkumar, P.
Synthesis of electrospun ZnO/CuO nanocomposite fibers and their dielectric and non-
linear optic studies. J. Alloys Compd. 507, 225–229 (2010).
24. Li, W. K. & Wong, Y. W. Electrical properties of electrospun nanofibers of
peo/carbon black composite. Solid State Phenom. 151, 67–71 (2009).
25. Chanmal, C. V. & Jog, J. P. Electrospun PVDF/BaTiO3 nanocomposites:
polymorphism and thermal emissivity studies. Int. J. Plast. Technol. 15, 1–9 (2011).

253
26. Kornbluh, R. D., Pelrine, R., Pei, Q., Oh, S. & Joseph, J. Ultrahigh strain response of
field-actuated elastomeric polymers. in Smart Structures and Materials 2000:
Electroactive Polymer Actuators and Devices (EAPAD) (ed. Bar-Cohen, Y.) 3987,
51–64 (SPIE, 2000).
27. Liu, L. W., Kang, W. M. & Cheng, B. W. Preparation of polyurethane
(PU)/polyaniline (PANI) compound nanofiber via electrospinning. Adv. Mater. Res.
332, 1352–1356 (2011).
28. Zhao, H., Xia, Y.-J., Dang, Z.-M., Zha, J.-W. & Hu, G.-H. Composition dependence
of dielectric properties, elastic modulus, and electroactivity in (carbon black-
BaTiO3)/silicone rubber nanocomposites. J. Appl. Polym. Sci. 127, 4440–4445
(2013).
29. Carpi, F., Gallone, G., Galantini, F. & De Rossi, D. Silicone-poly(hexylthiophene)
blends as elastomers with enhanced electromechanical transduction properties. Adv.
Funct. Mater. 18, 235–241 (2008).
30. Yang, D. et al. Lead magnesium niobate-filled silicone dielectric elastomer with large
actuated strain. J. Appl. Polym. Sci. 125, 2196–2201 (2012).
31. Risse, S., Kussmaul, B., Krüger, H. & Kofod, G. A versatile method for enhancement
of electromechanical sensitivity of silicone elastomers. RSC Adv. 2, 9029–9035
(2012).
32. Molberg, M. et al. High Breakdown Field Dielectric Elastomer Actuators Using
Encapsulated Polyaniline as High Dielectric Constant Filler. Adv. Funct. Mater. 20,
3280–3291 (2010).
33. Gallone, G., Galantini, F. & Carpi, F. Perspectives for new dielectric elastomers with
improved electromechanical actuation performance: composites versus blends.
Polym. Int. 59, 400–406 (2010).

254
34. Zhao, H., Wang, D.-R., Zha, J.-W., Zhao, J. & Dang, Z.-M. Increased electroaction
through a molecular flexibility tuning process in TiO2–polydimethylsilicone
nanocomposites. J. Mater. Chem. A 1, 3140 (2013).
35. Molberg, M. et al. Elastomer actuators: systematic improvement in properties by use
of composite materials. in 7642, 76420M–76420M–9 (2010).

255
CHAPTER 7 Summary and Future Work
7.1 Summary
The aim of this research was to investigate elastomer blends and composites with respect to
their applicability in dielectric elastomer actuators. The main goal was to develop soft
nanocomposite elastomer materials with enhanced electromechanical response and improved
actuation strain. In this context, we evaluated the use of the high-relative permittivity
polymer polyurethane (PU) as filler and the low-elastic modulus and high-electric breakdown
polymer polydimethylsiloxane (PDMS) as matrix. These PDMS materials were then further
developed to improve the performance of the blends and composites. The approaches
described here can aid in the development of useful materials with enhanced energy densities
and electromechanical response for use in actuator applications.
Specifically, in this work, PU/PDMS dielectric elastomer actuator polymers (D-EAPs) were
fabricated with different concentrations of PU, in a higher dielectric constant and enhanced
electromechanical response. Polymer film fabrication from blends and fiber composites were
performed. In both preparation methods, materials were commercially available and
formulated elastomer.
We were able to obtain a substantial increase in relative permittivity, up to 70%, and in
electrostatic energy density, up to 230%, while still sustaining very low dielectric loss. PU-
PDMS blends and composites are suitable for energy-efficient applications requiring low
electric fields, such as micro-robotic systems, micro-fluidic/haptic/biomedical devices (e.g.,
active braille and steerable catheters), and smart prosthetics.

256
7.2 Future Work
From the information collected and discussed in this study, a number of challenges and
recommendations for future work can be identified. The successful design of enhanced
energy density of nanocomposites based on use of high-permittivity PU requires detailed
investigation of the structure of the polymer filler interface. This is particularly true for
nanofiber composites, whose high surface area-to-volume ratio makes the interface critical in
the determination of functional properties. Understanding the interactions in the interface of
constituents will provide an opportunity to tailor the electromechanical properties of the
nanocomposites. For example, enhanced compatibility between polymers could have a
positive effect on the dielectric permittivity and electric breakdown strength of blends and
composites.
Incorporating other polymer fillers that have high polarizability (e.g., PVDF and LC
polymers, fluoropolymers, or copper metallocenes) or high conductivity (e.g., carbon or
metal nanoparticles) would increase the dielectric constant of these fiber webs tremendously.
The use of composite fibers in elastomer matrices can be expected to increase dielectric
constant and mechanical properties of composite films. Such composites would show a low
dielectric loss because of not percolating filler arrangement. The phase behavior of these
suggested blends and composites can be studied to understand the chemistry and structures of
the polymer-polymer and polymer-nanofiller interfaces.
Subramani et al.1 recently demonstrated the production of Anisotropic D-EAP with tunability
(ADEPT) composites using acrylic elastomer as matrix and various fibrous materials as
reinforcements. The fibers were chosen to represent a wide range of mechanical and

257
dielectric properties as well as high dielectric permittivity. In an approach similar to theirs,
unidirectional nanofiber-reinforced composites could be fabricated through a solvent-casting
method. The electrospinning method can easily produce aligned nanofibers and so can be
simply and easily applied into dielectric elastomer actuator fabrication method. Ultimately,
the method of nanofiber composite production can be used with a wide variety of polymer
fibers with fillers and matrices to meet the requirements of many applications.
7.3 References
1. Subramani, K. B., Cakmak, E., Spontak, R. J. & Ghosh, T. K. Enhanced electroactive
response of unidirectional elastomeric composites with high-dielectric-constant
fibers. Adv. Mater. 26, 2949–2953 (2014).