Optical Properties of Non-Periodic Dielectric Systems Made of Nanostructured Porous Silicon
Upload
khangminh22Category
view
2download
0
Micro-Plasma in Porous Media and Dielectric Barrier Discharges
with Advanced Agricultural Applications
by
Kenneth Wesley Engeling
A dissertation submitted in partial fulfillment of the requirements for the degree of
Doctor of Philosophy (Nuclear Engineering and Radiological Sciences)
in the University of Michigan 2019
Doctoral Committee:
Professor John E. Foster, Chair Professor Ronald Gilgenbach
Research Scientist John Hoard Professor Mark J. Kushner

ii
ACKNOWLEDGEMENTS I would like to thank all of those that had helped me along the way.
Kenneth Wesley Engeling
September 2019

iii
TABLE OF CONTENTS
ACKNOWLEDGEMENTS........................................................................................................... ii
LIST OF FIGURES ........................................................................................................................ v
LIST OF TABLES ........................................................................................................................ ix
ABSTRACT .................................................................................................................................... x
Chapter I Introduction ............................................................................................................ 1 1.1 The problem at hand ..................................................................................................................... 1 1.2 Scope of Thesis ................................................................................................................................ 2 1.3 The Impact of the dissertation findings .................................................................................... 5 1.4 Experimental Set up ...................................................................................................................... 5
1.4.1 2-dimensional cell ................................................................................................................................ 5 1.4.2 Optical Emission Spectroscopy ....................................................................................................... 6 1.4.3 3-dimensional packed bed reactor................................................................................................... 7 1.4.4 Aggregate material ............................................................................................................................... 8 1.4.5 Organic material ................................................................................................................................... 8 1.4.6 Joint modeling efforts ......................................................................................................................... 8
1.5 Scope of Dissertation ..................................................................................................................... 8 Chapter II Micro-Plasma in Porous Media with Applications to Agriculture: Current Status and Questions to be Answered ............................................................ 10
2.1 Introduction to micro-plasmas, dielectric barrier discharges, and packed bed reactors ................................................................................................................................................................ 10 2.2 Brief overview of experimental efforts to date ..................................................................... 15 2.3 Review of 0-D, 2-D, and 3-D kinetic modeling of microplasma systems ........................ 19 2.4 The synergy enigma of plasma-catalytic systems ................................................................ 22 2.5 Application of PBRs and Micro-plasmas To Environmental Problems ........................ 23
Chapter III 2-Dimensional Cell: Classification of Discharge Formation and Propagation .............................................................................................................................. 25
3.1 Experimental Approach ............................................................................................................ 25 3.2 Modeling within ANSYS:Maxwell .......................................................................................... 30 3.2.1 The 2-dimensional cell ............................................................................................................ 30 3.2.2 The 3-dimensional packed bed reactor............................................................................... 32 3.3 Description of the nonPDPSIM Model................................................................................... 34 3.4 Discharge Evolution at Atm. Pressure ................................................................................... 37 3.5 Discharge Evolution as a Function of Pressure in the 2-D PBR ...................................... 48 3.6 Modeling of Micro-Discharges: Zirconia and Quartz within nonPDPSIM .................. 60 3.7 Discharge propagation in the presence of catalytic particles ........................................... 70 3.8 Validation of 2-D results using 3-Dimensional Sub-scale PBR ........................................ 78

iv
Chapter IV A Spectroscopic Study of Plasma Emissions from the 2-Dimensional Discharge .................................................................................................................................. 81
4.1 Species evolutions as Inferred through 2-D emission map ............................................... 81 4.2 Collected OES Spectra for Inorganic Material ................................................................... 84 4.3 A Spectroscopic Study of the organic discharge .................................................................. 94 4.4 Future Investigations Using Optical Emission Spectroscopy ........................................... 98
Chapter V Atmospheric Nanosecond Pulsed Discharge Effects on Soybeans: Propagation Methods and Water Uptake ................................................................... 100
5.1 Introduction to previous work with contact angle and water absorption ................... 100 5.2 Description of the experiment ................................................................................................ 103 5.4 Contact angle as a function of treatment parameters ...................................................... 114 5.5 Water Absorption ..................................................................................................................... 120
5.5.1 Direct Seed Treatment ................................................................................................................... 120 5.5.2 Plasma Activated Water Results ................................................................................................ 122
5.6 Concluding Chapter Remarks ............................................................................................... 124 Chapter VI Discussion of Future Work ........................................................................ 126
Appendix A ............................................................................................................................ 130
BIBLIOGRAPHY .................................................................................................................... 165

v
LIST OF FIGURES
Figure I-1: SolidWorks schematic of the lower quartz plate utilized in the 2-dimensional experimental
setup. Imperial unit dimensions are used in the Solidworks drawing as the manufacturing company required them. ........................................................................................................................................ 6
Figure I-2: An image capturing the 3-dimensional packed bed reactor filled with soybean aggregate. .......... 7 Figure II-1: Diagram representing a typical layout of a technical ozone generator.4 .................................... 11 Figure II-2: Basic planar configurations of DBDs: (a) volume DBD (1-symmetric, 2-symmetric, 3-floated
dielectric); (b) surface DBD (1-symmetric, 2-asymmetric ‘actuator’ design); (c) coplanar discharge.8 ............................................................................................................................................................. 12
Figure II-3: Diagrams representing the classical QV-plot on a plasma system with the equivalent circuits represented in (b) with plasma on and plasma off phases.15 ................................................................ 13
Figure II-4: Atomic Boltzmann line plot for neon gas. ................................................................................. 15 Figure II-5: Diagram representing a common setup style for a packed bed dielectric barrier discharge
reactor. ................................................................................................................................................. 16 Figure II-6: Classic equivalent circuit model shown by Butterworth et al. in their work. ............................. 18 Figure II-7: Discharge across ytrrium stabilized zirconia pellet as a function of the applied voltage.27 ....... 18 Figure II-8: Planar view of the localized electric field enhancement in a packed bed reactor for a dielectric
constant of 5.36 ..................................................................................................................................... 20 Figure II-9: Electron density at the moment of breakdown, time averaged electron density, and time
averaged total ion density computations from the COMSOL multiphysics 2d modeling effort from Van Laer and Bogaerts. ....................................................................................................................... 21
Figure II-10: Plots from Van Laer and Bogaerts that show the influence of dielectric constant on the space- and time-averaged electric field strength, electron temperature, and electron density. ....................... 22
Figure III-1: Experimental setup for the time-resolved microdischarge analysis. (a) Schematic of apparatus. (b) Overhead view of reaction chamber with media. ........................................................................... 26
Figure III-2: Hexagonal pattern of dielectric disks in a pin-to-planar electrode setup (a) quartz (5 mm diameter), (b) zirconia (6.1 mm in diameter). ...................................................................................... 27
Figure III-3: Simulated vacuum electric field within ANSYS: Maxwell for applied voltage of 20 kV in the 2D-PBR for (top) quartz (ε/ε0=3.8) and (bottom) zirconia (ε/ε0=26.6). .............................................. 28
Figure III-4: ANSYS:Maxwell simulations of the 2d cell geometry with quartz and zirconia being modeled as a changing dielectric constant value. The results are with identical sized of the disks although the experiment holds slightly differing sizes. The simulation utilized a 20 kV potential. ........................ 31
Figure III-5: ANSYS:Maxwell simulations showing the electric field strength in the reactor without aggregate(a) and with silica glass sphere aggregate(b). ....................................................................... 33
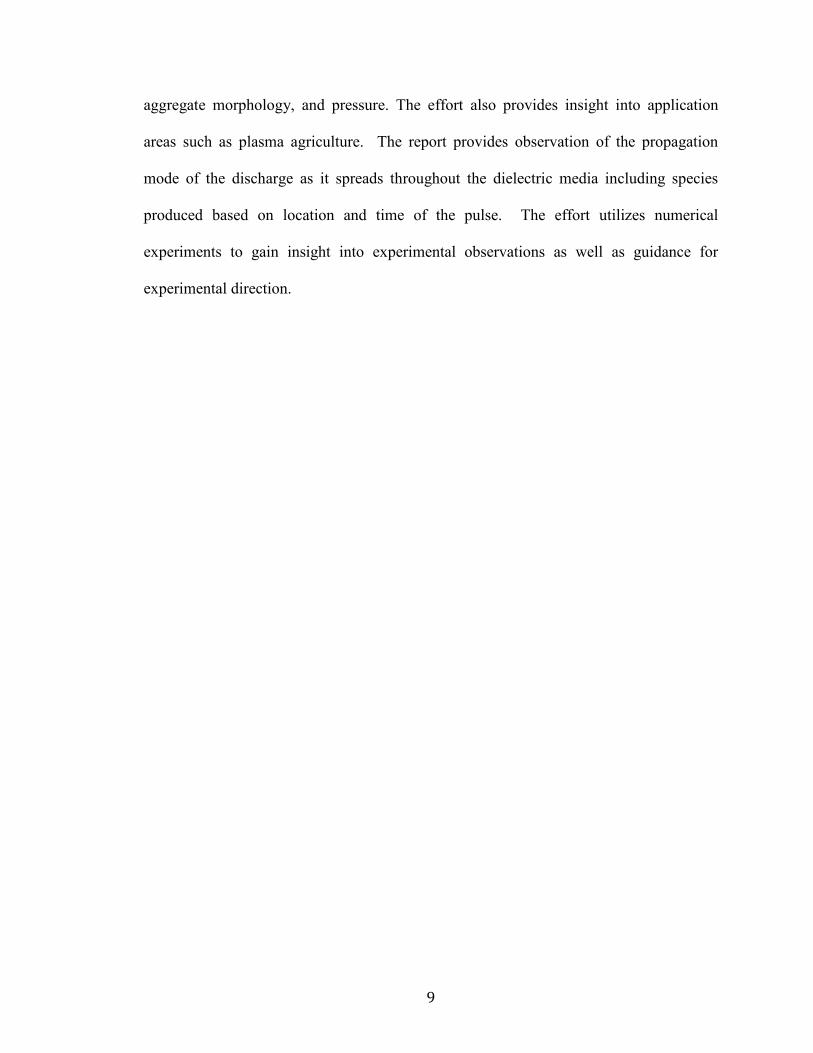
Figure III-6: ANSYS:Maxwell simulation resulting in the electric field strength effected by inserting a repeating structure of dielectric spheres into the reactor. Any value greater than 4 kV/cm results in satisfaction of the electric field strength required for breakdown. ....................................................... 34
Figure III-7: Electrical waveforms with zirconia disks for a discharge at 760 Torr. (Black) Current (Orange) Voltage. ................................................................................................................................................ 37
Figure III-8: Time-resolved imaging of the 2D-PBR discharge through quartz disks at 1 atm integrated over 5 ns. (a) 0-5 ns, (b), 10-15 ns, (c) 15-20 ns, (d), 20-25 ns. (e) 25-30 ns and (f) 35-40 ns. .................. 39
Figure III-9: Time-resolved microscopic imaging of the 2D-PBR discharge in the vicinity of quartz disks 3, 4 and 6 at 1 atm integrated over 5 ns. (a) 0-5 ns, (b), 5-10 ns, (c) 10-15 ns, and (d), 15-20 ns. ......... 40
Figure III-10: Time-resolved imaging of the 2D-PBR discharge through zirconia disks at 1 atm integrated over 5 ns. (a) 0-5 ns, (b), 10-15 ns, (c) 15-20 ns, (d), 30-35 ns. (e) 40-45 ns and (f) 45-50 ns. .......... 41

vi
Figure III-11: Time-resolved microscopic imaging of the 2D-PBR discharge in the vicinity of zirconia disks 3, 4 and 6 at 1 atm integrated over 5 ns. (a) 0-5 ns, (b), 5-10 ns, (c) 10-15 ns, and (d), 15-20 ns. ............................................................................................................................................................. 43
Figure III-12: Experimental ICCD imaging (top) and densities of light-emitting species from the model (bottom) between disks number 3, 4, and 6 and at various times. The disparity in time between the model and the experiment arises from the different voltages being applied. ....................................... 45
Figure III-13: Electron density as a function of changing the intrinsic dielectric constant value of the aggregate. The color map is representative of the locations of highest electron density within the 2-d cell. ...................................................................................................................................................... 47
Figure III-14: Imaging of emission of discharges through zirconia disks (5 ns exposure) at atmospheric pressure. (a) 20 kV, (b) 19 kV, (c) 17 kV and, (d) 16 kV. ................................................................... 48
Figure III-15: Time-resolved imaging of the 2D-PBR discharge through quartz disks at 100 Torr integrated over 5 ns. (a) 10-15 ns, (b), 15-20 ns, (c) 40-45 ns, (d), 50-55 ns. (e) 105-110 ns and (f) 110-115 ns. ............................................................................................................................................................. 50
Figure III-16: Time-resolved imaging of the 2D-PBR discharge through quartz disks at 50 Torr integrated over 5 ns. (a) 5-10 ns, (b), 10-15 ns, (c) 25-30 ns, (d), 80-85 ns. (e) 130-135 ns and (f) 135-140 ns. 51
Figure III-17: Time-resolved imaging of the 2D-PBR discharge through quartz disks for 10, 50, and 200 Torr integrated over 5 ns. (a) 10 Torr, 0-5 ns; (b), 10 Torr, 5-10 ns; (c) 50 Torr, 0-5 ns; (d), 50 Torr, 5-10 ns; (e) 200 Torr, 0-5 ns; (f) 200 Torr, 5-10 ns. ............................................................................ 52
Figure III-18: Imaging of discharges through zirconia disks at 50 Torr (5 ns exposure) with and without masking. The masking blocked emission from the surface ionization waves. (a) Without mas, 5-10 ns, (b) with mask, 5-10 ns, (c) without mask, 20-25 ns and (d) with mask 20-25 ns. .......................... 53
Figure III-19: Time-resolved imaging of the 2D-PBR discharge through zirconia disks at 50 Torr integrated over 5 ns. (a) 0-5 ns, (b), 5-10 ns, (c) 15-20 ns, (d), 20-25 ns. (e) 75-80 ns and (f) 80-85 ns. ......................................................................................................................................................... 56
Figure III-20: Images of the 2D-PBR discharge through zirconia disks for 10, 50, and 200 Torr integrated over 5 ns. (a) 10 Torr, 0-5 ns, (b) 10 Torr, 5-10 ns, (c) 50 Torr, 0-5ns, (d) 50 Torr, 5-10 ns, (e) 200 Torr, 0-5 ns, (f) 200 Torr, 5-10 ns. ....................................................................................................... 57
Figure III-21: Images (10 ns exposure) capturing the transition from SIW, volumetric discharges to micro-discharges with increasing pressure. (a) 180 Torr, (b) 190 Torr, (c) 200 Torr and (d) 210 Torr. ....... 58
Figure III-22: Surface wave properties for zirconia and quartz disks. (a) Surface wave thickness as a function of electron mean free path and (b) surface wave thickness as a function of pressure. ........... 59
Figure III-23: Time-integrated images integrated over 1 ms for discharges through zirconia for different a pressure using the macro lens. (a) 200 Torr, (b) 100 Torr, (c), 50 Torr and (d) 10 Torr. .................... 60
Figure III-24: Initial conditions for simulations: (a) base case geometry and (b) base case initial reduced electric field, E/N. (c) Initial E/N for smaller separation between the discs and for (d) rotated lattice. E/N is plotted on a linear scale, 22.7-270 Td for total voltage drop of – 30kV in humid air. .............. 62
Figure III-25: Electron density at different times during propagation of the discharge through the PBR for the base case (-30kV, humid air, 700 μm disc separation). Densities are plotted on a 4-decade log scale with maximum value (cm-3) indicated in each frame. ................................................................. 64
Figure III-26: Electron density at different times during propagation of the discharge through the PBR for the rotated lattice (-30kV, humid air, 700 μm disc separation, 22.5° rotation). Densities are plotted on a 4-decade log scale with maximum value (cm-3 s-1) indicated in each frame. .................................... 67
Figure III-27: Time evolution of the total inventories of reactive species: (a) base case, (b) smaller separation between discs, and (c) rotated lattice. Total inventory is the unitless total number of atoms or molecules representing the volume-integrated density of the species throughout the reactor. ........ 69
Figure III-28: Time-resolved images of plasma formation and propagation of disks 1, 6, and 7 with conductive epoxy acting as a catalyst. Catalyst locations have been highlighted with small dashed circles. The images show that the intensity of the residual plasma remains relatively high near the catalyst after time in which the intensity would be low without the catalysts. .................................... 73
Figure III-29: Time-resolved images of negative polarity pin electrode to positive polarity planar electrode configuration utilizing catalytic particles on a dielectric disk. Images (a-f) show a time progression of the plasma formation and propagation through a select region of the 2-dimensional cell setup. ......... 74
Figure III-30: Electron density mapped out over the 22.5 degree rotated lattice structure of dielectric disks within nonPDPSIM. ............................................................................................................................. 77

vii
Figure III-31: Image of the sub-scale, 3-D packed bed reactor utilizing Si3N4 as the dielectric aggregate. The sub-scale reactor was designed and built to validate the results of the 2-D experiment. .............. 78
Figure III-32: Time-resolved images of plasma formation and propagation within the sub-scale 3-D reactor. (a) Shows plasma formation as a FM with (b-d) showing FMs and SIWs. ......................................... 80
Figure IV-1: Example of the band-pass filter transmission spectrum taken from ThorLabs website. The red line is representative of the filters used in the qualitative diagnosis discussed herein. ........................ 82
Figure IV-2: Exposure images of the Nikon D40 camera using the (a) no band-pass filter, (b) 400 nm filter, (c) 420 nm filter, (d) 600 nm filter. ...................................................................................................... 83
Figure IV-3: Accumulations of the discharge shown through a band pass filter at the same time step for each of the dielectric aggregate. The centerline of the filter is on the 2.4x magnified image. ............ 84
Figure IV-4: The experimental setup for the time-resolved optical emission spectroscopy results is shown in (a) with the region of interests shown in (b). ................................................................................... 85
Figure IV-5: The full spectrum obtained at location 1 before the time-resolved results was focused on the nitrogen 337 nm line. ........................................................................................................................... 86
Figure IV-6: Time-resolved emission spectra of the 337.1 nm second positive nitrogen band as a function of frequency at position 1. ................................................................................................................... 87
Figure IV-7: Time-resolved images during the optical emission spectroscopy measurements. The images are correlated to the intensity measured at each of the labeled time-steps for the 10 Hz pulse. .......... 88
Figure IV-8: Time-resolved imaging of position one at 100 Hz pulse frequency that is correlated to the intensity of the 337.1 nm second positive nitrogen band emission. ..................................................... 89
Figure IV-9: Image representing the second location of investigation between dielectric aggregate labeled 2 and 3. ................................................................................................................................................... 90
Figure IV-10: Time-resolved emission spectrum at position 2 as a function of time and a 10 Hz frequency. ............................................................................................................................................................. 90
Figure IV-11: Time-resolved emission spectroscopy of 337.1 nm band at position 2 with a 10 Hz frequency. ............................................................................................................................................ 91
Figure IV-12: Emission spectrum as a function of time at position 3 for a 10 Hz discharge. ...................... 92 Figure IV-13: Time-resolved emission images correlated to the obtained emission spectra for position 3
within the 2-dimensional, zirconia packed bed reactor. ....................................................................... 93 Figure IV-14: Total emission spectrum at each of the positions in (a) vs. the normalized intensity positions
and time-resolved densities in (b). ....................................................................................................... 94 Figure IV-15: Top-down view of the seed aggregate in the 2-d cell with location 1 for optical emission
spectroscopy encircled. ........................................................................................................................ 95 Figure IV-16: Time-resolved emission spectrum for the 337 nm band at location one for the seed material
with a pulse rate of 10 Hz. ................................................................................................................... 96 Figure IV-17: Optical emission spectrum of the soybean seed taken at location one. .................................. 97 Figure IV-18: Image with Location 3 of the OES investigations for the organic aggregate. ........................ 97 Figure IV-19: Time resolved OES spectrum of the 337 nm nitrogen band emission at location 3 for the
organic soybean at a pulse repetition rate of 10 Hz. ............................................................................ 98 Figure V-1: The two-dimensional experimental setup that allows for time-resolved imaging of the micro-
discharge between the inorganic and organic material. ..................................................................... 104 Figure V-2: 3-dimensional setup showing the coaxial dielectric barrier discharge reactor without the
packing aggregate. ............................................................................................................................. 105 Figure V-3: (a) is a close-up of FM between the disks of inorganic aggregate. (b) is a macroscopic view of
the discharge throughout the inorganic aggregate at atmospheric pressure; showing that the FMs are localized in the interstitial spaces between disks. .............................................................................. 110
Figure V-4: Two, 5 ns exposure images of a 20 kV, 120 ns pulse through the soybean aggregate taken at the same time step to show variation in pulse to pulse discharge paths versus the consistency of inorganic material. ............................................................................................................................. 110
Figure V-5: 100 Accumulated images with each accumulation having a 5 ns exposure. (a) Shows micro-discharge location with inorganic material verses (b) the stochastic nature of organic material. The contrast between the (a) and (b) with that of the background shows the consistency of the location of the FMs with the inorganic FMs being much more localized than the organic aggregate FMs. ........ 111
Figure V-6: (a) Reference image of the seeds and electrodes configurations in the 2-D cell. (b-d) accumulated, 5 ns exposure images of the plasma formation and propagation through the organic

viii
aggregate with a wide angle lens. This figure shows the dominating propagation method and is similar to that found in the inorganic discharge images..................................................................... 113
Figure V-7: Direct comparison of the difference in wide lens exposure capture with (a) inorganic aggregate and (b) organic aggregate. Emphasizes the importance of similar macroscopic discharge modes between the inorganic and organic aggregate. ................................................................................... 114
Figure V-8: This image taken from Rame-Hart Instruments Co. presents the differences in contact angles of hydrophobic versus hydrophilic surfaces as well as lists physical properties represented by each contact angle. ..................................................................................................................................... 115
Figure V-9: Example of the contact angle measurement made with a droplet of tap water on an untreated soybean seed acting as the control. This image has a 2.5 microLiter droplet for emphasis. Actual measurements were made using a 1.0 microLiter water droplet. ....................................................... 116
Figure V-10: Recorded data for the contact angle measurements. ‘Ar’ corresponds to the treatments using an argon feedstock gas and air utilizing compressed air as the gas. Overall the argon treatments led to a much lower contact angle than the air treatments. .......................................................................... 117
Figure V-11: Representation of the percent mass difference from the recorded mass of the data set after treatment and then again after the allotted absorption time. The red ‘dashed’ line represents the value of percent mass difference of the control at three hours and allows for easy visual comparison of the results. The labels ‘Ar’ represent the argon feedstock gas treatments verses the ‘Air’ feedstock gas. ........................................................................................................................................................... 121
Figure V-12: Representation of the percent mass difference from the recorded mass of the data set before absorption and then again after the allotted absorption time using the PAW. The red ‘dashed’ line represents the value of percent mass difference of the control at three hours and allows for easy visual comparison of the results. .................................................................................................................. 123
Figure A-1: Semi-aerial view of soybeans being grown on Engeling Bros. Farms in the central Illinois region. ................................................................................................................................................ 131
Figure A-2: A diagram that represents the stages of soybean development with the plant’s components labeled. ............................................................................................................................................... 132
Figure A-3: Chart produced by Y. Yang et al. that shows the cross-talk of some of the ROS and RNS species in the well characterize plant Arabidopsis. ............................................................................ 135
Figure A-4: A simple schematic of the experimental setup utilized for the treatment of the soybeans for germination in growth trials. .............................................................................................................. 137
Figure A-5: Image of the plasma formation and propagation in the 3-dimensional packed bed reactor filled with soybean aggregate. ..................................................................................................................... 139
Figure A-6: Image representation of the flat of a growth trial in which the treated and control seeds have been designated with a color-coded tag. ............................................................................................ 143
Figure A-7: Example of some of the fungal developments that may occur with older, unsterilized seed. The images were taken from a control data set in which no seeds were treated with (a) being the entire flat and (b) a close-up. .............................................................................................................................. 145
Figure A-8: Representation of the germination trial results of 6 (a-f) different seed data sets. Taproot length, total number germinated, and notes about the color of the seeds were all recorded. ............. 146
Figure A-9: A captured image of the freshly harvested soybeans after the 14-day growth trial. ................ 153 Figure A-10: Plots of the 14-day growth trials comparing the best of Batch #’s 1-12 with the control group
are shown in (a-d). Each includes the length of the primary taproot as well as average germination percentages. ....................................................................................................................................... 155
Figure A-11: Image in regards to the procedure for how the dry root mass measurements were baked in an oven for 45 minutes. Photo Credit: Joseph Xu, Senior Multimedia Producer at the University of Michigan. ........................................................................................................................................... 156
Figure A-12: Image comparing the primary and secondary root development traits of the ........................ 158

ix
LIST OF TABLES
Table IV-1: Table of the utilized band-pass filters for the qualitative optical emission spectroscopy. ......... 83 Table V-1: Organized seed treatment parameters such as voltage, frequency, duration, and pulse width as
well as the average mass loss per treatment. ...................................................................................... 106 Table V-2: Organized PAW treatment parameters including voltage, frequency, and pulse width with their
measured water properties. The table shows the influence of plasma interaction with water causing changes in water properties. ............................................................................................................... 116
Table V-3: A table represents some of the many possible reaction mechanisms in which reactive species are produced within the argon-air mixture plasma. ................................................................................. 119
Table A-1: A complete list of all of the treatment parameters employing the EHT-NSP-120 power supply for plasma generation during the soybean seed treatment in the packed bed reactor. ....................... 138
Table A-2: Listing of the power supply settings for the generation of plasma activated water................... 140 Table A-3: Results from the first four germination trial data sets. .............................................................. 147 Table A-4: Tabulated germination results from the use of plasma .............................................................. 150 Table A-5: Categorized power supply settings for the EHT NSP-120 during the treatments for the growth
trials. These settings were determined from previous proof-of-concept preliminary data results. The treatment names are arbitrary and provide no context to the supply settings. ................................... 152
Table A-6: Results in measurements of the 7-day growth trials. ................................................................. 157 Table A-7: Tabulated measurement results from the argon gas treatments to the air treatments. ............... 159 Table A-8: Tabulated results from the 7-day growth trials that implemented plasma activated water instead
of direct seed treatment. ..................................................................................................................... 161

x
ABSTRACT
A range of chemical processing applications feature the passage of process gas
through porous media. Such media such as foams with interconnected pores or packed
beds of aggregate media are desirable for chemical reactions since the reaction surface
area to volume ratio is typically quite high. Applications of such reactors include the
removal of volatile organic compounds from flues, plasma treatment of aggregate organic
media such as seeds, and low temperature, efficient combustion. Conventional
applications featuring packed bed media contain catalytic particles often at high
temperature. The chemical reactivity of such porous media can be greatly enhanced non-
thermally through the production of plasma in the pores. The plasma electrons drive non-
equilibrium chemical reactions allowing for a high degree of reaction selectivity. Such
plasmas are also the source of reactive radicals. The production and subsequent
propagation of plasma within the pores of such media is not well understood.
The goal of this thesis work is to understand the plasma production process in
porous media and the subsequent propagation of the plasma through such media. This
work also involves understanding the induced chemical reactivity induced by the
propagating plasma. The ultimate goal is to obtain insight into how the plasma imparts
reactivity to the flow through gas and how these effects can be controlled. This insight
will serve as the basis for optimization of existing packed media plasma reactors and the

xi
development of new, novel sources for a range of applications including chemical
processing.
The goal of this study is to generate Micro-Plasmas (MPs) as a function of
controlled variables throughout the sub-millimeter media. If the plasma properties may
be manipulated, then the application of low temperature plasmas (LTPs) in the modern
industrial world will be greatly expanded with chemical processing applications alone.
In this work, the MP was created in a 2-dimensional cell and a 3-dimensional
reactor using a pulsed, nanosecond high voltage system. Plasma production and
propagation was studied using time-resolved optical techniques and optical emission
spectroscopy. In the process of investigation, optical studies had found that the dielectric
constant value of the packing media had a great influence on the plasma propagation
methods and species production. The higher dielectric had shown more intense
filamentary microdischarges (FMs) and produced more species than the lower dielectrics.
The FM structure for each of the dielectric materials formed at the initialization of the
pulse and then transitioned into surface ionization waves (SIWs). Although the FM
structure was more apparent with high dielectrics, both plasma propagation structures
were observed.
Species identification was performed using band pass filters and optical emission
spectroscopy. Experiments have shown the intensity of the 337.1 nm nitrogen emission
band as a function of time through a 2d reactor. A secondary emission peak was
observed through the discharge with the inorganic aggregate. The second peak may be
corresponded to sheath collapse and then re-expansion, ultimately leading to the
additionally observed peak. This secondary peak was not observed with the organic

xii
aggregate material. The unobserved secondary emission here may be related to the off-
gassing of the organic aggregate effecting the amount of residual charge and therefore
sheath collapse and re-expansion. Additionally any off gassing of the material would
locally modify the plasma propagation and formation properties.
Also included are plasma interactions with biological organisms such as a
soybean seed. Plasma propagation and formation with organic material was found to
slightly vary pulse-to-pulse and this was due to organic material morphology. A
modification of germination rates and early root development over a 14-day growth trial
were observed. Plasma treatment of the seed was seen to promote various root
developmental traits such as the length of the taproot or secondary root development.
Lastly, the direct plasma treatment of seeds found increased water uptake. This report
sheds light on the effects of the packing aggregate intrinsic properties as well as the
biological response of the soybean seed after plasma treatment.

1
Chapter I
Introduction
1.1 The problem at hand As the world becomes more populated and as humans effects on the environment
become more apparent (e.g. pollution and climate change), technological solutions will
likely be necessary to ensure sustainable habitation. Scarcity of clean water, the need for
more efficient/low carbon footprint fuels, improved agricultural techniques, chemical
processing, and advancements in medical practices are fueling environmentally focused
research and development worldwide.1,2,3 Plasma engineering solutions are presently
being investigated to address a range of these environmental problems.
The utilization of plasma, specifically low temperature, atmospheric pressure
plasmas as demonstrated on the laboratory scale offers a compelling solution. Moreover
since plasmas are produced by electrical energy, plasma solutions can be powered by
sustainable, renewable energy sources such as wind, solar and nuclear. In particular, the
dielectric barrier discharge (DBD) is a compelling tool for selectable control of reaction
chemistry.4 The novelty of the DBD is related to its capacity to generate non-thermal gas
discharges at atmospheric pressures with high efficiency. Since these plasmas can be
generated in bounding aggregate or porous media with high surface to volume ratios, they
can catalyze surface reactions for enhance efficiency without the need for a physical

2
catalytic particle otherwise subject to fouling. In order to advance DBD technology, an
improved fundamental understanding the formation of micro-plasmas in high surface-to-
volume ratio media and the mechanism of plasma propagation through such media is
needed.
To date, the underlying physics of micro-plasmas is not well understood.5 Such
discharges have demonstrated the capacity to increase the conversion efficiency of
chemical processes while being inherently non-thermal and controllable. Scale up will
require an understanding of the propagation mechanism of these discharges. Tu et al
published a comprehensive study on discharge sensitivity to aggregate morphology in
packed bed DBDs.6 They also reported on power sensitivity and discharge evolution as
inferred optically. Tu also investigated the effect of packing materials on a helium gas
feed packed bed dielectric barrier discharge at atmospheric pressure. 7 Their work
concluded that solid packing led to a multiple current-peak effect that was ascribed to the
enhancement of charge density on the pellet surfaces. The combination of the solid
aggregate and plasma additionally had a weak effect on electron temperature and density
within the discharge.
1.2 Scope of Thesis The goals of this dissertation are to improve the fundamental understanding of
plasma-surface interactions of micron size discharges through aggregate material. An
expansion of the physics involved in micro-plasma formation and propagation is
investigated in two- and three-dimensional aggregate media with time-resolved imaging
and spectroscopy. Employing a fast camera provided visual observations that were
related to the localized plasma physics such as Meek’s criterion and localized field
enhancements. This dissertation expands upon the previous works by identifying the

3
transient filamentary micro-discharges and surface ionization waves based upon location,
pressure, and localized field enhancement of a two-dimensional packed bed reactor.
These observations were compared to a miniature 3-d packed bed reactor for validation
of the 2d results. With these characteristics identified, further investigation was
performed to identify the species populations within the regions of interest. The
importance of differing propagation modes was investigated in an agricultural application
(seed aggregate) and how it affected contact angle and water absorption. This work
ultimately, provides insight into a laboratory scale growth application of biological
organisms.
Chapter II introduces the history of packed bed reactor discharges and micro-
plasma formations. The chapter also discusses basic theory of plasma physics of packed
bed reactors. A great deal of insight may be found via investigations of the current and
voltage plots, time-resolved imaging with known distances, and optical emission
spectroscopy techniques. These methods are utilized in this dissertation and discussed in
detail. The discussion here focuses on packed bed reactor discharges, streamer
formation, and electric field enhancement effects.
Chapter III presents the time-resolved emission and imaging measurements used
to understand the discharge formation and propagation in a 2-dimensional cell. Modeling
is computed using commercially available ANSYS:Maxwell and the solver nonPDPSIM.
The system is investigated as a function of dielectric constant, voltage, pressure, and the
presence of catalytic particles. Characterization involved time-resolved imaging,
utilizing an iCCD camera and software image analysis that characterized two discharge

4
modes. The results of this section are compared to a custom-built miniature three-
dimensional packed bed reactor for validation.
Chapter IV details the evolution of plasma-generated species with inorganic and
organic aggregate media in the 2-dimensional cell. The evolution is characterized
utilizing an optical emission spectroscopy system. The findings presented in this chapter
are presented as a function of time and location within the cell as the nanosecond pulsed
discharge travels through the aggregate. The relationship between the species produced
and physical aggregate properties is discussed at characteristic locations in the 2D cell.
The locations of study were near a positive electrode, negative electrode, and the gap
between dielectric-to-dielectric media.
Chapter V provides comparative insight into discharge formation and propagation
in organic and inorganic material. The time-resolved imaging experimental campaign
presented in Chapter III was reproduced within this chapter. The organic material
revealed similar, yet differing transients due to surface effects and provides fundamental
knowledge into future applications for the treatment of biological organisms.
Appendix A expands on Chapter V with an application focus. It is essentially an
introduction to such an application of micro-plasmas within a packed bed reactor with
seeds of the soybean plant as the aggregate. The effect of plasma treatment of seeds
(organic aggregate in a packed bed) was assessed by characterizing the seeds post
treatment. Here plasma effects on seed physical properties as well as germination rates,
root development, and shoot growth are quantified. Studies shown in this portion of the
dissertation allude to the application of plasma science on agricultural technology.

5
1.3 The Impact of the dissertation findings The ultimate goal of research into micro-plasma discharge is to manage the high
current density plasmas with surfaces to enhance and manipulate the formation of a
product. Plasma interactions between dielectric aggregate and interstitial spaces are
complex. Understanding how the plasma forms and spreads throughout these media
provides insight into mechanisms to control the chemical pathways of gas flowing
through the aggregate media. These findings may be directly applied to plasma-aided
combustion.
1.4 Experimental Set up
1.4.1 2-dimensional cell A two-dimensional packed bed reactor was utilized to allow for direct imaging of
plasma propagation along dielectric surfaces and through interstitial spaces thus
providing insight into plasma propagation through packed bed discharges. In three
dimensions, the overlapping layers prevent direct imaging of discharge evolution from
within as they progress through the media. The two dimensional reactor that was chosen
allowed for top-down visual inspection between two, stacked quartz plates with a 2.54
cm x 2.54 cm x 0.375 cm reaction well. The quartz plates were designed within
Solidworks and with the drawing shown below in Figure 1-1. The plates had horizontal
holes drilled into them to allow for pin electrodes to be mounted as well as feedstock gas
and vacuum lines. Holes were on the order of 1.5875 mm with the electrodes and
vacuum lines sealed into place with Apiezon Torr-seal putty. A 3 mm thick gasket was
placed in between the quartz plates to ensure a vacuum seal for the sub-atmospheric
experiments.

6
Figure 1-1: SolidWorks schematic of the lower quartz plate utilized in the 2-dimensional experimental setup. Imperial
unit dimensions are used in the Solidworks drawing as the manufacturing company required them. The cell was coupled to a vacuum chamber for evaluation. The base pressure of
the chamber was 2.5 x 10⁻⁵ Torr. The 2-dimensional cell was connected with the Inficon
PCG500 (Pirani capacitance manometer gauge) recording a pressure down to 500 mTorr
within the reaction chamber cell. Not shown in Figure 1-1 are four vertical through-
holes near each of the corners of the quartz plates. The holes were made so that nylon
bolts may be inserted and tightened down creating a seal with the gasket.
The 2-dimensional quartz plates and mounting structure was enclosed in a light
tight enclosure to prevent the intrusion of ambient light during imaging. Images were
acquired using an Andor iStar 334T intensified charge coupled device (iCCD) camera.
The electrodes were set up with a pin-to-planar configuration and are discussed in more
detail in Chapter III of this text.
1.4.2 Optical Emission Spectroscopy An investigation of the 2-dimensional setup also included the use of a Princeton
Instruments Acton 2300 Spectrometer coupled with a Pi-MAX3 camera. The collected

7
spectra were analyzed in WinSpec32 software. The spectra were taken at three points of
interest for inorganic and organic material. The collected emission was over a 10 ns
timeframe that allowed for time-resolved evolution of the discharge and species produced
at each of the various locations.
1.4.3 3-dimensional packed bed reactor The 3-dimensional plasma packed bed dielectric barrier discharge reactor was
constructed out of a pyrex tube with stainless steel conflate terminations. The Larson
Electronic’s glass tubing that was ≈ 20.32 cm in length with a standard 1.33” stainless
steel conflat flange attachments on either end of a ≈ 15 cm glass portion. End caps were
designed via Solidworks drafting and 3d printed at the University of Michigan CAEN 3d
printing laboratory. The electrodes were placed in a coaxial design with a central
stainless steel rod of diameter 2.5 mm and a copper mesh electrode enveloping the central
7 cm of glass tubing to act as the negative high voltage terminal. An example of the 3-d
PBR with soybean seed as the aggregate material is shown in Figure 1-2.
Figure 1-2: An image capturing the 3-dimensional packed bed reactor filled with soybean aggregate. The packed bed reactor also had 3d printed ‘plugs’ that could be inserted into
either end of the reactor as 1.5 cm segments. These were printed and implemented to

8
ensure that the aggregate material was held within the region of plasma formation. The
plasma formation within the tube occurred throughout the region within the volume
enclosed by the outer copper mesh that served as the grounding electrode. Therefore,
aggregate was kept slightly within the edges presented by the copper mesh via the plug
inserts.
1.4.4 Aggregate material A range of dielectric aggregate both organic and inorganic was explored in this
work. The 2-dimensional cell experiments utilized zirconia, quartz, and soybean seed.
The 3-dimensional cell efforts involved silicon nitride spheres and soybean seed.
1.4.5 Organic material The interaction of low-temperature plasma with organic media is of great interest
in emerging applications such as plasma medicine and agriculture. However the
mechanisms involved here are very poorly understood and therefore an organic material
such the Gylcene max or commonly known as the soybean was investigated.
1.4.6 Joint modeling efforts Computational modeling performed using nonPDPSIM was carried out by Juliusz
Kruszelnicki and supported the experimental effort. The computational experiments
provided insight into underlying physics of discharge formation and propagation in the
2D cell. Fields in the 2D cell were also modeled using the commercially available
software ANSYS: Maxwell.
1.5 Scope of Dissertation The scope of this dissertation provides insight into the nature of discharge
propagation through dielectric media with direct insight into packed bed discharges,
including the effect of dielectric constant of aggregate material, packing fractions,
9
aggregate morphology, and pressure. The effort also provides insight into application
areas such as plasma agriculture. The report provides observation of the propagation
mode of the discharge as it spreads throughout the dielectric media including species
produced based on location and time of the pulse. The effort utilizes numerical
experiments to gain insight into experimental observations as well as guidance for
experimental direction.

10
Chapter II
Micro-Plasmas in Porous Media with Applications to Agriculture: Current Status and Questions to be Answered
2.1 Introduction to micro-plasmas, dielectric barrier discharges, and packed bed reactors
The application of filamentary microdischarges dates back to the work of Siemens
who developed dielectric barrier discharges for ozone generation in 1857.8 Although he
did not invent the technology, he was the first to apply it. This apparatus was developed
for water treatment. Presently, modern ozonizers are used in water treatment facilities
around the world as a form of advanced oxidation. 9 Dielectric barrier discharges feature
electrodes in which at least one is covered or obstructed by a dielectric layer. In
Siemen’s apparatus, air was passed through the annular gap between a central powered
electrode and ground, separated by a glass tube. The electrodes powered by alternating
high voltage generated the time dependent microdischarges. The air chemistry driven by
the plasma is a copious producer of ozone. The dielectric barrier plays a key role in
preventing the discharge from developing into an arc. In fact the peak current and thus
charge transferred during an active microdischarge is dependent on the capacitance of the
apparatus. The barrier therefore prevents the discharge from thermalizing by limiting “on
time” as well as protects the electrodes from erosion both plasma chemistry driven and
sputtering.10 The discharge is non-equilibrium with electrons of mean energies of a few

11
eV and the ions and background gas with temperatures of order 300 K. A typical
configuration of an ozonizer is shown in Figure 2-1. These dielectric barrier discharges
or DBDs have many applications ranging from gas lasers, to plasma displays, to lighting
to the surface modifications of polymers.
Figure 2-1: Diagram representing a typical layout of a technical ozone generator.4
Dielectric barrier discharges can be configured in many ways as shown in Figure
2-2. Discharge gaps are generally on the order of 0.1-10mm. DBDs and other
atmospheric plasma sources generally require high voltages for discharge operation,
historically with most operating with AC high voltage in the kHz-range. In recent years,
pulsed power systems are currently being investigated. 11 Much of this thesis work
features pulsed power. The sub-microsecond pulses have also been investigated featuring
two breakdowns per pulse–occurring at the rising edge and falling edge of the voltage
pulse.12 It has been shown that the secondary pulse can be attributed to accumulated
surface and space charges left by the primary discharge.13

12
Figure 2-2: Basic planar configurations of DBDs: (a) volume DBD (1-symmetric, 2-symmetric, 3-floated dielectric);
(b) surface DBD (1-symmetric, 2-asymmetric ‘actuator’ design); (c) coplanar discharge.8 Electrical diagnostics of DBDs and packed bed reactors can be studied as a
lumped-element equivalent circuit. The typical method of power deposition into DBDs
powered by a low frequency, AC source utilizes the Lissajous method otherwise known
as a Voltage-Charge (V-Q) plot. This approach to the characterization of DBDs was
introduced by Manley14 The reader is referred to this work as well as a review by Pip and
Brandenburg for an extensive review of the classical theory and recent developments in
the diagnostics of dielectric barrier discharges using the QV method.15 This method has
gained more accurate representations as improvement of experimental techniques and
diagnostic equipment are developed. A typical QV-plot results in a parralellogram but
new types of QV-plots are seen and may not be explained by classical theory. An
example of a parallelogram taken from a sinusoidal voltage-driven ozonizer is shown in
Figure 2-3. The classical theory is based upon measurements of applied voltage V(t),
current waveform i(t), and charge as a function of the applied voltage Q(V). The charge

13
as a function of time may be found as an integral of the measured current waveform or
can be measured as a voltage drop V0(t) across a given capacitor C0.
Equation 1 𝑄𝑄(𝑡𝑡) = 𝐶𝐶0𝑉𝑉0(𝑡𝑡)
The charge may also be measured via capacitance and leave a parallelogram as
seen in Figure 2-3 (a). Each side of the shape corresponds to one of the discharge phases
with the power averaged over the period T, resulting in:
Equation 2
𝑃𝑃 = 1𝑇𝑇� 𝑄𝑄(𝑉𝑉)𝑑𝑑𝑉𝑉𝑇𝑇
When the cell does not have an ignited discharge, it behaves as a capacitor, Ccell,
and can be represented as a serial connection of capacitances associated with a gas gap Cg
and dielectric barriers Cd. When the discharge occurs, the plasma connects the electrodes
and the dielectric barriers determine the capacitance.
Equation 3
𝐶𝐶𝑐𝑐𝑐𝑐𝑐𝑐𝑐𝑐 =𝐶𝐶𝑑𝑑𝐶𝐶𝑔𝑔𝐶𝐶𝑑𝑑 + 𝐶𝐶𝑔𝑔
Figure 2-3: Diagrams representing the classical QV-plot on a plasma system with the equivalent circuits represented in
(b) with plasma on and plasma off phases.15

14
Another important diagnostic tool is optical emission spectroscopy (OES). OES is
a noninvasive diagnostic that provides insight on plasma parameters such as density,
effective electron temperature, gas temperature, equilibrium state and excited state
distribution. While the diagnostic is relatively straightforward to implement, usually a
model is required to interpret the emission spectra collected. Typically a collisional
radiative model is required to assess the average electron temperature. The model takes
into account the various excitations and ionization processes prevailing in the plasma and
allows for the generation of synthetic spectra. By fitting this synthetic spectra to the
observed corrected emission spectra, one can determine the electron temperature. Here
the electron temperature is the adjustable parameter to facilitate the fit. If one assumes
the plasma is in local thermal equilibrium where electron collisions drive a detailed
balance wherein excitation and deexcitation is driven by electron impact, then it is
possible to estimate the electron temperature via a so-called Boltzmann plot:
Equation 4
ln �𝐼𝐼𝑘𝑘𝑘𝑘𝜆𝜆𝑘𝑘𝑘𝑘𝑔𝑔𝑘𝑘𝐴𝐴𝑘𝑘𝑘𝑘
� = ln �ℎ𝑐𝑐𝑁𝑁𝑜𝑜𝐿𝐿
4𝜋𝜋𝜋𝜋� −
𝐸𝐸𝑘𝑘𝑘𝑘𝐵𝐵𝑇𝑇𝑐𝑐
where Iki is the measured intensity, 𝜆𝜆𝑘𝑘𝑘𝑘 is the wavelength, gk is the degeneracy, Aki is the
Einstein coefficient, h is Planck’s constant, c is the speed of light, L is the optical length
of the plasma, No/Z is a constant, Ek is the energy of level k, kB is the Boltzmann
constant, and Te is the electron temperature. The electron temperature is determined from
the slope of a plot of the corrected intensity versus level energy. In most atmospheric
pressure plasmas, local thermal equilibrium does not prevail and thus this method can
only be used to assess qualitative trends. Figure 2-4 depicts a Boltzmann plot for a neon
plasma.

15
Figure 2-4: Atomic Boltzmann line plot for neon gas.
The line-ratio technique is based upon experimental excited levels and the CRM
is employed to generate a line of best fit. The line of best fit is chosen by inputting
discharge parameters, gas temperature, and species involved. These techniques are
discussed in detail by Zhu et al.,16 A selection of using the various line ratio methods is
dependent upon the pressure and ionization ratio and the reader is referred to Zhu’s work
for an in-depth review beyond the scope of this work.
2.2 Brief overview of experimental efforts to date One common dielectric barrier discharge (DBD) is the packed bed reactor
(PBRs). Such a configuration consists of dielectric aggregate between electrodes. The
configuration is ideal for the treatment of process gases. 17 These systems generally
utilize a DC (direct current), AC (alternating current), or a nanosecond-pulsed power
source in order to generate plasma. The electrical geometry of dielectric barrier
discharges is generally configured either coaxial or planar. The coaxial setup consists of
a central, rod electrode and a mesh electrode on the outside of a dielectric tube usually
glass or quartz. A diagram representing a packed bed reactor is shown in Figure 2-5.18

16
Figure 2-5: Diagram representing a common setup style for a packed bed dielectric barrier discharge reactor.
The space between the rod and the inner wall of the tube is filled with dielectric
aggregate. Upon application of high voltage, the field is enhanced near the bounding
surfaces of high K dielectric aggregate. When the field satisfies the Meek’s Criterion19,20
the streamer mechanism persists but is typically terminated prematurely owing to
discharge contact with bounding dielectric surfaces.
A planar packed bed DBD reactor consists of plate electrodes whose inter-
electrode gap is filled with dielectric packing aggregate. Process gas flows through the
interstitial spaces and is treated by the plasma discharge in those regions. Whether
cylindrical or planar, conversion efficiencies are enhanced not only due to plasma
chemistry driven in the interstitial spaces but also due reactions catalyzed on the surface
on the aggregate by the plasma and high fields there.21 Figure 2-2 represents variations
of basic planar configurations taken from Brandenburg’s work.
Tu and colleagues compared DBD reactors with and without aggregate (alumina
in this case).22 They found that the number of current peaks tripled over the frequency of

17
30-70 kHz whenever aggregate was in the reactor. Not only were the current spikes
higher but also the average temperature within the reactor was 5-10 °C lower at the same
input power when aggregate was presented. Additionally they reported that the average
electron density was ≈ 2x greater than without the packing aggregate.
Modeling and experimental efforts show opportunities for manipulation of
streamer formation and propagation as well as surface ionization waves based upon the
dielectric aggregate used as the packing medium. For instance, Butterworth, Elder, and
Allen demonstrated that the particle size of Al2O3 (aluminum oxide) and BaTiO3 (barium
titanate) had an effect on the reduction of CO2. 23 They showed that the highest
conversion was found with Al2O3 aggregate particles with characteristic sizes ranging
between 180-300 µm. Nguyen et al studied DBDs as a function of relative humidity for
the decomposition of toluene and CO2 selectivity. 24 A reaction chamber’s relative
humidity of 20% was determined to be ideal. The complexity of the reaction kinetics was
shown with the differing specific energies with higher energies generating higher
densities of ozone and limiting the desired reactions. In addition to traditional DBDs,
adding packing aggregate such as glass beads has been shown to have an effect on the
waste conversion.25,26
Butterworth and Allen attempted to isolate dielectric aggregate effects by
simplifying the packed bed reactor to a single spherical pellet, placed between two planar
electrodes within a quartz glass reactor. 27 Discharge morphology and power dissipation
were studied as a function of dielectric constant. The equivalent circuit model is for this
system is relatively straightforward. Once again, the discharge cell capacitance can be

18
described by equation 5 where the capacitance of the cell Ccell, the capacitance of the
dielectric material Cdiel, and the capacitance of the gap Cgap:
Equation 5 1
𝐶𝐶𝑐𝑐𝑐𝑐𝑐𝑐𝑐𝑐=
1𝐶𝐶𝑑𝑑𝑘𝑘𝑐𝑐𝑐𝑐
+1
𝐶𝐶𝑔𝑔𝑔𝑔𝑔𝑔
A representation of the equivalent circuit is shown in Figure 2-6 with the Q-V
plot. The group was able to show that discharge ignition occurred at lower voltages with
higher dielectric constant media. This dependence is attributed to the enhanced E field
with the higher K materials.
Figure 2-6: Classic equivalent circuit model shown by Butterworth et al. in their work.
This effort also correlated discharge morphology energy consumed per cycle with
applied voltage. They were able to identify a number of discharge regimes and the
associated transitions to these regimes. These variations are depicted in Figure 2-7.
Figure 2-7: Discharge across ytrrium stabilized zirconia pellet as a function of the applied voltage.27

19
This work suggests that it is important to identify the type of discharge prevailing
in the cell if ones goal is to optimize overall discharge performance to include surface
catalysis augmented by the plasma.
2.3 Review of 0-D, 2-D, and 3-D kinetic modeling of microplasma systems Packed bed DBDs are numerically simulated using a number of approaches.
These models include 0-D, 1-D, 2-D, and 3-D types. The zero dimensional model
ZDPlaskin is a plasma kinetics solver.28 The model uses BOLSIG+ to solve the electron
Boltzmann equation:
Equation 6 𝜕𝜕𝜕𝜕𝜕𝜕𝑡𝑡
+ �⃑�𝑣 ∙ ∇𝜕𝜕 −𝑒𝑒𝑚𝑚𝐸𝐸�⃑ ∙ ∇𝑣𝑣𝜕𝜕 = 𝐶𝐶[𝜕𝜕]
where f is the electronic energy distribution function (EEDF), v is the electronic speed
vector, E is the electric field vector, C[f] accounts for changes in f due to collisions, e is
the electron charge, and m is the electron mass.28 The electronic Boltzmann equation is
then coupled to a kinetic model describing the state of the plasma mixture. Species
concentrations are then iteratively updated as a function of time-steps and provide insight
into overall population densities.
Two-dimensional models are advantageous because they provide spatial and
temporal insight into plasma production, propagation, and species production without the
expensive efforts of 3-dimensional modeling. Within 2-D models, Poisson and Vlasov
equations are solved in a steady state in an iterative process. 29 In some cases many
assumptions about the plasma is made in order to simplify the computational load on the
plasma. This work is complemented by a 2d model called nonPDPSIM developed by
Mark Kushner, which is discussed in some detail in Chapter III.

20
Bogaerts and colleagues have also developed a 2D axisymmetric fluid model
using the COMSOL Multiphysics Simulation platform.30 Model results from this group
agrees well with experimental findings described within this dissertation such as streamer
propagation, localized electric field enhancements as shown in Figure 2-8, and
filamentary micro-discharges and surface ionization waves.32
Figure 2-8: Planar view of the localized electric field enhancement in a packed bed reactor for a dielectric constant of
5.36 Their work also included comparison between various packing fractions. The
simplified model only employed a list of 23 reaction mechanisms with the helium gas.31
Within this work a ‘contact point model’ was investigated in which some of the dielectric
beads were physically touching. It was found that wherever the pellets are in direct
contact plasma formation and propagation was no longer favorable. Therefore plasma
forms in the region in between the pellets where electric field enhancement is still high
but the gap distance between the beads is enough for Paschen’s Law to be satisfied and

21
plasma formation occurs. Their findings involving the gap formation with contacting
beads is shown in Figure 2-9.
Figure 2-9: Electron density at the moment of breakdown, time averaged electron density, and time averaged total ion density computations from the COMSOL multiphysics 2d modeling effort from Van Laer and Bogaerts.
In regards to the packing fraction study carried out by this group, it was found that
a higher packing fraction had a higher localized electric field enhancement with the
smaller beads as to be expected. The localized electric fields resulted in higher electron
densities throughout the media but were also dependent upon the applied voltage and
dielectric constant value. Typical results are shown in Figure 2-10 for a series of
dielectric beads.

22
Figure 2-10: Plots from Van Laer and Bogaerts that show the influence of dielectric constant on the space- and time-
averaged electric field strength, electron temperature, and electron density. Their work is introduced here to the reader for work that agrees with the
experimental findings in this report. The computations performed were independent of
any collaboration with the experimental work presented here but are an additional source
that provides insight into the findings reported.
2.4 The synergy enigma of plasma-catalytic systems Because PBRs feature dielectric aggregate in contact with plasma, such systems
have potential applications in catalysis. Plasma catalysis features the interaction of
plasma with catalytic particles (such as platinum, gold, or silver) embedded in the
dielectric aggregate to enhance reactivity in the input feed or process gas. Under such
conditions enhanced reactivity is observed. These processes remain poorly
understood.32,33 Chung et al.,34 performed the dry reforming of methane within such a
reactor using a hybrid plasma catalytic system. In this case, a photocatalyst was used
resulting in a 42% enhancement from 13.0 to 18.5 mol per kilowatt-hour in syngas
generation. Apparently the plasma enhanced the lifetime of the surface structure of the
photocatalyst. This means that the plasma was able to decrease particle build-up on the
reactor that would otherwise cover the catalytic particles in a non-plasma system.

23
Non-thermal plasma catalysts have also been investigated for the reduction of
NOx and diesel particulates in engines as well.35,36,37 Catalytic abatement of volatile
organic compounds has also been investigated with toluene as the model compound.
Subrahmanyam et al showed that the implementation of a Mn and Co on the electrode
gave rise to CO2 selectivity being 80% and 100% conversion of the toluene input to a
CO2 output.38 Indeed, in this work, it was found that the energy cost was only 235 J/l for
complete conversion of 100 ppm of toluene using plasma in comparison to the ~1000 J/l
required using conventional thermal destruction methods. This of course assumes the
reactors can actually scaled for industrial process levels.
Kim and Ogata investigated non-thermal plasma catalyzed decomposition of
volatile organic compounds or VOCs.39 In this work, gas chromatography (GC) and
Fourier Transform Infrared analysis (FTIR) was used to assess the decomposition of
benzene and toluene. Zeolite pellets impregnated with silver nanoparticles were utilized
in this work. It was found that metal nanoparticles enhanced the carbon balance and CO2
selectivity. The observed reactivity and associated selectivity was dependent upon the
type of metal nanoparticles chosen suggesting that further optimization was possible.
2.5 Application of PBRs and Micro-plasmas To Environmental Problems The work discussed in this thesis provides insight into the discharge propagation
and formation mechanisms, species produced via inorganic and organic discharges, as
well as applications to agriculture. DBDs have the potential to greatly impact the way
chemicals are synthesized as well as remediated post-use. These applications are now
being investigated in diverse areas such as plasma-aided combustion, plasma medicine,
and plasma agriculture.40,41 DBDs and PBRs are a potentially scalable technology and

24
the goal of this thesis is to contribute to advancing our knowledge base on this discharge
type so that these applications are one day realized.
This work hopes to address a number of questions regarding PBR operation. For
example, how do these plasmas form and propagate in various media as a function of
voltage, pressure, intrinsic material properties, and frequency? How do catalytic
components effect these mechanisms? Are these characteristics able to be manipulated
for reaction selectivity and application efficiency? What happens to organic material in
contact with plasma in PBRs? Does plasmas damage the surface of aggregate material?

25
Chapter III
2-Dimensional Cell: Classification of Discharge Formation and Propagation
3.1 Experimental Approach Plasma formation propagation in a 2-dimensional array of dielectric elements was
studied using an iCCD fast-camera imaging and a computational model. A schematic of
the experimental apparatus is shown in Figure 3-1. Dielectric aggregate is sealed
between two quartz plates 6.35 mm in thickness. One plate contains a recessed area to
accommodate the dielectric disks and the electrodes. The plates make contact with the
quartz, which prevents plasma propagating over the dielectric plates, thus constraining
the plasma to through the dielectric media.

26
Figure 3-1: Experimental setup for the time-resolved microdischarge analysis. (a) Schematic of apparatus. (b) Overhead
view of reaction chamber with media. An array of seven dielectric disks consisting of either quartz (5 mm in diameter
and 3 mm thick) or zirconia (6.2 mm in diameter and 3.5 mm thick) was studied in this
investigation. The dielectric media, which was arranged in a hexagonal array with a span
of 20 mm, was located between two metal electrodes configured in a pin-to-plane
configuration as can be seen in Figure 3-2.

27
Figure 3-2: Hexagonal pattern of dielectric disks in a pin-to-planar electrode setup (a) quartz (5 mm diameter), (b)
zirconia (6.1 mm in diameter). The hexagonal configuration mimics the highest packing fraction layout of
spherical beads in a 3-D PBR. The pin electrode was a 2 mm diameter molybdenum rod
and planar electrode was a 25 mm wide x 4 mm thick copper plate. The quartz disks had
a dielectric constant of εr=3.8. For this study, the dielectric constant of the zirconia disks
were determined via a resonant post technique described elsewhere.42,43 The measured
dielectric constant for the zirconia disks was εr=26.6±0.24 at 6.2 GHz. For the quartz disk
arrangement, the average disk center to center spacing was 6 mm with a minimum gap of
≈1 mm. For the zirconia disks, the center to center spacing was 7.2 mm also with a
minimum separation of ≈1 mm. The geometrical placement of the dielectric disks
determines the initial spatial distribution of the electric field in the gaps between the
disks.44,45,46 For example, the vacuum electric field distribution is shown in Figure 3-3
for the 2D-PBR with quartz and zirconia disks for an applied voltage of 20 kV. The
electric field was using ANSYS: Maxwell, a commercially available electrostatic field

28
solver. Electric field enhancements naturally occur at the poles of the disks due to the
presence of induced surface charge associated with polarization of the dielectric disks.
Figure 3-3: Simulated vacuum electric field within ANSYS: Maxwell for applied voltage of 20 kV in the 2D-PBR for
(top) quartz (ε/ε0=3.8) and (bottom) zirconia (ε/ε0=26.6). The electric field is essentially refracted into regions of reduced dielectric
strength—the interstitial spaces. Although additional field enhancement can also occur
due to surface roughness, the disks in this study were relatively smooth, with a surface
roughness on the order of few tens of microns as determined by manufacturing
specifications.
The pin electrode was biased to high voltage using an isolated output, high
voltage pulser [Eagle Harbor Technologies Nanosecond Pulser -120 (EHT NSP-120)] as

29
shown in Figure 3-1(a). The voltage pulse used for operation at 1 atm had a peak
amplitude of 20 kV DC and a pulse-width of 120 ns. For sub-atmospheric pressure tests
(200 Torr to 1 Torr), 12 kV DC, 120 ns wide pulses were used. A Tektronix P6015A
High voltage probe was used to acquire voltage measurements. A current transformer
(Pearson Model 6585) was used with a Tektronix MDO 3024 Mixed Domain
Oscilloscope to measure current. The discharge was imaged using an Andor iStar 334
ICCD camera fitted with a microscope lens of 2.5× magnification that captured images
with a 5 ns integration time.
The discharges were single shot with each image corresponding to a single
applied voltage pulse. Using a delay generator, one can vary the position of the ICCD
camera’s trigger pulse relative to the time of application of the high voltage pulse thereby
facilitating time resolved imagery, albeit on separate pulses. The initial time, t = 0, is the
instant at which the power supply delivers voltage to the electrodes, which occurs ≈335
ns after the power supply is triggered as there is an inherent time delay in the power
supply and lines. Images were acquired on successive discharge pulses with additional
delay of 5 ns to generate a time sequence of discharge formation. This process proceeded
until emission from the cell was no longer distinguishable from the background. The
2.5× magnification lens provided a resolution of 5.6 microns/pixel. A macro lens
providing a resolution of 127 microns/pixel was used to study discharge propagation over
the entirety of the dielectric array. The camera was enclosed in a Faraday cage to
minimize electromagnetic interference (EMI) generated by the power supply and
discharge.

30
3.2 Modeling within ANSYS:Maxwell In order to gain a greater understanding of the electric field enhancement due to
the dielectrics, a commercially available software ANSYS:Maxwell was implemented.
The software is an electromagnetics solver that in this case the expected electric field as a
function of position. This field is determined by the geometry of the system, applied
voltages, and the materials chosen within the model. For our investigations, the 2-
dimensional cell was modeled as well as a 3-dimensional packed bed reactor with
varying dielectric constant and packing fraction.
3.2.1 The 2-dimensional cell The expected electric field enhancement effects between the quartz and zirconia
dielectric disks as a function of the dielectric constant was determined with an identical
setup within the ANSYS:Maxwell software. The exact dimensions of the 2d cell were
constructed with a 20 kV potential applied to the system, identical to the atmospheric
pressure cases. Although the quartz and zirconia disks are slightly different in diameter,
simulations were performed utilizing the dielectric constant values of each material at
each of their respective sizes as well as identical sizing. Figure 3-4 are the results of the
simulations involving the different dielectric constants at the differing sizes. One can
easily see that at each size, when directly comparing the quartz electric field enhancement
to the zirconia electric field enhancement, that the higher dielectric constant value of 26.6
for the zirconia significantly improves the localized field. When examining the simulated
electric field strength map of Figure 3-4, the ‘red’ coloring represents the electric field
strength that is equal to or higher than the breakdown condition in air of 4 x 10⁴ [V/cm].
The zirconia dielectric simulations in Figure 3-4 (a) held maximum field strength of
greater than 7 kV/cm near the electrodes at the larger size. The quartz localized field

31
enhancement had only reached a peak value of near 4kV/cm at the pin electrode but only
2.6 kV/cm at the planar for the larger size as shown in Figure 3-4 (b).
Figure 3-4: ANSYS:Maxwell simulations of the 2d cell geometry with quartz and zirconia being modeled as a
changing dielectric constant value. The results are with identical sized of the disks although the experiment holds slightly differing sizes. The simulation utilized a 20 kV potential.
Two additional cases were also simulated with titanium dioxide (ε/ε0 = 80) and
barium titanate (ε/ε0 = 1000) with ε/ε0 being set as this value as the barium titanate
material dielectric constant value may vary greatly depending on purity and
manufacturing processes. The case with the titanium dioxide continued to increase the
localized field enhancement with 4 kV/cm being satisfied throughout the aggregate at
each interstitial location and had a maximum of 8 kV/cm near the electrodes. The final
case involving barium titanate had shown further increase with more volume satisfying
the 4 kV/cm breakdown condition. The maximum localized field enhancement with the
barium titanate was found to be only slightly above that of the titanium dioxide with a
value approximately being 8.5 kV/cm. These results when comparing the higher
dielectric constant values (80 and 1000) suggests that there is a saturation limit to the
localized field enhancement effects which is most likely geometry and material
dependent. The increase in localized field with the higher dielectrics more easily
promote plasma breakdown in these interstitial regions as well as the electrodes. Thus, it

32
is not unreasonable that the zirconia dielectric disks allow FM formation within the
interstitial spaces at a lower voltage value as well as provide more optically intense
emissions than the images involving quartz as the dielectric.
The simulation results and the experimental findings of the 2d cell provide insight
into the manipulation of plasma formation and propagation using dielectric materials.
Although the system is only 2d here, it allowed for direct optical imaging without the
interference of overlaying media that would increase the difficulty of image analysis.
Results from the ANSYS:Maxwell simulation provided insight to the electric field
enhancement effects due to the dielectric media. Future interesting work may involve a
greater range of dielectric constant values in order to try and generate a ‘guided plasma’
through the media. For instance, two planar electrodes separated by some distance that
has been filled with a low value dielectric material. Then a strong dielectric material
“path” may be placed throughout the aggregate media in order to promote a higher
localized field enhancement and therefore “guide” the plasma on a preferred path
throughout the discharge region.
3.2.2 The 3-dimensional packed bed reactor The first proof-of-concept model that was implemented for the 3d PBR is that of a
dielectric barrier discharge reactor without any dielectric aggregate medium. The first
simulation was with a 3.175 mm rod electrode that went the length of 25.4 mm diameter
reactor. A 10 kV potential was applied to the center rod with the grounded electrode
being placed on the wall of the reactor. The first case with an empty reactor had shown
an electric field maximum near 2.1 x 10⁴ [V/cm]. This value does not meet the electric
field breakdown requirement of 4 x 10⁴ [V/cm] in atmospheric air conditions. The
second case implemented 6.35 mm silica glass sphere with a dielectric constant of 3.78,

33
provided by the Maxwell software, placed between the central rod electrode and the outer
electrode. Figure 3-5 is a side-by-side comparison of the solver solution data set with the
electric field strength plotted as a function of the color gradient. One can see that with
the dielectric spheres implemented, greater electric field strength is seen throughout the
volume. Additionally, utilizing the same scale, one can see the vast increase in the
volume in which the electric field strength exceeds the breakdown criterion.
Figure 3-5: ANSYS:Maxwell simulations showing the electric field strength in the reactor without aggregate(a) and
with silica glass sphere aggregate(b). Therefore, a distinct influence of dielectric material and its localized electric field
enhancement is shown. Although there is electric field strength ‘voids’ in-between the
dielectric spheres in relation to each other, the much higher field strength near the rod
electrode allows for breakdown followed by propagation as seen in the preceding
experimental sections. Moving forward with the simulations, another model was
generated with the same 3.175 mm rod electrode but with smaller spheres of 1.58 mm
and a diameter of 19.9 mm on the reactor. The reason for decreasing the sphere size as
well as the diameter of the tube is to represent a high packing fraction with a structured
porous media (the repeating silica glass sphere structures). Figure 3-6 shows a completed
simulation of this reactor setup with the enhanced electric field at each of the lateral
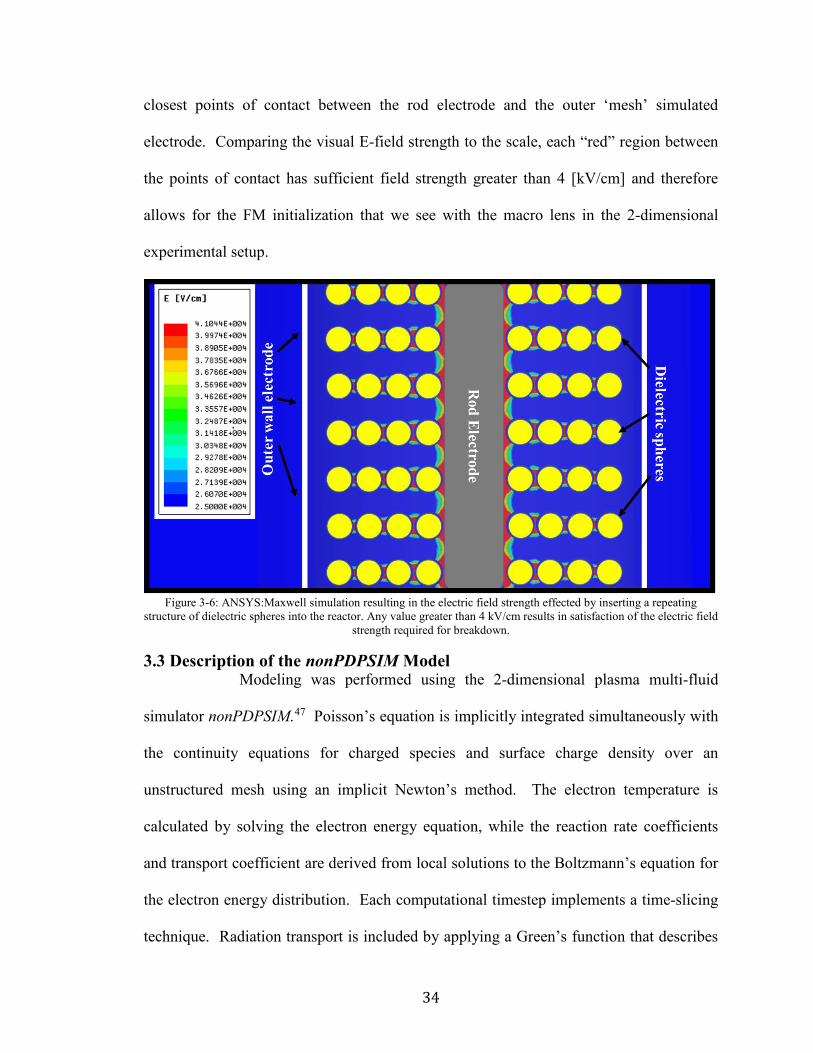
34
closest points of contact between the rod electrode and the outer ‘mesh’ simulated
electrode. Comparing the visual E-field strength to the scale, each “red” region between
the points of contact has sufficient field strength greater than 4 [kV/cm] and therefore
allows for the FM initialization that we see with the macro lens in the 2-dimensional
experimental setup.
Figure 3-6: ANSYS:Maxwell simulation resulting in the electric field strength effected by inserting a repeating
structure of dielectric spheres into the reactor. Any value greater than 4 kV/cm results in satisfaction of the electric field strength required for breakdown.
3.3 Description of the nonPDPSIM Model Modeling was performed using the 2-dimensional plasma multi-fluid
simulator nonPDPSIM.47 Poisson’s equation is implicitly integrated simultaneously with
the continuity equations for charged species and surface charge density over an
unstructured mesh using an implicit Newton’s method. The electron temperature is
calculated by solving the electron energy equation, while the reaction rate coefficients
and transport coefficient are derived from local solutions to the Boltzmann’s equation for
the electron energy distribution. Each computational timestep implements a time-slicing
technique. Radiation transport is included by applying a Green’s function that describes

35
the emission and absorption of ionizing radiation from each node to other nodes within
the line-of-sight. All ions were assumed to neutralize on surfaces, and secondary electron
emission from dielectric surfaces was accounted for with the emission coefficient of
γSE=0.1. All ions incident on the surfaces were assumed to recombine, and were returned
to the gas-phase. This results in charging of the surface of dielectric materials, which is
then included in the solution of the Poisson’s equation. The simulation is operated at 1
atmospheric conditions and lower. For the 1 atm, charged particle transport is
represented by drift-diffusion provided by the Sharfetter-Gummel fluxes. Local solutions
to the Boltzmann equation are then used to derive the rate and transport coefficients as a
function of Te.
The following series of equations represent the work behind solving the charged
particle transport. The electric potential is from Poisson’s equation
∇ ∙ (𝜀𝜀∇Φ) = −(�𝑞𝑞𝑗𝑗𝑁𝑁𝑗𝑗 + 𝜌𝜌𝑀𝑀𝑗𝑗
)
where 𝜀𝜀 is the permittivity, Φ is the electrical potential, qj is the elementary charge, Nj is
the species number density and 𝜌𝜌𝑀𝑀 is the charge on surfaces and materials. In parallel
with this, the calculations are also performed for the density of the materials charges and
charged particles. The equation for charged particle densities is as follows
𝜕𝜕𝑁𝑁𝑗𝑗𝜕𝜕𝑡𝑡
= −∇ ∙ Γ⃑𝑗𝑗 + 𝑆𝑆𝑗𝑗 + [�−𝑚𝑚
∇ ∙ Γ⃑𝑚𝑚𝛾𝛾𝑚𝑚 + �−𝑘𝑘
∇ ∙ 𝜙𝜙𝑘𝑘𝛾𝛾𝑘𝑘]𝑏𝑏
where the charge particle flux Γ⃑ is formulated using the method of Scharfetter and
Gummel. The source (Sj) in this equation is due to collisions. The sums in brackets
apply only to plasma boundary electrons for secondary electron emission by ions. The

36
first sum is excited species and photon flux 𝜙𝜙 with a secondary emission coefficient 𝛾𝛾.
The charge density on and in the materials is solved using
𝜕𝜕𝜌𝜌𝑀𝑀𝜕𝜕𝑡𝑡
= ��𝑞𝑞𝑗𝑗𝑗𝑗
�−∇ ∙ Γ⃑𝑗𝑗�1 + 𝛾𝛾𝑗𝑗�� + �𝜙𝜙𝑘𝑘𝛾𝛾𝑘𝑘𝑘𝑘
� − ∇ ∙ (𝜎𝜎(−∇Φ))
where sigma is conductivity of solid materials. The sums in brackets apply only to points
on the surface of the material. Following the update of the electric potential and charged
particle densities, the electron temperature is updated using
𝜕𝜕𝜕𝜕𝑡𝑡�
32𝑛𝑛𝑐𝑐𝑘𝑘𝐵𝐵𝑇𝑇𝑐𝑐� = 𝑆𝑆𝑃𝑃(𝑇𝑇𝑐𝑐) − 𝐿𝐿𝑃𝑃(𝑇𝑇𝑐𝑐) − ∇ ∙ (
52Γ𝑐𝑐𝑘𝑘𝐵𝐵𝑇𝑇𝑐𝑐 − 𝜅𝜅(𝑇𝑇𝑐𝑐) ∙ ∇𝑇𝑇𝑐𝑐)
where Te is the electron temperature, ne is the electron density, kB is Boltzmann’s
constant, 𝜅𝜅 is the thermal conductivity, Sp is the sources of power, in this case Joule
heating from the electric field, and the collisional losses or gains in energy is represented
by Lp.
The reaction mechanism is of humid air and includes 33 species and 143 reactions
and is a subset of the mechanism first described by Dorai et al.48 Thirty nine electron-
impact reactions were included. These reactions depended on cross-sections based on
local electron temperature. Remainder of the mechanism was between heavy particles,
and included neutralization, charge exchange, quenching, recombination, as well as
formation of NxOy species, hydrogen peroxide, ozone, and water-cluster ions. Species
incident on surfaces were allowed to deposit charge, de-excite and recombine. The
radiation transfer model includes emission of VUV photons from nitrogen singlets
[(N2(b1Π) and N2(b1Σ)]. The cross-sections used for radiation transport were 1×10-18 cm2
for non-ionizing absorption by O2 and N2, 3×10-17 cm2 for non-ionizing absorption by
H2O, and 1×10-19 cm2 for photo-ionization of O2.

37
3.4 Discharge Evolution at Atm. Pressure The evolution of the discharge in the 2-D PBR after each initiating voltage pulse was
imaged in 5 ns increments by adjusting the delay in the trigger pulse to the camera. The
minimum exposure time required to capture sufficient light over the background noise
with low plasma optical emission intensity was also 5 ns. For a given delay, images were
re-acquired 50 times and averaged to account for shot to shot variability in the discharge.
The time between physical acquisitions of actual images was 20 s, which is long
compared to the characteristic charge relaxation time (ms). If there is not a delay
implemented between pulses, charge build-up on the surface of the dielectrics was seen to
affect breakdown initiation. Typical current and voltage waveforms for the study are
shown in Figure 3-7.
Figure 3-7: Electrical waveforms with zirconia disks for a discharge at 760 Torr. (Black) Current (Orange) Voltage.
Discharge evolution over a 40 ns interval at atmospheric pressure with quartz
media is shown in Figure 3-8 for a 20 kV voltage pulse. The voltage pulse was applied

38
between the anode (pin electrode) on the left-hand side of the image and the planar
cathode electrode on the right side. The discharge initiates at the pin anode electrode,
where electric field enhancement is high (see Figure 3-3). The discharge tended to occur
at regions of locally enhanced electric field, corresponding to regions where the dielectric
disks are most closely spaced. At t = 0 (Figure 3-8 (a)), the discharge predominantly forms
between the pin electrode and disks 1 and 7. The discharge in this region transitions from
a FM to a SIW by 15 ns. The propagation of the surface wave leads to discharge
formation around disk 6 by 20 ns. The surface wave formation and subsequent
propagation is associated with FM charge deposition. The deposited surface charge
generates an electric component parallel to the surface that supports this propagation
mode.49 In this manner the discharge travels through the media reaching disk 4, 25 ns
later and finally reaching the cathode electrode by 30 ns. Beyond 30 ns, the discharge re-
intensifies in the form a return stroke, which terminates at the pin electrode after 40-45
ns, as indicated by the localized, intense glow there.
39
Figure 3-8: Time-resolved imaging of the 2D-PBR discharge through quartz disks at 1 atm integrated over 5 ns. (a) 0-5 ns, (b), 10-15 ns, (c) 15-20 ns, (d), 20-25 ns. (e) 25-30 ns and (f) 35-40 ns.
To gain insight into the propagation mechanism, a small region between disks
including portions of disks 3, 4, and 6 was individually imaged with higher resolution.
These time resolved images are shown in Figure 3-9. The discharge enters the field of
view as a SIW at disk 6 in Figure 3-9 (a). As this SIW propagates around disk 6, it
enters into the region of high electric field between disks 4 and 6, leading to the
formation of a microdischarge between the two disks (Figure 3-9 (a)). This
microdischarge and associated charge deposition leads to the formation of a propagating

40
SIW along disk 4 (Figure 3-9 (b,c)). Again, as this surface wave enters the region of
enhanced electric field between disks 4 and 3 (see Figure 3-3), a FM forms between the
disks (Figure 3-9 (c,d)). The surface discharges tend to translate along the surface of the
disks in the general direction of the applied electric field.
Figure 3-9: Time-resolved microscopic imaging of the 2D-PBR discharge in the vicinity of quartz disks 3, 4 and 6 at 1
atm integrated over 5 ns. (a) 0-5 ns, (b), 5-10 ns, (c) 10-15 ns, and (d), 15-20 ns. Time resolved imaging of discharges through zirconia disks (ε/ε0 = 26.6) was also
conducted. Imaging of the entire array is shown in Figure 3-10, and the mode of
propagation, at first, appears to be quite different utilizing a macro lens when compared
to that through the quartz disks. In quartz, the discharge tended to propagate through the
media as an ionization wave where a FM led to formation and propagation of a SIW
propagation, which then seeded a FM when the SIW reached the high electric field region
in the next gap. With zirconia disks, it was more difficult to discern a clear discharge
propagation pattern using the macroscopic lens. Instead with the wide viewpoint, the

41
discharges appeared to be highly localized, occurring largely in regions of high electric
field, which is typically largest between adjacent disks.
Figure 3-10: Time-resolved imaging of the 2D-PBR discharge through zirconia disks at 1 atm integrated over 5 ns. (a)
0-5 ns, (b), 10-15 ns, (c) 15-20 ns, (d), 30-35 ns. (e) 40-45 ns and (f) 45-50 ns. At early times in the zirconia array, a localized discharge occurs between the pin
electrode and disks 1 and 7 (0-5 ns, Figure 3-10 (a)), followed by localized discharges
near the ground electrodes (5-10 ns, Figure 3-10 (b,c)). These discharges are intense,
and concentrated at the poles of the disks where the electric field is the largest. These
microdischarges last for 15-20 ns before charging of the dielectrics reduce the electric

42
field in the gap – akin to a DBD. At later times, FMs appear throughout the media
aligned with regions of intense electric field (Figure 3-10 (c-f)). These discharges decay
over 10s ns, again likely due to charge deposition on the adjacent surfaces, which locally
reduces the electric field. Indeed, by 35 ns, all discharges decay away only to reappear
near the cathode around 40 ns (Figure 3-10 (e,f)). The voltage pulse width of the supply
during these experiments is 120 ns. Once the plasma was seen to travel through the
system at 40 ns, some residual plasma is present throughout the system, which effects the
next pulse at high frequencies. The optical emission intensity of this plasma after the
passage of 40 ns is very low compared to the FM to SIW propagation.
The volume bounded by the surface of three disks (3, 4 and 6) was imaged with
higher resolution, as shown in Figure 3-11. At early times, 0-10 ns shown in Figure
3-11 (a,b), intense localized FM develop in the gaps between adjacent dielectric surfaces.
The microdischarges that bridge the gap between dielectrics gives rise to the formation of
weak emission attributed to surface discharges on disks 4 and 3 at t ≈ 15-25 ns (Figure
3-11 (c,d)) in the general direction of the applied electric field. Therefore, the
propagation modes of the zirconia were similar to that of the quartz with FMs forming
SIWs that eventually lead back to FMs to repeat until the electrode is reached. The
contrast of the FMs with the SIWs when utilizing the macroscopic lens in Figure 3-10
led to only image capturing of the FMs until the microscopic lens was implemented due
to light emission intensity differences.

43
Figure 3-11: Time-resolved microscopic imaging of the 2D-PBR discharge in the vicinity of zirconia disks 3, 4 and 6 at
1 atm integrated over 5 ns. (a) 0-5 ns, (b), 5-10 ns, (c) 10-15 ns, and (d), 15-20 ns. Based on ICCD light intensity counts associated with the observed discharges
(zirconia was nearly an order of magnitude higher than quartz), image contrast, and the
magnitude of the current spikes (4 times greater for zirconia), the microdischarges
imaged for the higher dielectric-constant material were more intense. Once the discharge
develops, charging of the adjacent surfaces will eventually extinguish the microdischarge
across the gap due to the reduction in electric field enhancement. It is not clear why the
more intense microdischarges do not seed equally intense surface discharges. It is
possible that the intense FM collapses the applied electric field locally owing to higher
charge deposition, and that this lower electric field is below the threshold to support
intense SIWs.
The propagation speeds of the SIWs were calculated using image analysis
software to determine the displacement of the SIW over the 5 ns time step. The
propagation speed of the SIWs along the surface of the quartz disks was ≈ 3 × 107 cm/s

44
and ≈ 4 × 107 cm/s for the zirconia disks. These values correspond well with those
reported in the literature. For example, Petrischev et al. investigated formation of SIWs
on a quartz plate using a high voltage, nanosecond pulse and measured propagation
speeds of 5 × 107 cm/s. 50 These speeds are commensurate with gas phase streamer
propagation speeds. It is not surprising that the zirconia speed is slightly larger, owing to
higher current and thus space charge. The streamer speed tends to increase with
increasing space charge derived electric field at the streamer head.49
A comparison of experimental and modeling results is shown in Figure 3-12.
The top row of frames is experimental ICCD images of optical emission between zirconia
disks (3, 4 and 6) with an exposure time of 5 ns. The exposures of the images were
digitally enhanced to show the features of interest so intensity cannot be directly
compared frame-to-frame. The row of frames images produced from the results of the
model. The computed results are the densities of the main photo-emissive species in the
model ([(N2(b1Π) and N2(b1Σ)]).

45
Figure 3-12: Experimental ICCD imaging (top) and densities of light-emitting species from the model (bottom)
between disks number 3, 4, and 6 and at various times. The disparity in time between the model and the experiment arises from the different voltages being applied.
The choice of frames was made to show correlating phenomena. Intense
filamentary microdischarge structures initially form between disks 6 and 3, and disks 6
and 4, as shown in Figure 3-12 (a,b) (experiment and model). The electrons incident
onto disks 3 and 4 charge the surfaces of the dielectrics and SIWs begin forming in
Figure 3-12 (c) and (d). As the potential between the disks drops due surface charging,
the intensity of the FMs decreases, and the propagating SIWs become the brightest
regions in the images, as shown in Figure 3-12 (e) through 12h. The surface ionization
waves are cathode-seeking discharges – regardless of the polarity of the applied voltage,
as demonstrated in our previous work.49 This is because electrons impact the dielectric
surfaces leave behind a region of positive space charge in the gas-phase. Through a
process similar to that of the propagation of positive streamers, the positive SIWs then
propagate down the potential gradient.
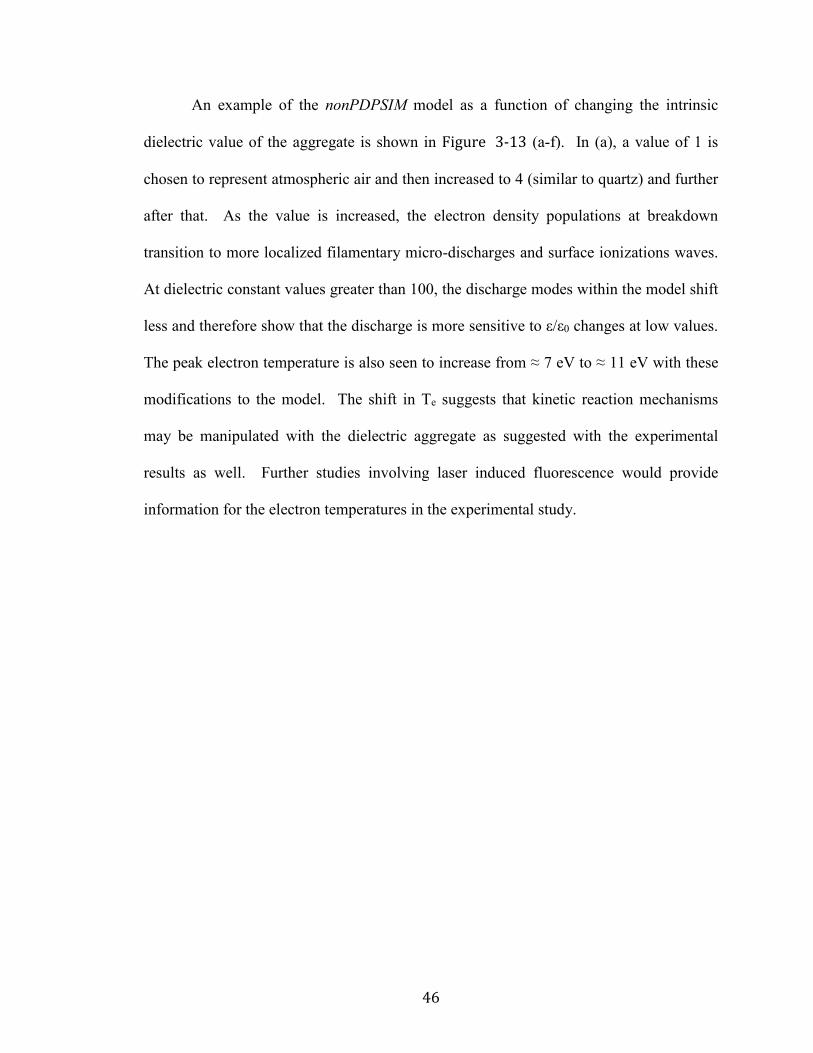
46
An example of the nonPDPSIM model as a function of changing the intrinsic
dielectric value of the aggregate is shown in Figure 3-13 (a-f). In (a), a value of 1 is
chosen to represent atmospheric air and then increased to 4 (similar to quartz) and further
after that. As the value is increased, the electron density populations at breakdown
transition to more localized filamentary micro-discharges and surface ionizations waves.
At dielectric constant values greater than 100, the discharge modes within the model shift
less and therefore show that the discharge is more sensitive to ε/ε0 changes at low values.
The peak electron temperature is also seen to increase from ≈ 7 eV to ≈ 11 eV with these
modifications to the model. The shift in Te suggests that kinetic reaction mechanisms
may be manipulated with the dielectric aggregate as suggested with the experimental
results as well. Further studies involving laser induced fluorescence would provide
information for the electron temperatures in the experimental study.

47
Figure 3-13: Electron density as a function of changing the intrinsic dielectric constant value of the aggregate. The
color map is representative of the locations of highest electron density within the 2-d cell. The experimental discharges discussed were sustained with voltage pulse
amplitude of 20 kV. Investigations were also performed for discharges through zirconia
disks aggregate for voltage amplitudes of 16, 17, 19, and 20 kV at atmospheric pressure,
as shown in Figure 3-14. The trends for discharge formation and propagation were
basically the same as a function of voltage over this range, with only the intensity and
speed of discharge formation increasing with increasing voltage. The contrast of the
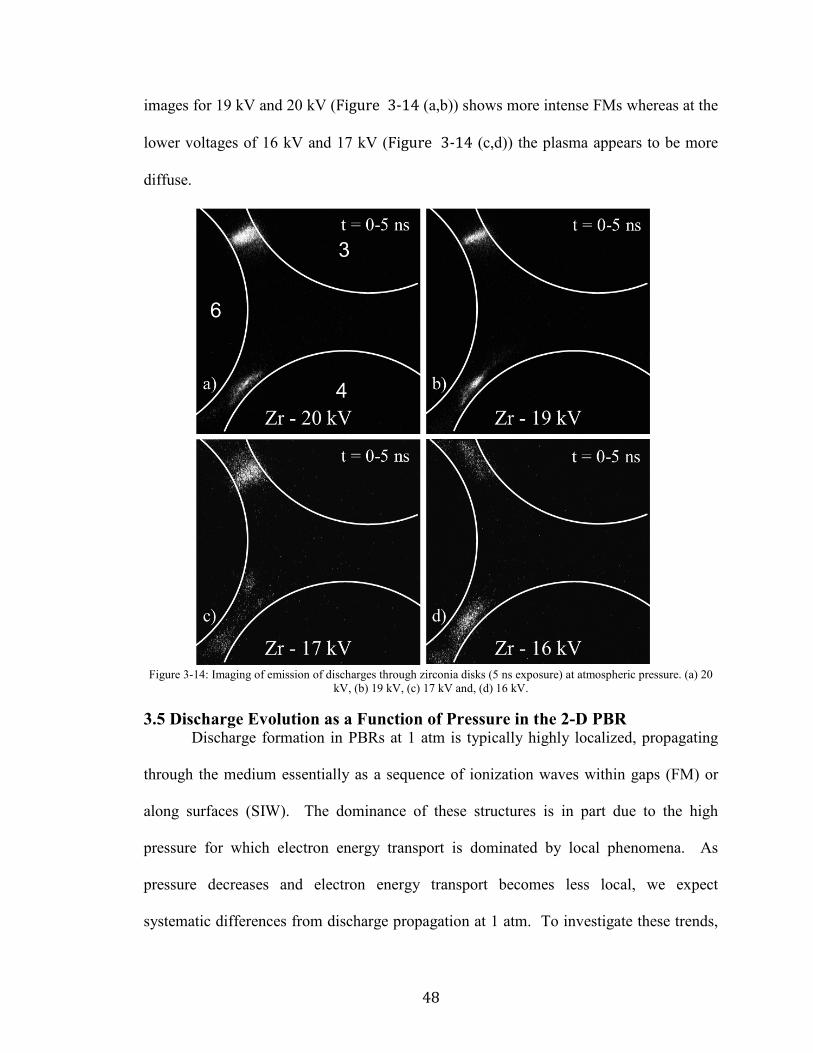
48
images for 19 kV and 20 kV (Figure 3-14 (a,b)) shows more intense FMs whereas at the
lower voltages of 16 kV and 17 kV (Figure 3-14 (c,d)) the plasma appears to be more
diffuse.
Figure 3-14: Imaging of emission of discharges through zirconia disks (5 ns exposure) at atmospheric pressure. (a) 20
kV, (b) 19 kV, (c) 17 kV and, (d) 16 kV.
3.5 Discharge Evolution as a Function of Pressure in the 2-D PBR Discharge formation in PBRs at 1 atm is typically highly localized, propagating
through the medium essentially as a sequence of ionization waves within gaps (FM) or
along surfaces (SIW). The dominance of these structures is in part due to the high
pressure for which electron energy transport is dominated by local phenomena. As
pressure decreases and electron energy transport becomes less local, we expect
systematic differences from discharge propagation at 1 atm. To investigate these trends,

49
imaging of discharges in the 2-D PBR was performed at reduced pressure. Pressure in
the system was reduced via the connected vacuum lines and roughing pump that was
previously shown in Figure 3-1 of this chapter. Beyond understanding propagation
mechanisms, there may be a practical basis for operating at reduced pressure as well.
Although most chemical processing using PBRs is performed at atmospheric pressure to
minimize the costs of managing pumping and vacuum, it is not clear that atmospheric
pressure is optimum in terms of discharge propagation, filling the volume of the PBR and
utilizing all of the catalyst. As the pressure is reduced for a given applied voltage, E/N
will increase which would produce higher rates of electron impact dissociation and
ionization. Reduced pressure would tend to also increase the volume of the reactor filled
by the discharge, which may provide greater selectivity in regards to gas phase reactions.
During sub-atmospheric pressure experiments, the peak voltage was kept constant
at 12 kV with a 120 ns pulse width. Experiments were performed at 200, 100, 50 and 10
Torr. A subsequent set of data was also taken at 1 Torr and 500 mTorr but the discharge
no longer seemed to be affected by the dielectric material as the entire volume had been
filled with plasma. Also, parasitic discharges to the vacuum lines and pressure gauge was
seen at such a low pressure and therefore could not be included within the study.
Discharge images could not be captured above a few hundred Torr due to the inability to
initiate a breakdown through the quartz disks at 12 kV. Changing the applied voltage of
the system at the higher pressures would excuse a direct comparison of the images and
waveforms acquired.
Images of the time evolution of the discharge with quartz disks in the entire array
at 100 and 50 Torr are in Figure 3-15 and Figure 3-16, respectively. In general, when

50
reducing pressure, local emission intensity decreases. In both lower pressure cases, the
discharge appears to translate through the array as a SIW with the thickness of plasma
extending well into the gap between disks. Some of this extension into the voids might
possibly be due to sheath expansion at the lower pressures.
Figure 3-15: Time-resolved imaging of the 2D-PBR discharge through quartz disks at 100 Torr integrated over 5 ns.
(a) 10-15 ns, (b), 15-20 ns, (c) 40-45 ns, (d), 50-55 ns. (e) 105-110 ns and (f) 110-115 ns.

51
Figure 3-16: Time-resolved imaging of the 2D-PBR discharge through quartz disks at 50 Torr integrated over 5 ns. (a)
5-10 ns, (b), 10-15 ns, (c) 25-30 ns, (d), 80-85 ns. (e) 130-135 ns and (f) 135-140 ns. The discharge becomes less surface-hugging and bends away from the surface,
likely due to the higher mobility of charges being able to more rapidly charge the surface
at lower pressures. As the pressure is further reduced to 10 Torr, shown in Figure 3-17,
SIWs propagating on adjacent surfaces merge in the volume between the dielectric disks.

52
In spite of operating at higher values of E/N than the discharges at 1 atm, the images do
not indicate that FM form in the gaps between disks where the E/N is largest. This is
likely due to the intensity of the SIWs saturating the response of the ICCD.
Figure 3-17: Time-resolved imaging of the 2D-PBR discharge through quartz disks for 10, 50, and 200 Torr integrated over 5 ns. (a) 10 Torr, 0-5 ns; (b), 10 Torr, 5-10 ns; (c) 50 Torr, 0-5 ns; (d), 50 Torr, 5-10 ns; (e) 200 Torr, 0-5 ns; (f)
200 Torr, 5-10 ns.

53
To more closely investigate the formation of FMs at low pressure, a mask was
placed over the 2D cell. The mask restricted the ICCD to collecting light from the region
between disk 6 and 4 where FMs were expected to form. The resulting images are in
Figure 3-18. The right side of the figure has images taken with the mask in place. The
left side of the figure has images taken at the same voltage and exposure time but without
the mask. Even at a pressure of 50 Torr, FMs form in the high E/N gaps, and transition to
an SIW on the adjacent disk. The angle of the FM, however, is not strictly perpendicular
to the surfaces at low pressure.
Figure 3-18: Imaging of discharges through zirconia disks at 50 Torr (5 ns exposure) with and without masking. The masking blocked emission from the surface ionization waves. (a) Without mas, 5-10 ns, (b) with mask, 5-10 ns, (c)
without mask, 20-25 ns and (d) with mask 20-25 ns. This is due to the higher E/N throughout the cell at low pressure. For example, at
1 atm the vacuum value of E/N at the center of the void between disks 1, 7 and 6 is 25

54
Td, which not high enough to self-sustain a discharge in air. (1 Td = 10-17 V-cm2.) At 50
Torr, the E/N in the void is 220 Td, which exceeds the threshold for sustaining a
discharge in air. At lower pressure, propagation appears to be more influenced by the
applied axial electric field than the electric field enhancement that occurs in the gaps
between disks (or due to the polarization of the disks at their poles).
In the gaps between disks 6 and 3, and between 6 and 4, locations where FM
occur perpendicular to the surfaces at 1 atm, the discharge propagates parallel to the
surfaces at low pressure. In fact, the merging of SIW-like structures from the top and
bottom of disk 6 leaves a void where natural electric field enhancement occurs by
polarization of the disks. To investigate this region, a mask was applied which largely
blocked emission from the higher intensity FMs and SIWs. The resulting images showed
diffuse, volumetric plasma emission throughout the void at low pressures (50-300 Torr).
The same procedure was performed at 1 atm and little, if any, plasma emission
was observed in the void. Values for α (ionization coefficient), and η (attachment
coefficient) were computed from the results of nonPDPSIM in the void between the disks
3, 4, and 6. As the pressure increases, α decreases from 9.74 cm-1 at 50 Torr to 0.21 cm-1
at 200 Torr whereas η increases from 0.82 cm-1 to 2.53 cm-1. There results indicate that
the net rate of ionization, α - η, transitions from being positive (net ionization) in the
void to negative (net attaching) between 100 and 200 Torr. The trends in net ionization
predicted by the model correlate well with the experimentally observed change in the
mode of propagation. With higher α, plasma propagation occurs in the void, however as
the system becomes net attaching, plasma production in the void diminishes.

55
Time resolved images of discharge development with zirconia disks at 50 Torr are
shown in Figure 3-19. Discharge development is similar to that in the quartz array,
albeit with higher emission intensity. The discharge slowly develops between 5 and 10
ns, after which the array quickly fills with a highly developed discharge. Here again, a
surface wave like discharge propagates through the array with the interstitial spaces being
filled with higher density plasma than the seemingly empty voids. The discharge appears
to cover the zirconia disks more extensively than the quartz disks.
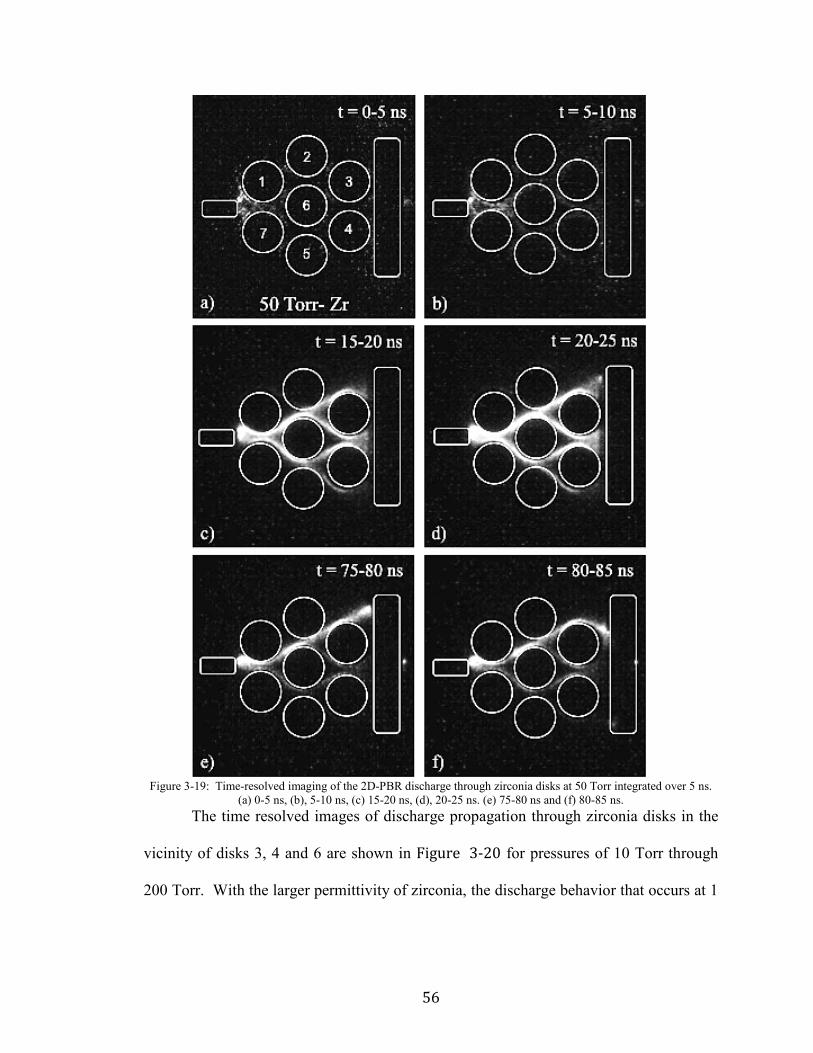
56
Figure 3-19: Time-resolved imaging of the 2D-PBR discharge through zirconia disks at 50 Torr integrated over 5 ns.
(a) 0-5 ns, (b), 5-10 ns, (c) 15-20 ns, (d), 20-25 ns. (e) 75-80 ns and (f) 80-85 ns. The time resolved images of discharge propagation through zirconia disks in the
vicinity of disks 3, 4 and 6 are shown in Figure 3-20 for pressures of 10 Torr through
200 Torr. With the larger permittivity of zirconia, the discharge behavior that occurs at 1

57
atm is recovered by 200 Torr. At 10 Torr, the discharge is dominated by SIWs. At 200
Torr, FMs are produced in the gaps, followed by the launch of SIWs, as at 1 atm.
Figure 3-20: Images of the 2D-PBR discharge through zirconia disks for 10, 50, and 200 Torr integrated over 5 ns. (a) 10 Torr, 0-5 ns, (b) 10 Torr, 5-10 ns, (c) 50 Torr, 0-5ns, (d) 50 Torr, 5-10 ns, (e) 200 Torr, 0-5 ns, (f) 200 Torr, 5-10 ns.
The transition between SIW to FM discharges in the zirconia array occurs near
200 Torr. This transition is shown by the images in Figure 3-21 for pressures between

58
180 and 210 Torr. At 180 Torr, the applied E/N is large enough that the discharge occurs
in regions outside the field-intensified gaps. As the pressure increases from 190 Torr to
200 Torr, the E/N outside the gaps decreases below self-sustaining, leaving the gaps
having large enough E/N to initiate the discharge in the form of FM.
Figure 3-21: Images (10 ns exposure) capturing the transition from SIW, volumetric discharges to micro-discharges
with increasing pressure. (a) 180 Torr, (b) 190 Torr, (c) 200 Torr and (d) 210 Torr. The thickness of the SIW was measured from the ICCD images and is shown in
Figure 3-22. The measurement was made from the surface of the disk to the edge of the
luminous region and did not consider possible sheath effects that may elevate the
luminous region above the disk. The SIW thickness varied inversely with the pressure,
suggesting that the thickness is limited by the electron-neutral mean free path. The
surface wave thickness varied linearly with mean free path regardless of type of material,

59
though SIW thickness tended to be greater for the quartz disks. This trend is consistent
with the ICCD images being more intense for the zirconia, implying higher plasma
density, smaller Debye length and so thinner SIW thickness.
Figure 3-22: Surface wave properties for zirconia and quartz disks. (a) Surface wave thickness as a function of electron
mean free path and (b) surface wave thickness as a function of pressure.
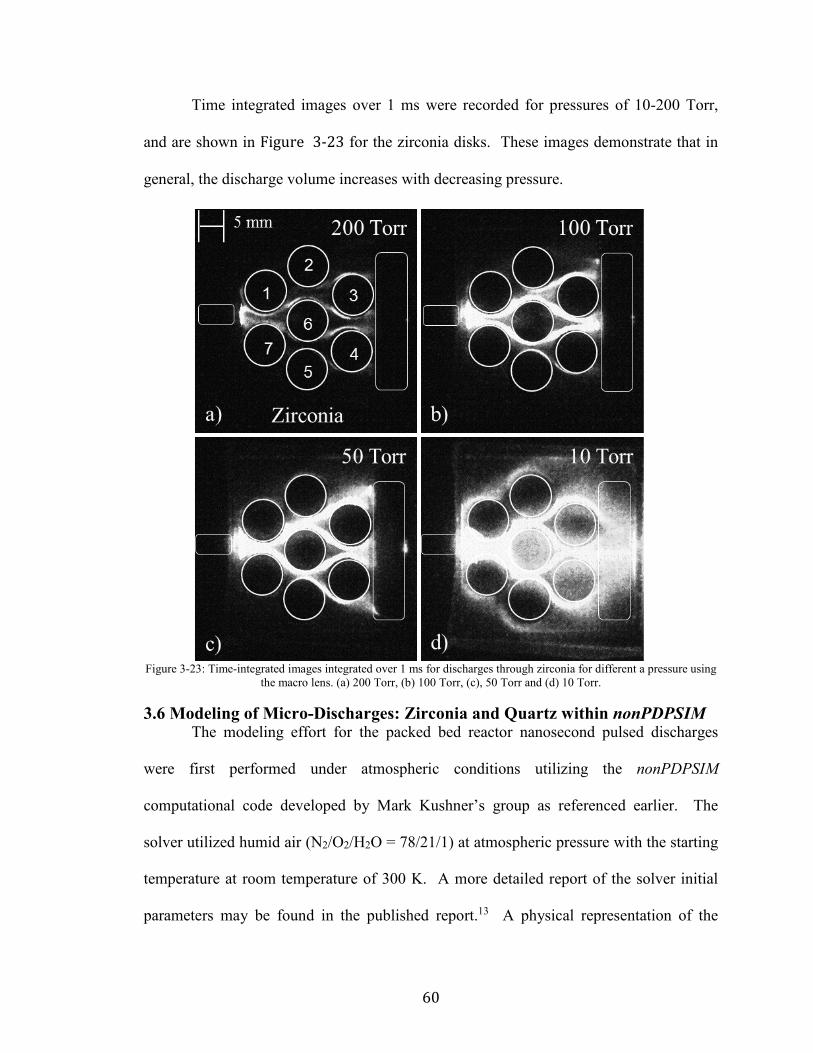
60
Time integrated images over 1 ms were recorded for pressures of 10-200 Torr,
and are shown in Figure 3-23 for the zirconia disks. These images demonstrate that in
general, the discharge volume increases with decreasing pressure.
Figure 3-23: Time-integrated images integrated over 1 ms for discharges through zirconia for different a pressure using
the macro lens. (a) 200 Torr, (b) 100 Torr, (c), 50 Torr and (d) 10 Torr.
3.6 Modeling of Micro-Discharges: Zirconia and Quartz within nonPDPSIM The modeling effort for the packed bed reactor nanosecond pulsed discharges
were first performed under atmospheric conditions utilizing the nonPDPSIM
computational code developed by Mark Kushner’s group as referenced earlier. The
solver utilized humid air (N2/O2/H2O = 78/21/1) at atmospheric pressure with the starting
temperature at room temperature of 300 K. A more detailed report of the solver initial
parameters may be found in the published report.13 A physical representation of the

61
experimental setup was generated with a static, unstructured, triangular mesh from the
SkyMesh2 application by SkyBlue Systems. Reflective boundary conditions were set on
the left-and-right sides of the simulation domain. A depth of 1 cm was assumed for
volumetric calculations and the voltage was specified on the top and bottom to represent
the electrodes. The electrodes were spaced 1 cm apart with the dielectric disk interstitial
spacing set to 700 μm for the base case as seen in Figure 0-24(a). The solver was ran for
a set of computations that included changing the interstitial spacing from the base case to
430 μm as well as a 22.5 degree rotation of the outer dielectric disks about the central
disk shown in Figure 0-24 (c,d). Figure 0-24 is taken from the publication and is
reproduced here. The dielectric constant of the discs is set to that of the quartz material
used in the experiment with ε/ ε0 = 4.0.

62
Figure 0-24: Initial conditions for simulations: (a) base case geometry and (b) base case initial reduced electric field, E/N. (c) Initial E/N for smaller separation between the discs and for (d) rotated lattice. E/N is plotted on a linear scale,
22.7-270 Td for total voltage drop of – 30kV in humid air. When the voltage is applied to the system, an external electric field causes a
polarization of the electric field inside the dielectrics, which in turn creates an additional
enhancement in the gas electric field at the poles of the solid. This enhancement was
shown in the ANSYS: Maxwell simulations previously discussed as well as Figure 3-4
(b). This localized enhancement affects the localized electron densities throughout the
aggregate media. The electron density for the base case were found to be varying from 5
x 1013 cm-3 to 1 x 1014 cm-3 as a function of time as the plasma forms and propagates
through the media and is shown in Figure 3-25 (a-f). The highest electron density is

63
seen where the modeling shows the highest electric field enhancement and is represented
in Figure 0-24 (b) and Figure 3-3. This high electric field enhancement produces the
regions of high ionization and in the modeling case presented by colleagues13, also
produces positive restrikes.

64
Figure 3-25: Electron density at different times during propagation of the discharge through the PBR for the base case (-30kV, humid air, 700 μm disc separation). Densities are plotted on a 4-decade log scale with maximum value (cm-3)
indicated in each frame. The modeling corresponds well with the experimental data such that the plasma
forms and charges up the surface, producing the surface ionization waves from the
created tangential components of the electric field. As a result of these actions, the
electric field strength between the discs are shown to be a minima that is below the ≈ 30

65
kV cm-` or 130 Townsend (Td) for the breakdown electric field of air. The speed of
streamer propagation was also determined to be on the order of ≈ 2.3-5 x 107 cm s-1. The
propagation speed of the SIWs along the surface of the quartz disks was ≈ 3 × 107 cm/s
and ≈ 4 × 107 cm/s for the zirconia disks.
The next case that was simulated within nonPDPSIM was decreasing the
interstitial disc spacing from 700 μm to 430 μm. The reason for decreasing the spacing
of the discs is to have a higher packing fraction and therefore simulate more aggregate in
the same volume. The results of this change led to the electric field shown in Figure
0-24 (c). The closer spacing and higher fraction led to a higher enhanced electric field
within these regions of interest. At first, the discharge propagates in the same fashion
with interaction first occurring with the top two discs. Moving forward, the electric field
was nearly 20 Td lower at the middle point of the aggregate and therefore lowers the
electron temperature and electron impact ionization events. Therefore, the electron
collisions from the region are dominated by attachment. Here a difference seen between
the base case and the higher packing fraction case is that the positive restrike is not
observed in this region. The electron densities at the closest point of contact amongst
discs did however see nearly a two times larger density than in the base case but is not a
significant change. The main difference between the base case and this of closer spacing
is that the closer spacing promotes formation of FMs while delaying the onset of SIWs.
Following the work involving a more closely packed base case, a model was
performed with a 22.5-degree rotation about the central disc. The reason for this is that
the localized enhancement of the electric fields is due to the dielectric discs and their
positions relative to the electrodes. A 22.5-degree rotation sets the one of the discs closer

66
to the pin electrode and therefore modifies the localized electric fields represented in
Figure 0-24 (d). The closer proximity and better alignment with the electric field leads
to a more intense FM discharging from the pin electrode to the now closest disc. The
recorded electron impact ionization peaks at nearly 1 x 1021 cm-3 s-1. The asymmetry
produces a difference in location and magnitude of the E/N minima and allows for
propagation from the ‘closest’ disc to the pin electrode to the now slightly offset one.
The plasma then discharges along the right side as shown in Figure 3-26 (a-f).

67
Figure 3-26: Electron density at different times during propagation of the discharge through the PBR for the rotated lattice (-30kV, humid air, 700 μm disc separation, 22.5° rotation). Densities are plotted on a 4-decade log scale with maximum value (cm-3 s-1) indicated in each frame.
The discharge follows the discs that have become physically closer to the pin
electrode due to the better alignment with the background electric field of the electrodes.
A favoritism of the closest disc to the planar electrode is seen in Figure 3-26 (f) as shown by
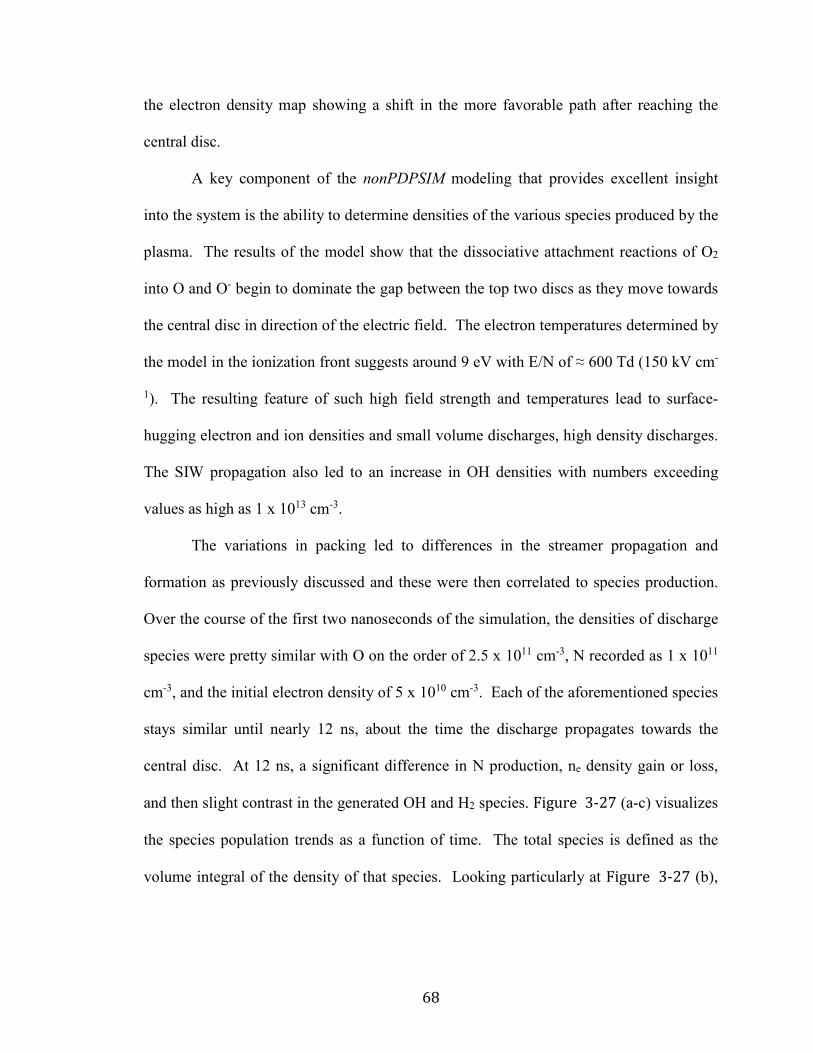
68
the electron density map showing a shift in the more favorable path after reaching the
central disc.
A key component of the nonPDPSIM modeling that provides excellent insight
into the system is the ability to determine densities of the various species produced by the
plasma. The results of the model show that the dissociative attachment reactions of O2
into O and O- begin to dominate the gap between the top two discs as they move towards
the central disc in direction of the electric field. The electron temperatures determined by
the model in the ionization front suggests around 9 eV with E/N of ≈ 600 Td (150 kV cm-
1). The resulting feature of such high field strength and temperatures lead to surface-
hugging electron and ion densities and small volume discharges, high density discharges.
The SIW propagation also led to an increase in OH densities with numbers exceeding
values as high as 1 x 1013 cm-3.
The variations in packing led to differences in the streamer propagation and
formation as previously discussed and these were then correlated to species production.
Over the course of the first two nanoseconds of the simulation, the densities of discharge
species were pretty similar with O on the order of 2.5 x 1011 cm-3, N recorded as 1 x 10¹¹
cm-3, and the initial electron density of 5 x 1010 cm-3. Each of the aforementioned species
stays similar until nearly 12 ns, about the time the discharge propagates towards the
central disc. At 12 ns, a significant difference in N production, ne density gain or loss,
and then slight contrast in the generated OH and H2 species. Figure 3-27 (a-c) visualizes
the species population trends as a function of time. The total species is defined as the
volume integral of the density of that species. Looking particularly at Figure 3-27 (b),
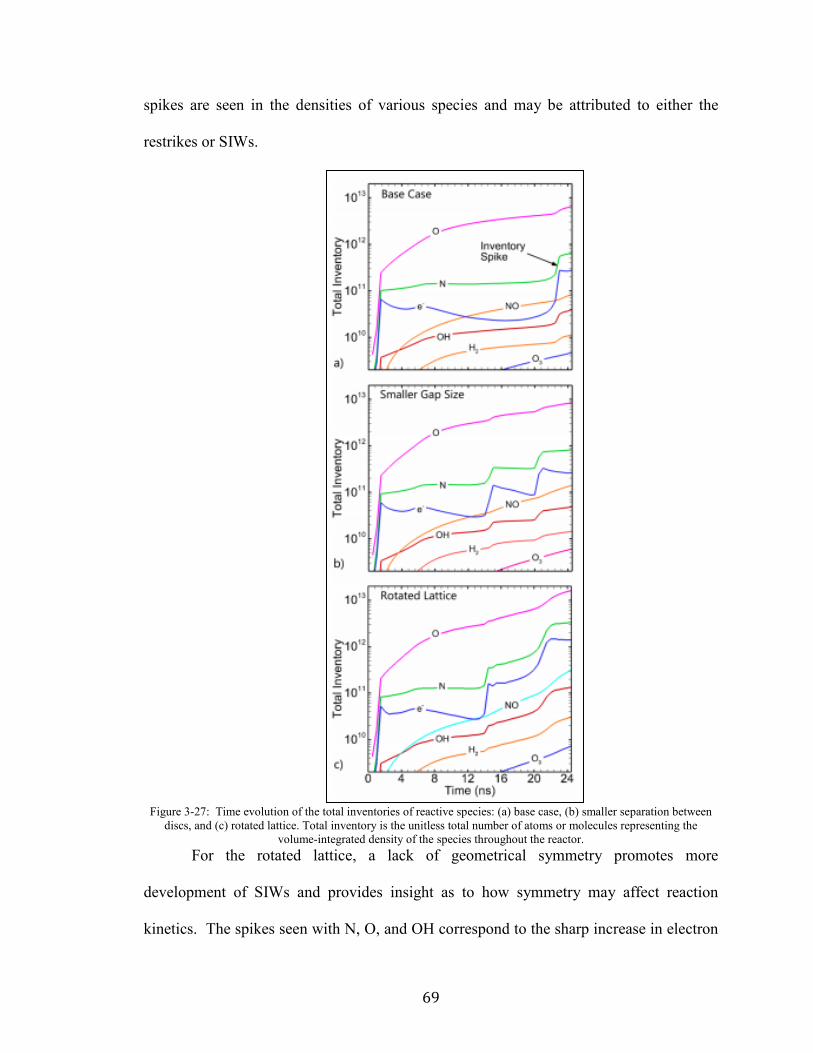
69
spikes are seen in the densities of various species and may be attributed to either the
restrikes or SIWs.
Figure 3-27: Time evolution of the total inventories of reactive species: (a) base case, (b) smaller separation between
discs, and (c) rotated lattice. Total inventory is the unitless total number of atoms or molecules representing the volume-integrated density of the species throughout the reactor.
For the rotated lattice, a lack of geometrical symmetry promotes more
development of SIWs and provides insight as to how symmetry may affect reaction
kinetics. The spikes seen with N, O, and OH correspond to the sharp increase in electron

70
densities as the reaction mechanisms for the neutral reactant species depend on high
electron densities with high energies. The sensitivities of their species populations may
be further investigated in the work of a colleague.49
The modeling effort presented here was an excellent comparison to the
experimental results observed in the proceeding sections. The plasma discharge through
the dielectric aggregate was driven by the physical geometry of the discs and their
localized field enhancement. The streamers started as FMs from the pin electrode to the
nearest disc, instigating morphology of the electric field that transitioned these FMs to
SIWs. As the SIWs reach the next interstitial spacing gap, they transitioned back to FMs
as the process repeated itself as it progressed through the media. Decreasing the distance
between the disks resulted in increased peak and average electric fields but did not
change the breakdown mechanisms. A rotation of the lattice did however result in more
intense surface ionization waves from asymmetry. The largest changes in species
densities were seen at the short transient stages of the system such as restrikes or the
development of SIWs. Overall, the physics seen in the model and the experiment
provided an excellent comparison and shed light onto the expected parameters of the
plasma as more measurements are continued to be made.
3.7 Discharge propagation in the presence of catalytic particles A key interest in the focus of plasma formation in packed bed reactors or porous
media is that of the effects of catalytic particles. Implementing materials such as silver,
platinum, gold on the surfaces of dielectric modify the plasma formation and propagation.
These developments are not well understood and therefore presented are some
preliminary results into the effects of catalytic particles implemented on a dielectric disk
within the aforementioned 2d cell apparatus. A question of interest to the field that is

71
highlighted in this thesis is: How does the presence of metallic particles affect DBD
discharges in PBRs? Other questions that reside for future work include: What catalyst
depositing manufacturing processes produce additional plasma structures within various
media? What are the plasma characteristics on the surface and near the catalytic
structures? What species are generated within these catalytic plasma regions? How is
energy transferred to the catalyst? Does plasma negatively impact the lifetime of the
catalyst material? The answers to these questions may be found in experiments with
optical emission spectroscopy diagnostics, thermal imaging, as well as additional time-
resolved high speed imaging.
Zirconia dielectric disks were chosen as the dielectric aggregate for this
experimental investigation. An identical placement to Figure 3-2(b) was chosen with
dielectric disk 1 having three lines of conductive silver epoxy painted on the radial
surface. The three positions where the catalysts were placed are at the interstitial region
between disks 1 and 7, the FM location between disks 1 and 6, and the interstitial region
amongst the three disks.
Figure 3-28 shows time-resolved imaging of the disk in which the catalytic epoxy
was placed. The initialization of plasma formation within the first 5 ns (Figure 3-28 (a))
is identical to what was seen earlier with FM formation from the pin electrode to the first
set of disks as well as FM development at the interstitial positions between disks. After
the first 5 ns, however, we begin to see differences in plasma propagation along the
surface yet still producing the more intense filamentary micro-discharges as seen before.
In Figure 3-28 (b), we see FM formation as well as SIW propagation but the volume of
the SIW near the catalyst is much larger than observed with the unmodified ceramic.

72
Continuing to images (c) and (d), one can clearly see how the volume of the SIW
propagation is much larger than the neighboring dielectric with a surface hugging SIW.
The plasma then continues to reside near the catalytic particles positions after the wave
has already progressed to the next dielectric disk. Image (d) is an excellent example of
where the catalytic particles are located after the plasma front has moved beyond this
location. Each ‘bright’ spot is a location of the catalyst. The residual plasma here grants
insight into the potential manipulation of the remaining plasma near catalytic particles in
packed bed reactors or porous media.
The longer residence time of the plasma at these locations may be taken
advantage of in order to enhance kinetic reactivity or selectivity of the application.
Plasma-catalytic synergy has been observed by Neyts et al. in their study regarding
synergistic effects at the nanoscale level51, as well as in other works.52,53,54,55 Therefore a
dual interest is produced where the locally residual plasma increase potentially desired
reactions with the catalytic material and the residence time of the plasma in this location
is greatly enhanced. For instance, images taken with dielectric aggregate without
catalytic particles show localized emission with the microscope lens for around 25 ns
before any residual plasma is difficult to observe.
Figure 3-28 subsections (e,f) are evidence that the plasma resides in the region
much longer than with the non-catalyst dielectric.

73
Figure 3-28: Time-resolved images of plasma formation and propagation of disks 1, 6, and 7 with conductive epoxy acting as a catalyst. Catalyst locations have been highlighted with small dashed circles. The images show that the intensity of the residual plasma remains relatively high near the catalyst after time in which the intensity would be low without the catalysts.
Although only 60 ns after pulse initiation is shown in the figure, residual plasma
was seen up to 200 ns after the first image is taken, albeit at a much lower intensity.
Such a large increase in residence time of the plasma may greatly increase the efficiency
or reactivity of the system.
To further gain a better understanding of the plasma interactions with the same
catalytic particles, the polarity of the electrodes was reversed such that the pin electrode
now held a –10 kV whereas before it was a +10 kV setting. The same polarity and
voltage switch also occurred at the planar electrode, leaving the system with a 20 kV
potential difference from the pin to planar electrode. Figure 3-29(a-f) shows the time-

74
resolved imaging of the plasma formation and propagation under such a polarity switch.
Since the plasma formation begins near the planar electrode and propagates from right-to-
left of the dielectric disks with catalytic particles, a noticeable difference was seen in the
plasma production.
Figure 3-29: Time-resolved images of negative polarity pin electrode to positive polarity planar electrode configuration utilizing catalytic particles on a dielectric disk. Images (a-f) show a time progression of the plasma formation and propagation through a select region of the 2-dimensional cell setup.
For the positive polarity pin electrode system, plasma first forms on the dielectric
disk with the catalytic particles and its lower neighbor (disks 1 and 7). The plasma then
remains near the catalyst locations as the time-step was moved forward with an easily

75
observable intensity at the pre-set iCCD gain and exposure. Utilizing the same setup for
the negative polarity pin electrode resulted in a much lower intensity image capture at the
same time delay step that was recorded in
Figure 3-28(f). A possible explanation for the disparity in localized optical
emission spectroscopy intensity may be due to the plasma propagation through the
medium varying. Before with the positive polarity, FMs formed and transitioned to SIWs
in a left-to-right fashion in regards to the camera orientation. Implementing a polarity
reversal forces the plasma to have to propagate further in order to reach the location of
the catalysts. This increased distance allows for more plasma dissipation to occur and
therefore less-intense plasma was witnessed. In agreement with the original polarity of
the system, residual plasma does occur and remain near the catalytic particles for an
increased duration versus ceramic only material. The volume and intensity of the
inverted polarity was more diminished.
Modeling of catalytic particles in the 2-dimensional cell setup was performed by
Juliusz Kruszelnicki within nonPDPSIM. The catalysts were modeled as dielectrics with
εr = 10 and with metal-like conductivity with sigma = 100 Ohm-1-cm-1. In this case
study, the nominal properties of silver were chosen to reflect the silver epoxy in the
experiment. The work function of silver is 5 eV. Thermal conductivity was set to 4.06
W-cm-1-K-1. Thermal capacity was 0.023 J-cm-3-K-1 and reflectance was set to 0.4.
Surface reactions implemented for the catalytic modeling include recombination, de-
excitation, recombination, and secondary electron emission. Surface heating of the
material was calculated by extending heat conduction term of the temperature equation of
plasma into the solid materials. These were the fluxes of plasma produced species onto

76
the surface that include ion potential energy, ion kinetic energy, neutral enthalpy changes,
electron kinetic energies, electron emissions, and ultraviolet heating. The computational
workings of the model were the same as specified in section 3 of this chapter.
The electric field near the catalysts is greatly enhanced, more so than with the
dielectric alone. This is due to electrons seeding the catalysts and more easily producing
micro-streamers at the edges of the catalyst. The electric fields at the catalyst locations
were recorded of having strengths in the 1000s of kV/cm within nonPDPSIM and were
able to overcome the work function of the material and field emit. The local
enhancement due to the catalytic material is also geometry dependent and would be
further enhance if the catalysts were modeled with points instead of the smooth surfaces
matching the modeled discs.
Thus far, the preliminary experimental remarks with the silver epoxy catalyst
show that they do have an effect on plasma formation and propagation through the media.
The field strengths are high enough to induce electric field emissions within the catalytic
region. The additional emitted electrons increase plasma conductivity near the catalyst
and therefore decrease electron temperature and fluences. Juliusz’s modeling work has
shown that the geometry of the catalysts play a big role in the field emissions as well as
suggesting that ions are main contributors to the surface heating of the catalyst. The
implementation of synergy particles allows the plasma to bring the catalyst temperature
above the “light-off” conditions for chemical conversion processes.
Figure 3-30 shows the electron density due to the implementation of the catalytic
particles in the 22.5 degree rotated lattice structure. As is shown in the figure, the
electron density from the disc with the catalytic particles to the central disk has a

77
significantly higher density remaining near the catalysts after the propagation front has
already passed through the region. The higher density of electrons lingering in this
region was seen in the experimental imaging of
Figure 3-28 (f) and Figure 3-29 (f). The effects of catalysts on pulse-to-pulse
variations and material degradation are left to future work.
Figure 3-30: Electron density mapped out over the 22.5 degree rotated lattice structure of dielectric disks within
nonPDPSIM. Further work with catalytic particles should be investigated with the 2d cell setup
as well as moving to catalytic implementation within 3-dimensional PBRs. For instance,
the location of the catalytic particles with reference to the electrodes should change with
time-resolved images being captured to further glean insight into the plasma propagation
with catalytic particles in larger. Utilization of a 3d PBR and catalytic particles would

78
show how the plasma propagation outward in three dimensions would be effected. Some
questions that still remain are ones as follows: Would the plasma now prefer the catalytic
particle path and no longer propagate throughout the aggregate? Or would the plasma
intensity and volume increase as more catalytic particles are added? Is there a saturation
limit to the amount of catalytic material?
3.8 Validation of 2-D results using 3-Dimensional Sub-scale PBR Construction of a sub-scale packed bed reactor was completed in order to validate
the results of the 2-dimensional cell. The dimensions of the sub-scale reactor was chosen
such that there was a layer of dielectric spheres that were in contact with identical
dielectric spheres. Physical interaction with other dielectric spheres is therefore
representative of a true packed bed reactor or porous media with interstitial spaces in
each dimension. Figure 3-31 shows a quartz tube of 19 mm outer diameter with a 17
mm length allowed for six silicon nitride (Si3N4) spheres to become the packing
aggregate with a dielectric constant of 8.
Figure 3-31: Image of the sub-scale, 3-D packed bed reactor utilizing Si3N4 as the dielectric aggregate. The sub-scale
reactor was designed and built to validate the results of the 2-D experiment. The sub-scale reactor dimensions allowed for optical, time-resolved imaging of
the plasma as it travelled through the system without interference of overlapping layers in

79
a larger volume system with similar aggregate size. The sub-scale reactor implements a
pin-to-planar electrode configuration with the pin electrode of stainless steel and the
planar electrode remaining copper as seen before with the 2-D cell experiments. The pin
electrode was mounted via a hole drilled through a copper cylindrical cap and set in
location via epoxy.
Images taken were then compared to discharges seen with the zirconia disks of
the 2-D cell results. Figure 3-32 shows the time-resolved images captured in similar
fashion to that mentioned for the 2-D cell. As one can see in Figure 3-32 (a), the plasma
first forms the FMs from the electrode to the first set of dielectric spheres and transition
to SIWs. Proceeding to the next 5 nanosecond exposure in (b), the SIWs transition to
more intense FMs near the points of contact for the middle dielectric spheres before
continuing along the surface of the middle spheres towards the planar electrode. These
images of the sub-scale reactor show similar behavior to the time-resolved images of the
zirconia disks as seen in Figure 3-11 of this chapter. An interesting observation that
should also be commented on is that a faint SIW along the inner diameter of the quartz
tube was produced.

80
Figure 3-32: Time-resolved images of plasma formation and propagation within the sub-scale 3-D reactor. (a) Shows
plasma formation as a FM with (b-d) showing FMs and SIWs. This SIW is very difficult to spot without using significant image enhancement
that was not done in Figure 3-32. Although lacking in intensity, this SIW arrives at the
planar electrode approximately 5-10 ns before the FMs and SIWs propagating throughout
the aggregate. This may also be a geometric factor in which the distance along the inner
diameter of the quartz tube is similar to traversing the volume across the dielectric
aggregate. A study for this geometric factor would involve a packed bed reactor with a
quartz tube inner diameter significantly larger than the distance between electrodes with a
similar pin-to-planar electrode configuration. Further investigations should be performed
to determine the properties of the wave and its influence on the system.

81
Chapter IV
A Spectroscopic Study of Plasma Emissions from the 2-Dimensional Discharge
The species produced in the non-thermal packed bed discharge are essential for
applications such as agriculture, medicine, fuel reforming and chemical processing. In
order to understand the species that are being produced during the discharge, optical
emission spectroscopy is utilized. Time resolved spectra were acquired using a Princeton
Instruments Pi-MAX3 camera coupled to the Acton SP2300 spectrometer. The spectrum
was analyzed via the Winspec software. SpecAir was used to obtain the gas temperatures
from rotational structure.56 Gas temperature is found by fitting synthetic spectra to the
measured emission. The electronic excitation temperature was determined via
Boltzmann line plots as described in Chapter 2. While not the actual electron
temperature, the Boltzmann plot is a qualitative measure of how close the electrons are to
LTE and yields the trends in average electron energy.
4.1 Species evolutions as Inferred through 2-D emission map In order determine the species distribution within the 2-dimensional packed bed
reactor, images were taken with wavelength filters placed over the lens of a Nikon
camera. Although the images are qualitative in nature, they provided insight as to the
relative abundance of species generated. Here filters were chosen to coincide with
emission bands of various species such as nitrogen, oxygen, and NOx. Figure 4-1

82
illustrates the spectral band-pass of a filter used in this work. The band-pass filters were
employed to visualize the location and intensity of light emitting species within the
discharge for OES observation. The band-pass width of the filters was approximately 20
nm. Figure 4-2 shows images taken with a Nikon D40 camera with the band pass filters
placed in the view of the discharge. It is a visual representation of the observable
emissions through the selected filters. The highlighted region is the placement of the
filter with the rest of the discharge remaining covered.
Figure 4-1: Example of the band-pass filter transmission spectrum taken from ThorLabs website. The red line is
representative of the filters used in the qualitative diagnosis discussed herein. The center wavelengths of the filters used in this work are listed in Table 4-1
along with species with prominent emission lines in range of the filter that are of interest.

83
Figure 4-2: Exposure images of the Nikon D40 camera using the (a) no band-pass filter, (b) 400 nm filter, (c) 420 nm
filter, (d) 600 nm filter. Table 4-1: Table of the utilized band-pass filters for the qualitative optical emission spectroscopy.
Wavelength Center-Lines of band-pass filters used for qualitative OES Analysis 307 nm
O 421 nm
O2 450 nm
NO, NO2 500 nm 550 nm
600 nm O2
+ 650 nm
N2
700 nm 750 nm 777 nm O
The filtered images were also taken with the Andor iStar camera. The Andor
camera allowed for higher sensitivity. The band-pass filters that were used in the
previous images were also employed here with addition to a 250 nm, 221 nm, and 232
nm center-line filters. The images were taken as a qualitative comparison of the species
produced with the quartz aggregate verses the zirconia aggregate, which have very
different dielectric constants. Images were taken at 40 ns into the pulse and were
accumulated for a total of 500 images to increase the contrast and are shown in Figure
4-3.

84
Figure 4-3: Accumulations of the discharge shown through a band pass filter at the same time step for each of the
dielectric aggregate. The centerline of the filter is on the 2.4x magnified image. For the zirconia aggregate, the filamentary microdischarge is the dominant mode
observed at the time delay with the surface ionization wave dominating the discharge
mode at same time step with the quartz aggregate. The contrast in visual observations
shows the intensity of the plasma, corresponding to the higher emission intensity of the
species within the filtered wavelengths.
4.2 Collected OES Spectra for Inorganic Material Time resolved emission spectra were also obtained at select locations of the 2D
array. The objective here is go gain insight into the time variation in species excitation as
the ionization wave passes through select locations in the array. This measurement also
allowed for the measurement of emission signatures of surface and filamentary
discharges. The experimental setup with the labeled positions of interrogation for the
optical fiber is shown in Figure 4-5. The first position to be investigated was between
dielectric discs 1 and 2. The second position was between discs 2 and 3. The last
position to be investigated was between the dielectric discs and the copper planar
electrode.

85
Figure 4-4: The experimental setup for the time-resolved optical emission spectroscopy results is shown in (a) with the
region of interests shown in (b). Images were taken over the duration of the pulse as well as the afterglow at a 10
ns exposure. The typical emission spectrum is at one snapshot in time of the highest
recorded intensity is shown in Figure 4-5. The full spectrum shows mainly nitrogen
band emission along with peaks from copper and molybdenum (electrode material). The
arrow underneath the Cu I and Mo I show the range over which emission spectra from the
electrodes were seen. A broad range is shown here as the peaks are too numerous to
label.

86
Figure 4-5: The full spectrum obtained at location 1 before the time-resolved results was focused on the nitrogen 337
nm line.
The time evolution of emission at 337.1 nm was selected to monitor plasma
induced emission as the ionization wave passed through the array. This nitrogen
bandhead emission associated with the second positive nitrogen band was strong for all
measurements. The emission was time resolved as a function of not only position but
also pulse frequency (10 and 100 Hz). The first location scrutinized, as a function of time
was position one, which is between the zirconia dielectric, discs 1 and 2. The time
averaged gas temperature at this location was 345 K. The time average was performed
over the course of the plasma discharge. The intensity of the 337 nm band peaks near 50
ns into the pulse as shown in Figure 4-6.
Interestingly there are two peaks present in the time resolved emission. The
second peak appears around 20 ns after the initial peak. The actual origin of the second
300 400 500 600 700 8000
10000
20000
30000
Cu I, Mo I
Zone 1
Second Order
N2+ (1st neg)
N2 (2nd pos)Gate Delay = 74 nsGate Width = 10 nsgates/Exp = 1000 Acc = 1
I (
a.u.
)
λ (nm)

87
peak is somewhat puzzling. It is possible that it is a restrike (assuming 10^8 cm/s
streamer speed, then restrike would take ~10-20 ns to reach the location). However, it is
most likely the peak could be due to sheath collapse. After the pulse the density
increases and the sheath collapse due to shielding and so regions near the surface go dark
as there is no longer much electric field. But once the pulse magnitude is subcritical, the
sheath expands again and in this case one would observe a rise in emission following
decay due to diffusion. This phenomenon is observed in electric field measurements in
nanosecond point to point discharges.57 The actual mechanism is left to future work.
Figure 4-6 also shows how the intensity profile varies as a function of frequency.
It should be pointed out that at higher frequency (greater than 2 kHz), the energy per
pulse may be decreasing owing to the limits of the power supply. Another possible
mechanism is simple charge. The lower frequency gives deposited charge more time to
dissipate between pulses. Note it is the accumulation of the charge on the surface that
quenches the discharge. And here essentially unipolar pulses are featured.
Figure 4-6: Time-resolved emission spectra of the 337.1 nm second positive nitrogen band as a function of frequency at
position 1.
0 20 40 60 80 100 120 140 160 180 2000.0
0.1
0.2
0.3
0.4
0.5
0.6
Position 1
N2 (337.1 nm)
10 Hz 100 Hz
GWidth= 10 nsGDelay changingGates/exp = 1000Acc = 1
I (
a.u.
)
Time Delay (ns)

88
The temporal variation in the peaks as shown in Figure 4-6 correlated well with
time resolved images of plasma propagating through the array. The filamentary
microdischarge is clear seen after 40 ns of delay and is seen to dissipate as the delay for
the image capture is increased before increasing again during the possible restrike or
sheath collapse time. The images presented in Figure 4-7 show the 337.1 nm line
correlation with discharge morphology at 10 Hz.
Figure 4-7: Time-resolved images during the optical emission spectroscopy measurements. The images are correlated
to the intensity measured at each of the labeled time-steps for the 10 Hz pulse.
The results for the 100 Hz case are shown in Figure 4-8. A similar trend is
observed with the exception that intensity of the forward strike for the 100 Hz data had a
higher count, suggesting a possible frequency effect—which may have implications for
optimizing packed bed reactors.

89
Figure 4-8: Time-resolved imaging of position one at 100 Hz pulse frequency that is correlated to the intensity of the 337.1 nm second positive nitrogen band emission.
Similar data was collected at 10 Hz for position two located between discs 2 and 3
as shown below in Figure 4-9. The normalized intensity at position two was only a fifth
of the intensity discharge for 10 Hz that was seen with position 1. The difference in
intensity is due to the relation of position to the positive electrode as well as overall
position with the applied electric field. Since the positions of dielectrics 2 and 3 do not
provide the most direct path from the pin-to-planar electrode for plasma propagation and
formation; therefore, a less intense discharge is observed.

90
Figure 4-9: Image representing the second location of investigation between dielectric aggregate labeled 2 and 3.
The emission intensity at position two is presented in Figure 4-10. A slight
shoulder rather than a distinct second peak was observed at this location. Evolution of the
discharge correlates well with images here as well as shown in Figure 4-11.
Figure 4-10: Time-resolved emission spectrum at position 2 as a function of time and a 10 Hz frequency.
0 20 40 60 80 100 120 140 160 180 200
0.00
0.02
0.04
0.06
0.08
0.10
0.12POS 2
10 Hz
GWidth= 10 nsGDelay changingGates/exp = 1000Acc = 1
I (
a.u.
)
Time Delay (ns)

91
Figure 4-11: Time-resolved emission spectroscopy of 337.1 nm band at position 2 with a 10 Hz frequency.
The final position of interest was that of position 3. This region is important
because the discharge forms and propagates here almost simultaneously with the
breakdown at the pin electrode due to the local spacing causing a very high, localized
electric field enhancement. This high field enhancement also leads to a very intense
337.1 nm emission as shown in Figure 4-12. Also attributed to the high electric field
enhancement is the time of emission of the spectrum as it occurs at approximately the
same time in which the discharge at position one is observed. The intensity here is seen
to be nearly 2x as high as at position one and this is due to the location near the electrode
whereas at location 1 it is between the first pair of dielectrics.

92
Figure 4-12: Emission spectrum as a function of time at position 3 for a 10 Hz discharge.
The tail end of the spectrum in the 337 nm emission is distorted at later times,
giving rise to an extended shoulder at later times. Again, this may likely be due to sheath
collapse processes. This data is also compared to the fast camera as shown in Figure 4-13.
Multiple microdischarges are apparent at this electrode. Again, the image correlates very
well as expected with the time resolved emission spectra. In this case, the emission
appears to be associated with the formation of surface discharges.
The observation of plasma formation at location 3 in early time steps may be
correlated to a process known as the triple point multiplication. The triple point is known
as the region of high electric field enhancement between a dielectric material and an
electrode.58 In this setup, the triple point region is located between the planar electrode
and the two dielectrics nearest it. This localized enhancement when reaching such a high
magnitude can lead to electron field emissions. This field emission has the potential to
generate an avalanche and may be attributed to the extended shoulder of optical emission
seen within this region as well as intense filamentary microdischarges in early time steps
of Chapter III.
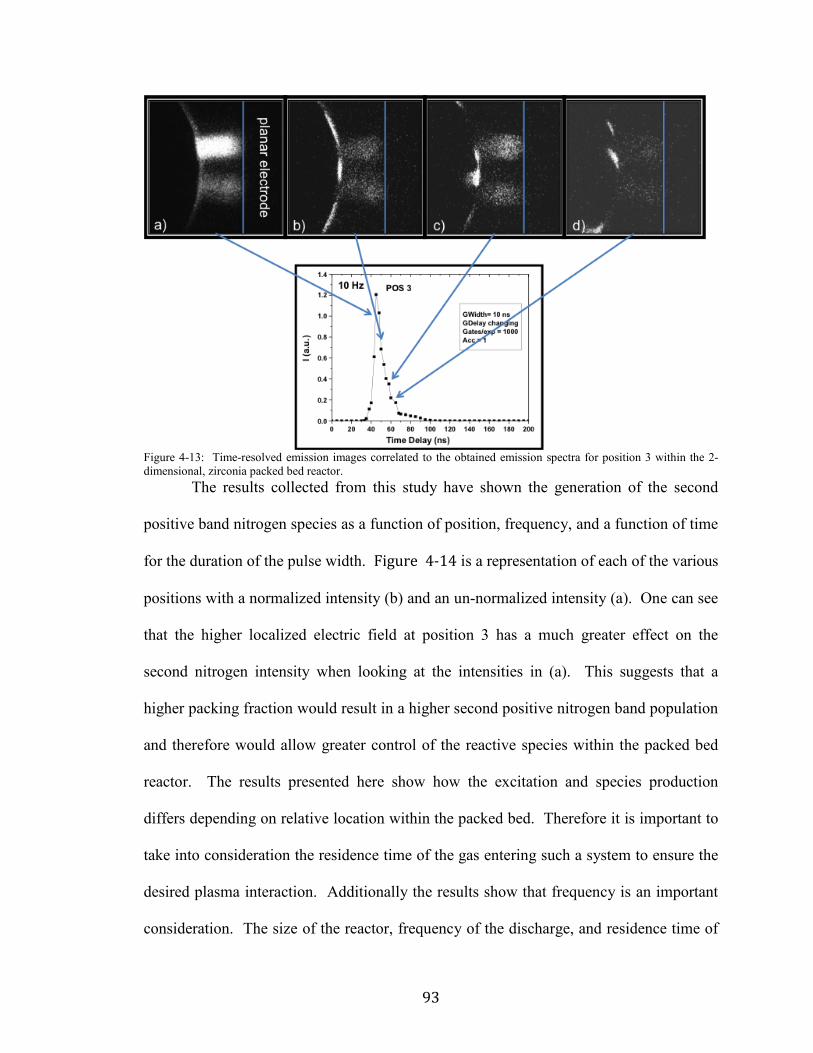
93
Figure 4-13: Time-resolved emission images correlated to the obtained emission spectra for position 3 within the 2-dimensional, zirconia packed bed reactor. The results collected from this study have shown the generation of the second
positive band nitrogen species as a function of position, frequency, and a function of time
for the duration of the pulse width. Figure 4-14 is a representation of each of the various
positions with a normalized intensity (b) and an un-normalized intensity (a). One can see
that the higher localized electric field at position 3 has a much greater effect on the
second nitrogen intensity when looking at the intensities in (a). This suggests that a
higher packing fraction would result in a higher second positive nitrogen band population
and therefore would allow greater control of the reactive species within the packed bed
reactor. The results presented here show how the excitation and species production
differs depending on relative location within the packed bed. Therefore it is important to
take into consideration the residence time of the gas entering such a system to ensure the
desired plasma interaction. Additionally the results show that frequency is an important
consideration. The size of the reactor, frequency of the discharge, and residence time of

94
the gas need to be considered for optimization of an applied packed bed dielectric barrier
discharge reactor.
Figure 4-14: Total emission spectrum at each of the positions in (a) vs. the normalized intensity positions and time-
resolved densities in (b).
4.3 A Spectroscopic Study of the organic discharge It was of particular interest to determine the nature of plasma induced emission
from organic aggregate. In particular, it was of interest to see if the plasma interaction
induced desorption of the evolution of volatile species in the gas phase. The presence of
such species gives insight into the nature of the plasma organic aggregate interaction and
possible damage effects. In this study soybean seeds were placed at the same locations as
the inorganic material with the same pulse width, voltage, and frequency of the power
supply.
First investigation into the seed aggregate was at location 1 as shown in Figure
4-15. Upon inspection of the spectra when compared to Figure 4-5, one can see that
the average intensity of spectra captured was much lower for the seed aggregate. This is
most likely due to the field enhancement of the zirconia discs owing to its higher
dielectric constant relative to the seeds. Typical seed dielectric constant is approximately
12. Reduced intensity may also be due to moisture and the formation of attaching gases

95
associated with plasma surface interactions such as heating. An example of the spectrum
taken at location one is shown in Figure 0-17 with peaks showing at the 337.1 nm N2
band, and some N2+ emission lines as well.
Figure 4-15: Top-down view of the seed aggregate in the 2-d cell with location 1 for optical emission spectroscopy
encircled. When investigating the time of plasma formation and propagation at location 1
with the time resolved spectroscopy, the first appearance of a signal is on the same order
of time as the inorganic material of ≈ 50 ns after the pulse initiation and is shown in
Figure 4-16. The variation in time of the 337.1 nm emission line is also very similar to
that of the inorganic material with a sharp increase and decrease in emission intensity.
One thing of note that was not observed at location 1 with the organic media is the
absence of the second emission peak.

96
Figure 4-16: Time-resolved emission spectrum for the 337 nm band at location one for the seed material with a pulse
rate of 10 Hz. One reason for this is that the emission intensity of the second peak is a tenth of
the initial peak and therefore may not be distinguishable from background with the
utilized setup. Another reason is likely electron sequestering by the substrate. The
surface may be sufficiently lossy that after collapse, charge is removed by surfaces or
electronegative gases or moisture evolved from the seeds. This would also tend to arrest
any restrike processes. The fully observed emission spectrum is shown in Figure 0-17.

97
Figure 0-17: Optical emission spectrum of the soybean seed taken at location one. In order to glean additional insight into the mechanisms occurring with the
organic material, location 3 was selected for observation. Location 3 is shown in Figure
4-18. A region near the planar electrode is important as it hold different electric field
enhancement effects than a seed surrounded by additional dielectric aggregate.
Figure 4-18: Image with Location 3 of the OES investigations for the organic aggregate.

98
Additionally, the plasma at this location tended to form intense filamentary micro-
discharge with the nearest seed and therefore lead to additional observed species from
outgassing or destructive surface morphology. The intensities recorded at location 3
when compared to location 1 were an order of magnitude larger for an identical setup.
This is due to the proximity of the planar electrode with the organic aggregate. Unlike
the inorganic material, a double peak is not observed here either from the lower dielectric
resulting in a lower intensity discharge or electron sequestering by the substrate. The
observed spectrum is shown in Figure 4-19 with the intensity normalized.
Figure 4-19: Time resolved OES spectrum of the 337 nm nitrogen band emission at location 3 for the organic soybean
at a pulse repetition rate of 10 Hz.
4.4 Future Investigations Using Optical Emission Spectroscopy Optical emission spectroscopy of the 2-dimensional system allowed for an
understanding of the plasma produced species as a function of time and location. It was
shown that the emission intensity increases and then decreases as the plasma propagates
through the aggregate. For the inorganic aggregate, a double peak was observed from the
sheath collapse and reforming. The same phenomenon was not observed with the organic

99
material. The unobservable second peak with the seed aggregate may be due to a lower
intensity discharge and electron sequestering from plasma material interactions. The
work presented here only touches the surface on the understanding of the species emitted
within packed bed reactor systems. Similar studies may be performed looking at the
effects of the packing fraction and higher dielectric constant material to name a few.
Further work may be performed to understand the double peak observed in the inorganic
material and why this is not observed in the organic discharge. This would include a
higher power discharge or modifications to the spectrometer system.

100
Chapter V
Atmospheric Nanosecond Pulsed Discharge Effects on Soybeans: Propagation Methods and Water Uptake
5.1 Introduction to previous work with contact angle and water absorption Dielectric barrier discharge packed bed reactors are currently being investigated
for applications ranging from ozone generation and dry reforming of methane, to volatile
organic chemical (VOC) composition.59,60,61,62,63,64 The packing dielectric is a physical
obstruction to the development of a spark or arc. Rather under the application of a time
varying voltage, the discharge manifests itself as a combination of surface and micro-
discharges. The surface area presented by the packing dielectric along with the presence
of the plasma and high electric field in interstitial spacing makes the geometry ideal for
non-equilibrium chemical processing.
As the world population continues to grow, food production will need to be
resilient and sustainable particularly against pressures such as climate change and crop
pathogens. The ability to provide nutrients to plants for deep space travel is also
important for eventual human settlements off world. In order to attain enough
nourishment for future generations and deep space, novel approaches will need to be
investigated.65 Therefore, the focus of this work is to investigate the effect of the plasma
interaction with edible, organic material such as Glycine max, commonly known as the
101
soybean. Here in this case, the packing dielectric is the soybean itself. Research from
various groups around the world have shown that plasma treatment of seeds before
planting may influence germination rates, secondary root development, shoot growth, and
even yield.66,67,68,69,70,71 In some studies, evidence has been presented which shows that
these traits can be related to a mechanical effect on the seed coat such as surface
scarification allowing for increased rates of imbibition or plasma-induced changes in
plant metabolism.72 Understanding and utilizing the biological response of soybeans to
plasma exposure may pave the way for engineering benefits such as increased yield,
elongated growing season, more resistant crops, or for less use of additional fertilizers.
Plasma discharges in air generate reactive species that can chemically react with
organic media and thus affect physiological processes in living systems. Such interactions
can effect both the thickness and porosity of seed coats. Generally, a thicker seed coat
leads to less permeability and therefore less water absorption. Soybeans normally have a
relatively thin, permeable coat.14, 73 Nooden et al., has shown that mechanical
modification to seed surfaces such as sanding can lead to higher water uptake and
increased germination rates. Not only are surface modifications of the seed coat
important, but the induced biological response of the seed to reactive oxygen species
(ROS) should also be investigated. It is known that ROS are formed in aerobic species
including both plant cells and animal’s cells as a result of cellular metabolism, with
mitochondrial activity being a major contributing source. 74 ROS can an act as
intracellular and extracellular signaling molecules and play a role in a number of cellular
signaling events that include apoptosis, gene expression, and activation of signaling
cascades.74 Such ROS may also influence plant growth and development. 75 The

102
presence of hydrogen peroxide (H2O2), and O2-, act as signaling molecules, which
regulate cell death76,77 root gravitropism78, somatic embryogenesis79, and plant defense.80
For instance, when applying cold plasma treatment on soybeans, Ling et al. saw an
increase in germination, vigor, growth, shoot length, and root dry weight.66 In their
experiment, the seeds were treated at 1 Torr pressure with an RF source operating
between two plate electrodes. The power was varied from 0-120 W and treated for a
duration of 15 seconds. Another group utilized various dielectric barrier discharge
(DBD) reactors excited with sub-microsecond high voltage pulses (40 kV and 1 kHz).67
They investigated the effect of direct treatment of seeds with plasma and the effect of
plasma activated water (PAW) on seed metabolism of radish, tomato, and sweet pepper
plants. It was found that, direct seed treatment and PAW as well as treatment using these
processes in tandem had beneficial results. These findings suggested a treatment time
dependence in which too short or too long exposure was observed to have negative
effects relative to the control sample.
Another application of the plasma treatment of seeds is surface decontamination.
The benefits of conventional antimicrobial treatments are well established.68,69,81 Such
methods include the use of calcium hypochlorite washing, heat treatment, hot water,
ammonia gas, dry heat, and acetic acid. Previous work has shown that many
microorganisms can also be inactivated by plasma. 82 , 83 Sintani, Sakudo, Burke, and
McDonnel reported that the reactive species generated in plasma contribute to the
antimicrobial effects of gas plasma. 84 Pradeep and colleagues had shown that
microorganisms such as aerobic bacteria, molds and yeasts, Bacillus cereus, E. Coli, and
Salmonella were reduced in the range of 1.2-2.2 log CFU/g upon a corona discharge

103
plasma jet treatment for 3 minutes.68 Filatova et al., investigated germination and
suppression of fungal and bacterial pathogens using a 5.28 MHz capacitively-coupled
radio frequency discharge at 0.3-0.7 Torr.69 Not only did the study conclude that plasma
treatment increases the quality, speed, and energy of germination but it also illustrated the
reduction in microorganisms such as E. coli, S. aureus, and B. subtilis as a function of rf
plasma treatment versus time. The population of microorganisms surviving tended to
decline by over 50% for E. coli and B. subtilis within the first 5 minutes of treatment with
all populations exhibiting a near 0% survivability for 10 minutes of treatment.
5.2 Description of the experiment In this work, seeds were plasma treated using two different reactors. A 2-
dimensional array of seeds was treated in a 2-D reactor shown in Figure 5-1. The
apparatus utilized an in-plane pin-to-planar electrode configuration that was sandwiched
between two quartz plates. The seeds were placed in the inter-electrode gap. This
apparatus allowed for visual time resolution of discharge propagation through the array of
seed aggregate. A pulse delay generator was employed for timing of the fast camera with
the high voltage pulser such that images may be captured at various time-steps during the
pulse duration. Time-resolved imaging of discharge evolution featuring inorganic
material in the same apparatus has been described in detail elsewhere and excluded for
brevity. 85 The reader is referred to this text for the detailed process and equipment
utilized.
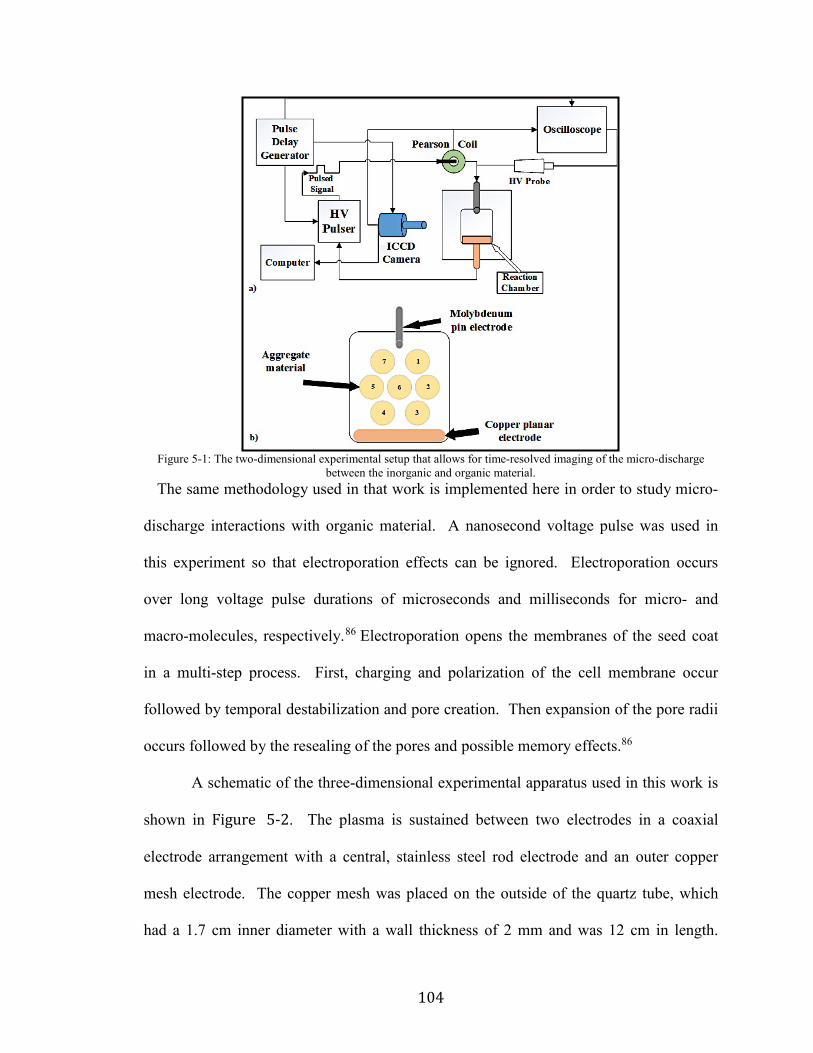
104
Figure 5-1: The two-dimensional experimental setup that allows for time-resolved imaging of the micro-discharge
between the inorganic and organic material. The same methodology used in that work is implemented here in order to study micro-
discharge interactions with organic material. A nanosecond voltage pulse was used in
this experiment so that electroporation effects can be ignored. Electroporation occurs
over long voltage pulse durations of microseconds and milliseconds for micro- and
macro-molecules, respectively.86 Electroporation opens the membranes of the seed coat
in a multi-step process. First, charging and polarization of the cell membrane occur
followed by temporal destabilization and pore creation. Then expansion of the pore radii
occurs followed by the resealing of the pores and possible memory effects.86
A schematic of the three-dimensional experimental apparatus used in this work is
shown in Figure 5-2. The plasma is sustained between two electrodes in a coaxial
electrode arrangement with a central, stainless steel rod electrode and an outer copper
mesh electrode. The copper mesh was placed on the outside of the quartz tube, which
had a 1.7 cm inner diameter with a wall thickness of 2 mm and was 12 cm in length.

105
The ends of the quartz tube were terminated with a end port plug which allowed for
electrical isolation of the electrodes and gas flow. Packing fraction of the seeds within
the reactor was taken to be nearly constant owing to the presence of the 3D printed end
plugs that ensured full utilization of the treatment volume without dead spaces on either
end of the organic aggregate. One end of the apparatus was connected to a mass flow
controller, which regulated the flow of input argon gas. The soybeans used in this
experiment were Asgrow 3-4 roundup dicamba.
Figure 5-2: 3-dimensional setup showing the coaxial dielectric barrier discharge reactor without the packing aggregate.
The experiment utilized Eagle Harbor Technologies Nanosecond Pulser-120
(EHT NSP-120) for plasma generation with two Tektronix P6015A high voltage probes
for voltage measurements, a Model 6585 Pearson Coil to measure current, and a
Tekronix 3024 oscilloscope to collect waveforms. The effect of gas type on the plasma
treatments was assessed by metering flow into the apparatus using a MKS Mass Flow
Controller which had a maximum flow rate of 500 standard cubic centimeters per minute
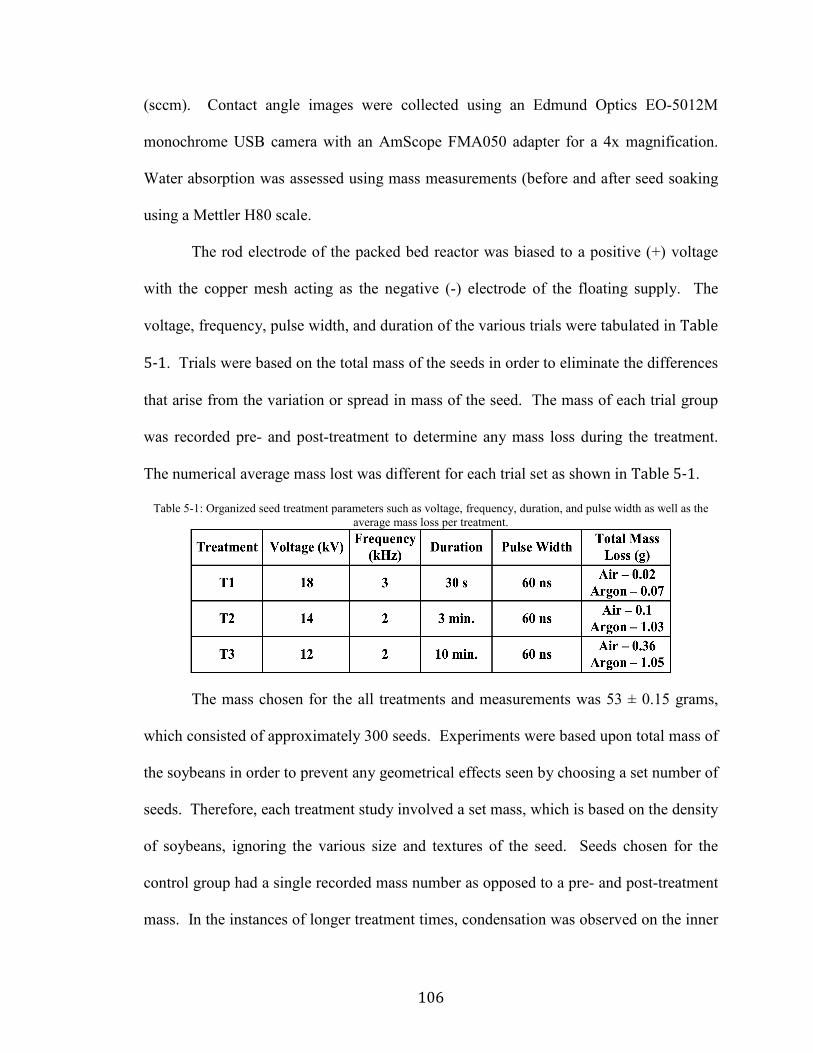
106
(sccm). Contact angle images were collected using an Edmund Optics EO-5012M
monochrome USB camera with an AmScope FMA050 adapter for a 4x magnification.
Water absorption was assessed using mass measurements (before and after seed soaking
using a Mettler H80 scale.
The rod electrode of the packed bed reactor was biased to a positive (+) voltage
with the copper mesh acting as the negative (-) electrode of the floating supply. The
voltage, frequency, pulse width, and duration of the various trials were tabulated in Table
5-1. Trials were based on the total mass of the seeds in order to eliminate the differences
that arise from the variation or spread in mass of the seed. The mass of each trial group
was recorded pre- and post-treatment to determine any mass loss during the treatment.
The numerical average mass lost was different for each trial set as shown in Table 5-1.
Table 5-1: Organized seed treatment parameters such as voltage, frequency, duration, and pulse width as well as the average mass loss per treatment.
The mass chosen for the all treatments and measurements was 53 ± 0.15 grams,
which consisted of approximately 300 seeds. Experiments were based upon total mass of
the soybeans in order to prevent any geometrical effects seen by choosing a set number of
seeds. Therefore, each treatment study involved a set mass, which is based on the density
of soybeans, ignoring the various size and textures of the seed. Seeds chosen for the
control group had a single recorded mass number as opposed to a pre- and post-treatment
mass. In the instances of longer treatment times, condensation was observed on the inner

107
surface of the reactor walls. The moisture is believed to be associated with thermal
desorption associated with localized plasma heating. A simple test was performed to
determine the temperature of the reactor during longer treatment times (i.e. greater than 3
minutes) in which the reactor operated for the duration of an hour. At the end of this
period, the reactor could be handled without any protective equipment and was found to
have a temperature of 32 degrees Celsius using a HH12A Omega thermocouple. The
reason for not observing moderate heating is due to the short duration of nanosecond
pulsed discharges that prevent significant heating effects.
For plasma activation of the tap water, an underwater atmospheric pressure
plasma jet was utilized.87,88 Compressed air passed through the jet at a rate of 30 SLM.
The plasma jet was submerged in 350 mL of tap water and allowed to operate for 5
minutes at various voltages, frequencies, and pulse widths. No macroscopic heating of
the water was observed during the treatment. pH and conductivity measurements of the
treated water were made using a ThermoScientific Orion Star A Series portable meter.
Nitrate/Nitrite measurements were made using an ion chromatograph and the peroxide
levels were made with WaterWorks peroxide check strips.
Contact angle measurements are based upon the procedure put forth by Yuan and
Lee.89 A 2.5 µL droplet of water was placed upon the seed coat and the angle of contact
with the surface of the seed was measured on each side of the seed. The angles were
averaged in order to obtain a contact angle. Images were taken at 1-minute intervals for
15 minutes. Images were taken at ascending time steps in order to view the rate of
absorption of the water into the seed.

108
The water absorption measurements were made at time intervals of 1 hour, 2
hours, and 3 hours. The seeds were separated from the water and lightly handled with a
cloth to remove any residual water droplets. The mass of the soaked seeds was then
recorded next to the pre-soak mass.
In general, the discharge propagates through dielectric aggregate in the form of
localized microdischarges and surface ionization waves. Of particular interest is the
nature of surface modification exacted on the seed due to the presence of these very
different discharge modes. Following general water absorption and contact angle
measurements, an experiment was conducted in order to determine which plasma
discharge mode had the most effect on water absorption. The various locations of surface
and microdischarges occurrence were marked to determine the effect if any on surface
conditions. A 1.0µL droplet of water was placed at the marked locations of interest. A
reduced volume water drop was used for contact angle measurements in this case in order
to ensure positioning in the effected area of interest.
5.3 Inorganic vs. Organic Micro-discharges: 2-Dimensional Cell
Seeds were arranged in the 2-D apparatus in a hexagonal array similar to that
studied previously with inorganic dielectric media.85 However, precise orientation of each
soybean varied from position to position owing to variations in seed size and shape.
Single as well as accumulated images (100) were acquired with a 5 nanosecond exposure.
An Andor iStar334 iCCD camera with a 2.4x magnification connected to a pulse delay
generator allowed for time-resolved imaging of the discharge.

109
Of particular interest is how the discharge propagates through organic media in
comparison with inorganic dielectrics. Biological material in general such as seeds
surfaces are highly textured and can be a source of desorption gases, which can locally
modify the discharge as well as the composition of the local discharge. In previous work,
with hexagonal packing of inorganic material, the discharge tended to propagate through
the media as an ionization wave consisting of a spatially and temporally alternating
propagation mode in which micro-discharges formed between media, which in turn gave
way to surface charge deposition resulting in the formation of surface discharges along
the surface media in the general direction of the applied electric field. This propagation
phenomenon was studied as a function of the pressure and dielectric constant, showing
the discharge to be localized and consistently filamentary micro-discharges (FMs) at gaps
of shortest separation between dielectric disks.
Figure 5-3 (a) is a close-up view (2.4x magnification) of the 2-dimensional
representation of the packed bed reactor and (b) is a macroscopic view of the same
discharge but of the entire system. The disks are labeled 1-7 for ease of discussion as can
be seen in the macroscopic image view and are labeled in a similar manner for the
soybean setup. Settings for the inorganic material were single pulses of 120 nanosecond
pulse widths with voltages at 20, 14, and 12 kV. Images represented here only include
results from the 20 kV data set for brevity.

110
Figure 5-3: (a) is a close-up of FM between the disks of inorganic aggregate. (b) is a macroscopic view of the
discharge throughout the inorganic aggregate at atmospheric pressure; showing that the FMs are localized in the interstitial spaces between disks.
Discharge image data for the organic material was obtained using the same
procedure as used with the inorganic material for direct comparison. Figure 5-4
represents a microscopic view of the organic aggregate discharge with a monochrome
image capture. Images (a) and (b) of the figure are taken at the same time step but one
can see that there is significant pulse-to-pulse variation. For instance, in (a) a more
intense FM can be seen in the top-left corner of the discharge but in b) the discharge
appears to be more diffuse.
Figure 5-4: Two, 5 ns exposure images of a 20 kV, 120 ns pulse through the soybean aggregate taken at the same time
step to show variation in pulse to pulse discharge paths versus the consistency of inorganic material.
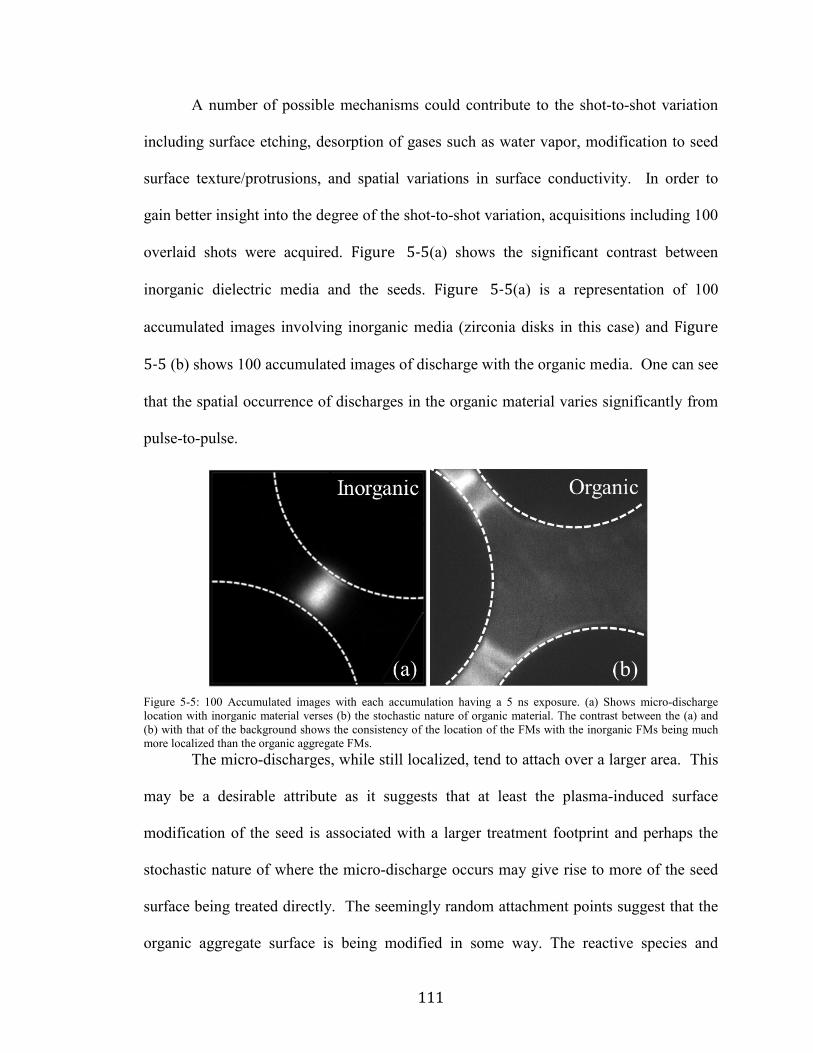
111
A number of possible mechanisms could contribute to the shot-to-shot variation
including surface etching, desorption of gases such as water vapor, modification to seed
surface texture/protrusions, and spatial variations in surface conductivity. In order to
gain better insight into the degree of the shot-to-shot variation, acquisitions including 100
overlaid shots were acquired. Figure 5-5(a) shows the significant contrast between
inorganic dielectric media and the seeds. Figure 5-5(a) is a representation of 100
accumulated images involving inorganic media (zirconia disks in this case) and Figure
5-5 (b) shows 100 accumulated images of discharge with the organic media. One can see
that the spatial occurrence of discharges in the organic material varies significantly from
pulse-to-pulse.
Figure 5-5: 100 Accumulated images with each accumulation having a 5 ns exposure. (a) Shows micro-discharge location with inorganic material verses (b) the stochastic nature of organic material. The contrast between the (a) and (b) with that of the background shows the consistency of the location of the FMs with the inorganic FMs being much more localized than the organic aggregate FMs.
The micro-discharges, while still localized, tend to attach over a larger area. This
may be a desirable attribute as it suggests that at least the plasma-induced surface
modification of the seed is associated with a larger treatment footprint and perhaps the
stochastic nature of where the micro-discharge occurs may give rise to more of the seed
surface being treated directly. The seemingly random attachment points suggest that the
organic aggregate surface is being modified in some way. The reactive species and

112
energetic particles colliding with the aggregate are interacting with the organic material,
causing the discharge location to vary up to a few hundred micrometers. Figure 5-5 (a)
with the inorganic material shows a consistent FM discharge region and not the
significantly larger region in Figure 5-5 (b). Again, some of these modifications could be
due to surface etching of the seed coat or outgassing of the seed. Other possible
explanations include biochemical changes as a result of the reactive oxygen and nitrogen
species interaction with seed coat cells. A more conclusive understanding of nature of
discharge evolution with the soybean aggregate is left for future work.
The energy per pulse of the discharge was on the order of 3 mJ and this was
determined by the analysis of the captured voltage-current waveform. The resulting
energy deposited per pulse suggests that the surface of the seed is being modified in some
way. The energy per pulse is not enough for the vaporization of water but very localized
heating has the ability to remove some moisture from the seed coat. Most likely,
however, is the pulse-to-pulse variations are due to the 3 mJ of energy being deposited
and absorbed by the molecular bonds of the seed coat. This in turn changes the
orientation of the bonds as well as possible generating new radicle attachment sites. A
slight shift in surface bond energy from 13.6 eV to 13.2 eV of a radish seed was observed
based upon sub-atmospheric plasma treatment of 80 W at 5 minutes. This changed the
bond from a C-O to a C-C. This slight modification locally changes the plasma
interaction with the surface and may attribute to the pulse-to-pulse observed variations
with the soybean aggregate as well.

113
Plasma propagation through the 2-dimensional setup with organic aggregate is
shown in Figure 5-6 via a macroscopic image capture with the iCCD camera. The first
image is a reference image showing the placement of the seeds within the cell. Seed
were chosen based upon their size in order to obtain uniformity although there are some
slight differences in seed shape. The following images (b), (c), and (d) show the plasma
formation at the pin electrode with FMs followed by SIWs across the nearest seeds.
Figure 6(d) shows a later time-step in which FMs have begun forming from the center
seeds towards those nearest the planar electrode, much like that with the inorganic
aggregate.
Figure 5-6: (a) Reference image of the seeds and electrodes configurations in the 2-D cell. (b-d) accumulated, 5 ns exposure images of the plasma formation and propagation through the organic aggregate with a wide angle lens. This figure shows the dominating propagation method and is similar to that found in the inorganic discharge images.
The importance of Figure 5-6 is that the time-resolved system-wide images are
similar to those taken with the inorganic material, suggesting that the macroscopic
plasma propagation properties mimic the inorganic discharge mechanisms. A direct

114
comparison between the inorganic and organic aggregate with the wide lens is shown in
Figure 5-7.
Figure 5-7: Direct comparison of the difference in wide lens exposure capture with (a) inorganic aggregate and (b) organic aggregate. Emphasizes the importance of similar macroscopic discharge modes between the inorganic and
organic aggregate. Qualitatively, the discharges look similar for the two cases on the macroscopic
scale. However, in each case, the intensity of FMs appears to scale with dielectric
enhancement. Here, zirconia 𝜀𝜀/𝜀𝜀0 = 26.6 and for the soybeans 𝜀𝜀/𝜀𝜀0 ≈ 12.90 Owing to
contrast and intensity scaling, the wide lens images are more sensitive to FM mode but
surface waves are indeed present.85,91 What is not so clear is the determination of which
discharge mode (FM or SIW) modifies seed physical properties such as seed coat
porosity and seed water absorption capacity (imbibition), metabolic properties, and
germination rates the most?
5.4 Contact angle as a function of treatment parameters Plasma interaction with organic substrates in particular can greatly affect the surface
energy. This is exploited for a variety of applications with the treatment of polymers
with reactive air plasma. The degree to which the surface is modified is typically
characterized through the measurement of the surface contact angle. 92 , 93 Surface
modification of the seeds was also assessed using contact angle measurement. Data used
to calculate seed contact angle changes were acquired by imaging droplets on the surface

115
of a seed with a microscope. Images were taken with a microscope camera at 1-minute
intervals up to 15 minutes in order to determine whether the treated seeds had become
more hydrophilic or hydrophobic after treatment (see Figure 5-8). The measurements
made for contact angle was produced from an average from a triplicate data set.
Figure 5-8: This image taken from Rame-Hart Instruments Co. presents the differences in contact angles of hydrophobic versus hydrophilic surfaces as well as lists physical properties represented by each contact angle.
Three treated seeds were taken from each treatment and angles were recorded on
each side of the seed and then averaged. Figure 5-8 is an excellent example of how
contact angles are measured on a flat surface. The measured angles of the treated seeds
and those wetted with PAW were then compared to the control group of non-treated
seeds with only tap water as the droplet. The contact angle of the PAW water was
investigated because of its acidic properties, which can etch polymeric surfaces. An
example of a water droplet on the seed surface is shown in Figure 5-9.
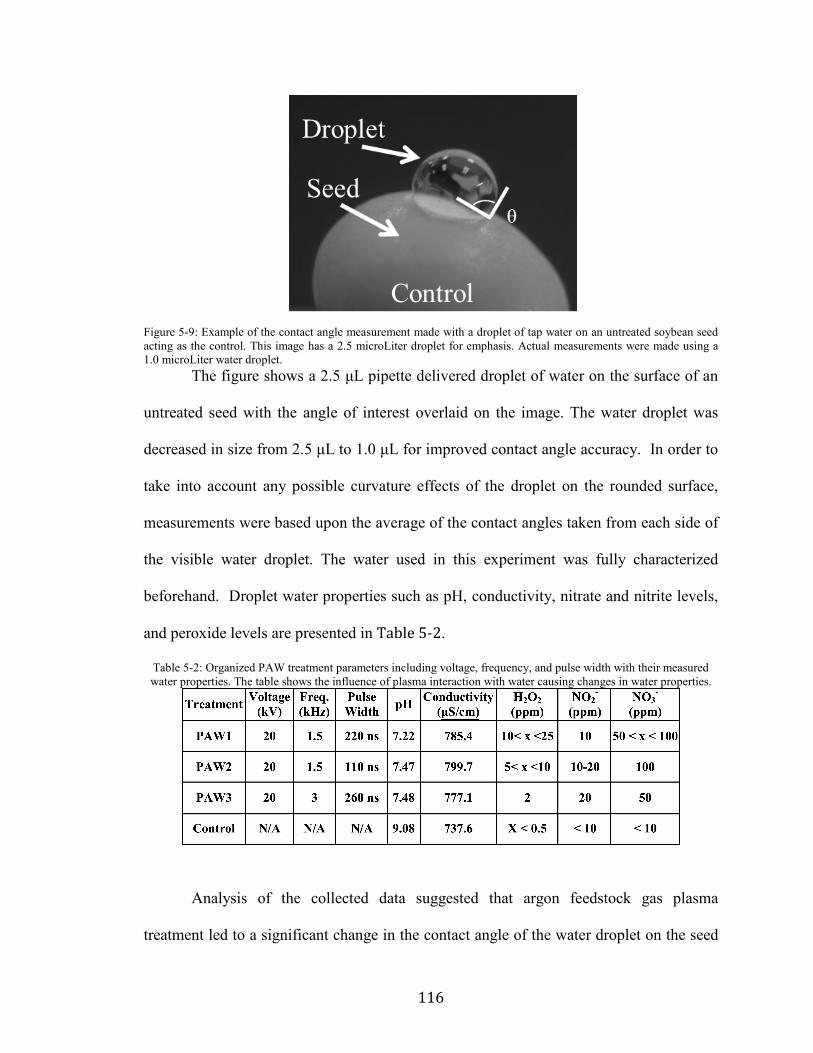
116
Figure 5-9: Example of the contact angle measurement made with a droplet of tap water on an untreated soybean seed acting as the control. This image has a 2.5 microLiter droplet for emphasis. Actual measurements were made using a 1.0 microLiter water droplet.
The figure shows a 2.5 μL pipette delivered droplet of water on the surface of an
untreated seed with the angle of interest overlaid on the image. The water droplet was
decreased in size from 2.5 μL to 1.0 μL for improved contact angle accuracy. In order to
take into account any possible curvature effects of the droplet on the rounded surface,
measurements were based upon the average of the contact angles taken from each side of
the visible water droplet. The water used in this experiment was fully characterized
beforehand. Droplet water properties such as pH, conductivity, nitrate and nitrite levels,
and peroxide levels are presented in Table 5-2.
Table 5-2: Organized PAW treatment parameters including voltage, frequency, and pulse width with their measured water properties. The table shows the influence of plasma interaction with water causing changes in water properties.
Analysis of the collected data suggested that argon feedstock gas plasma
treatment led to a significant change in the contact angle of the water droplet on the seed

117
surface. Figure 5-10 is a plot of the measured contact angle as a function of time from 1-
10 minutes. Data was collected for each of the treatment parameters that have been
outlined before in Table 5-1. As one can see, the argon gas treated sets labeled with
“Ar” had significantly lower starting contact angles than those not treated using an argon
feedstock gas. Angles less than 20 degrees, however, have high uncertainty in numerical
value of the angle due to difficulty in measuring the small angle difference between the
water droplet and the curved surface of the seed. In general, argon treated seeds tended
to result in the largest changes in contact angle. The reason for this is not clear. Argon
plasma can be expected to have a higher plasma density.
Figure 5-10: Recorded data for the contact angle measurements. ‘Ar’ corresponds to the treatments using an argon feedstock gas and air utilizing compressed air as the gas. Overall the argon treatments led to a much lower contact
angle than the air treatments.
The UV light produced in an argon plasma compared to an air plasmas is different
so the nature of UV driven surface modification such a surface bond breaking would be
different as well. The argon-air mixture in this case may translate to a higher population

118
of reactive oxygen species. Excited argon can also disassociate and ionize nitrogen
molecules, which can lead to the formation of reactive nitrogen species.
Table 5-3 lists possible gas phase reactions, labeled as ‘Nr,’ that prevail in argon
air plasmas. 94 A more thorough list may be found in reference 36 detailing kinetic
modeling of an argon plasma jet in humid air as well as references for kinetics on each
reaction.
The resulting contact angle differences between the different plasma treatments
may be associated with plasma chemistry on the substrate. Argon plasmas would tend to
be more reducing that the air plasma which drives advanced oxidation of the surface
which can lead to localized oxidation, mineralization and perhaps pinhole formation.
Other research as suggested that argon treatment can fundamentally effect the cell wall
via altered gene expressions.95 Argon plasma in the work by Winters et al, was shown to
have a greater effect on bacteria than the air plasma. Their report cites significant
alteration of gene expressions that correspond to anaerobic processes as well as the argon
plasma inducing more interactive responses with the cell walls. The air plasma mostly
interacts with the biological organisms via advanced oxidation. The argon plasma was
observed to present as the higher UV radiation dose . Due to the radiative nature of
excited argon as well as an expected significant change in the observed species, argon
plasma was seen to have a greater impact on the contact angle. Future work will provide
greater insight as to the inner workings of this system.

119
Table 5-3: A table represents some of the many possible reaction mechanisms in which reactive species are produced within the argon-air mixture plasma.
The contact angles measured from the plasma treated water were significantly
different than what was seen with the directly treated seeds. For instance, the contact
angle measurements for the treated seeds varied over a wide angle of degrees, 85 degrees
to 11 degrees, whereas the plasma activated water contact angle differences only varied
from 75 degrees to 40 degrees. The differences in the treated water were the H2O2 levels,
slight differences in pH and conductivity, and in the nitrate/nitrite levels. Due to close
similarities within the treated water groups, a significant difference in contact angle
measurements was not expected and only a slight difference was seen. These higher
contact angles show that under these plasma water treatment conditions, not much of a
difference is can be observed between this values and the control for contact angles of a
water droplet on a seed coat. The large difference between the PAW contact angle and
the direct seed treatment contact angle is however expected. The reactive species and

120
UV as well as the charged particle interactions with the seed coat can be expected to have
a much more direct impact on the permeability of the coat than slight modification of the
water properties that were seen.
An investigation was also performed in order to determine which discharge mode
(FMs or SIWs) influenced the contact angle of the water droplet to a greater degree.
Filamentary micro-discharge locations on the seed coat were marked as well as the
regions of SIW interactions. These regions of interest were then studied using contact
angle measurements. The results suggest that FM treated surfaces led to greater water
absorption than that of the SIW surface morphology. The measured FM contact angles
on average were approximately 10 degrees less than that of the SIW region of interest
(contact angle of 47 degrees verses 56 degrees). These results suggest that the FM
treated surfaces are modified to a greater degree than SIW treated surfaces. There are a
number of interaction differences that could account for this such as surface ion
bombardment and higher reactive species dose owing to the highly localized nature of the
FM. These measurements give insight into the design of treatment reactors. For
example, based on these preliminary findings, it may be desirable to promote more
filamentary micro-discharges than the SIWs. Further studies are required to fully assess
the impact of discharge mode type on seed viability. For example, exposure time and
damage considerations will have to be explored as well.
5.5 Water Absorption
5.5.1 Direct Seed Treatment The aforementioned treatment parameters were applied to more treatment sets of
seed and activated water for water absorption tests. A percent mass difference was then
calculated for each trial at differing respective time intervals. The seeds for each set

121
under investigation were placed in identical containers for 1, 2, and 3-hour intervals with
the same amount of water. Enough water was placed in the containers such that the water
would not be fully absorbed in that amount of time. Figure 5-11 shows the percent mass
difference of the treated seeds using the seed mass before and after soaking the seeds in
water. The red ‘dashed’ line across the figure is the percent mass increase of the control
at the end of three hours.
Figure 5-11: Representation of the percent mass difference from the recorded mass of the data set after treatment and then again after the allotted absorption time. The red ‘dashed’ line represents the value of percent mass difference of the control at three hours and allows for easy visual comparison of the results. The labels ‘Ar’ represent the argon feedstock gas treatments verses the ‘Air’ feedstock gas.
The dashed line allows for easy visual comparison amongst the different
treatment sets with the control. Within the first hour, the control group absorbs more
water than 3 of the 6 treated sets but is only comparable at the 2-hour mark and then falls
into last place at the 3-hour mark when comparing strictly to the treated seed data. After
three hours, the control group had an increased mass percentage of 58.9% but was 5.5%
behind the T3-Argon treated group that had the most water absorption after three hours.

122
Following the leading group at the three-hour absorption measurement was another argon
gas treatment set then two air treated sets followed by the short duration argon treatment.
When comparing the percent mass difference from the water absorption trials to
that of the contact angle measurements, one can see the expected correlation of a lower
contact angle resulting in higher water uptake. Figure 5-10 represents the contact angle
measurements of the seeds treated within the reactor. The correlation of the low contact
angle measurements of the T3-Argon and T2-Argon sets with Fig. 11 shows agreement
with hydrophilic effects of the argon treatments. A point of interest of these figures is
that the T2-Argon treatment granted the lowest contact angle measurement but resulted in
the second most water absorption behind the T3-Argon treatment. This result suggests
that there may be some influence on the conditions of the treatment and the biological
response that also impact water absorption of the seed.
5.5.2 Plasma Activated Water Results Water absorption with plasma-activated water (PAW) is also of interest as PAW
is reported to have beneficial developmental effects reported within the literature. Plasma
activated water is of interest as manipulation of water properties may help promote
biological growth and development of certain organisms. Plasma activated water was
included in this report to determine if modifying water properties had an influence on
imbibition and contact angle. The seeds used were not plasma treated although the water
droplet had been modified.
Treatments of the PAW occurred over a duration 5 minutes. Water absorption
measurements were made using a set of untreated seeds within the 53 ± 0.15 gram limit.
The plasma activated water was then supplied to the seeds for the various 1, 2, 3-hour
interval sets. Results of the water absorption test had shown less of a percent mass

123
difference than the control group at time interval as shown in Figure 5-12. The overall
water absorption for each of the three PAW sets at the end of three hours of absorption
did however remain close to the final control value of 58.9% with percent mass
differences of 57%, 56.9%, and 57.6%. The water uptake similarities between the plasma
activated water trials and the control was expected to be similar if one correlates to the
proceeding argument regarding contact angle measurements and water absorption. Since
the PAW had contact angle values similar to that of the control seed and control water, a
significant difference here would be surprising. The difference that is seen, however,
may be attributed to the different chemistry within the water due to the plasma treatment
and therefore may also interact biologically different to the seed coat.
Figure 5-12: Representation of the percent mass difference from the recorded mass of the data set before absorption and then again after the allotted absorption time using the PAW. The red ‘dashed’ line represents the value of percent mass difference of the control at three hours and allows for easy visual comparison of the results.
The nature of plasma propagation through a bed of seeds was investigated in both
a 2-D and 3-D apparatus. It was found that morphologically, plasma propagation through
a seed aggregate is similar to that of inorganic media. That is, discharge propagated as an
ionization wave featuring FMs between media and SIWs along the surface of media. FM
tended to be less localized in the case of the seeds suggesting feedback from the surface

124
due to etching or outgassing. Such feedback tended to increase the active areas exposed
to the more intense micro-discharges. The effect of plasma treatment of seeds was also
assessed via contact angle and water absorption tests. It was found the Ar mixtures
tended to have the greatest effect on seed contact angle.
The filamentary micro-discharges also influenced the contact angle more so than
the regions in which surface ionization waves had dominated. This work should provide
insight into the design of packed bed reactors for seed treatment. An investigation was
conducted in regards to the surface energy of the seed coat by measuring the contact
angle of treated seeds and treated water. These tests resulted in argon treatment of the
seeds leading to a much lower contact angle than the identical air treatment. The plasma
activated water also had a different contact angle than just the control seed and control
water with an initial angle resulting around 70 degrees for each trial set with the control
being around 80 degrees and the treated seeds from 85 degrees down to 11 degrees.
Finally, a correlation was made between the contact angle measurements and the amount
of able to be absorbed by the seed in a set period of time. A lower contact angle was
shown to result in higher mass amount of water absorption by the seed. In this work, the
direct treatment trials exhibited higher water absorption than the plasma activated water
trails. Plasma activated water absorption was found to be similar to the control group.
5.6 Concluding Chapter Remarks The experimental campaign pursued within this chapter was to determine the
effects of the direct plasma treatment of seeds on water absorption as well as the
inclusion of plasma activated water. It was shown that the direct treatment of the seed
did have an impact on the contact angle observed on the water droplet. Air treatments
were shown to decrease the contact angle but not nearly as much as the argon plasma
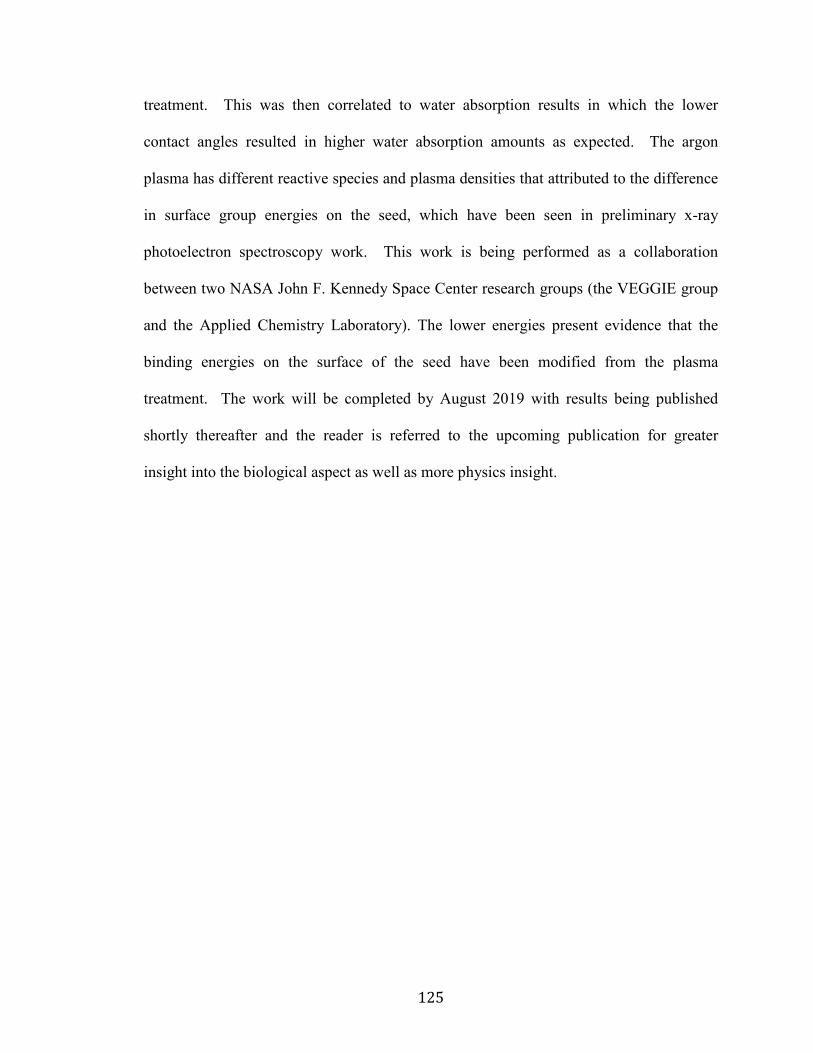
125
treatment. This was then correlated to water absorption results in which the lower
contact angles resulted in higher water absorption amounts as expected. The argon
plasma has different reactive species and plasma densities that attributed to the difference
in surface group energies on the seed, which have been seen in preliminary x-ray
photoelectron spectroscopy work. This work is being performed as a collaboration
between two NASA John F. Kennedy Space Center research groups (the VEGGIE group
and the Applied Chemistry Laboratory). The lower energies present evidence that the
binding energies on the surface of the seed have been modified from the plasma
treatment. The work will be completed by August 2019 with results being published
shortly thereafter and the reader is referred to the upcoming publication for greater
insight into the biological aspect as well as more physics insight.
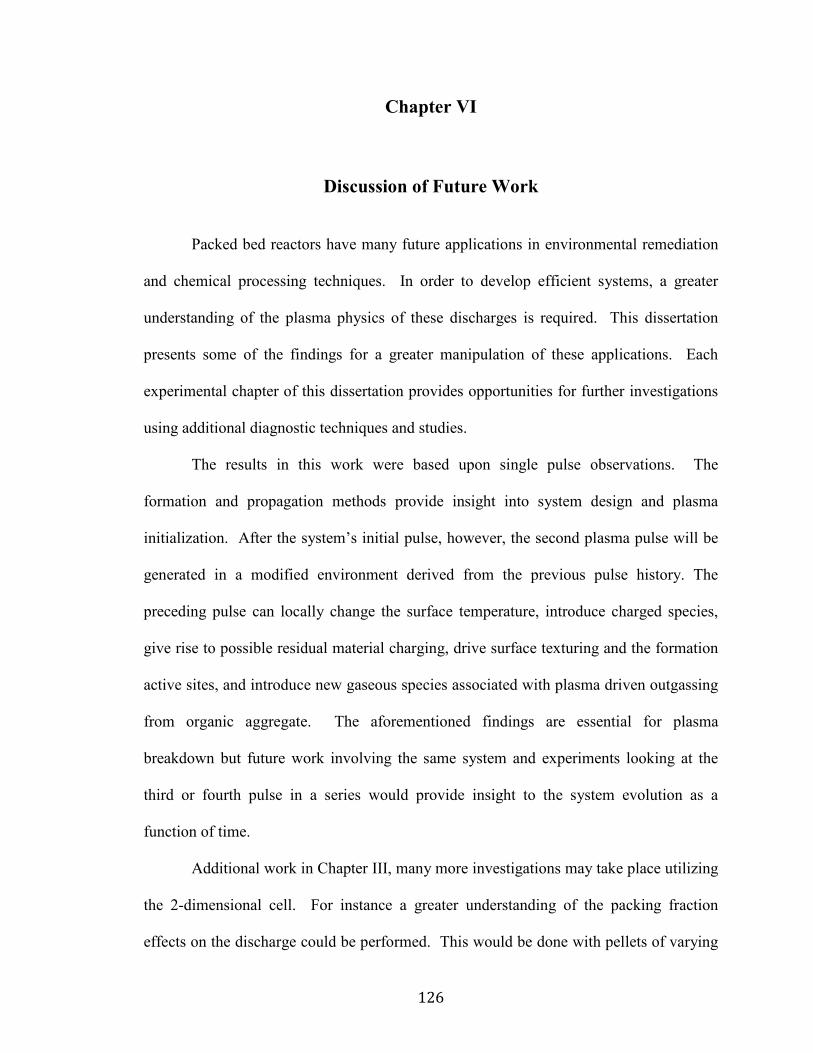
126
Chapter VI
Discussion of Future Work
Packed bed reactors have many future applications in environmental remediation
and chemical processing techniques. In order to develop efficient systems, a greater
understanding of the plasma physics of these discharges is required. This dissertation
presents some of the findings for a greater manipulation of these applications. Each
experimental chapter of this dissertation provides opportunities for further investigations
using additional diagnostic techniques and studies.
The results in this work were based upon single pulse observations. The
formation and propagation methods provide insight into system design and plasma
initialization. After the system’s initial pulse, however, the second plasma pulse will be
generated in a modified environment derived from the previous pulse history. The
preceding pulse can locally change the surface temperature, introduce charged species,
give rise to possible residual material charging, drive surface texturing and the formation
active sites, and introduce new gaseous species associated with plasma driven outgassing
from organic aggregate. The aforementioned findings are essential for plasma
breakdown but future work involving the same system and experiments looking at the
third or fourth pulse in a series would provide insight to the system evolution as a
function of time.
Additional work in Chapter III, many more investigations may take place utilizing
the 2-dimensional cell. For instance a greater understanding of the packing fraction
effects on the discharge could be performed. This would be done with pellets of varying

127
sizes of the same dielectric material in a limited volume. This was not performed for this
report, as manufacturing of the materials is difficult and expensive. Additionally, the
implementation of a laser for laser induced fluorescence measurements would give
information on the plasma such as electron temperature and species densities. Changing
the dielectric constant of the material while keeping the same aggregate shape and size
would also be an insightful investigation as to how the electron temperature and species
density profile’s would change.
Chapter IV would build off of the different investigations of continuing the work
of Chapter III. Optical emissions spectroscopy techniques and laser-induced
fluorescence provide additional details to this work and allow for a greater understanding
of the plasma manipulation. The work here leads to the ability to manipulate the species
produced with the dielectric aggregate material. Additional work in this chapter would
include an increase in the variation of aggregate with larger dielectric constant values.
Investigations of aggregate particle size on the discharge species would also be of interest
for the optimization of packed bed reactors.
Chapter V is an understanding of the plasma biological interactions. The results
presented herein provide insight as to how the plasma forms and propagates in an organic
packed bed reactor system. The findings led to a greater understanding on how to change
the contact angle of the seed and which plasma treatment conditions resulted in the
highest recorded water absorption. Future work in this chapter would involve surface
analysis of the soybean seed coat as well as a more complete characterization of the
plasma activated water. For the direct plasma interaction with seeds, surface analysis
would include scanning electron microscope (SEM) imaging, x-ray photoelectron

128
spectroscopy (XPS), and atomic force microscopy (AFM). The SEM imaging would
provide visual inspection of the seed surface to determine any morphology from the
plasma interaction with the polymer-like seed coat. Additionally XPS would determine
the modifications in the surface bond energies due to the plasma interactions. The XPS
system etches away surface layers as well that would provide insight as to the penetration
of plasma species into the biological material. A slight shift in the measured surface
energies will tell whether the surface is a C-O dominated bond or a C-C or C-N. This
data will also provide information on the energy of the particles bombarding the surface.
Lastly, AFM may be used to correlate the bonds found with the XPS system. Precaution
must be taken with the AFM as it may influence the measurements based on the
methodology of the measurement.
The plasma activated water for agricultural purposes in this section are
preliminary and the first task of future work would be to better characterize the water
modifications resulting from plasma interactions. Following this, the characterized water
properties from plasma treatment may be correlated to the suited growing conditions of
the plant for growth trials. Resulting in a tailored water treatment for the promotion of
specific plant growth.
Appendix A is on the application of a plasma packed bed dielectric barrier
discharge in an agricultural setting. The work presented here was a starting point into the
investigation of direct plasma treatment on germination and early growth development.
Additional work here needs to be performed with a large number of treated seeds in order
to gain a better statistical result. To understand the effects on primary and secondary root
development, the roots need to be separated from the plant and dried in an oven. The

129
overall root dry mass for each treatment would tell how the different treatments affect
early root development beyond the taproot length measurements presented. An
experimental campaign may also be undertaken in regards to the mRNA up and down
transcription. The transcription process observes protein production rates of a specific
gene that may then be correlated to select physiological traits. A selection of the gene
UPBEAT1 has already been chosen for these tests as it correlates to root development.
Equipment is available at the University of Michigan to begin these tests and contact has
been made with an associate professor for training and use of the machines. The growth
and germination trials mentioned within Chapter VI would also now involve the plasma
activated water in parallel experiments that record the same metrics. Direct comparisons
may then be discussed between the direct plasma treatment of the seeds and the effects of
plasma activated water.
Overall the discharges of packed bed reactors and micro-porous media are
complex and the report of this thesis is to shed light on the discharge propagation and
formation. A greater understanding of the discharge propagation was found and relates to
factors such as voltage, dielectric constant of the media or aggregate, packing fraction,
frequency, species production, and whether the material is organic or inorganic in nature.
Each chapter grants a new understanding of the packed bed setup with the final two
chapters providing an application approach.

130
Appendix A
Plasma Interactions With Organic Material: Applications To Agriculture
A.1 Introduction to Glycene max: The Soybean Organism
A.1.1 Brief History of the Soybean and its industrial use in the United States The soybean was first cultivated in southeastern Asia region of China, Manchuria,
and Korea in the wild form of the plant called Glycine ussuriensis.96 The cultivation of
the soybean plant is recorded in ancient Chinese literature. The importance of the
soybean in modern day use is that the seeds can be produced more cheaply as compared
to other similar crops, is rich in oil, high in protein for edible products, and has a high
yield capacity. The first extensive use of soybeans in the European market was for the to
make soft soaps and later in the United States for soap, paints, lard, and butter substitutes
with the ground cake being used for cattle feed.
Soybean integration into US markets at significant levels started just after the first
World War. Soy foods were encouraged as a source of protein during the war when
nearly a decade before, George Washington Carver determined its value by producing
edible oil and meal.97 Soybeans saw extensive use as a supplement for animal feed
during this time. The development of the combine in 1920 greatly improved harvesting
efficiency of the soybean. Then in 1922, the first U.S. soybean processing plant opened
in Decatur, Illinois which brought about wide-spread implementation of the crop in the

131
Midwest region. 98 An interesting use of the soybeans between world wars was
implemented by Henry Ford. Henry Ford had directed the Ford Motor Company to
create a car that was constructed from soy-based plastics.99 The project had however
ended at the start of World War II due to refocusing of industry on the war effort. During
the war, soy became an essential part of the American diet for its oil use as well as
tofu.100 Post-war, the soybean became an inexpensive, valuable source of protein and
production bloomed drastically as the U.S. livestock and poultry production began to
increasingly use the soy meal in feed. The domestic market expanded greatly throughout
the 1950s and 60s giving rise to the American soybean market to become the largest for
exports. From the 1970s onward, soybeans remained a significant part of American
exports by volume and dollars. Technological advances have brought upon genetically
modified organisms (GMOs), which have resulted in higher yields along with advanced
machinery allowing ease of harvest and processing, and more efficient industrial
processing techniques.
Figure A-1: Semi-aerial view of soybeans being grown on Engeling Bros. Farms in the central Illinois region.
A.1.2 Soybean Biological make-up Soybeans like most angiosperms develop from seeds to seedlings to mature
plants. The first stage of growth in the seeds is germination in which the seed begins to
awaken with the emergence of the seed radicle.101 Following the emerging radicle, the
cotyledons develop from the hypocotyl, which are the first photosynthetic structures of
the soybean plant. The representation of the soybean plant and each of the structures are

132
shown in Figure A-2 for reference. These cotyledons are the first source of nutrient
collectors by acting as the
Figure A-2: A diagram that represents the stages of soybean development with the plant’s components labeled.
seed’s leaves for the first 7 to 10 days. Following the first stage of germination is when
the seed begins to mature and develop its first leaves and then additional leaves as the
plant develops. Reproductive stages of the soybean plant are based on flowering, pod
development, seed development, and plant maturation. The pods produced almost reach
full size before the seeds begin to develop. As the plant matures, the leaf and pod begin
to yellow at the same time and therefore showing maturation. The duration in which
maturation is achieved depends on the variety of the plant but generally occurs on the
order of days to weeks. The root system has three distinctly defined components known
as the primary root or taproot, the secondary or lateral roots, and then the tertiary roots
that originate from the lateral roots.102

133
One of the most important structures of the soybean is its seed coat. The seed
coat is responsible for water imbibition, prevents soaking damage 103 , 104 , 105 , 106 and
protects against deterioration.107 Seeds that do not readily uptake water are considered
hard and may not even begin development in favorable conditions for prolonged
periods.108 The barrier system for soybean seed coats for water permeability is similar to
some genotypes of Glycine max are composed of structural and chemical composition.109
Vu et al., performed water absorption experiments and acquired scanning electron
microscope images of the seed coat surfaces of six different genotypes in order to study
the seed coat. This study indicated where water entered into the seeds via fluorescent
trace dye. Variations in rate of water imbibition, the compositions of the seed coat, and
locations of water entry into the seed were assessed as well. Overall soybean
development can be influenced by temperature, day length, and variety among other
factors and therefore this can lead to considerable variation to the number of days
between developmental stages.110,111
A.1.3 Influence of electroporation effects on soybean on soybean germination Electroporation of cell membranes in order to increase the permeability is widely
used in research and industry.112 Electroporation is the application of an external electric
field via electric pulses that force open pores in cells. It is generally classified into a four
stage multi-step process: 1) charging and polarization, 2) temporal destabilization and
pore creation, 3) expansion pore radii, and 4) re-sealing and memory effects.113 The
duration of the electric pulse is dependent upon the target organism’s cell size and
structure. The typical pulse durations for small organisms is on the microsecond time
scale and milliseconds for large organisms.114 Time-scales of the electric pulses utilized
within this dissertation, however, are on the nano-second time scale. Based on previous

134
work, electroporation effects based upon pulse width are only of interest below 10 ns and
the pulses used here are either 60 ns or 120 ns.115 Additionally it was found that the
electric fields needed for cell apoptosis are on the order of 2x greater than those
simulated within the ANSYS: Maxwell model. Additionally, the opening of the cells
and conductance was seen to be reversed after nearly two minutes in another study,
negating water absorption from electroporation.116 After treatment of the seeds, a time
greater than two minutes was required for equipment disassembly and seed transfer. In
this regard, electroporation effects in this work have been disregarded. Future work may
further investigate and validate this assumption.
The most applicable use of current day electroporation is for gene insertion and
drug delivery into living cells. The cell membrane opens up because the conductivity of
the cell membrane is order of magnitude lower than the cell cytoplasm and cellular
medium as described in work elsewhere.117,118,119 The effects of electroporation may be
reversible or irreversible based upon the parameters of the electric pulses. For the
opening of the cell membrane to be fluid, a threshold value of the membrane potential
may not be exceeded in which the membrane disintegrates and usually ends with cell
loss. 120 Overall, electroporation is a beneficial procedure for biotechnological and
medical applications. The details of the physics and biological response are beyond the
scope of this work and is left for further investigation by the reader within the referenced
articles.
A.1.4 ROS/RNS Roles with physiological development Reactive oxygen (ROS) and reactive nitrogen (RNS) species are naturally
occurring within the cells of organisms. Through metabolic processes plants produce
some of the same ROS that are produced by air plasma.121,122,123,124 These ROS and

135
RNS play roles in various processes in the developing plant such as dormancy alleviation
and germination (high accumulation of ROS during these processes and then ultimately a
high release of ROS during germination, thought to potentially be involved in pathogen
defense). Figure A-3 depicts the complexity of the ROS and RNS cross-talk within the
plant structure corresponding in the plant Arabidopsis.125
Figure A-3: Chart produced by Y. Yang et al. that shows the cross-talk of some of the ROS and RNS species in the
well characterize plant Arabidopsis. H2O2’s involvement in these processes has been well studied to date. Proteins in
particular are sensitive to the presences of ROS and RNS.
Zhang et al., had shown that argon plasma can have a growth-inducing effect on
soybean sprouts.Error! Bookmark not defined. This effect was determined by studying the
regulation of demethylation levels of energy metabolism-related genes. A 6-day-old
sprout was in contact with the argon plasma. This work related gene expression of
adenosine triphosphate (ATP), target of rapamycin (TOR), growth-regulating factor
(GRF), and the corresponding mRNA expression. The group used an AC dielectric
barrier discharge reactor operating at 60 Hz and 10-22 kV rms. The power of the reactor
during experiment varied from 3.4 to 15.6 Watts. This work found that argon plasma
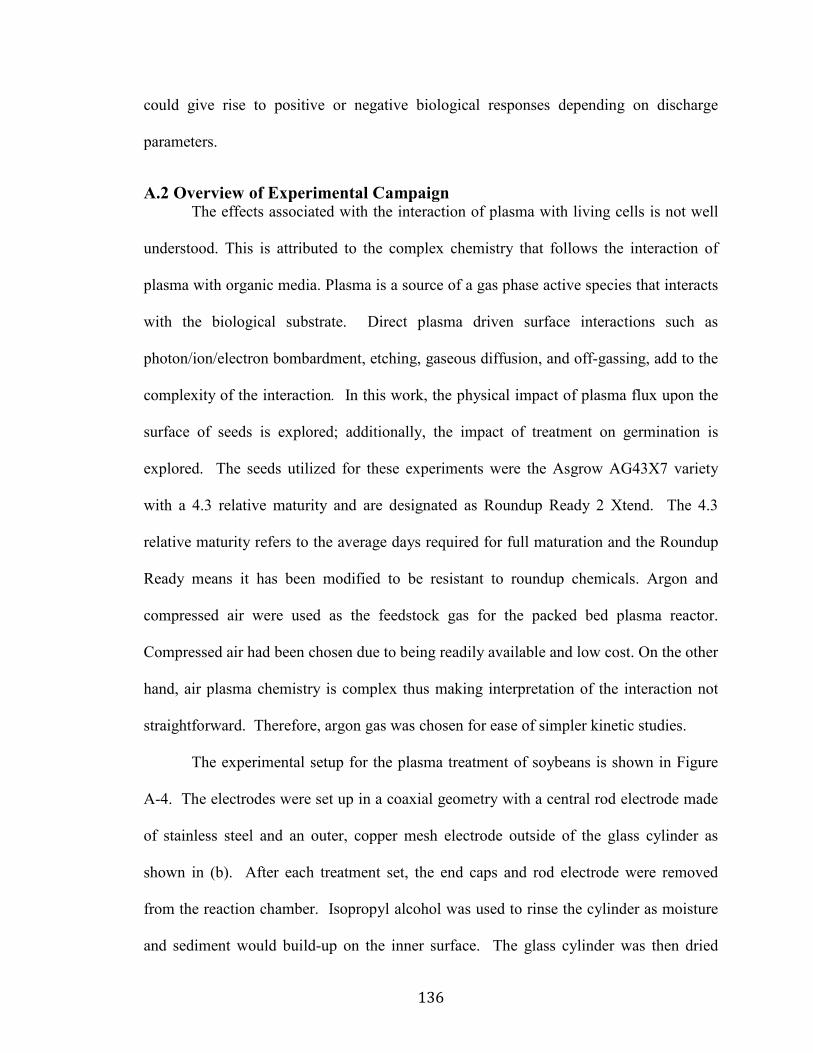
136
could give rise to positive or negative biological responses depending on discharge
parameters.
A.2 Overview of Experimental Campaign The effects associated with the interaction of plasma with living cells is not well
understood. This is attributed to the complex chemistry that follows the interaction of
plasma with organic media. Plasma is a source of a gas phase active species that interacts
with the biological substrate. Direct plasma driven surface interactions such as
photon/ion/electron bombardment, etching, gaseous diffusion, and off-gassing, add to the
complexity of the interaction. In this work, the physical impact of plasma flux upon the
surface of seeds is explored; additionally, the impact of treatment on germination is
explored. The seeds utilized for these experiments were the Asgrow AG43X7 variety
with a 4.3 relative maturity and are designated as Roundup Ready 2 Xtend. The 4.3
relative maturity refers to the average days required for full maturation and the Roundup
Ready means it has been modified to be resistant to roundup chemicals. Argon and
compressed air were used as the feedstock gas for the packed bed plasma reactor.
Compressed air had been chosen due to being readily available and low cost. On the other
hand, air plasma chemistry is complex thus making interpretation of the interaction not
straightforward. Therefore, argon gas was chosen for ease of simpler kinetic studies.
The experimental setup for the plasma treatment of soybeans is shown in Figure
A-4. The electrodes were set up in a coaxial geometry with a central rod electrode made
of stainless steel and an outer, copper mesh electrode outside of the glass cylinder as
shown in (b). After each treatment set, the end caps and rod electrode were removed
from the reaction chamber. Isopropyl alcohol was used to rinse the cylinder as moisture
and sediment would build-up on the inner surface. The glass cylinder was then dried

137
with a cloth through the inner opening. During the treatments, oxidation of the electrode
would also occur and therefore after each operation the electrode was cleaned with
sandpaper, rinsed with isopropyl alcohol, and dried before re-installation into the 3-
dimensional chamber.
Figure A-4: A simple schematic of the experimental setup utilized for the treatment of the soybeans for germination in
growth trials. The complete seed treatment parameters are presented in Table A-1. Batch #2*
and Batch #12* are denoted from values modifying for the 7-day growth period. These
values were modified by accident but led to positive results. The direct treatment of the
seeds within the packed bed reactor varied based upon voltage, frequency, duration, pulse
width, and feedstock gas type. The discharge conditions set for treatment with a pulse
width of 60 ns, pulse peak voltage of 18 kV, and a frequency of 5 kHz. This maximized
plasma coverage of the aggregate. At the beginning of the experimental campaign, 13
different treatments were chosen at varying ranges of power deposition as shown in Table

138
A-1. Settings were chosen for both ‘high’ and ‘low’ power output in regards to supply
limitations. The reactor was packed for treatment based upon selected mass amount of
seed. This means that each treatment had a number of seeds that weighed 7.7 +/- 0.15
grams. A set mass was chosen due to the variations in soybean size and shape. An image
of plasma formation throughout the 3-dimensional packed bed reactor is shown in Figure
A-5 following the treatment parameter table.
Table A-1: A complete list of all of the treatment parameters employing the EHT-NSP-120 power supply for plasma generation during the soybean seed treatment in the packed bed reactor.
Treatment Name
Voltage (kV)
Frequency (kHz)
Treatment Duration
Pulse Width (ns)
Batch #1 14 2 20 mins. 60 Batch #2 14 4 15 mins. 60 Batch #3 14 2 15 mins. 60 Batch #4 14 2 10 mins. 60 Batch #5 14 2 3 mins. 60 Batch #6 14 4 10 mins. 60 Batch #7 14 4 3 mins. 60 Batch #8 12 4 20 mins. 60 Batch #9 12 4 15 mins. 60
Batch #10 12 6 20 mins. 60 Batch #11 12 6 15 mins. 60 Batch #12 12 4 10 mins. 60 Batch #13 12 6 10 mins. 60 Batch #2* 14 2 15 mins. 60
Batch #12* 14 3 3 mins. 60 W18-1 16 3 30 s 60 W18-2 16 3 30 s 120 W18-3 18 3 30 s 60
N-1 18 2 2 min 60 N-2 10 3 7 min 30 E-1 15 2 5 min 90 R-1 12 2 10 min 60

139
Figure A-5: Image of the plasma formation and propagation in the 3-dimensional packed bed reactor filled with
soybean aggregate. At some of the power settings condensation was seen on the inside of the tube,
burn spots on the seed, as well as carbon buildup on the central rod electrode, and a burnt
smell. The trials at the higher power for longer durations were significantly more
damaging to the seed coat upon visual inspection. The damage which included cracking
or splitting and will be discussed in the following subsections with more detail. Electrical
diagnostic waveforms were captured with two P6015A Tektronix high voltage (HV)
probes and a Model 0585 Pearson coil. A HV probe was placed at each electrode of the
reactor with the grounds of each probe jumpered to Earth ground. A Model 585 Pearson
coil recorded the current.
Plasma activated water used for the germination and growth trials was produced
using an underwater plasma jet. This jet was excited using low frequency sine waves and
a low frequency, nanosecond pulse. An FID and Eagle Harbor Techn. Supply explored
the ns regime. Air flow rate into a quartz tube of ≈ 710 SCCM. Different power supplies
were implemented into this study due their varying effects on the properties of the treated
water. For instance, the AC plasma jet over a comparable time period led to more
thermal heating, greater change of the pH, NO3- concentration, and NO2
- concentration
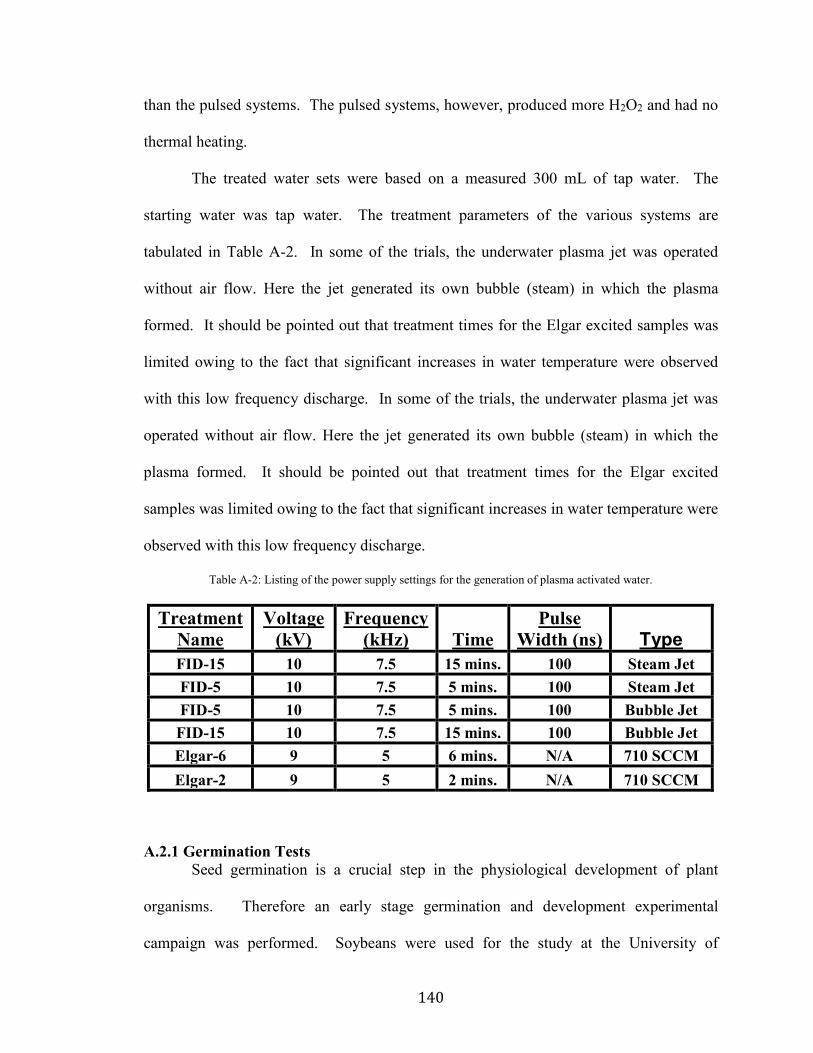
140
than the pulsed systems. The pulsed systems, however, produced more H2O2 and had no
thermal heating.
The treated water sets were based on a measured 300 mL of tap water. The
starting water was tap water. The treatment parameters of the various systems are
tabulated in Table A-2. In some of the trials, the underwater plasma jet was operated
without air flow. Here the jet generated its own bubble (steam) in which the plasma
formed. It should be pointed out that treatment times for the Elgar excited samples was
limited owing to the fact that significant increases in water temperature were observed
with this low frequency discharge. In some of the trials, the underwater plasma jet was
operated without air flow. Here the jet generated its own bubble (steam) in which the
plasma formed. It should be pointed out that treatment times for the Elgar excited
samples was limited owing to the fact that significant increases in water temperature were
observed with this low frequency discharge.
Table A-2: Listing of the power supply settings for the generation of plasma activated water.
A.2.1 Germination Tests Seed germination is a crucial step in the physiological development of plant
organisms. Therefore an early stage germination and development experimental
campaign was performed. Soybeans were used for the study at the University of
Treatment Name
Voltage (kV)
Frequency (kHz) Time
Pulse Width (ns) Type
FID-15 10 7.5 15 mins. 100 Steam Jet FID-5 10 7.5 5 mins. 100 Steam Jet FID-5 10 7.5 5 mins. 100 Bubble Jet FID-15 10 7.5 15 mins. 100 Bubble Jet Elgar-6 9 5 6 mins. N/A 710 SCCM Elgar-2 9 5 2 mins. N/A 710 SCCM

141
Michigan Botanical Gardens using the packed bed dielectric barrier discharge method
with the Eagle Harbor Technologies nanosecond pulser. The average germination rate of
this particular organism is 1-2 days and emergence from the soil occurring three or more
days after planting according to the Asgrow information website.126 The study allowed
for data to be collected over the course of four days. This was to allow for collection of
data on seeds that might germinate later than the published average. The extra time also
allowed for early primary root development measurements to be made, color changes to
begin occurring, and in some cases even the significant emergence of the cotyledons.
Measuring the primary root length during these tests was important because 76 percent of
soybean roots grow in the top 38 centimeters of soil under the best conditions, with the
ability to grow downward at a rate of 1.25 cm per day. Therefore, the primary root
growth rate and root emergence time is important.
Post treatment, the seeds were placed in an open, well-ventilated container in
direct sunlight and enveloped in a paper cloth. The paper cloth was implemented to help
retain moisture. 50 mL of tap water was added to the seeds within the vented container
on the first day with the paper cloth retaining the moisture. Each additional day during
the 4-day test, 10 mL of additional tap water was added to the treated set to ensure the
seeds did not dry out. The temperature was kept around 29.5 °C, receiving equal
amounts of sunlight per day via time-controlled lamps. The seeds were then carefully
removed from the bag at the same time for each trial at the end of the fourth day. The
color of the seeds was recorded as well as the taproot length and any secondary root
development. Data was logged via pictures and measurement spreadsheets that were
connected to the respective treatment parameters.

142
A.2.2 Growth Trials Early developmental growth trial experiments were performed to gain insight into
the possible effects of plasma treatment of seeds during early physiological development.
The results of the germination tests showed an influence on germination parameters but
these do not necessarily correspond to changes in early stage development. Therefore in
order to study development, the botanical gardens at the University of Michigan was
utilized to actually plant the seeds. A large volume of soil of one type was acquired to
eliminate variability. The growth trials were allowed to germinate and develop for the
duration of 12 days before being harvested for measurements. The seeds were placed
individually in a flat that contained 72 pods. Up to 10 flats would be in use at one time.
Each pod was filled two-thirds full with fresh soil before a seed was placed. The exposed
seed was then covered with soil up to the brim of the pod. Each freshly planted pod then
received 20 mL of tap water and was placed in the greenhouse. The plants were in a
climate-controlled environment at the Matthaei Botanical Gardens at the University of
Michigan.
Every other day, an additional 10 mL was pipetted unto each pod. The controlled
watering ensured equal conditions for each of the seeds and the flats were evenly spaced
underneath the growth lights. The temperature within the research greenhouse was only
allowed to fluctuate a few degrees Fahrenheit, ensuring similar conditions for each data
set. The overhead grow lamps were set to a timer, controlling the amount of growth light
available. An example of the facility and setup of the soybean growth trials is shown in
Figure A-6. The various treated seeds were marked by a colored tag placed in the pod
corresponding to

143
Figure A-6: Image representation of the flat of a growth trial in which the treated and control seeds have been
designated with a color-coded tag. the treatment performed on the seed. Each flat had 72 pods divided into sections of 6
pods. Within each section, seeds from all of the treatment sets were planted randomly
with their colored tag. This is to ensure that no one treatment set received more light than
other sets based upon physical location in relation to the growth lights. After each
watering, the flats were re-positioned in order to try and promote an even irradiance
during the trial period.
The soybean plants were “harvested” after their growth period with notes taken on
appearance. The harvesting of the plants involved carefully removing them from the pod
and gently washing the roots to remove and soil particulates still adhering to the surface.
The 12-day grown plant was then laid out and measured from the tip of the taproot to the
top of the primary growth node. Observations of cotyledon color and primary leaf
emergence was also noted. Each plant height from the various treated groups and the
control was then compared as well as a group mean and averaged was computed. The
primary root length and plant height was measured by a cut made separating the roots
144
from the plant near the point of soil emergence. The point on the stem in which
photosynthesis had begun to affect the stem’s color determined the cut location.
Although taproot length data is crucial for analysis, it was also important to determine the
amount of secondary root development as it differed drastically depending on the
treatment.
In order to determine the promotion of additional secondary roots, two different
procedures were considered. The first procedure involves counting each branching
secondary root and each of the further branching nodes off of the secondary root. The
second method involved performing a dry mass measurement of the entire root system.
The roots, after being cut and measured, were placed upon wax paper and allowed to dry
in an oven at 70 degrees celsius for the duration of three hours in order to get
approximately 90% of the moisture out. In order to attain 100% moisture loss, a bake-out
time on the order of three hours was required. A longer bake-out time was not chosen for
the data collection due to the interest of time. This shortened bake-out time was
consistent for each of the trail sets. Future work involving a research grade laboratory
oven would allow for the longer bake-out times required for near 100% moisture
expulsion. Additional information such as the number of leaf and secondary leaf
development could have also been recorded for further insight into physiological
development but was not collected at this time.
A.2.3 Disinfection and Sanitation in the Literature Plasma sterilization has been considered for the disinfection of pathogens for
applications ranging from sterilization of medical tools to the removal of bacterial from
fruits and vegetables. 127,128 Such methods can be used to remove the bacterial load on

145
seed surfaces thereby extending seed storage life as well as improved survivability during
germination
Plasma sanitation of the seeds during pre-sowing treatment or the sprouts post
treatment may prevent some of the fungal developments seen below in Figure A-7(b). In
(a), one can see that fungus has decimated the germination and growth of a significant
portion of the flat with a close-up image in (b). Of the 72 untreated seeds in this flat,
only 26 of the plants germinated with 10 of those 26 having any significant growth
development. Of the remaining 46 non-germinating pods, 38 had shown little to severe
fungal growth. The ability to determine if the plasma treatment of the seeds, before or
after being sown into the ground, improves plant survivability is a goal of this study.
Figure A-7: Example of some of the fungal developments that may occur with older, unsterilized seed. The images were taken from a control data set in which no seeds were treated with (a) being the entire flat and (b) a close-up.
A.3 Results of Germination Trials
A.3.1 Air Treatment Germination Results Compressed air was the first feedstock gas to be used with the packed bed
dielectric barrier discharge reactor for the germination test study. The feedstock gas inlet
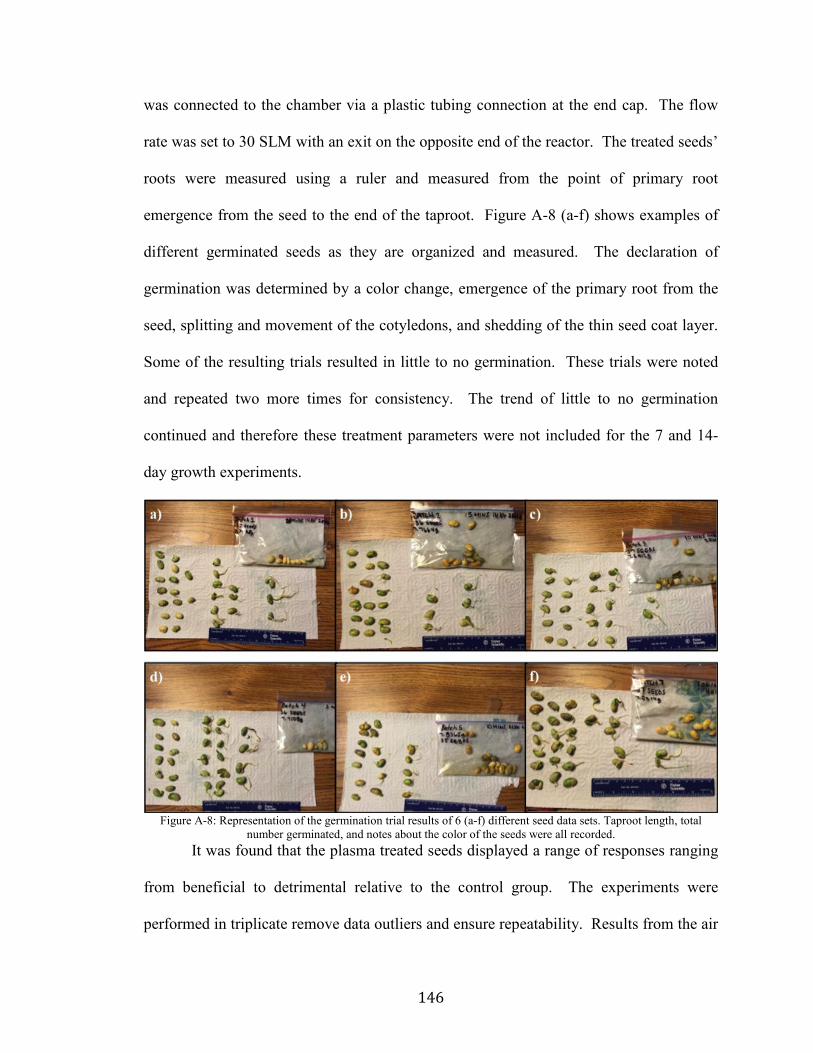
146
was connected to the chamber via a plastic tubing connection at the end cap. The flow
rate was set to 30 SLM with an exit on the opposite end of the reactor. The treated seeds’
roots were measured using a ruler and measured from the point of primary root
emergence from the seed to the end of the taproot. Figure A-8 (a-f) shows examples of
different germinated seeds as they are organized and measured. The declaration of
germination was determined by a color change, emergence of the primary root from the
seed, splitting and movement of the cotyledons, and shedding of the thin seed coat layer.
Some of the resulting trials resulted in little to no germination. These trials were noted
and repeated two more times for consistency. The trend of little to no germination
continued and therefore these treatment parameters were not included for the 7 and 14-
day growth experiments.
Figure A-8: Representation of the germination trial results of 6 (a-f) different seed data sets. Taproot length, total
number germinated, and notes about the color of the seeds were all recorded. It was found that the plasma treated seeds displayed a range of responses ranging
from beneficial to detrimental relative to the control group. The experiments were
performed in triplicate remove data outliers and ensure repeatability. Results from the air

147
treated germination studies over the first treated parameter sets led from germination
values ranging from 17% to 76.50% as compared with the control whose germination
percentage was near 72%. The results of the seeds with germination percentages
comparable to the control and will be considered for future implementation is shown in
Table A-3.
Table A-3: Results from the first four germination trial data sets.
Air-plasma Treatment Germination Tests
Treatment Name
Avg.% Germ.
Control 71.80 1 76.50 2 69.50 3 68.65 4 67.30 5 72.60 7 64.71 9 71.90 12 70.85
The germination tests generally resulted in values that were comparable to the
control for the air-plasma treated soybeans. Batch #1 appeared to germinate on average
about 5% higher than the control group. These results were used to select the appropriate
treatment parameters for 14-day growth tests. Each of the treatments presented in Table
A-3 were repeated and planted. As one will notice in the following sections, Batch #1
eventually is no longer mentioned and this is due to poor performance during the growth
trials when compared to other treatments. Therefore the results from the germination
trials allowed for a down select to occur for treatments with high germination rates and
then the later growth trials determine the longer-term effects of the plasma treatment for

148
further down-selection. To determine if the higher germination percentage would
correlate the same with a different feedstock gas such as argon but with the same
treatment parameters, another experimental campaign was performed.
A.3.2 Argon Treatment Germination Results Argon germination trials were held to the same standards and procedures as the
air treated plasma data sets. The seeds were treated and then placed into the soil and
given 20 mL of water each initially and then 10 mL of water for every second day after
treatment. A point of concern when performing the argon trials was that the seeds had
begun to lose germination capabilities due to long-term storage that was not in ideal
storage conditions. The results from the argon treatment trials will be discussed here but
only briefly as the experiments should be repeated with fresh seed to better determine
plasma-induced effects and not natural biological effects.
The argon treatment germination trials were performed for and compared amongst
the W18-3 and R-1 treatment parameters with a control. Future work was to involve
experiments involving the complete list treatment parameters seen previously in Table A-
1. For each argon treatment, there was an identical air-plasma seed treatment performed
in order to reduce the effects of natural seed longevity mechanisms. Briefly, the
comparisons of the argon germination trials were on the same order of the control and air
treatments within 3% of each other’s average germination percentage near an 85%
average. The main difference between these germination tests and the previous
germination tests is that these tests were performed on the select group of treatments that
had the highest germination parameters and therefore varied less than some of the
previous germination trials. For the W18-3 air and argon, the germination percentages
for each when compared to itself was within 2% and therefore considered identical.

149
However, for the air and argon feedstock gas treatments utilizing the R-1 parameters, a
drastic change was recorded. For the air treatment, a germination percentage was
recorded to be near 80% for these data sets but the R-1 treatment with argon feedstock
gas led to a reduction in germination to only 20%. Further diagnostics of the plasma
properties and species being produced is needed to have a more conclusive reasoning
behind such a drastic difference.
A.3.3 Plasma Activated Water Influence on Germination Results The plasma activated water was treated in three different ways for germination
trials. The first form of treatment was a steam jet employing the use of an FID
nanosecond pulser with the voltage set to 10 kV and the frequency set to 7.5 kHz with a
pulse width of 100 ns. The second was performed using the same power supply but
varying the compressed air flow rate to where the plasma would form in bubbles and then
enter the water and therefore changing the reaction mechanisms occurring within the
water. The third treatment of generating the plasma activated water in this section
implemented the AC supply from ELGAR with 9 kV voltage and 5 kHz frequency with a
compressed air flow rate of 710 SCCM. These trials were not performed in large
quantities and therefore only preliminary data is presented here. Future work should
involve larger number of flats for less chance of natural statistics influencing the data.
The resulting germination percentages from each of the small seed trials resulted
in a range from 91-100% as shown below in Table A-4. Some caution should be taken
with these numbers until a larger data set is acquired but the acquired data is presented
below albeit brief. The results had shown the best results with the steam jet treated water
on germination than the other plasma activated water treatments. The control was given
tap water for the tests.

150
Table A-4: Tabulated germination results from the use of plasma activated water for six differing treatment parameters.
Treatment % Germ. Duration Steam Jet 100 15 mins. Steam Jet 100 5 mins. Bubble Jet 95.83 5 mins. Bubble Jet 91.67 15 mins.
Elgar 91.67 6 mins. Elgar 95.83 2 mins.
Control 97.92 N/A
Although it seems as though the steam jet plasma activated water resulted in the
best germination percentages, more extensive testing is required. When comparing the
water properties of the various treatments, the Elgar supply had shown the most change
in pH level with the 6-minute treatment leading to reading of 4.97 and the 2-minute with
6.61. The tap water of Ann Arbor maintains a pH level near 8 and the bubble Jet trials
had brought the pH to a 7.25 and 6.72 level readings for the 5 and 15 minute treatments,
respectively. The steam jet saw little to no change in pH with the readings remaining in
the high 7’s. The conductivity of the water was recorded and ranged from the 500’s
μs*cm-1 in the bubble and steam jets to 600 and 760 μs*cm-1 for the 2-minute and 6-
minute Elgar treatments. A more extensive study on water properties affecting soybean
germination and development is required in order to provide a more definitive analysis of
the plasma activated water effects. Therefore, this section remains non-conclusive on
complete effects of the aforementioned treatments but do suggest that there is some
biological response to the varying water properties.
A.3.4 Comparisons between the Effect of Air and Argon Discharge Treatments that had led to higher secondary root development or longer length
taproots did not necessarily correspond to the best results as seen with the germination
151
tests. For instance, some had better germination test results such as Batch #1 but overall
eventually was no longer utilized with the growth trials that occurred over the 14-day trial
due to poor performance. In order for more insight to be gleaned from the direct plasma
interaction with the seeds, it was necessary to begin the growth trials and collect data on
germination, root development, and shoot length. Continuing the growth cycle to full
maturation would provide the most data for analysis on physiological development, yield,
long duration water uptake, and disease resistance among other traits. The selected seeds
require 110 days to reach full maturation and therefore only data on the early
developmental stages was collected and will be discussed in the following sections.
Overall, the results of the plasma activated water trials provided insight into both
beneficial and detrimental effects on the soybean plant and further studied to obtain a
greater understanding in how long term physiological development is modified.
A.4 Growth Trials Air plasma treated growth trials are split into two collective data sets. One
treatment set had a 14-day growth period and the second set with a 7-day growth period.
Each growth period will be discussed with their respective data set. Growth trials were
initially started with 13 different treatment sets shown in Table A-1 utilizing the EHT
NSP-120 power supply and allowed to grow over a two-week period. The different
treatments were chosen over a broad power deposition range in order to perform a broad
study for proof-of-concept before narrowing down to a more specific voltage, frequency,
and pulse width range. Table A-5 is a representation of the 14-day growth trial treatment
parameters. The results of the two-week trials had led to selection of the best treatment
parameters to be continued for further testing. Each of the ‘Batch’ trials was chosen from
the preliminary results with best germination, root development, and growth seen.

152
Following the initial trials, additional treatments were implemented to explore various
pulse widths as well as shorter duration treatment times. Further exploration of these
parameters is left for future work but the second set of growth trials as well as any of the
argon feedstock gas treatments involved the parameters seen in Table A-5.
Table A-5: Categorized power supply settings for the EHT NSP-120 during the treatments for the growth trials. These settings were determined from previous proof-of-concept preliminary data results. The treatment names are arbitrary and provide no context to the supply settings.
The results of this section were performed with the 14-day trial set parameters as
well as the new exploratory treatments. The differences in visual plasma observations
have been excluded for brevity. The newer treatments involved sub-minute long
treatment sets. A shorter duration treatment time is desired to be explored for the essence
of economics of plasma generation but is outside the scope of this thesis.
A.4.1 Air growth trials Air growth trials were conducted in two separate experimental campaigns. The
first preliminary testing involved 14-day growth trials in which the top treatments were
chosen for continued testing for the 7-day growth trials. This transition was made such
that more data could be collected in a more manageable timeline with quicker
Treatment Name Voltage (kV) Frequency
(kHz) Time Pulse Width (ns)
Batch #1 14 2 20 min 60 Batch #2 14 2 15 min 60 Batch #5 14 2 3 min 60 Batch #9 12 4 15 min 60
Batch #12 14 3 3 min 60 W18-1 16 3 30 s 60 W18-2 16 3 30 s 120 W18-3 18 3 30 s 60
N-1 18 2 2 min 60 N-2 10 3 7 min 30 E-1 15 2 5 min 90 R-1 12 2 10 min 60

153
experimental turnaround. The growth trial plants were carefully harvested by gently
removing the plant from the flat and placing the roots with soil still attached to them in a
few centimeters of water. This was done in order to soften up the dirt that attached to the
root system. They were only allowed to soak for a few minutes in order to prevent any
effect on the plant itself. The soaking of the plants in water is shown in Figure A-9.
Figure A-9: A captured image of the freshly harvested soybeans after the 14-day growth trial.
The 14-day growth trials were done over a broad parameter range with treatment
duration times on the order of minutes. Figure A-10 shows the resulting data of three
treatments (Batch #1, Batch #2, and Batch #12) and the control group. The germinated
seeds were placed into four differing categories based upon the length of the primary root
or taproot at the end of the four-day, controlled experiment. Category nomenclature was
designated as short (0-3 cm), medium (3-6 cm), long (6-9 cm), very long (9-12 cm), and
other as 12+ cm in length. As one can see, the dominating portion of each respective
chart is within the short taproot length range with percentages ranging from 50-74%. The
average germination of the different groups over the triplicate data set is seen in the

154
Figure A-10. The variation in percent germination of these four selected data sets is only
7% from the lowest to highest.
Not represented in the Figure A-10 are treatments that had a significantly negative
impact on the germination percentages of the seeds with few or none of the seeds
germinating. The treatment parameters resulting in low germination rates were repeated
in triplicate.
Overall Batch #1 held a 6% higher germination rate than control group with the
other presented data differing by only a few percentage points. Recording the length of
the primary root during the germination trials led to the first insight into the plasma
induced physiological changes have other than strictly affecting contact angle and water
absorption. For instance, not only did Batch #1 have a slightly higher germination rate
than the presented data set in Figure A-10, the overall length of the primary root was on
average longer. Having a longer taproot is important for the development of the plant. A
longer taproot provides benefits such as a better anchor to the soil and able to obtain
water from deeper locations during droughts. The fibrous roots, however, are quick to
absorb surface water and can also respond more quickly to any fertilizer applications.

155
Figure A-10: Plots of the 14-day growth trials comparing the best of Batch #’s 1-12 with the control group
are shown in (a-d). Each includes the length of the primary taproot as well as average germination percentages.
The results of the two-week growth trials also included observations on the
tertiary or secondary root development of the plants. The plasma treatments were seen to
have beneficial and negative impacts on secondary root development. In cases of
positive effects, the branching nodes of the primary root were more numerous as well as
having a more fibrous branching on each of the offshoots. Counting of each of the
secondary and fibrous roots was not performed due to the essence of time. Dry root mass
measurements were planned for greater insight for future experimental data collection but

156
an error was made in the data collection and was never repeated. The roots were cut near
the point of emergence and allowed to bake in an oven at 70°C for 45 minutes. An image
of roots cut and dried out for the mass measurement in such a procedure is shown in
Figure A-11.
Figure A-11: Image in regards to the procedure for how the dry root mass measurements were baked in an oven for 45
minutes. Photo Credit: Joseph Xu, Senior Multimedia Producer at the University of Michigan. The second set of data collected for air plasma growth trials was the shorter, 7-
day growth period that involved the treatment sets of the 14-day growth trials as well as
new treatments. The new parameters varied in voltage, frequency, and pulse width but
with much shorter treatment durations. The sub-minute treatments were implemented in
this data set to elucidate whether or not short treatments would have beneficial
physiological effects as well as improving cost-benefit economics. The air growth trials
conducted over 7-days resulted in data the led to the W18-3 treatment having the best
positive influence on root development, shoot length, and taproot length as shown in
Table A-6. The data present has been placed in descending order based upon the highest
average and mean length numbers determined from the data collected.

157
Table A-6: Results in measurements of the 7-day growth trials.
Treatment Names
Avg. Shoot Length
(cm)
Avg. Tap Root Length
(cm) Mean Shoot Length (cm)
Mean Taproot
Length (cm) W18-3 9.35 9.165 10.01 9.25
Batch #5 9.01 8.795 10.1 8.9 R-1 9.41 8.575 9.9 7.9
Control 8.74 8.12 9.29 8.11 N-2 8.41 7.64 8.75 7.225
W18-1 7.68 7.85 8.45 8.5 W18-2 6.61 6.64 6.8 7.05
N-1 7.55 5.98 7.6 6.65 E-1 4.93 3.63 4.5 3.9
Four out of the four growth trials performed when comparing the W18-3 treatment
data to the entire data set resulted in this treatment having the best results out of other
treatment sets and the control group. The only time the W18-3 treatment resulted in a
second place growth data set was with a different feedstock gas and will be discussed in
the concluding remarks of this section. Of all the resulting trials for 7-day growth, 3 out
of the 9 selected treatments averaged better than the control groups averaged as shown in
Table A-6. Of the 3 treatments that averaged better than the control groups, one set
(W18-3) had a treatment duration of 30 seconds with the other two, Batch #5 and R-1,
having times of 3 minutes and 10 minutes, respectively. The results of these trials
suggest that the shorter treatment times are not only more cost-effective from an
economic standpoint but also resulted in an increase in average and mean shoot and
taproot lengths over the course of a 7-day grow period.
Some cases led to short primary roots with numerous, fibrous secondary root
development whereas a few treatment parameters led to mostly single, lengthy primary
roots. Figure A-12 shows an example of root variations of a select few plants from the

158
control group (a), Batch #2 treatment (b), and Batch #12 parameters (c). Upon
investigation of (a), one can see that the primary root of the soybean plant has a primary
taproot length of a few centimeters with fibrous secondary roots beginning
Figure A-12: Image comparing the primary and secondary root development traits of the control (a), Batch #2 (b), and Batch #12 (c).
to develop. The treatment named ‘Batch #2’ led to visually similar results as seen in (b).
Finally, in FigureError! Reference source not found. A-12(c) one can see more
significantly more secondary root development as opposed to the images in Figure A-
12(a) and (c). The easiest way to observe this difference is to observe the large amount
of soil still clinging to the root system. A thorough cleaning was not performed for fear
of damaging and removing the secondary roots.
A.4.2 Argon growth trials Although the air trials were much more numerous in study, some argon plasma
treated seed growth studies were also performed and data were recorded. The argon

159
plasma differs from the air plasma in the variation and population of reactive oxygen and
nitrogen species within the packed bed reactor. The populations of the reactive species
are controlled by the implementation of argon gas as the plasma generating gas. Since
argon is a noble gas and flushes out the air within the reaction chamber, the populations
of plasma generated ROS and RNS would be significantly lower than that of air plasma.
A point of concern when performing the argon trials was that the seeds had begun to lose
germination capabilities due to long-term storage (under non-ideal conditions). The
results from the argon treatment trials will be discussed here but only briefly as the
experiments should be repeated with fresh seed to better determine plasma-induced
effects and not natural biological effects. Table A-7 is a representation of a select few
treatments in which the operational parameters were implemented for air and argon
feedstock gas supplies.
Table A-7: Tabulated measurement results from the argon gas treatments to the air treatments.
Treatment Feedstock
Gas AVG. Shoot Length (cm)
AVG. Taproot
Length (cm) Mean Shoot Length (cm)
Mean Taproot
Length (cm) W18-3 Air 9.90 8.93 10.53 8.87 W18-3 Argon 8.42 6.68 8.73 6.55
R-1 Air 8.19 7.84 8.30 7.90 R-1 Argon 8.10 4.26 8.80 4.30
Control N/A 9.26 7.72 9.59 7.08
The tabulated data was acquired for a 7-day growth period. The data in Table A-7
shows that the values for the W18-3 air treatment had the highest averages for shoot and
taproot lengths as well as the highest mean values. Although these results were obtained
with a smaller data set than the 14-day air treatment trials, the variation in length obtained
from the data sets suggests plasma influence on plant development past the stage of
germination. These results were also surprising when comparing them to the water

160
absorption and contact angle measurements presented in the preceding chapter. Argon
gas treatments were shown having a lower contact angle and therefore treated seeds were
able to absorb more water as confirmed in the water absorption tests. The benefit of
being able to absorb more water did not directly correlate to more rapid growth
development as presented by the comparison of values between the W18-3 air and W18-3
argon sets. The average shoot length of the air set was 1.48 centimeters longer with the
taproot length holding a 2.25 cm increase. The mean of the shoot and taproot lengths
were also 1.8 and 2.22 cm higher for the air treatment, respectively. The differences in
the argon and air trials from water absorption and contact angle measurements to the
early stages of physiological development suggest the important role that the plasma
generated ROS and RNS might play.
Overall, the W18-3 data set with a shorter duration treatment time had led to more
beneficial results than the other treated sets and the control. The control for these results
came in a tied second place with another air feedstock gas trial (R-1) and once again
insinuating the importance of having ROS and RNS species within the plasma. The tests
repeated on a larger scale and for a longer duration grow period would further provide
insight into the effects on later stage development.
A.4.3 PAW growth Trials The second set of PAW was generated for 2 and 6-minute durations using the AC
Elgar supply. This method had a greater influence on the plasma pH than the FID
nanosecond pulsers with the pH of the water for the 6-minute treatment getting as low as
4.21. Such a low pH of the water generated positive results on the germination and
development of the soybean seeds over the 7-day growth period. The results on the
physiological development of the soybean utilizing plasma activated water is presented in

161
Table A-8. The results of these tests are preliminary and should still be further
investigated with increased number of studied plants.
Table A-8: Tabulated results from the 7-day growth trials that implemented plasma activated water instead of direct seed treatment.
Treatment Duration AVG. Shoot Length (cm)
AVG. Taproot Length (cm)
Mean Shoot Length (cm)
Mean Taproot
Length (cm) Steam Jet 15 mins. 7.67 7.12 7.45 5.8 Steam Jet 5 mins. 7.09 5.26 6.85 5 Bubble Jet 5 mins. 9.14 9.16 9.5 8.7 Bubble Jet 15 mins. 11.18 7.58 11.3 7.7
Elgar 6 mins. 8.81 8.68 10.05 7.9 Elgar 2 mins. 11.51 7.97 11.6 7.4
Control N/A 8.90 6.81 9.57 6.70
Soybeans typically grow well in a slightly acidic soil with the optimal pH range
between 6.3 and 6.5.129 The low pH of the PAW generated with the Elgar supply seemed
helped to simulate the acidity and seemed to help promote germination. Overall the 2-
minute Elgar PAW data set with a pH of 6.5 seemed to have the best results of the entire
data set. The shoot length was an average of 2.59 cm longer than the control with the
taproot being 1.16 cm longer on average. The group that performed the second best
utilized the FID GmbH nanosecond pulser for a duration of 15 minutes and was similar to
the Elgar 501SL supply with average shoot length being 0.4 cm less and average taproot
0.39 cm less. If either of these supplies were implemented on an industrial scale for
applications in agriculture, a cost analysis would be performed based upon power
consumption and the more efficient per kilowatt-hour system would be preferred.
This conclusion, however, should be further investigated, as the pH of the water
was not the only property to be affected by the plasma interaction. The nitrate and nitrite
levels of the water changed as well as the peroxide levels. In order to gain a better
162
understanding of the effects on pH, on soybean germination and growth, a more
controlled study should be performed without plasma treatment and only manipulation of
the various water properties.
A.4.4 Concluding Remarks The results of the various experimental parameters previously discussed have
shown that plasma treatment of soybeans and plasma activated water has the potential to
beneficially effect the physiological development of soybeans during the germination and
early growth stages. Germination results have shown that the treatment of seeds with air
show improvements over an untreated control and with argon as the feedstock gas
resulting in slightly negative effects. Growth trials of the 14-day and 7-day experimental
campaigns have shown that plasma effects shoot length by increasing the average height
of the plants as well as increasing the average length of the taproot. These results
correlate oppositely to the higher water absorbing treatments in the previous chapter and
suggest that although argon feedstock gas treatments increase water absorption, the ROS
and RNS generated in air-based plasma cause a more beneficial biological response.
A.4.5 Anecdotal evidence of an effect During the growth trials, 2-4 treated sets were recorded with better physiological
development than the control. A similar amount would have results comparable to the
control group with the remainder performing poorly. These results occurred consistently
over 9 separate growing trials comparing the entire set of the differing treatment
parameters. A final, 10th round of treatment sets was also recorded during the campaign
in which the seeds were set to germinate in grow in unfavorable temperature conditions
with the background temperature stabilizing near 20°C which is 9.5°C below the favored
temperature range of the Glycine max.130 Low temperatures are known to retard seedling

163
emergence and leaf development causing the emergence stage to vary from 5 to 15 days.
Visual observation of this data set before harvesting had shown the entirety of the treated
set performing more optimistically than the untreated control. By this, the stem of the
treated plants were on average nearly 3 centimeters longer in length than the control
group and had more secondary root development than the control with comparable
taproot length. The results of this test were set to be repeated within a walk-in climate
controlled system in order to ensure repeatability of the test but the facility was never
acquired. A future study of plasma treatment allowing germination of the plants in
harsher environments might lead to an extension of the growing season from the current
timeline by an estimation of a week and therefore promote socio-economic change for
farmers in various climate regions.
A.5 Future work The resulting efforts presented in this Appendix and the preceding Chapter V
have led to numerous discussions involving extensive experimental campaigns of current
studies and new directions to pursue. First, all of the experiments of interest should be
repeated on a large scale in a controlled environment such as the botanical gardens at the
University of Michigan. The data collection of at least 14-day growth trials would
include germination results, shoot length, taproot length, noted comments, as well as dry
root mass measurements. From significant data collected on increased quantities of
treated soybeans, a better understanding of the plasma effects may be learned. Following
the controlled environment studies, plants would need to be evaluated on the outdoor,
acre size scale otherwise known as test plots should be selected randomly and at least a
ten-plant sample for every 10 acres to determine an average stage of development.131 The

164
test plot studies would show how the seeds would respond in an uncontrolled
environment and determine the viability of the treatments for real-world implementation.
During the large-scale growth trials, experiments within the laboratory setting
should be performed simultaneously that involve characterizing the plasma as well as
species produced in the reaction chamber. More involved work with optical emission
spectroscopy, laser induced fluorescence, Fourier Transform InfraRed (FTIR) analysis,
and mass spectroscopy gas chromatography would characterize the entirety of the
treatments. This data could then be used and correlated with that in the published
literature of the nutritional needs of the treated plant and further optimize the treatment.
Another laboratory scale test that would be of interest is the repeating of a cold
environment for germination characteristics. The results mentioned in the anecdotal
section of this chapter were quite unexpected and exploration of the reasons behind this
would be of interest to the agricultural community.

165
BIBLIOGRAPHY
1 D.B. Graves. “Low temperature plasma biomedicine: A tutorial review,” Phys.
Plasmas 21, 080901 (2014). 2 F.F. Chen. Introduction to Plasma Physics and Controlled Fusion. 1984. 3 M. A. Lieberman and A. J. Lichtenberg. Principles of plasma Discharges and
Materials Processing. 2nd edn. Wiley & Sons, Inc. 2005. 4 R. Brandenburg. “Topical Review – dielectric barrier discharges: progress on
plasma sources and on the understanding of regimes and single filaments,” Plasma Sources Sci. Technol. 26, (2017) 053001.
5 U. Ebert and D. D. Sentman. “Streamers, Sprites, Leaders, Lightning: from micro- to macro-scales,” J. Phys. D: Appl. Phys. 41, (2008).
6 X. Tu, H.J. Gallon, and J.C. Whitehead. “Transition behavior of packed-bed dielectric barrier discharge in argon,” IEEE Trans. On Plasma Sci. 39, 2172-2173(2011).
7 X. Tu, B. Verheyde, S. Corthals, S. Paulussen, and B.F. Sels. “Effect of packing solid material on characteristics of helium dielectric barrier discharge at atmospheric pressure,” Phys. Plasmas 18, 080702 (2011).
8 W. Siemens. Poggendorff’s Ann. Phys. Chem. 102, 66 (1857). 9 U. Kogelschatz. “Dielectric-barrier discharges: their history, discharge physics,
and industrial applications,” Plasma Chem. Plasma Proc. 23, 1-46 (2003). 10 M.A. Lieberman and A.J. Lichtenberg. Principles of plasma discharges and
materials processing. 2nd edn. Wiley. (2005). 11 R. Brandenburg. “Dielectric barrier discharges: progress on plasma sources and
on the understanding of regimes and single filaments,” Plasma Sources Sci. Technol. 26, 053001 (2017).
12 S. Liu and M. Neiger. J. Phys. D 34, 1632 (2001). 13 J. Kruszelnicki, K.W. Engeling, J.E. Foster, and M.J. Kushner. “Propagation of
negative electrical discharges through 2-dimensional packed bed reactors,” J. Phys. D: Appl. Phys. 50, 2016.
14 T.C. Manley. “The electric characteristics of the ozonator discharge,” Trans. Electrochem. Soc. 84, 83-96 (1943).
15 A.V. Pipa and R. Brandenburg. “The equivalent circuit approach for the electrical diagnostics of dielectric barrier discharges: the classical theory and recent developments,” Atoms. (2019).
16 X.-M. Zhu and Y.-K. Pu. “Optical emission spectroscopy in low-temperature plasmas containing argon and nitrogen: determination of the electron temperature and density by the line-ratio method,” J. Phys. D: Appl. Phys. 43, 403001 (2010).
17 M.A. Lieberman and A.J. Lichtenberg. Principles of plasma discharges and materials processing. 2nd edn. Wiley & Sons. (2005).

166
18 H.L. Chen, H.M. Lee, S.H. Chen, and M.B. Chang. “Review of Packed-bed
plasma reactor for ozone generation and air pollution control,” Ind. Eng. Chem. Res. 47, 2122-2130 (2008).
19 L.B. Loeb and J.M. Meek. “The mechanism of spark discharge in air at atmospheric pressure,” J. of Appl. Physic. 11, 438 (1940).
20 C. Montijn and U. Ebert. “Diffusion correction to the Raether-Meek criterion for the avalanche-to-streamer transition,” J. Phys. D: Appl. Phys. 39, 2979-2992, (2006).
21 I. Michielsen, Y. Uytdenhouwen, A. Bogaerts, and V. Meynen. “Altering conversion and product selectivity of dry reforming of methane in a dielectric barrier discharge by changing the dielectric packing material,” Catalysts. 9, (2019).
22 X. Tu, B. Verheyde, S. Corthals, S. Paulussen, and B.F. Sels. “Effect of packing solid material on characteristics of helium dielectric barrier discharge at atmospheric pressure,” Phys. Plasmas. 18, 080702 (2011).
23 T. Butterworth, R. H. Elder, and R. W. K. Allen. “Effects of particle size on CO2 reduction and discharge characteristics in a packed bed plasma reactor,”Chem. Engin. J. 293 (2016) 55-67.
24 H.P. Nguyen, M.J. Park, S.B. Kim, H.J. Kim, L.J. Baik, and Y.M. Jo. “Effective dielectric barrier discharge reactor operation of decomposition of volatile organic compounds,” J. of Cleaner Production 198, 1232-1238 (2018).
25 Z. Ye et al. “An in-depth investigation of toluene decomposition with a glass beads packed bed dielectric barrier discharge reactor,” Ind. Eng. Chem. Res. 56, 10215-10226 (2017).
26 A.M. Vandenbroucke, R. Morent, N. De Geyter, and C. Leys. “Review: Non- thermal plasmas for non-catalytic and catalytic VOC abatement,” J. Haz. Mat. 195, 30-54 (2011).
27 T. Butterworth and R.W.K. Allen. “Plasma-catalyst interaction studied in a single pellet DBD reactor: dielectric constant effect on plasma dynamics,” Plasma Sources Sci. Technol. 26, 065008 (2017).
28 S. Pancheshnyi, B. Eismann, G.J.M. Hagelaar, L.C. Pitchford, Computer code ZDPlasKin, http://www.zdplaskin.laplace.univ-tlse.fr (University of Toulouse, LAPLACE, CNRS-UPS-INP, Toulouse, France, 2008).
29 E. Choiniere and B.E. Gilchrist. “Self-consistent 2-D kinetic simulations of high- voltage plasma sheaths surrounding ion-attracting conductive cylinders in flowing plasmas,” IEEE Trans. On Plasma Sci. 35, 2007.
30 http://www.comsol.com. 31 K. Van Laer and A. Bogaerts. “Fluid modeling of a packed bed dielectric barrier
discharge plasma reactor,” Plasma Scources Sci. Technol. 25, 015002 (2016). 32 W. Wang, H-H. Kim, K. Van Laer, and A. Bogaerts. “Streamer propagation in a
packed bed plasma reactor for plasma catalysis applications,” Chem. Eng. J.. 334 (2018) 2467-2479.
33 I. Michielsen, Y. Uytdenhouwen, J. Pype, B. Michielsen, J. Mertens, F. Reniers,

167
V. Meynen, and A. Bogaerts. “CO2 dissociation in a packed bed DBD reactor: First steps towards a better understanding of plasma catalysis,” Chem. Eng. J. 326, 477-488 (2017).
34 W.C. Chung, I.Y. Tsao, and M.B. Chang. “Novel plasma photocatalysis process for syngas generation via dry reforming of methane,” Energy Conversion and Management, 164 417-428 (2018).
35 M. Okubo, H. Yamada, K. Yoshida, and T. Kuroki. “Simultaneous reduction of diesel particulate and NOx using catalysis combined nonthermal plasma reactor,” Proc. 2016 Electrostactics Joint Conference.
36 Y. Cheng, W. Song, J. Liu, H. Zheng, Z. Zhao, C. Xu, Y. Wei, and E. J. M. Hensen. “Simultaneous NOx and particulate matter removal from diesel exhaust by hierarchical Fe-doped Ce-Zr oxide,” ACS Catal. 2017. 7, 3883-3892.
37 J. Hoard, R. L. Bretz, and Y Ehara. “Diesel exhaust simulator: design and application to plasma discharge testing,” SAE Technical Paper Series. 2003 SAE World Congress, Detroit, Michigan March 3-6, 2003.
38 Ch. Subrahmanyam, M. Magureanu, A. Renken, and L. Kiwi-Minsker. “Catalytic abatement of volatile organic compounds assisted by non-thermal plasma: Part 1. A novel dielectric barrier discharge reactor containing catalytic electrode,” Applied Catalysis B: Environmental. 65, 150-156 (2006).
39 H.H. Kim and A. Ogata. “Nonthermal plasma activates catalyst: from current understanding and future prospects,” Eur. Phys. J. Appl. Phys. 55, 12806 (2011).
40 E.I. Karpenko, V.E. Messerle, A.B. Ustimenko. “Plasma-aided solid fuel combustion,” Proceedings of Combustion Institute 31, 2252-2260 (2007).
41 D.A. Lacose, D.A. Xu, J.P. Moeck, and C.O. Laux. “Dynamic response of a weakly turbulent lean-premixed flame to nanosecond repetitively pulsed discharge,” Proceedings of the Combusion Institute 34, 3259-3266 (2013).
42 M. T. Lanagan. J. K. Yamamoto, A. Bhalla and S. G.Sankar, "The dielectric properties of yttria-stabilized zirconia," Matls. Lett. 7, 437 (1989).
43 B. W. Hakki and P. D. Coleman, “A dielectric resonator method of measuring inductive capacities in the millimeter range”, IRE Trans. Microwave Theory Techn., 8, 402 (1960).
44 A Bogearts et al., “CO2 conversion by plasma technology: insights from modeling the plasma chemistry and plasma reactor design”, Plasma Sources Sci. Technol. 26, 063001 (2017).
45 T. Butterworth, R. Elder and R. Allen, “Effects of particle size on CO2 reduction and discharge characteristics in a packed bed plasma reactor”, Chem. Engr. J. 293, 55 (2016).
46 N. Y. Babaeva, A. N. Bhoj and M. J. Kushner, “Streamer dynamics in gases containing dust particles, Plasma Source Sci. Technol. 15, 591 (2006).
47 S. A. Norberg, E. Johnsen and M. J. Kushner, Plasma Sources Sci. Technol. 24, 035026 (2015).
48 R. Dorai and M. J. Kushner, J. Phys. D. Appl. Phys. 36, 666 (2003). 49 J. Kruszelnicki, K.W. Engeling, J. E. Foster, Z. Xiong, and M. J. Kushner.
“Propagation of negative electrical discharges through 2-dimensional packed bed reactors”, J. Phys. D. Appl. Phys. 50, 025203 (2016).

168
50 T. Butterworth, R. Elder and R. Allen, “Effects of particle size on CO2 reduction
and discharge characteristics in a packed bed plasma reactor”, Chem. Engr. J. 293, 55 (2016).
51 S. Tsukamoto, T. Namihira, H. Hori, K. Shinozaki, S. Katsuki, R. Hackam, et al. “An analysis of pulsed streamer discharge using a high-speed camera”, Proceedings of Pulsed Power Plasma Science, Las Vegas, USA, (2001).
52 E. C. Neyts, K. Ostrikov, M. K. Sunkara, and A. Bogaerts. “Plasma Catalysis: Synergistic effects at the nanoscale,” Chemical reviews 115 24, 13408-13446 (2015).
53 D. Mei, X. Zhu, C. Wu, B. Ashford, P. T. Williams, and X. Tu. “Plasma- photocatalytic conversion of CO2 at low temperatures: Understanding the synergistic effect of plasma-catalysis,” Applied Catalysis B: Environmental 182, 525-532 (2016).
54 J.C. Whitehead. “Plasma catalysis: A solution for environmental problems,” Pure and Applied Chemistry. 82 (2010).
55 J.C. Whitehead. “Plasma-catalysis: the known knowns, the known unknowns and the unknown unknowns,” J. Phys. D: Applied Physics 49, 243001-243024 (2016).
56 Laux, C.O., “Radiation and Nonequilibrium Collisional-Radiative Models,” von Karman Institute Lecture Series 2002-07, Physico-Chemical Modeling of High Enthalpy and Plasma Flows, eds. D. Fletcher, J.-M. Charbonnier, G.S.R. Sarma, and T. Magin, Rhode-Saint-Genèse, Belgium, 2002.
57 M. S. Simeni, B.M. Goldberg, C. Zhang, K. Frederickson, W.R. Lempert, and I.V. Adamovich. “Electric field measurements in a nanosecond pulse discharge in atmospheric air,” J. Phys. D: Appl. Phys. 50 (2017).
58 N.M. Jordan, Y.Y. Lau, D. French, R. Gilgenbach, and P. Pengvanich. “Electric field and electron orbits near a triple point,” J. Appl. Phys. 102, 033301 (2007).
59 Michielsen, Y. Uytdenhouwen, J. Pype, B. Michielsen, J. Mertens, F. Reniers, V. Meynen, and A. Bogaerts. “CO2 dissociation in a packed bed DBD reactor: First steps towards a better understanding of plasma catalysis,” Chemical Engineering Journal 326, 477-488, (2017).
60 M. Kraus, B. Eliasson, U. Kogelschatz, and A. Wokaun. “CO2 reforming of methane by the combination of dielectric-barrier discharges and catalysis,” Phys. Chem. Chem. Phys., 3, 294-300. (2001).
61 M. Abdul Mujeebu, M.Z. Abdullah, M.Z. Abu Bakar, A.A. Mohamad, and M.K. Abdullah.“Applications of porous media combustion technology – A review,”. Applied energy 86, 1365-1375 (2009).
62 Z. Machala, M. Janda, K. Hensel, I. Jedlovsky, L. Lestinska, V. Foltin, V. Martisovits, and M. Morvova. “Emission spectroscopy of atmospheric pressure plasma for bio-medical and environmental applications,” Journal of Molecular Spectroscopy 243, 194-201, (2007).
63 J.E. Foster, S. Mujovic, J. Groele, I. M. Blankson. “Towards high throughput plasma based water purifiers: design considerations and the pathways towards practical application,” J. of Phys. D.: Appl. Phys. 51, 29 (2018).
64 H.H. Kim and A. Ogata. “Nonthermal plasma activates catalyst: from current understanding and future prospects,” Eur. Phys. J. Appl. Phys. 55, 13806 (2011).

169
65 R. M. Wheeler. “Agriculture for Space: People and places paving the way,” Open
Agriculture. 2, 14-32 (2017). 66 L. Ling, J. Jiafeng, L. Jiangang, S. Minchong, H. Xin, S. Hanliang, and Dong
Yuanhua. ‘Effects of cold plasma treatment on seed germination and seedling growth of soybean,’ Scientific reports 4, 5859 (2014).
67 L. Sivachandiran and A. Khacef. ‘Enhanced seed germination and plant growth by atmospheric pressure cold air plasma: combined effect of seed and water treatment,’ RSC Adv., 7, 1822-1832 (2017).
68 P. Puligundla, Je-Wook Kim, and C. Mok, “Effect of corona discharge plasma jet treatment on decontamination and sprouting of rapeseed (Brassica napus L.) Seeds,” Food Control 71, 376-382, (2017).
69 I. Filatova, V. Azharonok, E. Gorodetskaya, L. Mel’nikova, O. Shedikova, and A. Shik. “Plasma-radiowave stimulation of plant seeds germination and inactivation of pathogenic microorganisms.” (Jan. 2009).
70 K. Matra. “Non-thermal plasma for germination enhancement of radish seeds,” 2016 International Electrical Engineering Congress, iEECON2016, 2-4 March 2016, Chiang Mai Thailand. Procedia Computer Science 86, 132-135 (2016).
71 J. Jiang and J. Li. “Effect of cold plasma treatment on seed germination and growth of wheat,” Plasma Science and Technology, 16, (2013).
72 L.D. Nooden, K. A. Blakley, and J. M. Grzybowski. “Control of Seed Coat thickness and permeability in soybeans,” Plant. Physiol. 79, 543-545 (1985).
73 J.J. Zhang, J.O. Jo, D.L. Huynh, R.K. Mongre, M. Ghosh, A.K. Singh, S.B. Lee, Y.S. Mok, P. Hyuk, and D.K. Jeong. “Growth-inducing effects of argon plasma on soybean sprouts via the regulation of demethylation levels of energy metabolism-related genes,” Sci. Rep. 7, 41917 (2017).
74 P. Held. “An introduction to reactive oxygen species measurement of ROS in Cells,” Biotech Instruments, 1-14. (2012).
75 H. El-Maarouf-Bouteau and C. Bailly. “Oxidative signaling in seed germination and dormancy,” Plant Signaling & Behavior 3, 175-182. (March 2008).
76 A.J. de Jong, E. T. Yakimova, V. M. Kapchina, and E. J. Woltering. “A critical role for ethylene in hydrogen peroxide release during programmed cell death in tomato suspension cells.” Planta 126, 156-166 (2002).
77 T. Jabs, R. A. Dietrich, and J. L. Dangl. “Initiation of runaway cell death in an Arabidopsis mutant by extracellular superoxide,” Science. 27, 1853-1856 (1996).
78 J. H. Joo, Y.S. Bae, and J. S. Lee. “Role of auxin-induced reactive oxygen species in root gravitropism,” Plant Physiol. 126, 1055-1060 (2001).
79 K. Cui, G. Xing, X. Liu, G. Xing, and Y. Wang. “Effect of hydrogen peroxide on somatic embryogenesis of Lycium barbarum L.,” Plant Sci. 146, 9-16 (1999).
80 J. P. Wisniewski, P. Cornille, J. P. Agnel, and J. L. Montillet. “The extension multigene family responds differentially to superoxide or hydrogen in tomato cell cultures,” FEBS Lett. 447, 264-268 (1999).
81 L.K. Randeniya and G. J. J. B. de Groot. “Non-thermal plasma treatment of agricultural seeds for stimulation of germination, removal of surface contamination and other benefits: A review,”. Plasma Process. Polym. 12, 608-623 (2015).

170
82 Kelly-Wintenberg, K. Hodge, A. Montie, T. C., Deleanu, L., Sherman, D., Roth,
J. R., et al. “Use of a one atmosphere uniform glow discharge plasma to kill a broad spectrum of microorganisms,” Journal of Vacuum Science & Technology A, 17, 1539-1544 (1999).
83 Lee, K., Paek, K. H., Ju, W. T., and Lee, Y. “Sterilization of bacteria, yeast, and bacterial endospores by atmospheric-pressure cold plasma using helium and oxygen,” Journal of Microbiology, 44, 269-275 (2006).
84 Shintani, H., Sakudo, A., Burke, P., and McDonnell, G. “Gas plasma sterilization of microorganisms and mechanisms of action. Experimental and therapeutic medicine,” 1, 731-738 (2010).
85 K. W. Engeling, J. Kruszelnicki, M. J. Kushner, and John E. Foster. “Time- resolved evolution of micro-discharges, surface ionization waves and plasma propagation in a two dimensional packed bed reactor,” Plasma Sources Sci. and Techn. Vol 27. (2018).
86 Electrotechnologies for extraction from food plants and biomaterials. Editors: E. Vorobiev & N. Lebovka. Food Engineering Series, (2008).
87 P. Bruggeman and C. Leys. “Topical Review: Non thermal plasmas in and in contact with liquids,” J. of Phys. D.: Appl. Phys. 42, (2009).
88 J. Foster, B. Weatherford, E. Gillman, and B. Yee. “Underwater operation of a DBD plasma jet,” Plasma Sources Sci. Technol. 19, 025001 (2010).
89 Y. Yuan and T. Randall Lee. “Chapter 1: Contact Angle and Wetting Properties,” G. Bracco, B. Holst (eds.), Surface Science Techniques, Springer Series in Surface Sciences 51, (2013).
90 Stuart O. Nelson. “Dielectric Properties of Agricultural Materials and their Applications,” Elsevier Inc. (2015). ISBN: 978-0-12-802305-1.
91 J. Kruszelnicki, K. W. Engeling, John E. Foster, Z. Xiong, and M. J. Kushner. “Propagation of negative electrical discharges through 2-dimensional packed bed reactors,” J. of Phys. D.:Appl. Phys. 50, 025203 (2017).
92 A. Vesel, I. Junkar, U. Cvelbar, J. Kovac, and M. Mozetic. “Surface modification of polyster by oxygen- and nitrogen-plasma treatment,” Sur. Interface Anal. 40. 1444-1453 (2008).
93 M. Gilliam, S. Farhat, A. Zand, B. Stubbs, M. Magyar, and G. Garner. “Atmospheric Plasma Surface Modification of PMMA and PP Micro-Particles,” Plasma Process. Polym. 11, 1037-1043 (2014).
94 W. Van Gaens and A. Bogaerts. “Kinetic modeling for an atmospheric pressure argon plasma jet in humid air,” J. of Phys. D.: Appl. Phys. 46. 275201 (2013).
95 T. Winter et al. “Common versus noble Bacillus subtilis differentially responds to air and argon gas plasma,” Proteomics. 13, 2608-2621 (2013).
96 C. V. Piper and W. J. Morse. “The Soybean,” McGraw-Hill Book Company, Inc. 97 “The history of the soybean,” Illinois Soybean Association Checkoff Program.
Bloomington Illinois. 98 W. Shurtleff and A. Aoyagi. “History of A.E. Staley Manufacturing Co.: Work
with Soy (1867-2018),” Soyinfo Center. Lafeyette, CA. (2018) 99 R.M. Wik. “Henry Ford and Grassroots America,” The University of Michigan
Press. 151-152 (1972).
171
100 W. Shurtleff and A. Aoyagi. “History of World Soybean Production and Trade.”
A chapter from History of soybeans and Soyfoods. Soyinfo Center, Lafeyette, CA. (2004).
101 L. C. Purcell, M. Salmeron, and L. Ashlock. “Soybean Growth and Development,” Arkansas Soybean Production Handbook. (2014).
102 N.S. Lersten and J.B. Carlson. “Soybeans: Improvement, production and uses,” Vegitative morphology. ASA, CSSA, and SSSA, Madison WI. 15-57 (2004).
103 F. Ma, E. Cholewa, T. Mohamed, C.A. Peterson, and M. Gijzen. “Cracks in the palisade cuticle of soybean seed coats correlate with their permeability to water,” Ann. Bot., 94, 213-228 (2004).
104 D. Qutob, F. Ma, C.A. Peterson, M.A. Bernards, and M. Gijzen. “Structural and permeability properties of the soybean seed coat,” Botany. 86, 219-227 (2007).
105 S. Shao, C.J. Meyer, F. Ma, C.A. Peterson, and M.A. Bernards. “The outermost cuticle of soybean seeds: chemical composition and function during imbibition,” J. Exp. Bot. 58, 1071-1082 (2007).
106 M. Koizumi, K. Kikiuchi, S. Isobe, N. Ishida, S. Naito, and H. Kano. “Role of seed coat in imbibing soybean seeds observed by micro-magnetic resonance imaging,” Ann. Bot. 102, 342-352 (2008).
107 S. Zhou, H. Sekizaky, Z. Yang, S. Sawa, and J. Pan. “Phenolics in the seed coat of wild soybean (Glycine soja) and their significance for seed hardness and seed germination,” J. Agric. Food Chem. 58, 10972-10978 (2010).
108 S.S. Zamin, and M.A. Ajmal Kahn. “The role of seed coat phenolics on water uptake and early protein synthesis during germination of dimorphic seeds of Halopyrum mucronatum (L.) staph,” J. Bot., 42, 227-238 (2010).
109 D.T. Vu, V. Velusamy, and E. Park. “Structure and chemical composition of wild soybean seed coat related to its permeability,” Pak. J. Bot., 46, 1847-157 (2014).
110 D. Wright and A.W. Lenssen. “Staging Soybean Development,” Agriculture and Environment Extension Publications, 191 (2013).
111 J. Glinski and J. Lipiec. “Soil physical conditions and plant roots,” CRC Press, Boca Raton, FL (1990).
112 E. Vorobiev and N. Lebovka, (eds.). “Electrotechnologies for extraction from food plants and biomaterials,” Food engineering series book. Springer Science and Business Media LLC. (2008).
113 E. Vorobiev and N. Lebovka eds. “Electrotechnologies for extraction from food plants and biomaterials,” Food Engineering Series. Springer (2008).
114 W.S. Meaking, J. Edgerton, C.W. Wharton, and R.A. Meldrum. “Electroporation- induced damage in mammalian cell DNA,” Biochimica et Biophysica Acta 1264, 357-362 (1995).
115 D. Jordan. Ultrawideband Electrochemotherapy. Dissertation. University of Michigan. 2005.
116 I. Semenov, S. Xiao, and A.G. Pakhomov. “Electroporation by subnanosecond pulses,” Biochem. Biophys. Rep. 253-259 (2016).
117 E. Nuemann, A.E. Sowers, and C.A. Jordan. Electroporation and electrofusion in cell biology. Plenium press, New York (1989).
118 P. Marszalek, D.S. Liu, and T.Y. Tsong. “Schwan equation and transmembrane

172
potential induced by altering electric field,” Biophysical Journal 58, 1053-1058 (1990).
119 T. Kotnik, F. Bobanovic, and D. Miklavcic. “Sensitivity of transmembrane voltage induced by applied electric fields – a theoretical analysis,” Bioelectrochemistry Bioenergetics 43, 285-291 (1997).
120 M. Danfelter, P. Engstrom, B.R.R. Persson, and L.G. Salford. “Effect of high voltage pulses on survival of Chinese Hamster V79 lung fibroblast cells,” Bioelectrochemistry and Bioenergetics 47, 97-101 (1998).
121 J.J. Zhang, J.O. Jo, D.L. Huynh, R.K. Mongre, M. Ghosh, A.K. Singh, S.B. Lee, Y.S. Mok, P. Hyuk, and D.K. Jeong. “Growth-inducing effects of argon plasma on soybean sprouts via the regulation of demethylation levels of energy metabolism-related genes,” Nature: Scientific Reports. 7:41917 (2017).
122 H. El-Maarouf-Bouteau and C. Bailly. “Oxidative signaling in seed germination and dormancy,” Plant Signaling & Behavior. 3 175-182 (2008).
123 K. Apel and H. Hirt. “Reactive oxygen species: Metabolism, oxidative stress, and signal transduction,” Annul. Rev. Plant Biol. 55, 373-399 (2004).
124 C.H. Foyer and G. Noctor. “ Redox homeostasis and antioxidant signaling: A metabolic interface between stress perception and physiological responses,” Plant Cell. 17, 1866-1875 (2005).
125 Y. Wang, G.J. Loake, and C. Chu. “Cross-talk of nitric oxide and reactive oxygen species in plant programmed cell death,” Front. Plant Sci. (2013).
126 https://www.aganytime.com/asgrow/mgt/growing-season/Pages/Stages.aspx 127 N. Khamsen, D. Onwimol, N. Teerakawanich, S. Dechanupaprittha, W.
Kanakbannakorn, K. Hongesombut, and S. Srisonphan. “Rice (Oryza Sativa L.) seed sterilization and germination enhancement via atmospheric hybrid nonthermal discharge plasma,” ACS Appl Mater. Interfaces. 8, 19268-19275 (2016).
128 R. Zhou, J. Li, R. Zhou, X. Zhang, and S. Yang. “Atmospheric-pressure plasma treated water for seed germination and seedling growth of mung bean and its sterilization effect on munb bean sprouts,” Innov. Food Sci. and Emerg. Techn. (2018).
129 M. Staton. “Managing soil pH for optimal soybean production,” Michigan State University Extensions. OutreachWeb Article. Accessed 03.31.2019.
130 R.L. Musser, S.A. Thomas, and P.J. Kramer. “Short and long term effects of root and shoot chilling of ransom soybean,” Plant Physiol. 73, 778-783 (1983).
131 W.R. Fehr and C.E. Caviness. “Stages of Soybean Development,” Special Report. 87 (1997).
Copyright © 2022 FDOKUMEN