Low-Reynolds Number Flow Control Using Dielectric Barrier Discharge Actuators
17
______________________________________________________________________________ * Research Fellow ** Research Scientist *** Clarence L. "Kelly" Johnson Collegiate Professor and Chair Low-Reynolds Number Flow Control Using Dielectric Barrier Discharge Actuators Balaji Jayaraman * , Yongsheng Lian ** and Wei Shyy *** University of Michigan, Ann Arbor, MI 48109 Dielectric Barrier Discharges (DBD), operated at KHz and KV range, can create athermal plasma via collision processes and induce near wall jet. In this paper, we investigate the potential of using DBD to conduct flow control at low Reynolds numbers, motivated by micro air vehicle (MAV) applications. A previously developed computational methodology, based on the e N transition model and the k- turbulence closure is adopted. The effects of actuators on the flow fields are represented with a body force model in the momentum equations. The flow control over an airfoil SD7003 at the chord Reynolds number of 6×10 4 is the focus of the present study. Specifically, we investigate both co-flow and counter-flow actuation strategies. The co-flow approach offers momentum enhancement via favorable pressure gradient in the near wall region while the counter flow approach can trigger earlier separation and transition by introducing adverse pressure gradients. The aerodynamic performance including lift and drag coefficients over a broad range of angle of attack (4 0 -18 0 ) is studied, showing that improved lift and drag characteristics can be realized with DBD concepts for low Reynolds number aerodynamics. I. Introduction Low Reynolds number aerodynamics motivated by applications such as micro air vehicles (MAVs) has attracted much interest in recent years. MAVs have a dimension of 15 cm or less and fly at the speed of 5-15 m/s and fly at an attitude around 100 m. Due to their small dimension and low flight speed, MAVs operate under low Reynolds number region (Re ≤10 5 )[1,2]. It is well known that the airfoil performance is deteriorated when the Reynolds number drops from 10 6 to under 10 5 [3]. A main reason is that at such low Reynolds numbers, flows are prone to separate under adverse pressure gradients. Separated flow increases the drag and decreases the lift and therefore increases the power requirement [1]. In addition, if an airfoil stalls at modest angles of attack due to separation, it seriously compromises the vehicle maneuverability and agility. Under modest angle-of-attack (AoA), the separated flow experiences laminar to turbulent transition and reattaches to surface and form a laminar separation bubble. However, the formation and burst of the bubble leads to sudden change of lift and drag and a zig- zag pattern in the lift to drag polar, making it difficult to control the vehicle. Figure 1 illustrates the formation and burst of laminar separation bubble at a fixed Reynolds number of 60,100 for airfoil Eppler E374: (i) At lower AoA, for example, 3 o , there is a long bubble on the airfoil surface, which leads to a large drag. (ii) Increasing the AoA (from 4 o to 8 o ), the adverse pressure gradient on the upper surface grows, which intensifies the Tollmien-Schlichting wave, resulting in an expedited laminar-turbulent transition process. A shorter LSB leads to more airfoil surface covered by the attached turbulent boundary layer flow, resulting in a lower drag. This corresponds to the lift-drag polar‟s left turn. Further increasing the AoA (beyond 8 o ), the separated flow quickly experiences transition; however, with a massive separation, the turbulent diffusion can no longer make the flow reattached, resulting in the drag increasing substantially with little changes in lift. In order to improve the aerodynamics of MAVs, various techniques have been explored. For example, Ifju et al. [4] have used flexible membrane wing in the MAVs to enhance the stall angle of attack and adapt to the gusty environment. Lian et al. [5] have used piezo-actuated actuator to prompt the flow reattachment. Recent research [6-8] on the efficient generation of ionized fluid in a glow discharge at atmospheric pressure using a dielectric barrier discharge (DBD) technique has attracted interest from the thermo-fluid dynamics and control communities. The largely athermal surface plasma generation investigated in the above studies can be used for achieving flow control by modifying the flow structure through electro-hydrodynamic (EHD) effects [7]. A typical flow control application is illustrated in Fig. 2 where an insulator separates the electrodes powered by a radio frequency (1-50 KHz) alternating voltage (1-20 KV) for actuation at atmospheric pressure. The collisional plasma under such pressures can result in a significant momentum exchange with the neutral species. The effect of the plasma generated EHD flow on a surface manifests as a wall jet-type flow. This can be used to inject momentum in regions of adverse pressure gradients, boundary layers, and high heat flux. Compared to mechanical devices such as synthetic jets [9], the glow discharge actuator involves no moving parts, and can offer control capabilities in complementary fashion. In fact, Goeksel et al. [10] have experimentally investigated the potential for flow control 37th AIAA Fluid Dynamics Conference and Exhibit 25 - 28 June 2007, Miami, FL AIAA 2007-3974 Copyright © 2007 by Balaji Jayaraman. Published by the American Institute of Aeronautics and Astronautics, Inc., with permission.
-
Upload
independent -
Category
Documents
-
view
1 -
download
0
Transcript of Low-Reynolds Number Flow Control Using Dielectric Barrier Discharge Actuators
______________________________________________________________________________ * Research Fellow
** Research Scientist
*** Clarence L. "Kelly" Johnson Collegiate Professor and Chair
Low-Reynolds Number Flow Control Using Dielectric Barrier Discharge Actuators
Balaji Jayaraman*, Yongsheng Lian
** and Wei Shyy
***
University of Michigan, Ann Arbor, MI 48109
Dielectric Barrier Discharges (DBD), operated at KHz and KV range, can create athermal plasma via
collision processes and induce near wall jet. In this paper, we investigate the potential of using DBD to conduct flow
control at low Reynolds numbers, motivated by micro air vehicle (MAV) applications. A previously developed
computational methodology, based on the eN transition model and the k- turbulence closure is adopted. The effects
of actuators on the flow fields are represented with a body force model in the momentum equations. The flow
control over an airfoil SD7003 at the chord Reynolds number of 6×10⁴ is the focus of the present study. Specifically,
we investigate both co-flow and counter-flow actuation strategies. The co-flow approach offers momentum
enhancement via favorable pressure gradient in the near wall region while the counter flow approach can trigger
earlier separation and transition by introducing adverse pressure gradients. The aerodynamic performance including
lift and drag coefficients over a broad range of angle of attack (40-18
0) is studied, showing that improved lift and
drag characteristics can be realized with DBD concepts for low Reynolds number aerodynamics.
I. Introduction
Low Reynolds number aerodynamics motivated by applications such as micro air vehicles (MAVs) has
attracted much interest in recent years. MAVs have a dimension of 15 cm or less and fly at the speed of 5-15 m/s
and fly at an attitude around 100 m. Due to their small dimension and low flight speed, MAVs operate under low
Reynolds number region (Re≤105)[1,2]. It is well known that the airfoil performance is deteriorated when the
Reynolds number drops from 106 to under 10
5 [3]. A main reason is that at such low Reynolds numbers, flows are
prone to separate under adverse pressure gradients. Separated flow increases the drag and decreases the lift and
therefore increases the power requirement [1]. In addition, if an airfoil stalls at modest angles of attack due to
separation, it seriously compromises the vehicle maneuverability and agility. Under modest angle-of-attack (AoA),
the separated flow experiences laminar to turbulent transition and reattaches to surface and form a laminar
separation bubble. However, the formation and burst of the bubble leads to sudden change of lift and drag and a zig-
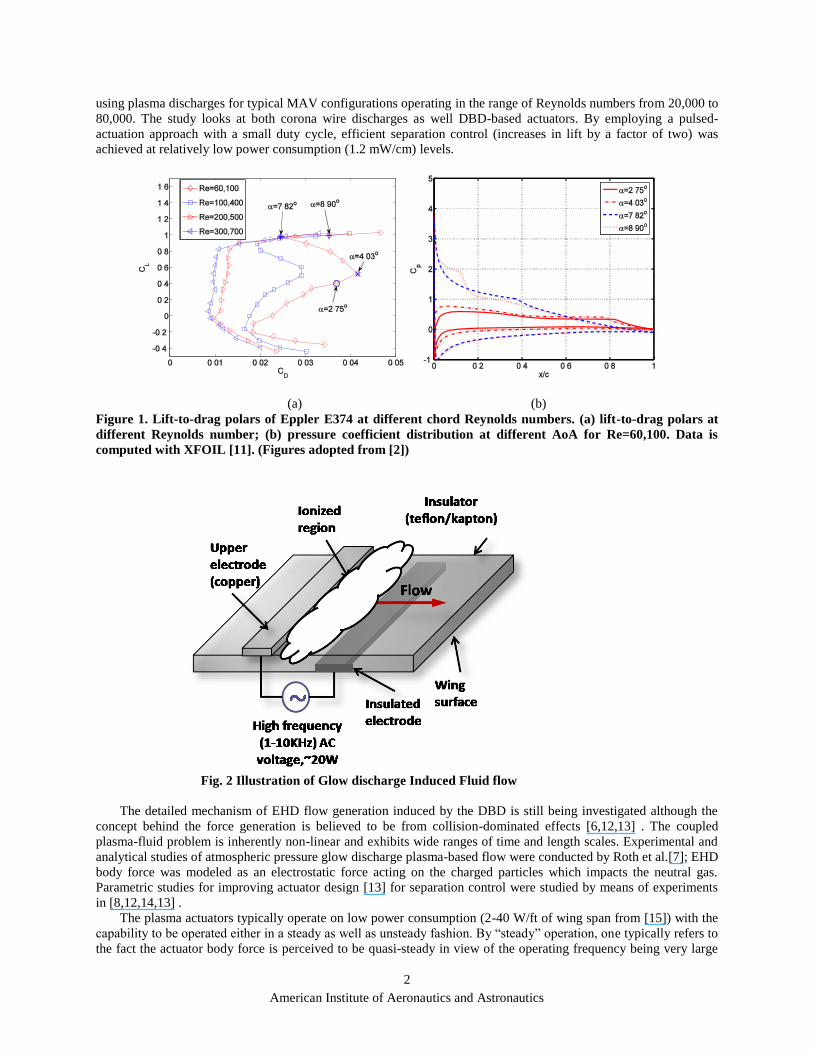
zag pattern in the lift to drag polar, making it difficult to control the vehicle. Figure 1 illustrates the formation and
burst of laminar separation bubble at a fixed Reynolds number of 60,100 for airfoil Eppler E374:
(i) At lower AoA, for example, 3o, there is a long bubble on the airfoil surface, which leads to a large drag.
(ii) Increasing the AoA (from 4o to 8
o), the adverse pressure gradient on the upper surface grows, which
intensifies the Tollmien-Schlichting wave, resulting in an expedited laminar-turbulent transition
process. A shorter LSB leads to more airfoil surface covered by the attached turbulent boundary layer
flow, resulting in a lower drag. This corresponds to the lift-drag polar‟s left turn.
Further increasing the AoA (beyond 8o), the separated flow quickly experiences transition; however, with a
massive separation, the turbulent diffusion can no longer make the flow reattached, resulting in the drag increasing
substantially with little changes in lift.
In order to improve the aerodynamics of MAVs, various techniques have been explored. For example, Ifju et al.
[4] have used flexible membrane wing in the MAVs to enhance the stall angle of attack and adapt to the gusty
environment. Lian et al. [5] have used piezo-actuated actuator to prompt the flow reattachment.
Recent research [6-8] on the efficient generation of ionized fluid in a glow discharge at atmospheric pressure
using a dielectric barrier discharge (DBD) technique has attracted interest from the thermo-fluid dynamics and
control communities. The largely athermal surface plasma generation investigated in the above studies can be used
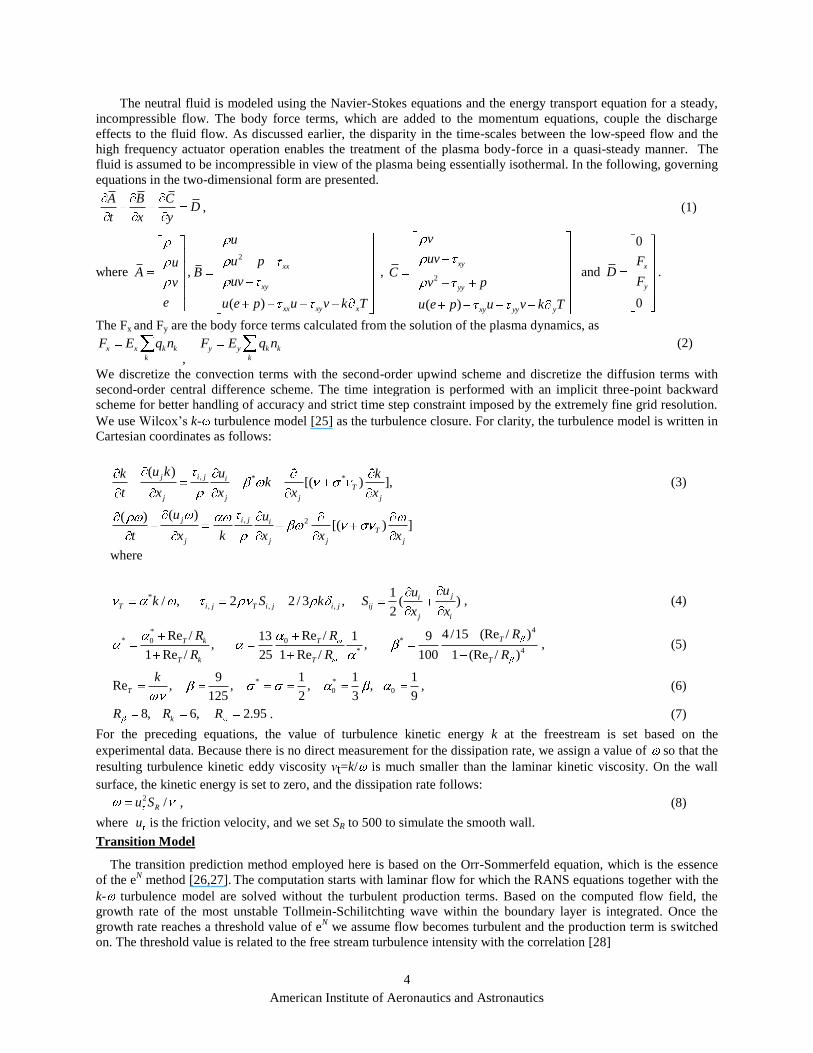
for achieving flow control by modifying the flow structure through electro-hydrodynamic (EHD) effects [7]. A
typical flow control application is illustrated in Fig. 2 where an insulator separates the electrodes powered by a radio
frequency (1-50 KHz) alternating voltage (1-20 KV) for actuation at atmospheric pressure. The collisional plasma
under such pressures can result in a significant momentum exchange with the neutral species. The effect of the
plasma generated EHD flow on a surface manifests as a wall jet-type flow. This can be used to inject momentum in
regions of adverse pressure gradients, boundary layers, and high heat flux. Compared to mechanical devices such as
synthetic jets [9], the glow discharge actuator involves no moving parts, and can offer control capabilities in
complementary fashion. In fact, Goeksel et al. [10] have experimentally investigated the potential for flow control
37th AIAA Fluid Dynamics Conference and Exhibit25 - 28 June 2007, Miami, FL
AIAA 2007-3974
Copyright © 2007 by Balaji Jayaraman. Published by the American Institute of Aeronautics and Astronautics, Inc., with permission.
American Institute of Aeronautics and Astronautics
2
using plasma discharges for typical MAV configurations operating in the range of Reynolds numbers from 20,000 to
80,000. The study looks at both corona wire discharges as well DBD-based actuators. By employing a pulsed-
actuation approach with a small duty cycle, efficient separation control (increases in lift by a factor of two) was
achieved at relatively low power consumption (1.2 mW/cm) levels.
(a) (b)
Figure 1. Lift-to-drag polars of Eppler E374 at different chord Reynolds numbers. (a) lift-to-drag polars at
different Reynolds number; (b) pressure coefficient distribution at different AoA for Re=60,100. Data is
computed with XFOIL [11]. (Figures adopted from [2])
Fig. 2 Illustration of Glow discharge Induced Fluid flow
The detailed mechanism of EHD flow generation induced by the DBD is still being investigated although the
concept behind the force generation is believed to be from collision-dominated effects [6,12,13] . The coupled
plasma-fluid problem is inherently non-linear and exhibits wide ranges of time and length scales. Experimental and
analytical studies of atmospheric pressure glow discharge plasma-based flow were conducted by Roth et al.[7]; EHD
body force was modeled as an electrostatic force acting on the charged particles which impacts the neutral gas.
Parametric studies for improving actuator design [13] for separation control were studied by means of experiments
in [8,12,14,13] .
The plasma actuators typically operate on low power consumption (2-40 W/ft of wing span from [15]) with the
capability to be operated either in a steady as well as unsteady fashion. By “steady” operation, one typically refers to
the fact the actuator body force is perceived to be quasi-steady in view of the operating frequency being very large

American Institute of Aeronautics and Astronautics
3
when compared to the low-speed flow applications of interest. Unsteady actuator effects are typically achieved by
multiplying the high frequency actuator (and hence a constant body force effect) by a low frequency modulating
mechanism or by switching on and off the actuator at smaller frequencies. A big gain from the unsteady plasma
actuation mechanism is that the resultant forcing can be effective even with a 10% duty cycle which lowers the
power requirement by about 90% [15].
Typical examples of plasma-based flow control has been to enhance lift and modifying aerodynamics of wings,
exciting 3-D boundary layer instabilities [15], separation control for low-pressure turbine blades and airfoil wings,
control of dynamic stall vortex on oscillating airfoils, acoustic control on subsonic cavity flows [35] etc. For
leading-edge separation control the thin actuator strip is molded onto the leading edge so that the nose-radius is
maintained in order to retain the smooth surface on the airfoil [15]. In [15], Corke et al. study the leading edge
separation control on a NACA 0015 airfoil and delay the stall angle by up to 7 degrees using both the unsteady and
steady effects of the actuator with the maximum performance achieved at a Strouhal number (calculated based on
the convection time-scale of the flow past the wing and the duty-cycle frequency) of one. Similar plasma-based
actuation was used for the control of dynamic stall on oscillating airfoils [15].Chan [16] applied plasma-based EHD
flow control in the study of acoustic effects in subsonic cavity flows. There have also been efforts to use plasma-
based actuators in the context of turbulent boundary layer flow control [17].
Unsteady actuation mechanisms also provide with interesting possibilities of exciting fluid flow instabilities and
have the potential to impact transition. Another interesting area would be to use counter-flow actuation by
employing the actuator effects to trip the flow in the boundary layer.
Numerical modeling of plasma-based flow control has attracted interest in recent times. Gaitonde et al [18,19]
employs a coupled numerical approach to study the steady and unsteady effects of the plasma forcing mechanism on
a NACA0015 wing. The study compares the unsteady flow field response to the time-varying force field obtained
from the first-principles based plasma dynamics model and the quasi-steady force field from our phenomenological
modeling approach [6,20]. Also, the impact of a low-frequency unsteady forcing is investigated by pulsing the
quasi-steady model with a pre-determined value of the duty cycle. It is reported that that formation of an unsteady
boundary-layer is observed even for the quasi-steady model. For the time-varying force field from the first-
principles based approach, the unsteady flow field is characterized by the development of an asymptotic periodic-
steady flow field in time.
In this paper, we investigate the potential of using DBD to conduct flow control for low Reynolds number flows
in the MAV regime. A previously developed computational methodology, based on the eN transition model and the
k- turbulence closure [21] is adopted. Similar to the studies of [6,20,18,19,22,23], the effects of actuators on the
flow fields are represented with a body force model in the momentum equations, based on the work of Shyy et al.
[6]. The flow control over an SD7003 airfoil at the chord Reynolds number of 6×10⁴ is the focus of our present
study. Specifically, we investigate both co-flow and counter-flow actuation strategies. Use of both the above
mentioned approaches is also reported in the works of Visbal et al. [22] and Rizzetta et al. [23]. The former explores
the potential use of these actuators in the transitional-turbulent regime for a NACA0015 airfoil and wall mounted
hump using both co-flow and counter-flow flow approaches. Also, the pulsed actuation in both the modes of
operation is investigated and is shown to be more effective at causing turbulence in separation regions at low
Reynolds numbers. The latter applies the linear plasma field model [6] to control separation in a transitional highly-
loaded low-pressure turbine. The co-flow approach offers momentum enhancement via favorable pressure gradient
in the near wall region while the counter flow approach can trigger earlier separation and transition by introducing
adverse pressure gradients. The rest of the paper is organized as follows. Section II presents the plasma fluid model
along with the numerical techniques employed to handle multi-scale discharge dynamics and the Navier-Stokes
equations for fluid flow. In section III, we present representative results to probe the interplay between DBD,
separation, and transition. The outcome in aerodynamics is discussed.
II. Numerical Methods
Reynolds-Averaged Navier-Stokes Solver
The controlled flow fields are simulated with high-fidelity Navier-Stokes equations coupled with a
phenomenological model representing the plasma induced body force incurred by the actuator. To accurately capture
the transitional flow behaviors, we coupled the Navier-Stokes equations with a transition model suitable for low
Reynolds number flows [21]. For incompressible flow, the equations are written in three-dimensional curvilinear
coordinates and are solved with a pressure-based algorithm, generalizing from the original Semi-Implicit Method for
Pressure-Linked Equations (SIMPLE) [24].
American Institute of Aeronautics and Astronautics
4
The neutral fluid is modeled using the Navier-Stokes equations and the energy transport equation for a steady,
incompressible flow. The body force terms, which are added to the momentum equations, couple the discharge
effects to the fluid flow. As discussed earlier, the disparity in the time-scales between the low-speed flow and the
high frequency actuator operation enables the treatment of the plasma body-force in a quasi-steady manner. The
fluid is assumed to be incompressible in view of the plasma being essentially isothermal. In the following, governing
equations in the two-dimensional form are presented.
, (1)
where
,
, and .
The Fx and Fy are the body force terms calculated from the solution of the plasma dynamics, as
,
(2)
We discretize the convection terms with the second-order upwind scheme and discretize the diffusion terms with
second-order central difference scheme. The time integration is performed with an implicit three-point backward
scheme for better handling of accuracy and strict time step constraint imposed by the extremely fine grid resolution.
We use Wilcox‟s k- turbulence model [25] as the turbulence closure. For clarity, the turbulence model is written in
Cartesian coordinates as follows:
(3)
where
, (4)
, (5)
, (6)
. (7)
For the preceding equations, the value of turbulence kinetic energy k at the freestream is set based on the
experimental data. Because there is no direct measurement for the dissipation rate, we assign a value of so that the
resulting turbulence kinetic eddy viscosity νt=k/ is much smaller than the laminar kinetic viscosity. On the wall
surface, the kinetic energy is set to zero, and the dissipation rate follows:
, (8)
where is the friction velocity, and we set SR to 500 to simulate the smooth wall.
Transition Model
The transition prediction method employed here is based on the Orr-Sommerfeld equation, which is the essence
of the eN method [26,27].
The computation starts with laminar flow for which the RANS equations together with the
k- turbulence model are solved without the turbulent production terms. Based on the computed flow field, the
growth rate of the most unstable Tollmein-Schilitchting wave within the boundary layer is integrated. Once the
growth rate reaches a threshold value of eN we assume flow becomes turbulent and the production term is switched
on. The threshold value is related to the free stream turbulence intensity with the correlation [28]
A B CD
t x y
uA
v
e
2
( )
xx
xy
xx xy x
u
u pB
uv
u e p u v k T
2
( )
xy
yy
xy yy y
v
uvC
v p
u e p u v k T
0
0
x
y
FD
F
x x k k
k
F E q n y y k k
k
F E q n
, * *
, 2
( )[( ) ],
( )( )[( ) ]
j i j i
T
j j j j
j i j i
T
j j j j
u k uk kk
t x x x x
u u
t x k x x x
*
, , ,
1/ , 2 2 / 3 , ( )
2
ji
T i j T i j i j ij
j i
uuk S k S
x x
4*
* *0 0
* 4
4 /15 (Re / )Re / Re /13 1 9, ,
1 Re / 25 1 Re / 100 1 (Re / )
TT k T
T k T T
RR R
R R R
* *
0 0
9 1 1 1Re , , , ,
125 2 3 9T
k
8, 6, 2.95kR R R
2 /Ru S
u
American Institute of Aeronautics and Astronautics
5
(9)
Plasma model
The Plasma actuator effects are typically modeled as a body force effect and there are different ways of achieving
this. Numerical modeling of fluid flows along with first-principles based plasma approaches is a daunting task
purely from a computational perspective. However, for low-speed flows (most of the flow control applications of
interest in this study fall in this regime) this can be avoided as the net body force can be modeled as quasi-steady
due to the fluid time-scale being much larger than the actuator driving frequency. But this is not the case for high-
speed flows where the actuator temporal variations will interact with the fluid flow. In the following, we will
present a brief description of the modeling approaches employed by the authors over the course of the present
research.
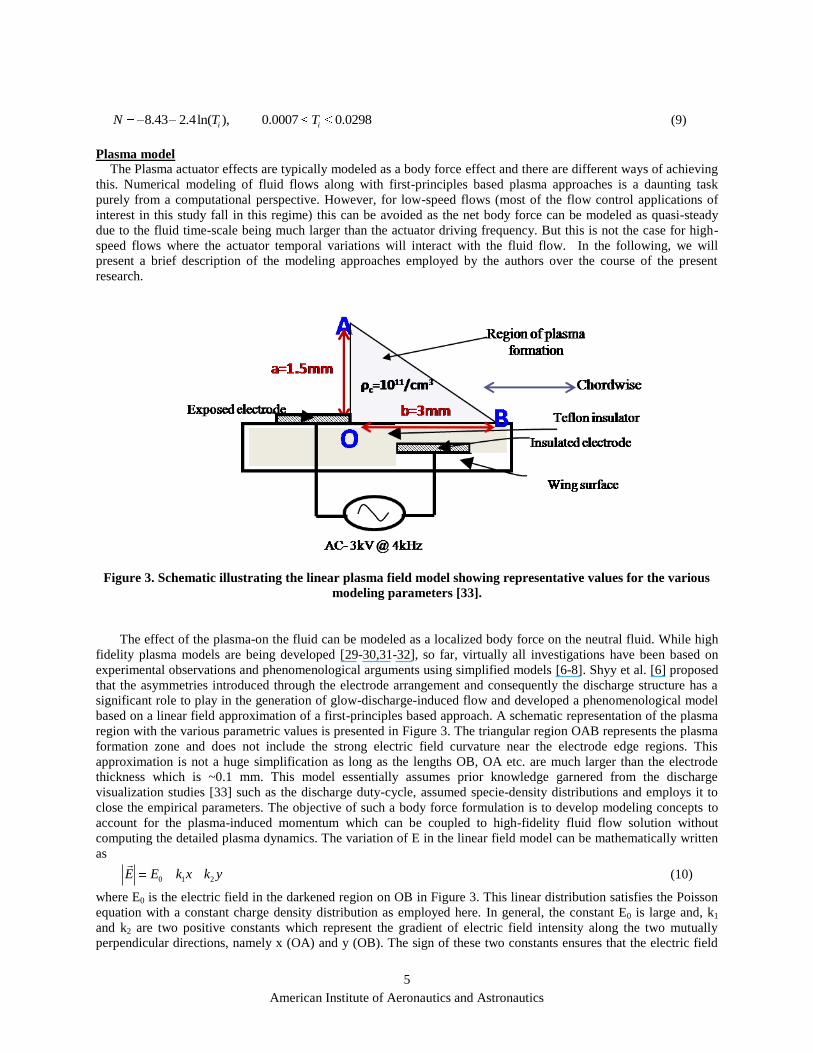
Figure 3. Schematic illustrating the linear plasma field model showing representative values for the various
modeling parameters [33].
The effect of the plasma-on the fluid can be modeled as a localized body force on the neutral fluid. While high
fidelity plasma models are being developed [29-30,31-32], so far, virtually all investigations have been based on
experimental observations and phenomenological arguments using simplified models [6-8]. Shyy et al. [6] proposed
that the asymmetries introduced through the electrode arrangement and consequently the discharge structure has a
significant role to play in the generation of glow-discharge-induced flow and developed a phenomenological model
based on a linear field approximation of a first-principles based approach. A schematic representation of the plasma
region with the various parametric values is presented in Figure 3. The triangular region OAB represents the plasma
formation zone and does not include the strong electric field curvature near the electrode edge regions. This
approximation is not a huge simplification as long as the lengths OB, OA etc. are much larger than the electrode
thickness which is ~0.1 mm. This model essentially assumes prior knowledge garnered from the discharge
visualization studies [33] such as the discharge duty-cycle, assumed specie-density distributions and employs it to
close the empirical parameters. The objective of such a body force formulation is to develop modeling concepts to
account for the plasma-induced momentum which can be coupled to high-fidelity fluid flow solution without
computing the detailed plasma dynamics. The variation of E in the linear field model can be mathematically written
as
0 1 2E E k x k y
(10)
where E0 is the electric field in the darkened region on OB in Figure 3. This linear distribution satisfies the Poisson
equation with a constant charge density distribution as employed here. In general, the constant E0 is large and, k1
and k2 are two positive constants which represent the gradient of electric field intensity along the two mutually
perpendicular directions, namely x (OA) and y (OB). The sign of these two constants ensures that the electric field
8.43 2.4ln( ), 0.0007 0.0298i iN T T

American Institute of Aeronautics and Astronautics
6
intensity decreases as one move along the positive directions of the axes. In the above equation, E0 can be
approximated as
0Ed
(11)
where d is the distance of separation between the two electrodes in the x direction and is the applied voltage
potential. In this work, we use an applied voltage source of 3 kV sinusoidal waveform at 5 kHz. The constants k1
and k2 are evaluated by using the condition that the field strength is the breakdown value (Ebr) at the plasma fluid
boundary.
The components of the electric field are given by
2
2 2
1 2
x
Ek kE
k k (12)
1
2 2
1 2
y
Ek kE
k k (13)
Here, ,k k are the multipliers introduced to define the force orientation from the actuator. For the co-flow
configuration as shown in Figure 3, the combination of 1, 1k k is employed. In the case of the counter-flow
operation the mirror image (x`-y) of the local x-y system is used by rotating about the y axis and 1, 1k k .
In the model of Shyy et al. [6], no attempt is made to establish a criterion for the plasma-induced fluid flow. Such a
criterion requires a more detailed modeling of the plasma dynamics as discussed in [30]. However, to identify the
plasma region, a delta function (δ) is chosen such that it has a value of unity inside the region OAB and zero outside
it. The above mentioned analytical-empirical model represents a time-averaged body force component acting on the
fluid given as
tave c c c c
tF e E e E t
T
(14)
where E is a linearized electric field, is the charge density and is the discharge duty cycle. In the
present simulation we use ν=3 kHz and Δt=60μs. A detailed discussion of the above is presented in [6,20]. This
modeling is based on the observation that the discharge operation time-scale is much larger than that for the fluid
flow and is primarily a steady forcing model. The above linearized body force model was also adopted by Gaitonde
et al. [18] for modeling plasma-based separation control in a NACA 0015 wing section. This steady forcing model
can be made unsteady by using a low frequency varying duty cycle.
The above analytical-empirical model has the major limitation because it dependents on parameters which need
to be experimentally measured. An improvement to the above is the self-consistent force field model developed
from fundamental plasma dynamics principles [29]. Computational modeling of discharge plasmas can be classified
into three types, namely, kinetic/particle models, fluid models, and hybrid approaches [29]. Kinetic models involve
the solution of the Boltzmann equation [34] for the specie velocity or energy distribution function in both space and
time or particle simulations, often using Monte Carlo methods and are generally computationally more expensive
than the fluid models. The fluid models consist of a few moments of the Boltzmann equation. However, the choice
of the model is also dependent on the regime of modeling interest. Particle techniques such as Monte-Carlo methods
are used to model the collision term. Particle-in-cell (PIC) techniques have been used for discharge modeling in
[35]. However, for the simulation of higher pressure discharges (~ 100 torr or higher), the velocity probability
distribution function can be assumed to be close to equilibrium and, therefore, fluid models can adequately capture
the relevant physics [35] and is has been used by the authors for this research.
III. Results and Discussions
We use the SD7003 airfoil to demonstrate the capability of plasma-based flow control. The chosen airfoil has
a maximum thickness of 8.5% and a maximum camber of 1.48%. The SD7003 airfoil has received substantial
experimental and numerical investigations due to its attribute of exhibiting a stable LSB over a broad range of
angles of attack at Reynolds numbers below 105. The studied airfoil has a chord length of 20 cm. Based on the free
stream velocity of 4.39 m/s and air density of 1.23, the Reynolds number is 60,000. The computational grid follows
c ce /t T
American Institute of Aeronautics and Astronautics
7
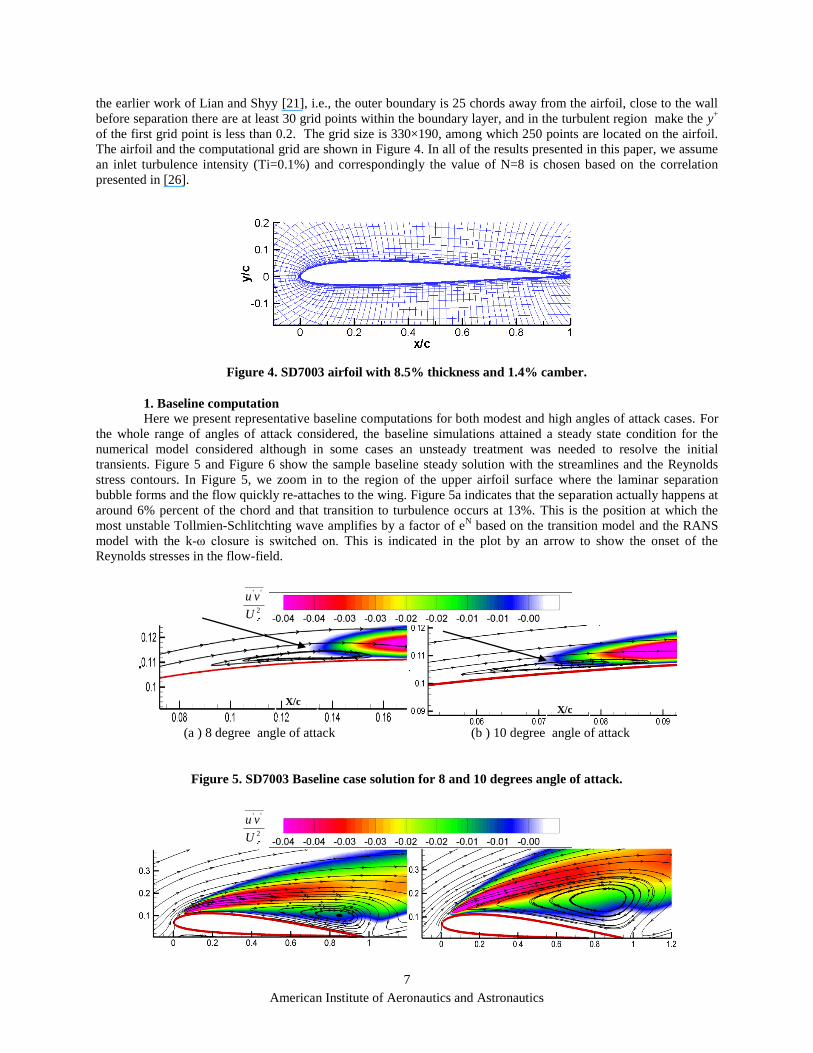
the earlier work of Lian and Shyy [21], i.e., the outer boundary is 25 chords away from the airfoil, close to the wall
before separation there are at least 30 grid points within the boundary layer, and in the turbulent region make the y+
of the first grid point is less than 0.2. The grid size is 330×190, among which 250 points are located on the airfoil.
The airfoil and the computational grid are shown in Figure 4. In all of the results presented in this paper, we assume
an inlet turbulence intensity (Ti=0.1%) and correspondingly the value of N=8 is chosen based on the correlation
presented in [26].
Figure 4. SD7003 airfoil with 8.5% thickness and 1.4% camber.
1. Baseline computation
Here we present representative baseline computations for both modest and high angles of attack cases. For
the whole range of angles of attack considered, the baseline simulations attained a steady state condition for the
numerical model considered although in some cases an unsteady treatment was needed to resolve the initial
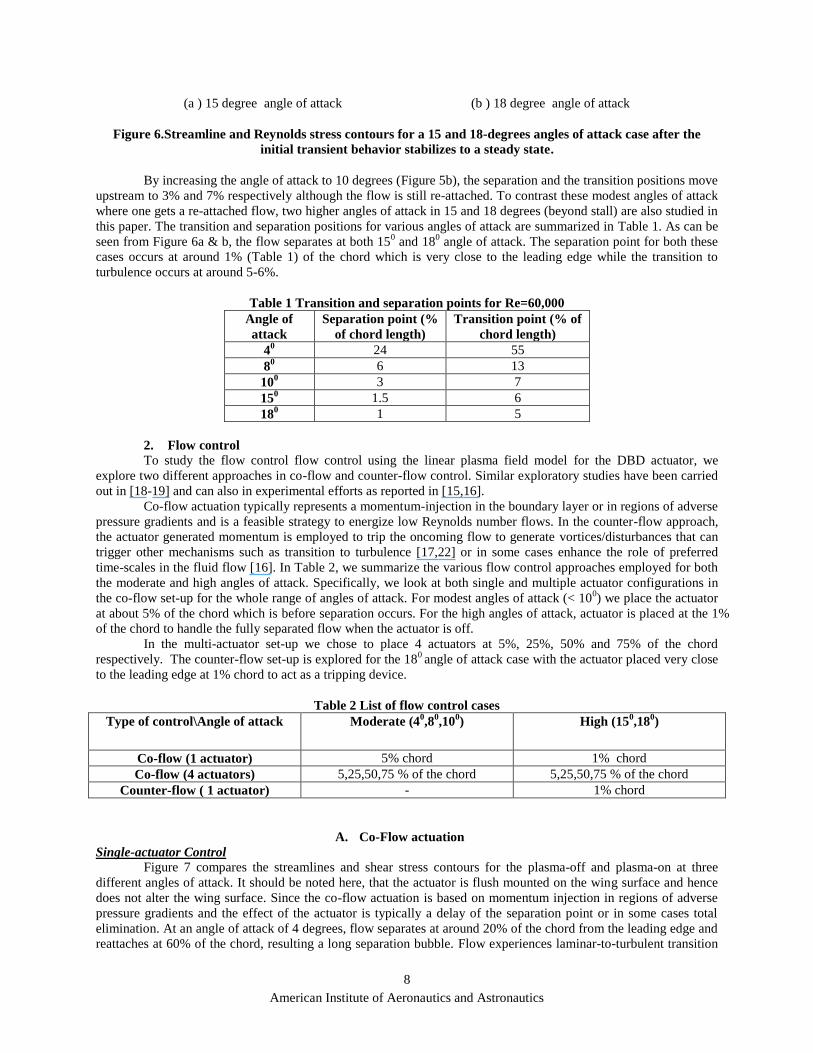
transients. Figure 5 and Figure 6 show the sample baseline steady solution with the streamlines and the Reynolds
stress contours. In Figure 5, we zoom in to the region of the upper airfoil surface where the laminar separation
bubble forms and the flow quickly re-attaches to the wing. Figure 5a indicates that the separation actually happens at
around 6% percent of the chord and that transition to turbulence occurs at 13%. This is the position at which the
most unstable Tollmien-Schlitchting wave amplifies by a factor of eN based on the transition model and the RANS
model with the k-ω closure is switched on. This is indicated in the plot by an arrow to show the onset of the
Reynolds stresses in the flow-field.
(a ) 8 degree angle of attack (b ) 10 degree angle of attack
Figure 5. SD7003 Baseline case solution for 8 and 10 degrees angle of attack.
_____' '
2
u v
U
_____' '
2
u v
U
X/c X/c
American Institute of Aeronautics and Astronautics
8
(a ) 15 degree angle of attack (b ) 18 degree angle of attack
Figure 6.Streamline and Reynolds stress contours for a 15 and 18-degrees angles of attack case after the
initial transient behavior stabilizes to a steady state.
By increasing the angle of attack to 10 degrees (Figure 5b), the separation and the transition positions move
upstream to 3% and 7% respectively although the flow is still re-attached. To contrast these modest angles of attack
where one gets a re-attached flow, two higher angles of attack in 15 and 18 degrees (beyond stall) are also studied in
this paper. The transition and separation positions for various angles of attack are summarized in Table 1. As can be
seen from Figure 6a & b, the flow separates at both 150 and 18
0 angle of attack. The separation point for both these
cases occurs at around 1% (Table 1) of the chord which is very close to the leading edge while the transition to
turbulence occurs at around 5-6%.
Table 1 Transition and separation points for Re=60,000
Angle of
attack
Separation point (%
of chord length)
Transition point (% of
chord length)
40 24 55
80 6 13
100 3 7
150 1.5 6
180 1 5
2. Flow control
To study the flow control flow control using the linear plasma field model for the DBD actuator, we
explore two different approaches in co-flow and counter-flow control. Similar exploratory studies have been carried
out in [18-19] and can also in experimental efforts as reported in [15,16].
Co-flow actuation typically represents a momentum-injection in the boundary layer or in regions of adverse
pressure gradients and is a feasible strategy to energize low Reynolds number flows. In the counter-flow approach,
the actuator generated momentum is employed to trip the oncoming flow to generate vortices/disturbances that can
trigger other mechanisms such as transition to turbulence [17,22] or in some cases enhance the role of preferred
time-scales in the fluid flow [16]. In Table 2, we summarize the various flow control approaches employed for both
the moderate and high angles of attack. Specifically, we look at both single and multiple actuator configurations in
the co-flow set-up for the whole range of angles of attack. For modest angles of attack (< 100) we place the actuator
at about 5% of the chord which is before separation occurs. For the high angles of attack, actuator is placed at the 1%
of the chord to handle the fully separated flow when the actuator is off.
In the multi-actuator set-up we chose to place 4 actuators at 5%, 25%, 50% and 75% of the chord
respectively. The counter-flow set-up is explored for the 180 angle of attack case with the actuator placed very close
to the leading edge at 1% chord to act as a tripping device.
Table 2 List of flow control cases
Type of control\Angle of attack Moderate (40,8
0,10
0) High (15
0,18
0)
Co-flow (1 actuator) 5% chord 1% chord
Co-flow (4 actuators) 5,25,50,75 % of the chord 5,25,50,75 % of the chord
Counter-flow ( 1 actuator) - 1% chord
A. Co-Flow actuation
Single-actuator Control
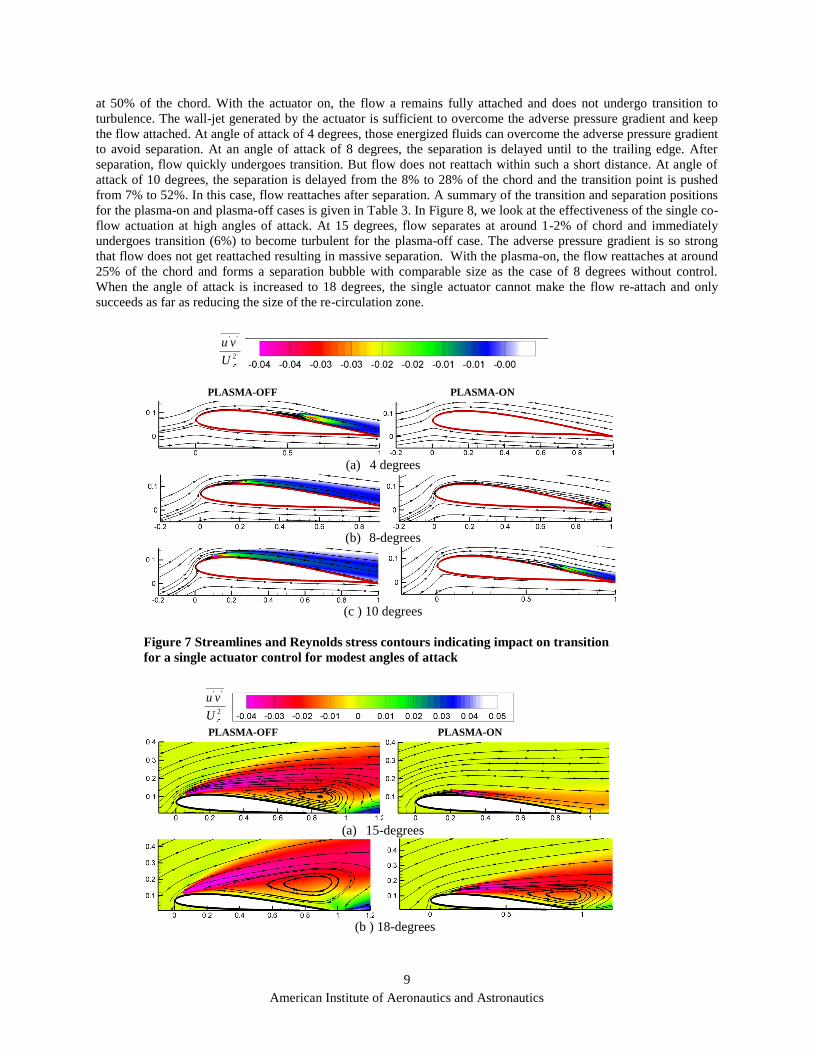
Figure 7 compares the streamlines and shear stress contours for the plasma-off and plasma-on at three
different angles of attack. It should be noted here, that the actuator is flush mounted on the wing surface and hence
does not alter the wing surface. Since the co-flow actuation is based on momentum injection in regions of adverse
pressure gradients and the effect of the actuator is typically a delay of the separation point or in some cases total
elimination. At an angle of attack of 4 degrees, flow separates at around 20% of the chord from the leading edge and
reattaches at 60% of the chord, resulting a long separation bubble. Flow experiences laminar-to-turbulent transition
American Institute of Aeronautics and Astronautics
9
at 50% of the chord. With the actuator on, the flow a remains fully attached and does not undergo transition to
turbulence. The wall-jet generated by the actuator is sufficient to overcome the adverse pressure gradient and keep
the flow attached. At angle of attack of 4 degrees, those energized fluids can overcome the adverse pressure gradient
to avoid separation. At an angle of attack of 8 degrees, the separation is delayed until to the trailing edge. After
separation, flow quickly undergoes transition. But flow does not reattach within such a short distance. At angle of
attack of 10 degrees, the separation is delayed from the 8% to 28% of the chord and the transition point is pushed
from 7% to 52%. In this case, flow reattaches after separation. A summary of the transition and separation positions
for the plasma-on and plasma-off cases is given in Table 3. In Figure 8, we look at the effectiveness of the single co-
flow actuation at high angles of attack. At 15 degrees, flow separates at around 1-2% of chord and immediately
undergoes transition (6%) to become turbulent for the plasma-off case. The adverse pressure gradient is so strong
that flow does not get reattached resulting in massive separation. With the plasma-on, the flow reattaches at around
25% of the chord and forms a separation bubble with comparable size as the case of 8 degrees without control.
When the angle of attack is increased to 18 degrees, the single actuator cannot make the flow re-attach and only
succeeds as far as reducing the size of the re-circulation zone.
PLASMA-OFF PLASMA-ON
(a) 4 degrees
(b) 8-degrees
(c ) 10 degrees
Figure 7 Streamlines and Reynolds stress contours indicating impact on transition
for a single actuator control for modest angles of attack
PLASMA-OFF PLASMA-ON
(a) 15-degrees
(b ) 18-degrees
_____' '
2
u v
U
_____' '
2
u v
U
American Institute of Aeronautics and Astronautics
10
Figure 8 Streamlines and Reynolds stress contours indicating impact on transition for a single actuator
control for high angles of attack
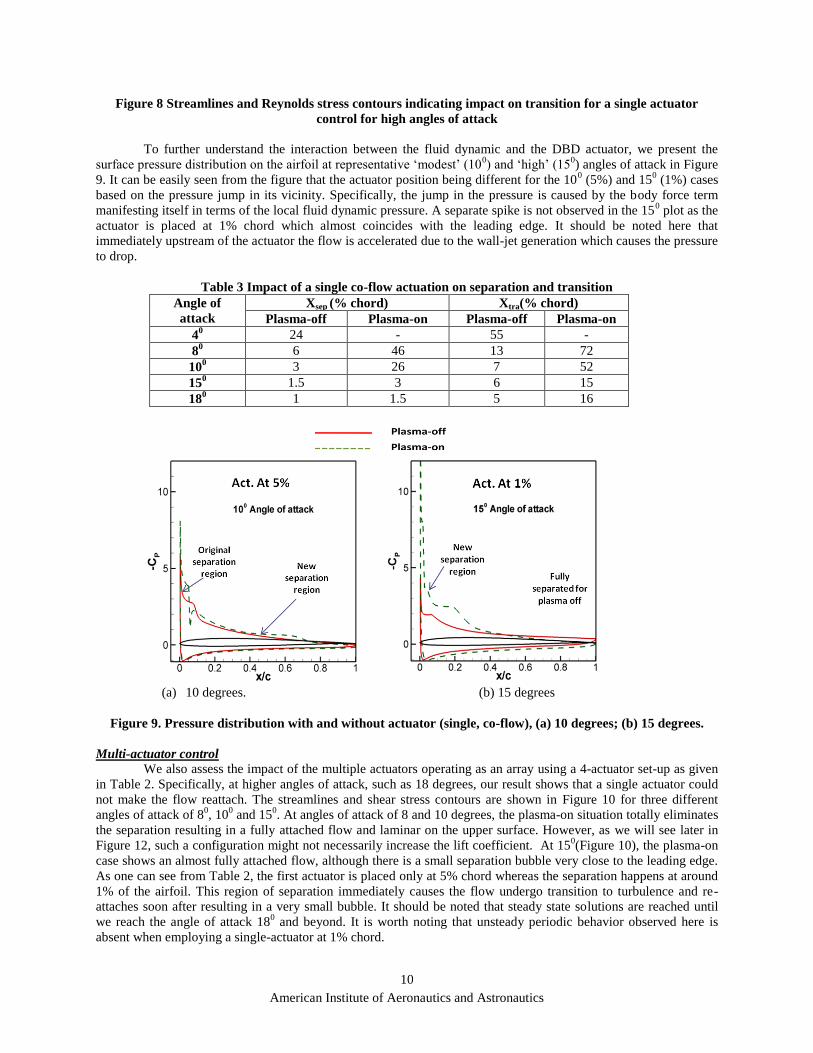
To further understand the interaction between the fluid dynamic and the DBD actuator, we present the
surface pressure distribution on the airfoil at representative „modest‟ (100) and „high‟ (15
0) angles of attack in Figure
9. It can be easily seen from the figure that the actuator position being different for the 100 (5%) and 15
0 (1%) cases
based on the pressure jump in its vicinity. Specifically, the jump in the pressure is caused by the body force term
manifesting itself in terms of the local fluid dynamic pressure. A separate spike is not observed in the 150 plot as the
actuator is placed at 1% chord which almost coincides with the leading edge. It should be noted here that
immediately upstream of the actuator the flow is accelerated due to the wall-jet generation which causes the pressure
to drop.
Table 3 Impact of a single co-flow actuation on separation and transition
Angle of
attack
Xsep (% chord) Xtra(% chord)
Plasma-off Plasma-on Plasma-off Plasma-on
40 24 - 55 -
80 6 46 13 72
100 3 26 7 52
150 1.5 3 6 15
180 1 1.5 5 16
(a) 10 degrees. (b) 15 degrees
Figure 9. Pressure distribution with and without actuator (single, co-flow), (a) 10 degrees; (b) 15 degrees.
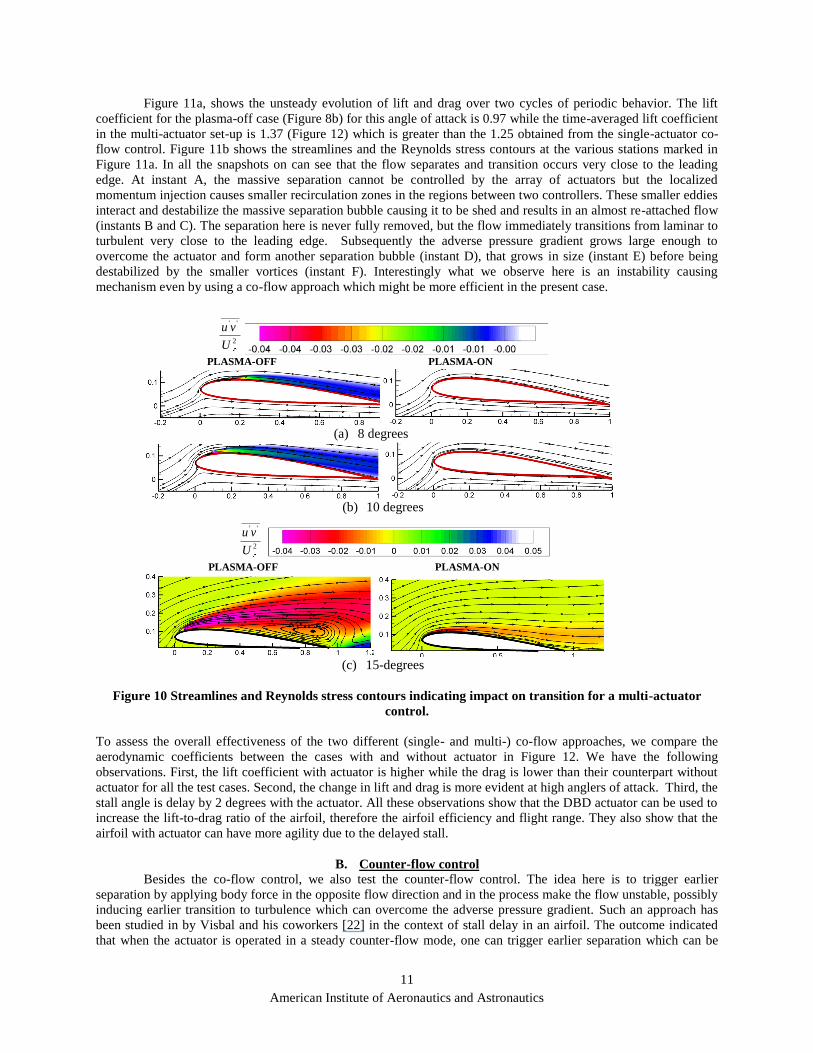
Multi-actuator control
We also assess the impact of the multiple actuators operating as an array using a 4-actuator set-up as given
in Table 2. Specifically, at higher angles of attack, such as 18 degrees, our result shows that a single actuator could
not make the flow reattach. The streamlines and shear stress contours are shown in Figure 10 for three different
angles of attack of 80, 10
0 and 15
0. At angles of attack of 8 and 10 degrees, the plasma-on situation totally eliminates
the separation resulting in a fully attached flow and laminar on the upper surface. However, as we will see later in
Figure 12, such a configuration might not necessarily increase the lift coefficient. At 150(Figure 10), the plasma-on
case shows an almost fully attached flow, although there is a small separation bubble very close to the leading edge.
As one can see from Table 2, the first actuator is placed only at 5% chord whereas the separation happens at around
1% of the airfoil. This region of separation immediately causes the flow undergo transition to turbulence and re-
attaches soon after resulting in a very small bubble. It should be noted that steady state solutions are reached until
we reach the angle of attack 180 and beyond. It is worth noting that unsteady periodic behavior observed here is
absent when employing a single-actuator at 1% chord.
American Institute of Aeronautics and Astronautics
11
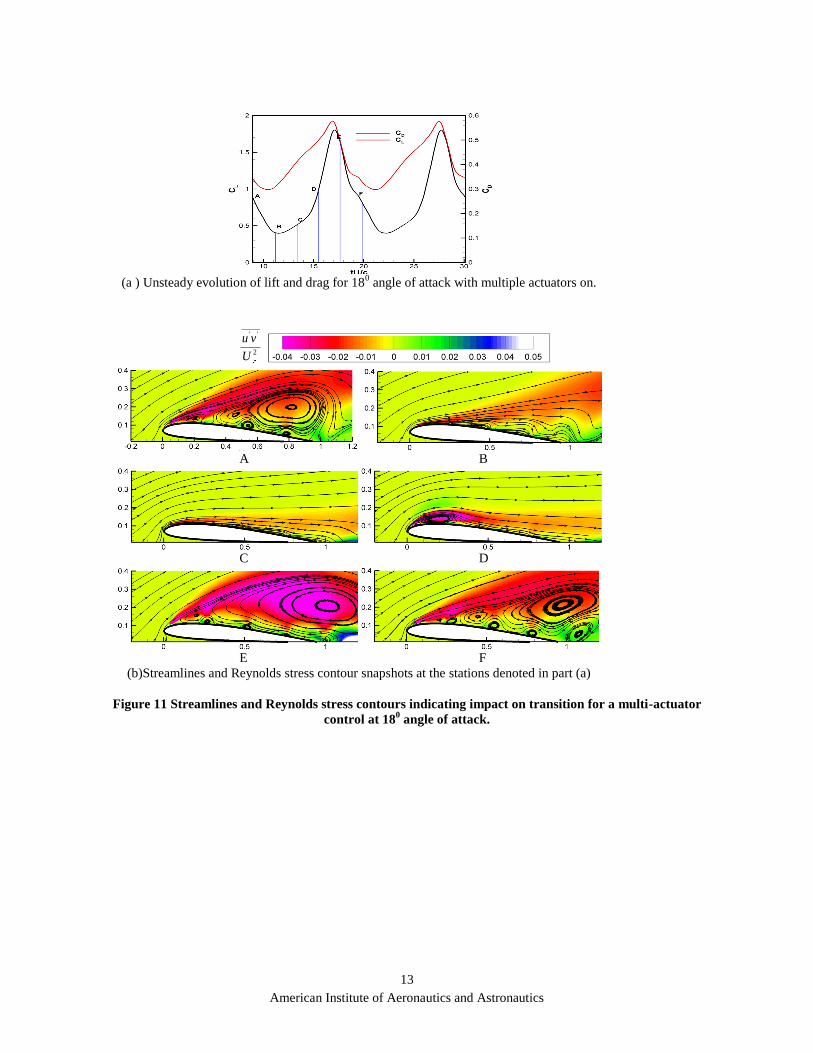
Figure 11a, shows the unsteady evolution of lift and drag over two cycles of periodic behavior. The lift
coefficient for the plasma-off case (Figure 8b) for this angle of attack is 0.97 while the time-averaged lift coefficient
in the multi-actuator set-up is 1.37 (Figure 12) which is greater than the 1.25 obtained from the single-actuator co-
flow control. Figure 11b shows the streamlines and the Reynolds stress contours at the various stations marked in
Figure 11a. In all the snapshots on can see that the flow separates and transition occurs very close to the leading
edge. At instant A, the massive separation cannot be controlled by the array of actuators but the localized
momentum injection causes smaller recirculation zones in the regions between two controllers. These smaller eddies
interact and destabilize the massive separation bubble causing it to be shed and results in an almost re-attached flow
(instants B and C). The separation here is never fully removed, but the flow immediately transitions from laminar to
turbulent very close to the leading edge. Subsequently the adverse pressure gradient grows large enough to
overcome the actuator and form another separation bubble (instant D), that grows in size (instant E) before being
destabilized by the smaller vortices (instant F). Interestingly what we observe here is an instability causing
mechanism even by using a co-flow approach which might be more efficient in the present case.
PLASMA-OFF PLASMA-ON
(a) 8 degrees
(b) 10 degrees
PLASMA-OFF PLASMA-ON
(c) 15-degrees
Figure 10 Streamlines and Reynolds stress contours indicating impact on transition for a multi-actuator
control.
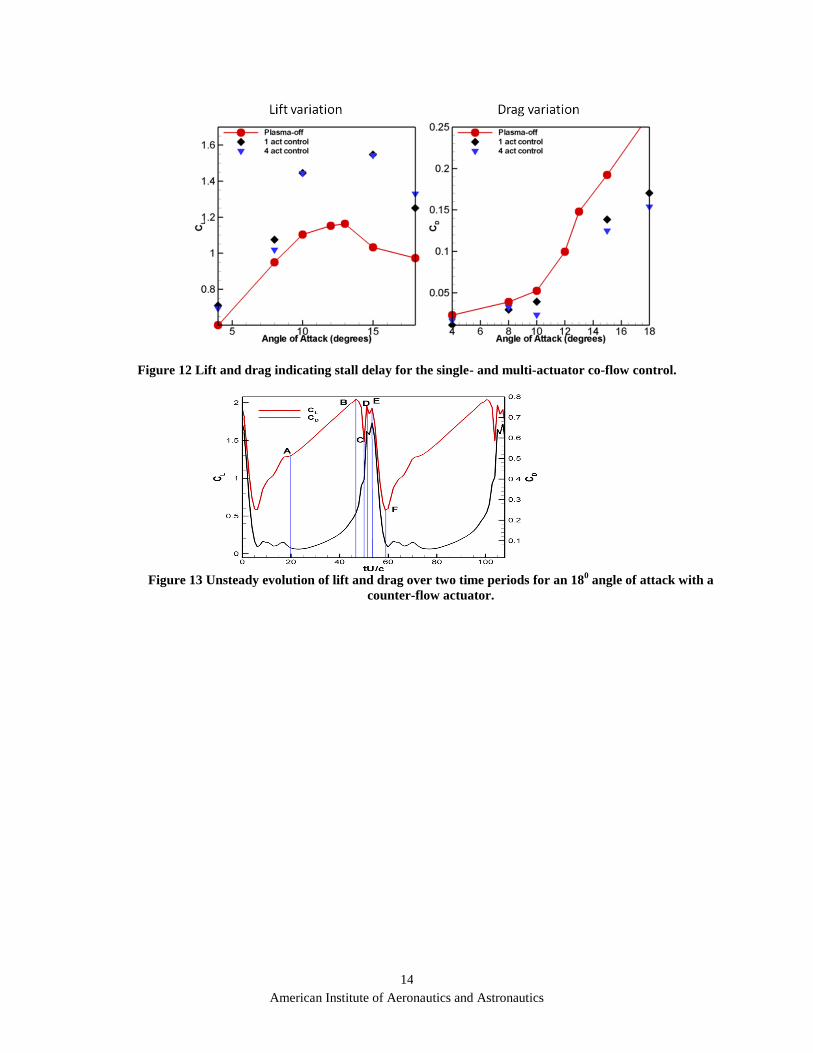
To assess the overall effectiveness of the two different (single- and multi-) co-flow approaches, we compare the
aerodynamic coefficients between the cases with and without actuator in Figure 12. We have the following
observations. First, the lift coefficient with actuator is higher while the drag is lower than their counterpart without
actuator for all the test cases. Second, the change in lift and drag is more evident at high anglers of attack. Third, the
stall angle is delay by 2 degrees with the actuator. All these observations show that the DBD actuator can be used to
increase the lift-to-drag ratio of the airfoil, therefore the airfoil efficiency and flight range. They also show that the
airfoil with actuator can have more agility due to the delayed stall.
B. Counter-flow control
Besides the co-flow control, we also test the counter-flow control. The idea here is to trigger earlier
separation by applying body force in the opposite flow direction and in the process make the flow unstable, possibly
inducing earlier transition to turbulence which can overcome the adverse pressure gradient. Such an approach has
been studied in by Visbal and his coworkers [22] in the context of stall delay in an airfoil. The outcome indicated
that when the actuator is operated in a steady counter-flow mode, one can trigger earlier separation which can be
_____' '
2
u v
U
_____' '
2
u v
U
American Institute of Aeronautics and Astronautics
12
unstable resulting in earlier transition to turbulence. However, it was observed that if the actuation is not sufficiently
strong then the transition may not happen which led to the exploration of unsteady actuation mechanisms to trigger
the transition. However, in this effort a purely steady counter-flow operation appears sufficient to trigger transition
to turbulence. Specifically, we employ a single actuator oriented to counter the incoming flow direction and is
placed very close to the leading edge at 1% chord. The angle of attack is chosen to be 180 as in the previous
discussion. Figure 13 shows the unsteady evolution of lift and drag over two time period (approximately 110 non-
dimensional time units as against 20 in the co-flow multi-actuator case). The time-averaged lift coefficient for this
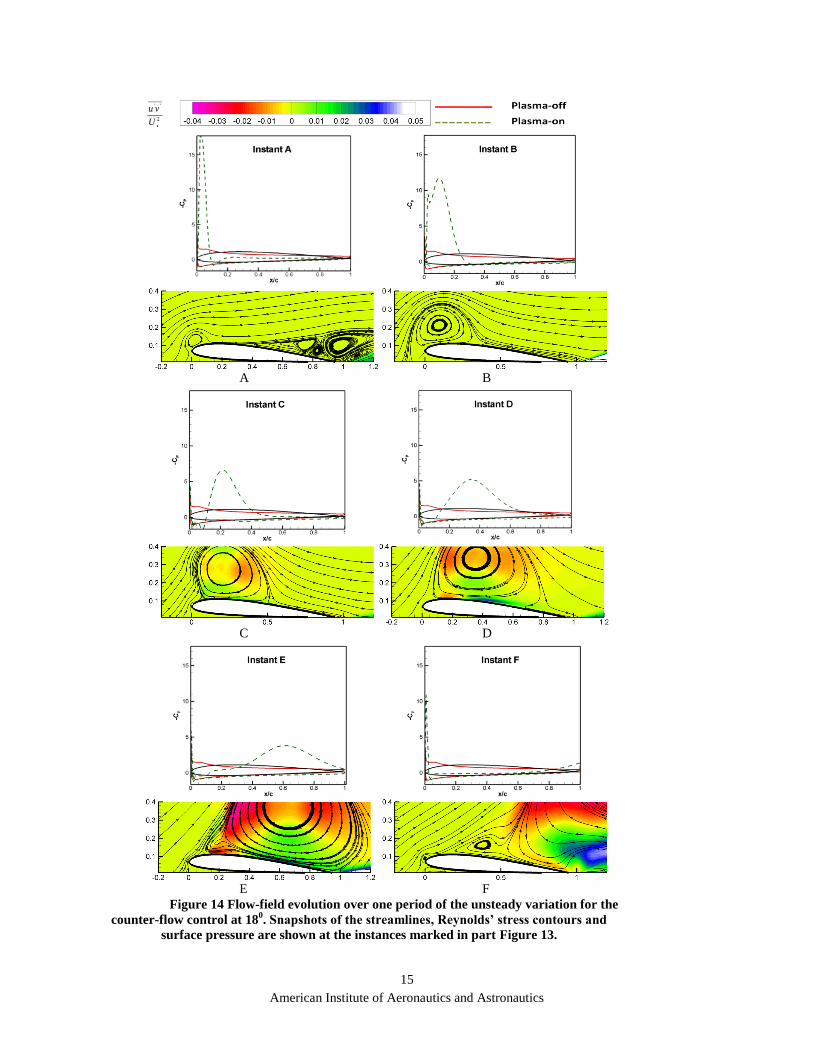
case is 1.46 which is greater than any observed for the co-flow actuation. Figure 14 shows streamlines and pressure
contour snapshots at the various instances (Figure 13) during one period of the time-cycle. The counter-flow
momentum injection into the flow near the leading edge causes a large separation region to form which in turn
results in a secondary separation bubble (instant A). This secondary re-circulation region appears to be unstable and
is shed (instant B) at which time the leading edge bubble grows in size and moves across the upper surface of the
airfoil (instants C and D) and attains peak value of lift when the separation region covers the entire upper surface
(instant E). The eddy is subsequently shed (instant F) resulting in a drastic fall in the lift only for the process to start
all over again with another leading separation bubble forming and aiding the recovery of the lift. The evolution of
the drag indicates that a major contribution is from the form drag as observed by its peak values at instants C,D and
E.
Table 4 Comparison of actuation outcomes (angle of attack of 180).
Plasma-off Single (co-flow) Multi (co-flow) Single (counter-flow)
CL 0.97 1.25 1.37 1.46
To help summarize the findings we have compared the outcome of the different actuation approaches with respect to
the baseline computation in Table 4. It should be noted here that the time-averaged numbers have been used for
comparison. Overall, the most lift is generated by the counter-flow actuation at this high angle of attack followed by
the co-flow approaches. Specifically, if one considers the power consumption for operating multiple actuators, the
counter-flow approach seems attractive.
IV. Summary and Conclusion
We couple high-fidelity Navier-Stokes equations with a phenomenological DBD model to study the plasma-based
actuator flow control in the transitional flow region and to probe their interaction. The transitional flow is modeled
with a eN transition model. Our purpose is to explore the possibilities to use such actuators for low Reynolds number
separation flow control with applications to UAVs and MAVs. Specifically, we attempt two types of control in co-
flow (momentum injection) and counter-flow (tripping mechanism) actuation strategies. In co-flow, we attempt both
single as well as multi-actuator set-ups. The following findings can be summarized.
The co-flow approach offers momentum enhancement via favorable pressure gradient in the near wall
region while the counter flow approach can trigger earlier separation and transition by introducing adverse
pressure gradients.
Consistent increase in lift and decrease in drag for all the test cases, especially with higher angles of attack
when flow separation significantly affects the overall aerodynamics characteristics.
At high angles of attack, the actuators may not have enough influence to suppress the separation. However,
with multi-actuator arrangements, the separation zone can be broken up into multiple smaller separating
regions. Counter-flow actuation can effectively increase lift and be more effective than co-flow approaches
at high angles of attack.
American Institute of Aeronautics and Astronautics
13
(a ) Unsteady evolution of lift and drag for 18
0 angle of attack with multiple actuators on.
A B
C D
E F
(b)Streamlines and Reynolds stress contour snapshots at the stations denoted in part (a)
Figure 11 Streamlines and Reynolds stress contours indicating impact on transition for a multi-actuator
control at 180 angle of attack.
_____' '
2
u v
U
American Institute of Aeronautics and Astronautics
14
Figure 12 Lift and drag indicating stall delay for the single- and multi-actuator co-flow control.
Figure 13 Unsteady evolution of lift and drag over two time periods for an 18
0 angle of attack with a
counter-flow actuator.
American Institute of Aeronautics and Astronautics
15
A B
C D
E F
Figure 14 Flow-field evolution over one period of the unsteady variation for the
counter-flow control at 180. Snapshots of the streamlines, Reynolds’ stress contours and
surface pressure are shown at the instances marked in part Figure 13.
_____' '
2
u v
U
American Institute of Aeronautics and Astronautics
16
Acknowledgement
The present work has been supported in part by a collaborative center grant sponsored by the Air Force Research
Laboratory, Flight Vehicle Directory, Dr. Jack Benek program monitor. We have benefited from discussion with Dr.
Miguel Visbal in the course of investigation.
References
1. Shyy, W., Berg, M., and Ljungqvist, D., “Flapping and Flexible Wings for Biological and Micro Vehicles,”
Process in Aerospace Sciences, Vol. 35, 1999, pp. 455-506.
2. Shyy, W., Lian, Y., Tang, J., Viieru, D., and Liu, H., Aerodynamics of Low Reynolds Number Flyers, to be
published by Cambridge University Press.
3. Lissaman, P.B.S., “Low-Reynolds-number Airfoils,” Annu. Rev. Fluid Mech. Vol. 15, 1983, pp. 223-239.
4. Ifju, P., Jenkins, D., Ettinger, S., Lian, Y., Shyy, W., and Waszak, R. M., “Flexible-Wing-Based Micro Air
Vehicles,” AIAA Paper 2002-0705.
5. Lian, Y., Steen, J., Trygg-Wilander, M., and Shyy, W., “Low Reynolds Number Turbulent Flows around a
Dynamically Shaped Airfoil,” Computers and Fluids, Vol. 32, 2003, pp. 287-303.
6. Shyy, W., Jayaraman, B., and Anderson, A., “Modeling of Glow-Discharge Induced Flow Dynamics”, J. Appl.
Phys., 92(11), pp 6434-6443, 2002.
7. Roth, J.R., Sherman, D.M., and Wilkinson, S.P., “Boundary Layer Flow Control With a One Atmosphere
Uniform Glow Discharge”, AIAA paper 98-0328, 36th
AIAA Aerospace Sciences Meeting and Exhibit, Reno
NV, Jan 12-15, 1998.
8. Corke, T.C., Jumper, E.J., Post, M.L., Orlov. D., and Mclaughlin, T.E., “Application of Weakly-ionized
Plasmas as Wing Flow-Control Devices”, AIAA paper 2002-0350, 41st Aerospace Sciences Meeting & Exhibit,
Reno, NV, Jan 6-9, 2003.
9. Smith, B.L., and Glezer, A., “The Formation and Evolution of Synthetic Jets,” Physics of Fluids, 10(9), pp.
2281–2297, 1998.
10. Goeksel, B., I. Rechenberg, D. Greenblatt, C. O. Paschereit, “Steady and Unsteady Plasma Wall Jets for
Separation and Circulation Control”, AIAA paper 2006-3686, 3rd AIAA Flow Control Conference, San
Fransisco, USA, 2006.
11. Drela, M., and Giles, M. B., “Viscous-Inviscid Analysis of Transonic and Low Reynolds Number Airfoils,”
AIAA Journal, Vol. 25, 1987, pp. 1347-1355.
12. Enloe, C.L., Mclaughlin, T.E., Van Dyken, R., and Kachner, K.D., “Mechanisms and Responses of a Single
Dielectric Barrier Plasma Actuator: Plasma Morphology”, AIAA J. 42(3), pp. 589-594, 2004.
13. Van Dyken, R., Mclaughlin, T.E., and Enloe, C.L., “Parametric Investigations of a Single Dielectric Barrier
Plasma Actuator”, AIAA paper 2004-846, 42nd
Aerospace Sciences Meet & Exhibit, Reno, NV, Jan 5-8, 2004.
14. Corke, T.C., and Matlis, E., “Phased Plasma Arrays for Unsteady Flow Control”, AIAA paper 2000-2323,
Fluids 2000, Denver, CO, June 19-22, 2000.
15. Corke, T.C., and Post, M.L., “Overview of Plasma Flow Control: Concepts, Optimization and Applications”,
AIAA paper 2005-0563, 43rd
Aerospace Sciences Meeting and Exhibit, Reno, NV, Jan 10-13, 2005.
16. Chan, S., Zhang, X. and Gabriel, S., “The attenuation of cavity tones using plasma actuators”, AIAA paper
2005-2802, 11th
AIAA/CEAS Aeroacoustics Conference, Monterey, CA, May 23-25, 2005.
17. Soldati, A., and Banerjee, S., “Turbulence Modification by Large-scale Organized Electro-hydrodynamic
flows”, Phys. of Fluids, 10(7), pp 1742-1756, 1998.
18. Gaitonde, D.V., Visbal, M.R., and Roy, S., “Control of flow past a wing section with Plasma-based Body
forces”, AIAA paper 2005-5302, 36th
Plasma Dynamics and Lasers Conference, Toronto, June 6-9, 2005.
19. Gaitonde, D.V., Visbal, M.R. and Roy, S., “A Coupled Approach for Plasma-Based Flow Control Simulations
of Wing Sections”, AIAA paper 2006-1205, 44th
AIAA Aerospace Sciences Meeting and Exhibit, Reno, NV,
Jan 9-12, 2006.
20. Jayaraman, B., and Shyy, W., “Flow Control and Thermal Management using Dielectric Glow Discharge
Concepts”, AIAA paper 2003-3712, 33rd
AIAA Fluid Dynamics Conference and Exhibit, Orlando, June 23-26,
2003.
21. Lian, Y., and Shyy, W., “Laminar-Turbulent Transition of a Low Reynolds Number Rigid or Flexible Airfoil”,
36th AIAA Fluid Dynamics Conference and Exhibit, San Francisco, California. To be published by AIAA J.
22. Visbal, M.R., Gaitonde, D.V. and Roy, S., “Control of Transitional and Turbulent Flows Using Plasma-Based
Actuators”, AIAA paper 2006-3230, 36th
AIAA Fluid Dynamics Conference and Exhibit, San Franciso, CA,
Jun 5-8, 2006.
American Institute of Aeronautics and Astronautics
17
23. Rizzetta, D.P. and Visbal, M.R., “Numerical Investigation of Plasma-based Flow Control For a Transitional
High-loaded Low-Pressure Turbine”, AIAA paper 2007-938, 45th
AIAA Aerospace Sciences Meeting and
Exhibit, Reno, NV, Jan 8-11, 2007.
24. Patankar, S. V., and Spalding, D. B., “A Calculation Procedure for Heat, Mass and Momentum Transfer in
Three-dimensional Parabolic Flows,” Int. J. Heat Mass Transfer, Vol. 15, pp. 1787-1806, 1972.
25. Wilcox, D., Turbulence Modeling for CFD (Second Edition), DCW Industries, Inc, La Canada, California,
2000.
26. Smith, A. M. O., and Gamberoni, N., “Transition, Pressure gradient, and Stability Theory,” Douglas Aircraft
Report ES-26388, 1956.
27. Van Ingen, J. L., “A Suggested Semi-Empirical Method for the Calculation of the Boundary Layer Transition
Region,” Inst. of Tech., Dept. of Aeronautics and Engrg., Report VTH-74, Delft, Holland, 1956.
28. Mack, L. M., “Transition Prediction and Linear Stability Theory,” pp. 1-1-1-22 of AGARD, 1977.
29. Jayaraman, B., Thakur, S., and Shyy, W., “Modeling of Dielectric Barrier Discharge and Resulting Fluid
Dynamics”, AIAA paper 2006-0686, 44th
Aerospace Sciences Meeting Reno, NV, Jan 9-12, 2006.
30. Jayaraman, B., Thakur, S., and Shyy, W., “Modeling of Fluid Dynamics and Heat Transfer Induced by
Dielectric Barrier Plasma Actuator”, J. Heat. Trans., 129(4), pp. 517-525, 2007.
31. Roy, S., and Gaitonde, D.V., “Modeling surface discharge effects of atmospheric RF on gas flow control”, ,
AIAA paper 2005-0160, 43rd
AIAA Aerospace Sciences Meeting, Reno NV, Jan 10-13, 2005.
32. Roy, S., and Gaitonde, D.V., “Multidimensional collisional dielectric barrier discharge for flow separation
control at atmospheric pressures”, AIAA paper 2005-4631, 35th
AIAA Fluid dynamics conference, Toronto,
Canada, Jun 6-9, 2005.
33. Segur, P., and Massines, F., “The role of numerical modeling to understand the behavior and to predict the
existence of an atmospheric pressure glow discharge controlled by a dielectric barrier”, Proc. Of the XIIIth
Int.
Conf. of Gas Discharges and their applications, Glasgow, Sep. 3-8, pp. 15-24, 2000.
34. Riley, M.E., Greenberg, K.E., Hebner, G.A., and Drallos, P., “Theoretical and experimental study of low-
temperature, capacitively coupled, radio-frequency helium plasmas”, J. Appl. Phys, 75(6), pp. 2789-2798, 1994.
35. Nitschke, T.E., and Graves, D.B., “A comparison of particle in cell and fluid model simulations of low-pressure
radio frequency discharges”, J. Appl. Phys. 76(10), pp. 5646-5660, 1994.
36. Radespiel, R., Graage, K., and Brodersen, O., “Transition Predictions Using Reynolds-Averaged Navier-Stokes
and Linear Stability Analysis Methods,” AIAA Paper 91-1641, June 1991.
37. Shyy, W., Computational Modeling for Fluid Flow and Interfacial Transport, Elsevier, Amsterdam, The
Netherlands, (1994, revised printing 1997) xviii+504 pages.
38. Singh, K.P., and Roy, S., “Simulation of an asymmetric single dielectric barrier plasma actuator”, J. App. Phys.
98, 083303-1, 2005.
39. Shyy, W., Thakur, S., Ouyang, H., Liu, J., and Blosch, E., Computational Techniques for Complex Transport
Phenomena, Cambridge university press, UK, 1997.
40. Post, M.L., and Corke, T.C., “Separation Control on High Angle of Attack Airfoil Using Plasma Actuators”,
AIAA paper 2003-1024, 41st Aerospace Sciences Meet & Exhibit, Reno, NV, Jan 6-9, 2003.
41. Thakur, S., Wright, J., and Shyy, W., STREAM: A computational fluid dynamics and heat transfer Navier-
Stokes solver: theory and applications, Gainesville, FL: Streamline Numerics, Inc; 2002