Modulation of Network Excitability by Persistent Activity: How Working Memory Affects the Response...
28
1 Modulation of Network Excitability by Persistent Activity: How Working Memory Affects the Response to Incoming Stimuli Elisa M. Tartaglia 1,2 , Nicolas Brunel 2 , Gianluigi Mongillo 3,4,* 1 Center for Neuroscience and Cognitive Systems @UniTn, Istituto Italiano di Tecnologia, Rovereto, Italy 2 Departments of Statistics and Neurobiology, University of Chicago, Chigaco (IL), USA 3 Universit´ e Paris Descartes, Centre de Neurophysique, Physiologie et Pathologie, Paris, France 4 Centre National de la Recherche Scientifique, UMR 8119, Paris, France * E-mail: [email protected] Abstract Persistent activity and match effects are widely regarded as neuronal correlates of short-term storage and manipulation of information, with the first serving active maintenance and the latter supporting the comparison between memory contents and incoming sensory information. The mechanistic and functional relationship between these two basic neurophysiological signatures of working memory remain elusive. We propose that match signals are generated as a result of transient changes in local network excitabil- ity brought about by persistent activity. Neurons more active will be more excitable, and thus more responsive to external inputs. Accordingly, network responses are jointly determined by the incoming stimulus and the ongoing pattern of persistent activity. Using a spiking model network, we show that this mechanism is able to reproduce most of the experimental phenomenology of match effects as exposed by single-cell recordings during delayed-response tasks. The model provides a unified, parsimonious mecha- nistic account of the main neuronal correlates of working memory, makes several experimentally testable predictions, and demonstrates a new functional role for persistent activity. Author Summary Over short time periods, memories are stored by sustained patterns of spiking activity which, once ini- tiated by the stimulus, persist over the entire retention interval. How the information stored by such persistent activity is later retrieved is presently unclear. Here we propose that, besides temporarily stor- ing memories, persistent activity is also instrumental in their retrieval by transiently modifying the tuning properties of the underlying neuronal networks. We show that the mechanism proposed parsimoniously recapitulates the extensive experimental phenomenology on match effects observed in delayed-response tasks, where the information held in memory has to be compared with incoming, sensory-related infor- mation to act appropriately. The theory makes very specific, straightforwardly testable predictions. Introduction Memory allows an organism to store information about past events and then use it to modify its behavior in response to future ones. As a simple example, consider the classic delayed match-to-sample (DMS) task, where the appropriate behavior upon presentation of the test stimulus is conditional on the sample stimulus (the past event). What are the mechanisms that support the storage of information about the sample stimulus and its retrieval upon the presentation of the test stimulus? Electrophysiological studies have exposed two neuronal correlates of those mechanisms: (i) sample-selective persistent activity during the delay period (see, e.g., [1–3]); (ii) differential test-period activity depending on whether the test stimulus matches or not the sample (see, e.g., [1,4–7]). Specifically, some neurons show enhanced responses in the match as compared to the non-match condition (match enhancement), while others show
Transcript of Modulation of Network Excitability by Persistent Activity: How Working Memory Affects the Response...

1
Modulation of Network Excitability by Persistent Activity: HowWorking Memory Affects the Response to Incoming StimuliElisa M. Tartaglia1,2, Nicolas Brunel2, Gianluigi Mongillo3,4,∗
1 Center for Neuroscience and Cognitive Systems @UniTn, Istituto Italiano di Tecnologia,Rovereto, Italy2 Departments of Statistics and Neurobiology, University of Chicago, Chigaco (IL), USA3 Universite Paris Descartes, Centre de Neurophysique, Physiologie et Pathologie, Paris,France4 Centre National de la Recherche Scientifique, UMR 8119, Paris, France∗ E-mail: [email protected]
Abstract
Persistent activity and match effects are widely regarded as neuronal correlates of short-term storageand manipulation of information, with the first serving active maintenance and the latter supporting thecomparison between memory contents and incoming sensory information. The mechanistic and functionalrelationship between these two basic neurophysiological signatures of working memory remain elusive.We propose that match signals are generated as a result of transient changes in local network excitabil-ity brought about by persistent activity. Neurons more active will be more excitable, and thus moreresponsive to external inputs. Accordingly, network responses are jointly determined by the incomingstimulus and the ongoing pattern of persistent activity. Using a spiking model network, we show that thismechanism is able to reproduce most of the experimental phenomenology of match effects as exposed bysingle-cell recordings during delayed-response tasks. The model provides a unified, parsimonious mecha-nistic account of the main neuronal correlates of working memory, makes several experimentally testablepredictions, and demonstrates a new functional role for persistent activity.
Author Summary
Over short time periods, memories are stored by sustained patterns of spiking activity which, once ini-tiated by the stimulus, persist over the entire retention interval. How the information stored by suchpersistent activity is later retrieved is presently unclear. Here we propose that, besides temporarily stor-ing memories, persistent activity is also instrumental in their retrieval by transiently modifying the tuningproperties of the underlying neuronal networks. We show that the mechanism proposed parsimoniouslyrecapitulates the extensive experimental phenomenology on match effects observed in delayed-responsetasks, where the information held in memory has to be compared with incoming, sensory-related infor-mation to act appropriately. The theory makes very specific, straightforwardly testable predictions.
Introduction
Memory allows an organism to store information about past events and then use it to modify its behaviorin response to future ones. As a simple example, consider the classic delayed match-to-sample (DMS)task, where the appropriate behavior upon presentation of the test stimulus is conditional on the samplestimulus (the past event). What are the mechanisms that support the storage of information aboutthe sample stimulus and its retrieval upon the presentation of the test stimulus? Electrophysiologicalstudies have exposed two neuronal correlates of those mechanisms: (i) sample-selective persistent activityduring the delay period (see, e.g., [1–3]); (ii) differential test-period activity depending on whether thetest stimulus matches or not the sample (see, e.g., [1, 4–7]). Specifically, some neurons show enhancedresponses in the match as compared to the non-match condition (match enhancement), while others show

2
the opposite pattern (match suppression), despite the fact that stimuli are physically identical in the twoconditions.
Persistent delay activity, together with match effects, are basic neuronal hallmarks of temporarymaintenance and manipulation of information. Persistent activity has been primarily associated withshort-term storage, while match effects are thought to reflect the outcome of the comparison betweenstored and incoming information. Consistently with these putative roles, they have been observed acrossdifferent short-term memory protocols besides the DMS task, such as DMS with intervening distrac-tors [8, 9], delayed non-match-to-sample [10], delayed paired-associate [11], delayed categorization [12]and delayed cue-instructed go/nogo tasks [13], and with different class of stimuli, such as natural im-ages, fractal images, spatial locations, motion directions and pure tones. Persistent activity and matcheffects have also been observed across diverse cortical regions and, interestingly, the basic phenomenologyexposed in regions traditionally associated to memory function, such as the pre-frontal, infero-temporaland parietal cortices [8,9,14], is qualitatively very similar to the phenomenology observed in regions tra-ditionally associated to sensory processing, such as auditory cortex [15], area V4 [16] and area MT [17].
It is presently unclear how the information stored in the pattern of persistent activity is retrievedand compared with incoming stimuli. One theory holds that match enhancement and persistent activityon one hand, and match suppression on the other hand, are neuronal manifestations of two distinct,parallel mechanisms supporting memory storage and retrieval [1,18]. Enhancement reflects the operationof an active detector which signals the appearance of behaviorally relevant stimuli, stored by persistentactivity during the delay period. Suppression, instead, reflects the operation of an automatic detectorwhich signals stimulus repetitions regardless of their behavioral relevance, and its functioning is assumedto be independent of persistent activity. Current mechanistic modeling fully embraces this notion ofparallel mechanisms (see, e.g., [19]). Match suppression, which is generally the most prominent effect, isunderstood as the result of activity-dependent fatigue, either at the single-cell or at the synaptic level,produced by the sample presentation. Match enhancement, on the other hand, is understood as the resultof selective inputs from a different area, or from a functionally different neuronal sub-population withinthe same area, carrying information about the stimulus actively held in memory.
In some cases, however, the reported experimental phenomenology does not appear to be fully consis-tent with the parallel mechanisms theory. In delayed paired-associate tasks, the response is conditionalon whether the test stimulus matches the pair-associate of the sample stimulus. No repetition occurs.According to the theory, only match enhancement (or no effect, depending on the identity of the teststimulus) should be observed. Experiments report both enhancement and suppression [11]. In delayedmatch-to-category tasks where stimuli also do no repeat within a trial, similarly both enhancement andsuppression are observed when the test matches the category of the sample [12]. In a recent study using adelayed cue-instructed go/nogo tasks with distractors, differential responses to neutral stimuli dependingon the cue stimulus have been reported [13]. The theory would rather predict no response modulation,since neutral stimuli have no behavioral relevance nor they repeat during the trial. Finally and impor-tantly, both match enhancement and selective delay-period activity (together with match suppression)have been observed in passive fixation tasks [14,20–24], where the theory would predict only match sup-pression. In fact, in such a task none of the stimuli has behavioral relevance and, thus, there is no needfor active repetition detection, let alone memory maintenance.
Here, we propose an alternative to the parallel mechanisms theory, where match enhancement andsuppression both result from a single mechanism: the modulation of network excitability brought aboutby the persistent activity. Information about the presented stimulus is stored across the delay period bya pattern of persistent activity in which, depending on the stimulus, some neurons increase their spikingrate while others decrease it. Changes in the spiking rate must be accompanied by changes in the neuron’sresponsiveness to inputs, whereby, upon presentation of a subsequent stimulus, more active neurons willbe more depolarized and thus more excitable, while less active neurons will be more hyperpolarized andthus less excitable [25] (Fig. 1A). Changes in single neuron’s responsiveness entail modifications of the
3
tuning properties of the network, which depend on the ongoing pattern of persistent activity. In ouraccount the differential stimulus-evoked activity depending on previously presented stimuli - i.e., thematch effects - is a result of those modifications. We show that the above described mechanism, whenimplemented in a spiking model network, can reproduce consistently and quite naturally, most of theexperimental phenomenology about match effects observed in short-term memory tasks, with no need forfatigue mechanisms nor functional differentiation among neurons.
Results
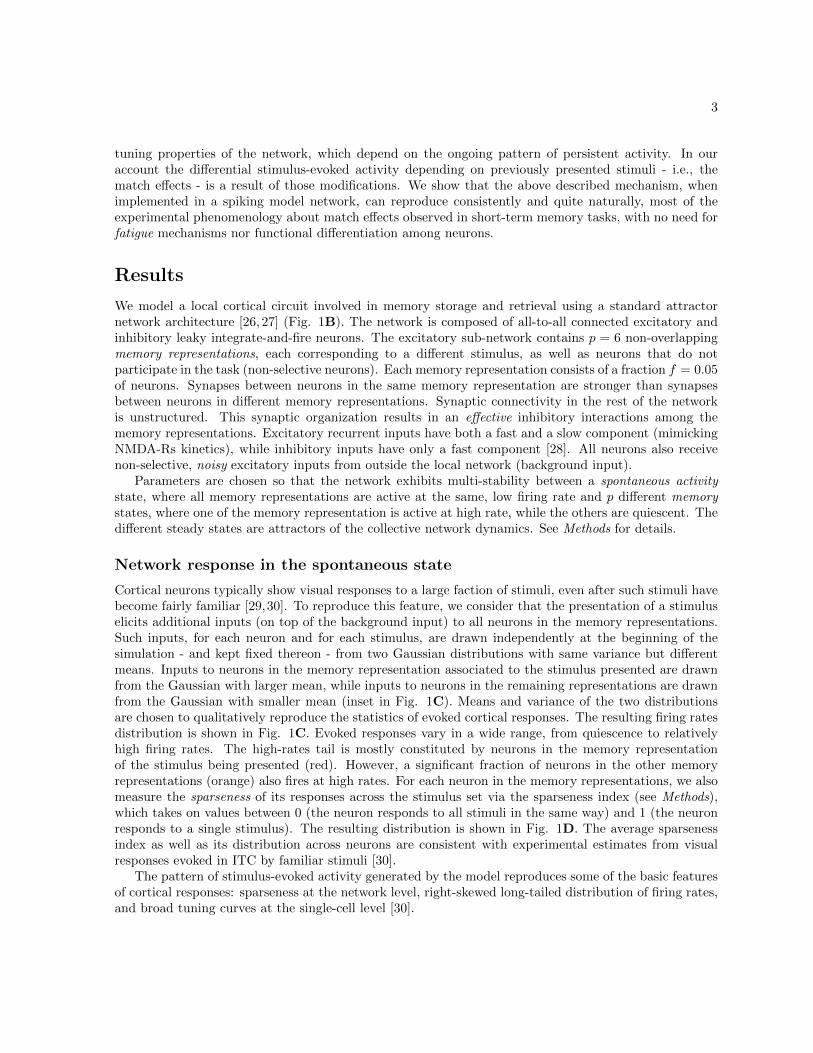
We model a local cortical circuit involved in memory storage and retrieval using a standard attractornetwork architecture [26, 27] (Fig. 1B). The network is composed of all-to-all connected excitatory andinhibitory leaky integrate-and-fire neurons. The excitatory sub-network contains p = 6 non-overlappingmemory representations, each corresponding to a different stimulus, as well as neurons that do notparticipate in the task (non-selective neurons). Each memory representation consists of a fraction f = 0.05of neurons. Synapses between neurons in the same memory representation are stronger than synapsesbetween neurons in different memory representations. Synaptic connectivity in the rest of the networkis unstructured. This synaptic organization results in an effective inhibitory interactions among thememory representations. Excitatory recurrent inputs have both a fast and a slow component (mimickingNMDA-Rs kinetics), while inhibitory inputs have only a fast component [28]. All neurons also receivenon-selective, noisy excitatory inputs from outside the local network (background input).
Parameters are chosen so that the network exhibits multi-stability between a spontaneous activitystate, where all memory representations are active at the same, low firing rate and p different memorystates, where one of the memory representation is active at high rate, while the others are quiescent. Thedifferent steady states are attractors of the collective network dynamics. See Methods for details.
Network response in the spontaneous state
Cortical neurons typically show visual responses to a large faction of stimuli, even after such stimuli havebecome fairly familiar [29,30]. To reproduce this feature, we consider that the presentation of a stimuluselicits additional inputs (on top of the background input) to all neurons in the memory representations.Such inputs, for each neuron and for each stimulus, are drawn independently at the beginning of thesimulation - and kept fixed thereon - from two Gaussian distributions with same variance but differentmeans. Inputs to neurons in the memory representation associated to the stimulus presented are drawnfrom the Gaussian with larger mean, while inputs to neurons in the remaining representations are drawnfrom the Gaussian with smaller mean (inset in Fig. 1C). Means and variance of the two distributionsare chosen to qualitatively reproduce the statistics of evoked cortical responses. The resulting firing ratesdistribution is shown in Fig. 1C. Evoked responses vary in a wide range, from quiescence to relativelyhigh firing rates. The high-rates tail is mostly constituted by neurons in the memory representationof the stimulus being presented (red). However, a significant fraction of neurons in the other memoryrepresentations (orange) also fires at high rates. For each neuron in the memory representations, we alsomeasure the sparseness of its responses across the stimulus set via the sparseness index (see Methods),which takes on values between 0 (the neuron responds to all stimuli in the same way) and 1 (the neuronresponds to a single stimulus). The resulting distribution is shown in Fig. 1D. The average sparsenessindex as well as its distribution across neurons are consistent with experimental estimates from visualresponses evoked in ITC by familiar stimuli [30].
The pattern of stimulus-evoked activity generated by the model reproduces some of the basic featuresof cortical responses: sparseness at the network level, right-skewed long-tailed distribution of firing rates,and broad tuning curves at the single-cell level [30].

4
B.A.“spontaneous” state
+ +
-
external inputac
tivity
external input
input from network
“memory” state + +
-
increased decreased
0 0.2 0.4 0.6 0.8 10
100
200
300
C.D.
P=1
P=2
P=3
Non-sel
P=3P=3
P=2
P=1
Inhib
S=0.79
Selectivity index
Neu
rons
cou
nt
firing rates (Hz)
current (in mV)
100
80
60
40
20
010 2015 25 30 35
Neu
rons
cou
nt
Figure 1. Modulation of tuning properties by network states and evoked-responseproperties in the spontaneous state. (A) The different network states - spontaneous (i.e., beforestimulus presentation) and memory (i.e., following stimulus offset) - are characterized by differentdistributions of recurrent inputs. In the spontaneous state, neurons in all memory representations arereceiving, on average, the same input and are thus firing at the same low, baseline rate (pink). In thememory state, neurons belonging to the memory representation associated with the presented stimulusreceive stronger recurrent inputs and thus fire at enhanced rates (red). The activity of neuronsbelonging to the other memory representations is reduced due to global inhibition (grey). High-firingneurons are more responsive to external inputs, due to increased recurrent inputs, and see theirtransient response enhanced upon subsequent stimulus presentations (red sigmoidal-like transferfunction). Low-firing neurons are less responsive to external inputs, due to reduced recurrent inputs,and see their transient response suppressed upon subsequent stimulus presentations (grey sigmoidal-liketransfer function). (B) Network architecture. (C) Distribution of firing rates upon stimuluspresentation in the spontaneous state. Neurons in the memory representation associated with thepresented stimulus are shown in red; neurons in the other memory representations are shown in orange.The overlap between the two distributions is labelled in dark red. The inset shows the correspondingdistributions of the additional inputs, whose means are indicated by the two arrows. (D) Histogram ofthe sparseness indices in the spontaneous state.
Next, we study how the features of stimulus-evoked activity are modified when the network is in amemory state.
Network response to repeating stimuli
We consider the case in which the active memory representation is the one associated with the incomingstimulus. This corresponds to a match trial in the DMS task. Accordingly, we present the same stimulustwice, with the two presentations separated by a delay period. The first presentation strongly activatesthe corresponding memory representations (black, Fig. 2A) and, to a lesser extent, all the other repre-sentations (red, Fig. 2A) due to the broad selectivity of the evoked responses. At stimulus offset, the

5
memory representation activated by the stimulus remains active at high rates, while the others becomequiescent due to the increased level of inhibition (blue, Fig. 2A). Such re-organization of the spikingactivity following stimulus presentation is due to a (self-sustained) change in the distribution of the re-current inputs in the network. Neurons in the active representation receive increased inputs as a resultof the positive feedback via the strengthened recurrent synapses. The other neurons receive decreasedinputs as a result of the negative feedback due to global inhibition. As a consequence, neurons in theactive/inactive representation have a higher/smaller response to stimulus repetition (Fig. 2A). Althoughthe basic features of stimulus-evoked activity in the spontaneous state are qualitatively preserved in thememory state, significant quantitative changes occur. In Fig 2B we plot the response to the first presen-tation (sample) vs. the second presentation (match) for the neurons in the active (black) and inactive(red) memory representations. All neurons in the active representation show enhanced responses to thesecond presentation, although to a different extent. Neurons that show the largest relative increase arethose that had moderate responses upon sample presentation. Neurons in the inactive representationsalso show a wide range of suppressed responses to the second presentation. Neurons with weak responsesupon sample presentation (i.e. a significant fraction of the responsive neurons – see Fig. 1C) show noresponse at all or very strong suppression upon match presentation. Neurons with moderate-to-strongresponses show modest levels of suppression or no suppression at all. The memory-dependent modulationof single-neuron responsiveness entails a strong increase in the selectivity of the responses evoked by thesecond presentation (compare the distributions of the sparseness index in Fig. 2C and Fig. 1D). In ourmodel, the best stimulus for a neuron is typically the one for which the neuron exhibits mnemonic activityso that, upon repetition of that stimulus, its response significantly increases. For a different stimulus theneuron does not exhibit mnemonic activity and thus, upon repetition, its response is suppressed. This isclearly seen in Fig. 2D where we show four single-neuron tuning curves. Stimuli are ranked from bestto worst according to the evoked response at sample presentation, i.e. when the network is in the spon-taneous state (in black). Upon repetition, i.e. when the network is in the corresponding memory state,the response to the best stimulus increases significantly, while those to the the other stimuli decrease (inred). Note the amount of sharpening as quantified by the sparseness indices.
Network response to non-repeating stimuli
We consider the case in which the incoming stimulus is associated with a memory representation differentfrom the one currently active. This corresponds to a non-match trial in the DMS task. Accordingly, wepresent two different stimuli separated by a delay period. This case requires the consideration of threedifferent neuronal sub-populations: neurons belonging to the active representation, neurons belonging tothe representation associated to the incoming stimulus, and neurons in the remaining representations. Thetime course of the average activity in these sub-populations (together with the inhibitory population - blueline) is shown in Fig. 3A. The presentation of the first stimulus (sample) activates the correspondingmemory representation (green), which then stays active during the delay period much as before (Fig.2A). The presentation of the second stimulus (non-match) evokes a strong response in the correspondingmemory representation (black), which eventually shuts down the mnemonic activity related to the firststimulus. The response to the second stimulus is, however, smaller than the response to the first stimulusdue to the increased level of inhibition when the network is in a memory state. The neurons not belongingto the active representation nor to the one associated with the non-match exhibit suppressed responsesto the second presentation (red). This can be also seen in the distribution of red dots in the scatterplot in Fig. 3B. Interestingly, neurons in the representation active during the first delay (green dots)give a strong, transient response to the second stimulus, which is typically larger than the responseevoked by the presentation of the associated stimulus (i.e., the sample). During the second presentation,these neurons receive additional inputs which, although smaller than the ones received by neurons inthe representation of the stimulus currently presented (black dots), elicit a strong response, due to theincreased responsiveness brought about by persistent activity. These additional inputs are statistically

6
0 0.5 1 1.5 2 2.5 3 3.5 40
10
20
30
40
50
60
70
80
90
Firin
g ra
tes (
Hz)
Firing rates Sample (Hz)
B. C.
0 0.2 0.4 0.6 0.8 10
100
200
300
020406080
020406080
S=0.90
020406080
020406080
Stimulus rank
S=0.48 S=0.67 S=0.30 S=0.25S=0.74 S=0.82 S=0.70 S=0.47
Firin
g ra
tes (
Hz)
Selectivity index
Firin
g ra
tes M
atch
(Hz)
time (s)
A.
50403020100 600
20
40
60
80
0
20
40
60
80
0 1 2 3 4
D.
Neu
rons
cou
ntFigure 2. Network response to repeating stimuli (match trial). (A) Average activity level inthe memory representation associated with the presented stimulus (black), in the other representations(red) and in the inhibitory sub-network (blue). Presentation periods are indicated by the thickhorizontal black lines. (B) Scatter plot of average single-neuron responses to the first and the secondpresentation. Responses are calculated by counting the number of spikes during the first 200ms ofstimulus presentation. Color code as in (A). (C) Histogram of the selectivity indices of the responses tothe second presentation upon repeating stimuli. (D) Sample single-neuron tuning curves to the first(black) and to the second presentation (red). Stimuli are ranked from best to worst according to theresponses to the first presentation (sample).
the same as the inputs to all the remaining representations, nevertheless, they elicit dramatically differentresponses (compare green and red dots in Fig. 3B). This most clearly illustrates the importance of thecurrent network state in determining the responses to incoming stimulation.
In Fig. 3C we report the distribution of the sparseness index measured by taking out the stimu-lus whose memory representation is active during the delay period. The distribution is bimodal as aconsequence of the increased responsiveness of neurons in the active representation, which transientlyrespond to all stimuli, inducing a loss of selectivity. On the other hand, the selectivity of the neuronsnot belonging to the active representation is sharpened as a result of the suppression of weak/moderateresponses. Such differential changes in selectivity is clearly shown in the two sets of tuning curves in Fig.3D.
Match-Non Match effects
In line with the analysis commonly performed on neurophysiological data, we average neuronal responses,across all neurons and all stimuli, conditional on whether responses are collected in match or non-matchtrials (e.g. [8, 9, 24]). In Fig. 4A we plot the average activity across memory representations vs. timein match and non-match trials. Consistently with recordings in ITC and PFC [8, 11], we find an overallsuppression effect: the network response is weaker in match than in non-match condition. However,the scatter plot in Fig. 4C shows that while the largest proportion of cells have a stronger response tonon-match than to match (red dots below the diagonal), there are fewer cells (black dots) which showthe opposite effect [8, 9, 11, 24, 31]. Interestingly, in our model, cells which show match suppression with

7
0
20
40
60
80
0
20
40
60
80
0
10
20
30
0
10
20
30
S=0.42S=0.01
S=0.75S=0.002
S=0.36S=0.52
S=0.61S=0.97
0 0.2 0.4 0.6 0.8 10
100
200
300
Firin
g ra
tes N
on M
atch
(Hz)
Firing rates Sample (Hz)
Stimulus rank
0
20
40
60
80
0
20
40
60
80
0 1 2 3 4time (s)
0 20 40 60 80
S=0.73
A.
B.C.
D.
Firin
g ra
tes (
Hz)
Selectivity index
Neu
rons
cou
nt
Firin
g ra
tes (
Hz)
Figure 3. Network response to non-repeating stimuli (non-match trial). (A) Average activitylevel in the memory representation associated with the first stimulus (green), with the second stimulus(black), in the other representations (red) and in the inhibitory sub-network (blue). Presentationperiods are indicated by the thick horizontal black lines. (B) Scatter plot of average single-neuronresponses to the first and the second presentation. Responses are calculated by counting the number ofspikes during the first 200ms of stimulus presentation. Color code as in (A). (C) Histogram of theselectivity indices of the responses to the second presentation upon non-repeating stimuli. (D)Single-neuron tuning curves to the first (black) and to the second presentation for neurons in the activerepresentation (green) and in the non-active representations (red). Stimuli are ranked from best toworst according to the responses to the first presentation (sample).
respect to sample also show a match response lower than the non-match, while cells which show matchenhancement with respect to sample also show a match response larger than the non-match.
The difference in the response to matching and non-matching stimuli is a result of transient changesin network excitability brought about by the persistent activity. The duration of the transient is mainlycontrolled by XE , the fraction of slow, NMDA-like recurrent excitatory currents (see also Section De-pendence on persistent activity, response selectivity and current dynamics). To illustrate this dependencewe plot, in Fig. 4B, the average match and non-match responses for three different fractions of slowcurrents, for a presentation time of 2 seconds. The difference in the responses to match and non-matchdecays after a time that is proportional to the fraction of slow excitatory currents. Nevertheless, the tworesponses are still distinguishable after 1 second even for XE = 0.3. This time interval is significantlylonger than the typical presentation times used in experiments, which rarely exceed 500ms.
It has been shown that, for a significant fraction of neurons, tuning curves differ in match and non-match conditions (e.g. [24]). Consistently, we find that the response of most neurons when the stimulusis a match differs from their response when the same stimulus is a non-match. The vast majority ofneurons in our simulation exhibits mixed effects, that is they show match larger than non-match responsefor some stimuli, and the opposite behavior for other stimuli (Fig. 4D). In the experiments a significantfraction of cells shows non-mixed effects, i.e.match larger than non-match response or viceversa [8,11,24].The dominance of mixed cells in our simulation is due to the fact that (i) all neurons in the sample wemonitor have sharply-tuned persistent activity (i.e. they exhibit persistent activity for a single stimulus);

8
and (ii) the set of stimuli we use to probe them is optimal, in the sense that for each neuron there is astimulus that elicits persistent activity in that neuron. These conditions are likely not to be fulfilled ina real experiment. For instance, recordings from a cell showing persistent activity for all stimuli (whichare, typically, not a large number) would result in tuning curves similar to the ones showed in the firsttwo sub-plots in Fig. 3D. Similarly, recordings from a cell showing visual responses but never persistentactivity would result in tuning curves similar to the ones showed in the second two sub-plots in Fig.3D. In general, we would expect the number of mixed cells observed in experiments to increase with thenumber of stimuli used.
Protocols with intervening stimuli
We ask next whether the basic mechanism illustrated above is also able to account for the patterns ofneural responses observed in DMS tasks in which other stimuli (distractors) are presented in between thesample and the test stimulus. In one of such protocols, the so-called ABBA protocol [9,18], the behavioralresponse is conditional upon the repetition of the sample stimulus (A) while the repetition of the distractor(B) has to be ignored. In this case, cells were found that showed an enhanced response to the repetitionof A - the behaviorally relevant match - while they showed suppressed responses (as compared to thematch response) for the repeating distractor B. At the same time, cells exhibiting match suppressionshowed larger responses (as compared to the match response) for the repeating distractor [9, 18]. It isworth pointing out that the parallel mechanisms hypothesis was formulated in order to account for theseexperimental observations, in particular for the observation that match enhancement was apparent onlyupon the repetition of the behaviorally-relevant stimulus [18].
Our model is able to reproduce the experimental findings described above in a regime where themnemonic representation activated by the sample stimulus survives the presentation of a distractor withhigh probability, but is occasionnally disrupted by it. This regime can be obtained by reducing theamplitude of the external inputs during stimulus presentation [32] (see Methods for details). Figure5A shows the neural activity in the mnemonic representation associated to the sample stimulus (leftpanel) and in the remaining representations (right panel). The presentation of the sample activates thecorresponding mnemonic representation but also, to a smaller extent, other representations (see Fig. 2).The subsequent presentation of a distractor fails to abolish the mnemonic activity related to the sample(unlike in Fig. 3), although it evokes responses in both the active and the inactive representations.
We then proceed as in the experiment [9, 18]. For each stimulus presented as a sample, we separatethe neurons which show enhancement upon repetition (i.e., the ones in the corresponding mnemonicrepresentation) from the neurons which show suppression (i.e., the ones in the remaining representations).Next, we average the activity in these neuronal populations across all trials (with distractors) where thecorresponding stimulus is presented as match, non-match and repeated non-match. The results of thisanalysis are shown in Fig. 5B. As can be seen, neurons eventually showing match enhancement exhibitsuppressed responses, as compared to the match response, to repeating distractor presentations (leftpanel). Similarly, neurons eventually showing match suppression exhibit enhanced responses, again ascompared to the match response, to repeating distractor presentations.
Another common observation in protocols with distractors is that suppression wanes with increasingnumber of distractors [8]. This finding can also be replicated in the regime where persistent activitysurvives distractor presentation most of the time, but is occasionally disrupted by it. The amplitudeof the population-averaged response depends on whether the mnemonic representation active upon testpresentation is the one corresponding to the sample. In particular, if the persistent activity survives thepresentation of the distractors, significant suppression will be observed in the majority of cells upon testpresentation (see Match-Non Match effects). On the other hand, if the persistent activity is disruptedby the distractor presentation, the fraction of cells exhibiting match suppression will be smaller. Theprobability that the mnemonic representation associated to the sample is still active upon test presentation

9
0 0.5 1 1.5 2 2.5 3 3.5 40
5
10
15
20
25
0
20
40
60
80 S=0.74S=0.22
02040
60
80 S=0.47S=0.27
Stimulus rank
Firin
g ra
tes (
Hz)
Firin
g ra
tes M
atch
(Hz)
Firing rates Non Match (Hz)00 20 40 60 80
20
40
60
80
Firin
g ra
tes (
Hz)
0
5
10
15
20
25
0 1 2 3 4time (s)
A.
C. D.
Match Non Match
2 3 4 5 66
10141822
6
10141822
2 3 4 5 6
2 3 4 5 66
10141822
XE=0.7
XE=0.5
XE=0.3
B.
Figure 4. Match vs non-match effects. (A) Average activity in the memory representations duringmatch and non-match trials. (B) Average activity in the memory representations for a longermatch/non-match presentation time (2s) and for three different values of the fraction of slow recurrentinputs XE . Note that the top panel in B and panel A differ only in the presentation time and in thenumber of trials run -20 trials for each protocol in the former, a single exemplary trial for each protocolin the latter. (C) Scatter plot of average single-neuron responses to match and non-match presentation.Responses are calculated by counting the number of spikes during the first 200ms of stimuluspresentation. Color code as in fig.2B. (D) Sample single-neurons tuning curves in match (red) andnon-match (green) conditions.

10
is a decreasing function of the number of distractors. In Fig. 6 we plot the average response of cellsexhibiting match suppression (i.e. belonging to the mnemonic representations inactive following samplepresentation) as a function of the number of intervening distractors. As can be seen, the response inmatch and non-match trials becomes more similar, i.e. the level of suppression decreases with increasingnumber of distractors. The same parameter regime can reproduce “standard” match, non-match effects,i.e. when no distractors intervene between sample and match or non-match (“0 distractors” in Fig. 6).Hence, importantly, in our model a unique set of parameters can account for standard match non matchprotocols, as well as for protocols with intervening stimuli.
0
5
10
15
0
26
52
Firin
g ra
tes (
Hz)
S MRNMNMS MRNMNM
0 2 4 6 8 100
20
40
60
80
Firin
g ra
tes (
Hz)
0 2 4 6 8 100
4
8
12
time (s)
Enhancement Suppression
A.
B.
Figure 5. Protocol with repeating distractors. (A) Average activity level in the memoryrepresentation associated with the sample stimulus (left panel) and in the other representations (rightpanel). Presentation periods are indicated by the thick horizontal lines: the black lines indicate thesample and the match, while the gray lines indicate the non-match and the repeated non-match i.e.repeating distractors. (B) Average response of neural population showing match enhancement (leftpanel) and match suppression (right panel) for a given stimulus when it is presented as sample, match,non match and repeated non-match (see main text for details). The amplitude of the external inputsare chosen so that the persistent activity elicited by the sample is rarely disrupted by the distractorpresentation. We run 20 trials for each stimulus configuration. The error bars indicate the s.e.m.
Dependence on persistent activity, response selectivity and current dynamics
We analyze systematically how match effects depend on persistent activity (PA), selectivity of the visualresponses, and currents dynamics via both a simplified rate dynamics (SRD -that converges to thestationary states described by mean field equations; see Methods) and the spiking network dynamics(SND).
First, we study the dependence of match effects on the level of PA by manipulating the synapticstrength between neurons in the same memory representations (J+), keeping all the other parametersfixed. To quantify match effects we use the enhancement (suppression) index, defined as the ratio between

11
0
5
10
15
20
0 1 2
Non-Match
Match
Firingrates(Hz)
Figure 6. Protocol with non-repeating distractors. Match and non-match responses averagedover the populations of cells exhibiting match suppression as a function of the number of interveningstimuli, i.e. non-repeating distractors. As in Fig. 5, the amplitude of the external inputs are chosen sothat the persistent activity elicited by the sample is rarely disrupted by the distractor presentation. Werun 20 trials for each protocol. The error bars indicate the s.e.m.
match (M) and sample (S) response in the active (inactive) memory representation and the match-nonmatch index, defined as the ratio between M and non-match (NM) response in a memory representation.We find that match effects increase with increasing levels of PA (Figs. 7A-B). Neurons in the activememory representation show larger responses to M than to S, as well as larger responses to M than toNM (black and blue line in Fig. 7B). The amplitude of both suppression and enhancement increaseswith increasing J+ due to the concomitant increase of the level of PA (increasing responsiveness inthe active representation) and the level of global inhibition (decreasing responsiveness in the inactiverepresentations). In the absence of PA, all indices are equal to one, i.e. there is no modulation ofresponse. The simplified rate dynamics (SRD-full lines) give results that are very close to the spikingneurons dynamics (SND-dashed lines).
Next, we study the dependence of match effects on the selectivity of the visual responses by manipu-lating the difference (α) between the average additional input to the memory representations associatedto the stimulus presented (α + β) and the average additional input to the other representations (β);all other parameters are kept fixed. We find that match effects are quantitatively more important forlow/moderate levels of selectivity, but are nevertheless preserved for strongly selective responses. Forα close to zero, the response to stimulus presentation is not selective enough to allow the network toactivate the corresponding memory representation. In this regime, all indices calculated via the SRD areequal to one (full lines in Fig. 7C). For moderate α (0.1 mV < α < 0.8 mV), the network is able toactivate the memory representation associated with the presented stimulus and, moreover, PA survivesthe presentation of a NM . As a result enhancement effects are quite strong (compare the blue/blackwith the red/green curves). In the SND, instead, the stimulus presentation could stochastically activateany of the memory representations, thus yielding high fluctuations on the indices (dashed lines in Fig.7C) and low agreement with SRD. For larger α, PA is disrupted by the presentation of a NM , andenhancement and suppression effects become more comparable. Note that the range of α for which PA

12
survives the presentation of the NM increases with increasing J+.In our model, match effects result from modifications of the transient network response following
stimulus presentation. Accordingly, decreasing the fraction of recurrent inputs with slow dynamics, andthus speeding up transients, reduces both suppression and enhancement effects (Fig. 7D). Nevertheless,even for relatively small fractions of slow recurrent inputs, match effects are still significant when theresponses are averaged over the entire duration of stimulus presentation (i.e., 500ms - right panel in Fig.7D). This is consistent with experiments showing that match effects are mostly evident during the earlyresponse phase [33].
A.
B.
C.
D.
Firin
g ra
tes (
Hz)
0
20
40
60
80
0
4
1
3
2
J+(mV)0.13 0.14 0.15 0.16 0.17
M/SM/SM/NMM/NM
0
6
2
8
4
0 0.5 1 1.5 2 2.5 3α(mV)
10
12
0 0.2 0.4 0.6
1
2
0 0.2
1
1.6
fraction of slow recurrent inputs (XE)
200ms 500ms
5
3
0.8
0.2 0.4 0.6 0.8
0.6
0
Figure 7. Dependence of match effects on level of persistent activity, selectivity of theresponses and current dynamics. (A) Persistent activity (red) and inhibitory activity (blue) as afunction of J+. Note for J+ below a given value the network is unable to sustain persistent activity.The dotted branch of both curves represents unstable solutions. (B) Match effects indices as a functionof J+ calculated with SRD (full lines) and SND (dashed lines). Match effects quantitatively increasewith increasing J+, that is with increasing levels of persistent activity. (C) Match effect indices vs α.Match effects are quantitatively more important at low/moderate selectivity levels. (D) Match effectsindices with SRD (full lines) and SND (dashed lines) vs the fraction of slow recurrent inputs(modulated by NMDA-Rs). On the left, indices are calculated by averaging the response over the first200ms of stimulus presentation; on the right the response is calculated over 500ms, i.e. the entirestimulus duration. See main text for details.
Effects of heterogeneity in neuronal responses
We have focused so far on a regime in which the sensory and the mnemonic representations of a stimulusare highly correlated. The best stimulus for a neuron is typically the one for which it exhibits persistentactivity during the delay period and, therefore, it is also the one which elicits the highest response uponmatch presentation. Thus, strong responses during the sample presentation will typically be enhanced inthe match condition, while poor responses will be suppressed. In this regime, active mnemonic represen-tations lead to a significant sharpening of the associated sensory representations upon stimulus repetition,as we have shown. This could be the relevant scenario for sensory-related areas. In higher order areas(e.g., the pre-frontal cortex), however, sensory and mnemonic representations appear to be less correlated.As frequently observed in the data, neurons which show strong selectivity during stimulus presentation

13
do not necessarily show strong selectivity during the delay period. Vice-versa, some neurons have beenshown to exhibit weakly selective response, or no response at all during stimulus presentation while devel-oping strong selectivity during the delay period (see, e.g., [9] for a comparison between stimulus-evokedand delay activity in the inferotemporal and prefrontal cortices).
To investigate the effects of reduced correlation between sensory and mnemonic representations, wemanipulated neural response heterogeneity upon stimulus presentation by increasing the variance ofthe external inputs (σs - see Methods for details). As σs increases, the distribution of inputs to theneurons in the mnemonic representation corresponding to the stimulus being presented becomes moreand more similar to the distribution of inputs to the other representations and consequently, the neuralresponses in these two sets also become similar. As a result, selectivity of neural responses during samplepresentation decreases. To quantify the effects of increased variance in the external inputs, we computedfor each neuron in the mnemonic representations the correlation (Pearson correlation coefficient) betweenstimulus-evoked and delay activity across the set of stimuli. The correlation averaged across all neurons inthe mnemonic representations is reported in left panel Fig. 8 (black curve). Increasing the variance of theexternal inputs, steadily and significantly, reduces the correlation between the pattern of activity elicitedby the sample and the subsequent pattern of persistent delay activity. This is due to the reduction of theproportion of neurons exhibiting both strong stimulus response and enhanced delay activity. For purposeof illustration, we also show in the right panel of Fig. 8 the tuning curves during sample presentation anddelay period for four neurons. As can be seen, both neurons which share the same stimulus preferenceduring sample and delay, and neurons which do not can be found.
Note that increasing the variance of the external inputs has a significantly weaker effect on thecorrelation between the pattern of activity during the delay period and the pattern of activity elicitedupon match presentation (left panel of Fig. 8 - red curve). Neurons exhibiting high(low) levels of delayactivity will also tend to exhibit strong(poor) responses to match presentation, regardless of the extent oftheir response at sample. Thus, match effects are largely preserved in the presence of strong heterogeneityin neuronal responses.
Discussion
In the context of short-term memory tasks which involve the comparison of two subsequent stimuli,e.g. a DMS task, persistent delay activity has often been interpreted as the neural correlate of memorymaintenance of the first stimulus. However, maintenance by itself leaves unanswered the question of howthe information which is actively being held is retrieved and compared with the stimulus that comesnext. We have shown that changes in the spiking rate, as a result of encoding and storage, are naturallyaccompanied by changes in the neuron’s responsiveness to inputs. The basic mechanism - neurons inhigh firing states are more responsive than neurons in low firing states - is entirely consistent with bothin vitro and in vivo experiments that compared the response of neurons in UP and DOWN states [25,34].In turn, the memory-dependent modifications of the network tuning properties entailed by those changesin single-cell responsiveness parsimoniously account for the experimental phenomenology of match effectsexposed by single-cell recordings, as we have shown by theoretical analysis and numerical simulations.Accordingly, our results suggest that persistent activity, along with memory maintenance, might subservethe complementary purpose of endowing responses to stimuli with a history dependence, by filtering outthe information which is not consistent with the current state of the network.
Comparison with experimental data and predictions
By mechanistically linking persistent activity and match effects, our model explains naturally why thelatter are observed in the same cortical regions where the former is present (e.g. in ITC: [8, 33, 35–38];in PPC: [39–41]; in PFC: [9, 11, 17, 24]). Upon stimulus repetition, we find that suppression effects

14
σs
Cor
rela
tion
Coe
ffic
ient
delay and sampledelay and match
0
20
40
60
0
20
40
0
20
40
60
0
20
40
60
Firin
g ra
tes (
Hz)
Stimulus rank(mV)
1 2 3 4 5
0.4
0.6
0.8
1
Figure 8. Response heterogeneity. Left panel: Correlation coefficient between the activityaveraged across all memory representations during sample and delay (black curve) and during matchand delay (red curve) as a function of the variance of the input currents. Right panel: examples of fourcells tuning curves at sample -in black- and delay -in magenta- for σs = 4 mV. Stimuli are ranked frombest to worst according to the responses to the sample.
are dominant, involving 80% of cell/stimulus combinations. This is due to two factors: (i) cells havebroad selectivity properties during visual response, i.e. they respond to most of the presented stimuli;(ii) delay period activity is sparse, i.e. it involves only a small fraction of the excitatory cells of thenetwork. Both features are consistent with neurophysiological recordings in areas of the temporal andfrontal lobe. It has been reported that some cells show complete adaptation, i.e. essentially no responseto stimulus repetition, despite vigorous response to novel stimuli [42]. Accordingly, we find cells which,although active at sample, stop firing during match presentation (fig. 3B). In these cells, as in most of theselective cells in our network, the presentation of a new stimulus elicits a response (fig. 2B), consistentwith the observation that cells that show a modulation of response following stimulus repetition areusually broadly tuned [8, 42].
The model predicts that (i) for a given stimulus, (early) single-cell responses should be positivelycorrelated with the level of delay period activity preceding the test presentation; (ii) the proportion ofcells showing match enhancement increases with the proportion of cells showing persistent activity, andthe higher the level of persistent activity the larger the amplitude of the enhancement effect. This isconsistent with comparisons between IT and PF cortex: enhancement effects are stronger, in proportionof cells involved and in amplitude, in PFC than in ITC, consistent with the fact that the proportionof cells showing persistent activity during the delay period is larger in PFC [9, 11, 12]. Similarly, bothpersistent activity and match effects increased significantly after training with a DMS task, althoughboth were found also in naive animals [24]; (iii) repetition produces (transiently) a sparser representationof the stimuli. This is due to the fact that the pattern of persistent activity modifies the transientresponse to repeated stimuli by enhancing the response of the neurons most active during the delayperiod while suppressing the response of the other - less active - neurons. In a regime where sensory andmnemonic representations are highly correlated, our scenario therefore provides a mechanistic account forthe sharpening model [1, 5, 6, 42–45], according to which some but not all neurons that initially respond

15
to a stimulus, show suppression to the repetition of that stimulus, and, most importantly, suppression isstronger for the non preferred stimuli, i.e. neurons showing little or no suppression to a repeated stimulusare highly selective for it. Note that such a mechanism, in which persistent activity acts as a ’matchingfilter’ that transiently sharpens the response to the test if it matches the sample, could also potentiallyaccount for priming phenomena [46]. When increasing the heterogeneity of the evoked responses, andthus decreasing the correlation between sensory and mnemonic representations, the model also accountsfor cells showing suppression instead of enhancement upon repetition of their preferred stimulus (see,e.g., [37]), whose tuning curves would look like those shown in Fig. 8.
Miller et al. [8, 9, 18] used protocols with distractors, and found that (i) enhancement is observed forbehaviorally relevant matches, but not for repeating distractors; (ii) both suppression and enhancementeffects are still present after a few distractors are presented, but decay progressively with the numberof distractors. Our model can reproduce these data in a stochastic scenario in which in most cases thedistractors do not perturb the active mnemonic representation, but with some non-zero probability erasethe memory from the system. This scenario is fully consistent with both the behavioral [8] and theelectrophysiological data in PFC indicating resistance to distractors [9]. Electrophysiological evidence forresistance to distractors in ITC is more mixed (e.g., [9]), though we note some degree of resistance todistractors has been found both in ITC (see, e.g., [37, 47]) and in the entorhinal and perirhinal cortices[10,48].
Going one step forward, the model predicts that any manipulation (e.g., pharmacological) affect-ing persistent activity should also have significant impact on match effects. Weakening or destroyingpersistent activity is expected to severely diminish the amplitude of match effects or abolishing themaltogether. For example, it has been shown that the enhancement of the GABA-ergic neurotransmittersystem, e.g. via benzodiazepines, slows down working memory processes [49, 50] and impedes repetitionsuppression [51]. Alternatively, boosting persistent activity by reducing the inhibitory feedback [52] isexpected to significantly reduce suppression effects, while increasing enhancement effects both in theproportion of cells exhibiting them and in their amplitude at the single-cell level.
Comparison with other models
The simplest model for match suppression is some form of adaptation (either firing-rate adaptation,or synaptic short-term depression) on sufficiently long time scales [53]. Match enhancement could beaccounted for by a separate population of pyramidal cells having predominantly facilitating synapses, asfound in PFC [54]. These purely passive mechanisms are however hard to reconcile with evidence thatinter-trial intervals erase match effects, as reported by [8]. Our model would be consistent with the factthat inter-trial intervals erase these effects, provided persistent activity is switched off during inter-trialintervals (but see [55]). Note that introducing adaptation and/or short-term synaptic plasticity in ourframework would not alter qualitatively the conclusions. Adaptation and short-term depression wouldtend to decrease quantitatively both enhancement and suppression effects, while short-term facilitationwould tend to increase these effects.
A combination of passive and active mechanisms - inspired by the parallel mechanisms theory - hasbeen implemented in a recent study by [19], through a network composed of two separate neural popu-lations (one exhibiting enhancement, the other suppression), receiving top-down inputs from a workingmemory area. The model was shown to be able to reproduce part of the experimental phenomenologyreported in [8,9,18], but leaves aside a rather critical issue: by assuming two separate sets of cells showingeither match enhancement or suppression, the model cannot account for the experimental observation ofmixed cells, which show both enhancement and suppression depending on the stimulus presented [24].We note that, albeit the underlying mechanism is different, the patterns of neuronal activity producedby our model are the same as the ones produced by the Engel and Wang model [19]. Their learningcircuit would hence be effective also in our network, providing a biologically realistic read-out mecha-nism. Another class of models for match effects relies on synaptic modifications induced by stimulus

16
presentations [56, 57]. These mechanisms are not mutually exclusive, and might cooperate to generatestrong match signals.
As our main goal in this work was to show that changes in excitability brought about by persistentactivity were a viable mechanism for match effects, we have chosen the simplest possible spiking neuronmodel able to maintain patterns of persistent activity thanks to increased synaptic strength betweenpopulations of neurons [26]. In such a model, firing rates in persistent activity are too high and homoge-neous, spiking irregularity too low, and the proportion of neurons showing match effects somewhat largeras compared with the experimental data, unless additional features such as short-term plasticity are added(e.g., [58, 59]). We do not expect these additional features to change qualitatively the picture describedin this paper, rather we expect them to bring model behavior quantitatively closer to experimental data(see Effects of heterogeneity in neuronal responses).
We note that the general scenario presented above would still hold if attractors are stabilized by othermechanisms (e.g., [60–62]) provided enhanced activity entails increased single-neuron excitability.
Conclusions
The theory we have presented demonstrates a new functional role for persistent activity beyond temporarymemory storage. Our results show how persistent activity can be instrumental in the retrieval of the storedinformation and, potentially, in the context-dependent encoding of incoming information (see, e.g., [13]).In our implementation, persistent activity is the result of the network possessing multiple steady statesof activity (attractors) each manifested by elevated firing rates in stimulus-selective sub-populations ofneurons [26, 27]. The fact that the network is in such an attractor modifies the transient response toincoming stimuli; such response could then be exploited by a readout network, which could easily solveany task involving comparisons of sample and match/non-match stimuli. This general scenario wouldstill hold if attractors are stabilized by other mechanisms [60, 61]. Our results also lay the groundworkfor uncovering physiological/mechanistic substrates common to different types of mnemonic processing,by suggesting specific neuronal signatures of memory retrieval and possible underlying mechanisms.
Methods
Spiking neurons network
In the following we describe the full spiking neuron network simulation used for the results reported inthe main text. The behaviour of a single excitatory or inhibitory neuron in the network can be described(below firing threshold) by the dynamics of its membrane potential, which obeys
τE,I˙Vi(t) = −Vi(t) + Ii(t) (1)
with i = 1 . . . N , where N = NE+NI is the total number of neurons in the network, τE,I is the integrationtime constant of the membrane potential for excitatory and inhibitory neurons, and Ii (in mV) is thetotal current impinging on the (post-synaptic) neuron. When the membrane potential reaches the firingthreshold θ, upon integration of the incoming current, then a spike is emitted, the membrane potentialis reset to a value VR and the neuron remains refractory for a time τarp.
The total current arriving to a postsynaptic neuron is due to the activity of its local (pre-synaptic)afferents and to the current elicits by external afferents, e.g. neurons in neighboring cortical areas, namely
Ii(t) = Iexti (t) + Ireci (t) (2)
where Iexti (t) is the external input current and Ireci (t) is the recurrent current. The recurrent contributionto the post-synaptic current comes from local (pre-synaptic) afferents and its mediated by NMDA, AMPA

17
and GABA receptors, so thatIreci (t) = INi (t) + IAi (t)− IGi (t) (3)
where each of the currents follows its own temporal dynamics:
τN INi (t) = −INi +XE,IτE,I
∑j
Jij∑k
δ(t− tk) (4)
τAIAi (t) = −IAi + (1−XE,I)τE,I
∑j
Jij∑k
δ(t− tk) (5)
τGIGi (t) = −IGi + τE,I
∑j
Jij∑k
δ(t− tk) (6)
where XE,I is the fraction of the charge coming from excitatory afferents which is mediated by NMDAreceptors and elicits a slower current dynamics on the post synaptic neuron. The remaining fraction ofthe charge (1 −XE,I) is mediated by AMPA receptors and elicits a faster current. The current comingfrom inhibitory afferents is mediated by GABA receptors. Upon arrival of a pre-synaptic spike at timetk, the postsynaptic current instantaneously receives a “kick” proportional to the synaptic efficiency J(in mV), followed by an exponential decay with time constant τsyn, where τsyn = τA,N,G.
In a regime of spontaneous activity, i.e. when no external stimulus is presented to the network,
Iexti (t) = µexti + σext
√τηi(t) (7)
where µexti is the value of the external current extracted for each neuron from a Gaussian distribution
with mean µextE and µext
I , respectively for excitatory and inhibitory neurons, and variance σ2BG (quenched
noise) while ηi(t) is a white noise process with < ηi(t) >= 0 and < ηi(t)ηj(t′) >= δijδ(t−t′) uncorrelated
from neuron to neuron and σext is the amplitude of the temporal fluctuations around µexti (fast noise).
Upon presentation of a stimulus each neuron belonging to the selective populations (i.e. the memoryrepresentations) receives an external current given by:
Iexti (t) = µstimi + σext
√τηi(t) (8)
whereµstimi = µext
i + µseli (9)
if i belongs to the selective foreground, the current elicited by the stimulus on each neuron, µseli , is drawn
from a Gaussian distribution with mean α + β and variance σ2S ; if i belongs to the selective background
instead:
µstimi = µext
i + µseli (10)
where µseli is drawn from a Gaussian distribution with mean β and variance σ2
S . Those distributions arequenched, so that the presentation of a given stimulus elicits always the same current in a given selectiveneuron.The Equations for the membrane potential (Equation 1, together with the condition for spike emissionand refractoriness) and the Equations 4-6 and 7 for the currents are integrated using the Euler methodwith a time step dt = 0.1ms. The mean value of the external current µext
E,I is calculated using mean-fieldEquations (see below) such that the background activity is at a chosen value νspE , νspI . The value ofthe synaptic potentiation J+ between neurons belonging to the same selective population was chosen toensure stable persistent activity.The network has been simulated using the standard protocols of match and non-match trials, as well asprotocols in which other stimuli (distractors), repeating or not, are presented in between the sample andthe test. All protocols are described below. Figures 2A. and 3A. show the time course of single match and

18
non-match trials simulated with the spiking neurons network with α = 1.5mV and β = 1.8mV (all theother parameters are listed in Table1). Protocols with intervening stimuli (Figs. 5 and 6) are simulatedwith the spiking neurons network with α = 0.84mV and β = 1.7mV (all other parameters in Table1).Average responses to stimuli -sample, match, non-match, repeated non-match- are calculated by countingthe number of spikes discharged by selective foreground and selective background during the first 200msof stimulus presentation.
Mean-field approach
We solve mean field Equations to find the average firing rates of the network p+2 populations in stationaryconditions [26]. In particular, we study the network state in the absence of stimulus presentation, i.e.during the spontaneous activity state and during the delay period of a DMS task. The set of parametersused to find the networks stationary states is given in Table 1 (in bold); we chose them to be compatiblewith realistic cortical anatomy.
Spontaneous activity state
At steady state, the average total current µsp impinging on a neuron in the absence of stimulus presen-tation (spontaneous activity state) depends on the average firing rates of the excitatory and inhibitorypopulations, according to the following p + 2 mean field Equations, where we specify the current con-tributions to the p selective populations, the non-selective background (i.e. excitatory neurons which donot participate in the task) and the inhibitory population
µspk = µrec
k + µextE with (11)
µreck = NEJEEτE
fg+νspk + fg−∑j 6=k
νspj + (1− pf)g−νsp0
−NIJEIτE νspI ;
µsp0 = µrec
0 + µextE with (12)
µrec0 = NEJEEτE
[f
p∑k=1
νspk + (1− pf)νsp0
]−NIJEIτE ν
spI ;
µspI = µrec
I + µextI with (13)
µrecI = NEJIEτI
[f
p∑k=1
νspk + (1− pf)νsp0
]−NIJIIτI ν
spI
where f is the coding level; νk is the firing rate averaged across all neurons in population k (k = 1 . . . p),ν0 and νI are the average firing rates of neurons belonging to the non-selective background and to theinhibitory population. µext
E,I , in the absence of any incoming sensory stimulus, is the average currentcoming from neighboring cortical regions to, respectively, excitatory and inhibitory populations. g+ andg− label, respectively, the strength of synaptic potentiation and depression.
The following condition holds
fJ+ + (1− f)J− = JEE
where J+ = g+JEE and J− = g−JEE . This condition ensures that the firing rates of the selectivepopulations in spontaneous activity is unchanged as J+ is varied.
The average firing rates of the p + 2 populations are instantaneous functions of the average totalcurrents, according to
νspK = Φ(µspK , σ); (14)

19
where K = {k = 1 . . . p, 0, I} and
ΦE,I(µ, σ) =
[τarp + τE,I
∫ a
b
du√πexp(u2)[1 + erf(u)]
]−1a =
θ − µσ
, b =VR − µσ
is the f-I curve of the leaky integrate-and-fire neuron in the presence of white noise, where erf is thestandard error function (see e.g. [63]), µ is the total average current impinging on a neuron, σ is itstemporal fluctuations, θ is the firing threshold, VR is the reset potential and τarp is the refractory period.
We assume that the mean external current to the excitatory and inhibitory populations coming fromneighboring cortical regions is normally distributed with mean µext
E,I and variance σ2BG. Consequently,
the average firing rates of the p+ 2 populations become:
νspK =1
σBG
√2π
∫ +∞
−∞exp
[−(µext
E − µextE )2
2σ2BG
]Φ(µrec
K + µextE , σ)dµext
E ; (15)
νspI =1
σBG
√2π
∫ +∞
−∞exp
[−(µext
I − µextI )2
2σ2BG
]Φ(µrec
I + µextI , σ)dµext
I ; (16)
where K = {k = 1 . . . p, 0}. One has to solve the set of p+ 2 coupled Equations given by Equations (15-16), where µrec
K and µrecI are given by Equations (11-13), to find the average firing rates and the average
total currents for each population. Having set all the parameters according to Table 1, one still needs toset the value of the external currents µext
E,I . We choose µextE,I in order to have fixed average spontaneous
rates:
νspk = νsp0 = 0.75Hz; (17)
νspI = 5Hz; (18)
with k = 1 . . . p, and solve the system of coupled Equation via the Newton-Raphson method.
Delay period and persistent activity
In the spontaneous activity state the network settles in a “symmetric state” in which all the pfNE cellsbelonging to the selective populations fire on average at the same rate νsp. By contrast, during thedelay period following the presentation of a stimulus, a fraction of the pfNE selective cells keeps firingpersistently even when the external stimulus is removed. We refer to this population of cells as the selectiveforeground (or the active memory representation). The remaining selective cells fall back to spontaneousactivity and we refer to them as the selective background (or the inactive memory representations). Theproportion of cells showing persistent activity during the delay period depends on the strength of thesynaptic potentiation J+ and on the level of activity of each selective population at stimulus offset. Inour model, the presentation of an external stimulus activates all the p selective populations, although toa different extent (see figure 1C. in the main text). There are p possible scenarios in which γ = 1 up toγ = p populations receive the highest current elicited by stimulus presentation. We set in a scenario inwhich γ = 1, hence only one of the selective populations is activated the most by the external stimuluswhile the other p−1 are all responding equally less. Consequently, when the external stimulus is removed,if J+ is large enough, only one selective population, i.e. the selective foreground, will fire persistently; allthe other, i.e. the selective background, will fall back to spontaneous activity.
In this situation the system can be described by four functionally different populations of cells: theselective foreground whose average firing rate is labelled by νsf , the selective background which fires onaverage at νbf , the non-selective background, ν0, and the inhibitory population νI . Therefore, the averagecurrents received by each of them, once the external stimulus is removed, can be written as

20
µsf = µrecsf + µext
E with (19)
µrecsf = NEJEEτE [fνsf (g+ + (γ − 1)g−) + fνsb(p− γ)g− + (1− pf)g−ν0]−NIJEIτE νI ;
µsb = µrecsb + µext
E with (20)
µrecsb = NEJEEτE [fνsfγg− + fνsb(g+ + (p− γ − 1)g−) + (1− pf)g−ν0]−NIJEIτE νI ;
µ0 = µrec0 + µext
E with (21)
µrec0 = NEJEEτE [fνsfγ + fνsb(p− γ) + (1− pf)ν0]−NIJEIτE νI ;
µI = µrecI + µext
I with (22)
µrecI = NEJIEτI [fνsfγ + fνsb(p− γ) + (1− pf)ν0]−NIJIIτI νI
and the average firing rates in each populations are given by Equations (15-16) where K = {sf, sb, 0}.For each fixed value of J+ and γ, one can find numerically the stable solutions (spontaneous state
and persistent activity state) of the system of four coupled Equations by appropriately setting the initialconditions and then solving via the Newton-Raphson method.
Simplified rate dynamics
Via the mean field approach described above we are able to completely define the attractor landscape ofthe network, i.e. the available stationary states of its dynamics. As a next step, in order to study thenetwork’s transient response during sample, match and non−match presentations, we use a simplifiedrate rate dynamics on the average population currents. We solve the dynamics for each epoch of a matchand non − match trial, i.e spontaneous activity, sample presentation, delay period, match/non-matchpresentation (see Protocols for the time duration of each epoch). Such model, without being as realisticand detailed as a network of spiking neurons, allows us to explore the relevant parameters’ space in aless time consuming way. The rate dynamics is not exact, but becomes a good approximation when thefiring rates are low [64] and gives in general a good approximation of the spiking network dynamics (seefig. 5 in the main text).
In accordance with the spiking neuron model (see the above section), we consider the different kineticsof the AMPA, GABA, and NMDA receptors to describe the dynamics of the average current for each ofthe four functionally relevant populations in the network. Hence, the total average current afferent oneach population is given by
µK = INK + IAK − IGK + µextK (23)
where K = {sf, sb, 0, I}, µextK = µext
E (µextI ) for the excitatory(inhibitory) populations and IN (IA) is the
contribution to the average current coming from excitatory afferents and mediated by NMDA(AMPA),while IG is the contribution to the average current coming from inhibitory afferents and mediated byGABA receptors. Each of these components evolves in time according to its own time constant
τN INK = −INK +XK µ
recEK ;
τAIAK = −IAK + (1−XK)µrecE
K ;
τGIGK = −IGK + µrecI
K
where µrecEK + µrecI
K = µrecK and µrec
K are defined in Equations 19-22.As for the spiking network, τN , τA and τG are, respectively, the decay time constants of NMDA, AMPA
and GABA currents, while Xsf,sb,0(XI) is the fraction of NMDA current on the excitatory(inhibitory)

21
population and γ = 1. Note that, as before, the total average currents defined in 23 depend on theaverage firing rates of each population according to
νk =1
σBG
√2π
∫ +∞
−∞exp
[−(µext
k − µextk )2
2σ2BG
]Φ(INk + IAk − IGk + µext
k , σ)dµextk ;
Having introduced slow and fast current dynamics in the simplified rate model allows to have a goodagreement with the spiking neurons model also during stimulus presentation. Responses to sample, matchand non-match are calculated either by averaging across the responses of all selective populations overthe first T = 200ms of stimulus presentation (unless otherwise stated) or by averaging separately acrossselective foreground and selective background.
Protocols
We use p = 6 different stimuli, corresponding to the p = 6 memory representations in the network. Alltrials begin with a pre-stimulus interval (1s) in which no external stimulus is presented and the networkis in a regime of spontaneous activity. Subsequently, a first stimulus is presented for 0.5s (sample). Inmatch trials, after a delay period of 0.7s in which the external stimulus is removed, a stimulus identical tothe sample is presented for 0.5s (match). In non−match trials, after the delay period (0.7s), a stimulusdifferent from the sample is presented for 0.5s (non−match). In protocols with intervening non-repeatedstimuli, sample presentation is followed, after a delay period, by either 1 or 2 -different- distractors andthen by a test stimulus, which could be either a match or a non-match to the sample. In protocols withintervening repeated stimuli -i.e. the ‘ABBA’ type of trials- the sample is followed, after a delay period,by 2 repeating distractors and by a final match to the sample. Stimulus and delay period durations arekept the same as in “simple” match/non-match trials.
Sparseness index
As in [30], we used the following index as a measure of selectivity
S =1−A1− 1
n
where
A =(∑n
i νi/n)2∑ni (ν2i /n)
and n is the number of stimuli, νi are the mean firing rates to a set of stimuli. S takes values between 0and 1, so that
S = 0 when νi = ν for all i (A = 1)
S = 1 when νi = ν and νj 6=i = 0 (A = 1/n)
22
Acknowledgments
We are indebted to Yali Amit for carefully reading the manuscript and providing helpful comments, andto Christos Constantinidis for insightful discussions.

23
References
1. Desimone R (1996) Neural mechanisms for visual memory and their role in attention. PNAS 93:13494–13499.
2. Amit D, Mongillo G (2003) Selective delay activity in the cortex: Phenomena and interpretation.Cerebral Cortex 13: 1139-1150.
3. Ranganath C, D’Esposito M (2005) Directing the minds eye: prefrontal, inferior and medial tem-poral mechanisms for visual working memory. Curr Opin Neurobio 15: 175-182.
4. Brown M, Bashir Z (2002) Evidence concerning how neurons of the perirhinal cortex may effectfamiliarity discrimination. Phil Trans R Soc Lond B 357: 1083–1095.
5. Grill-Spector K, Henson R, Martin A (2006) Repetition and the brain: neural models of stimulus-specific effects. TICS 10: 14-23.
6. Ranganath C, Rainer G (2003) Neural mechanisms for detecting and remembering novel events.Nat Rev Neurosci 4: 193–202.
7. Suzuki WA (1999) The long and the short of it: Memory signals in the medial temporal lobe.Neuron 24: 295-298.
8. Miller EK, Li L, Desimone R (1993) Activity of neurons in anterior inferior temporal cortex duringa short-term memory task. J Neurosci 13: 1460-1478.
9. Miller EK, Erickson CA, Desimone R (1996) Neural mechanisms of visual working memory inprefrontal cortex of the macaque. J Neurosci 16: 5154-5167.
10. Nakamura K, Kubota K (1995) Mnemonic firing of neurons in the monkey temporal pole during avisual recognition memory task. J Neurophysiol 74: 162-178.
11. Rainer G, Rao SC, Miller EK (1999) Prospective coding for objects in primate prefrontal cortex.J Neurosci 19: 5493-5505.
12. Freedman DJ, Riesenhuber M, Poggio T, Miller EK (2003) A comparison of primate prefrontaland inferior temporal cortices during visual categorization. J Neurosci 23: 5235-5246.
13. Stokes M, Kusunoki M, Sigala N, Nili H, Gaffan D, et al. (2013) Dynamic coding for cognitivecontrol in prefrontal cortex. Neuron 78: 364–375.
14. Joelving F, Compte A, Constantinidis C (2007) Temporal properties of posterior parietal neurondischarges during working memory and passive viewing. J Neurophysiol 97: 2254–2266.
15. Gottlieb Y, Vaadia E, Abeles M (1989) Single unit activity in the auditory cortex of a monkeyperforming a short term memory task. Experimental Brain Research 74: 139-148.
16. Hayden BY, Gallant JL (2013) Working memory and decision processes in visual area v4. FrontNeurosci 7: 18.
17. Zaksas D, Pasternak T (2006) Directional signals in the prefrontal cortex and in area mt during aworking memory for visual motion task. J Neurosci 26: 11726-11742.
18. Miller EK, Desimone R (1994) Parallel neuronal mechanisms for short-term memory. Science 263:520–522.

24
19. Engel TA, Wang XJ (2011) Same or different? A neural circuit mechanism of similarity-basedpattern match decision making. J Neurosci 31: 6982–6996.
20. Lehky S, Sereno A (2007) Comparison of shape Encoding in primate dorsal and ventral visualpathways. J Neurophys 97: 307–319.
21. Meyer T, Qi X, Constantinidis C (2007) Persistent discharges in the pre- frontal cortex of monkeysnaive to working memory tasks. Cereb Cortex 17: 70-76.
22. Meyer T, Stanford T, Constantinidis C (2011) Stimulus selectivity in dorsal and ventral prefrontalcortex after training in working memory tasks. J Neurosci 31: 6266-6276.
23. Qi X, Meyer T, Stanford T, Constantinidis C (2011) Changes in prefrontal neuronal activity afterlearning to perform a spatial working memory task. Cereb Cortex 21: 2722-2732.
24. Qi X, Meyer T, Stanford T, Constantinidis C (2012) Neural correlates of a decision variable beforelearning to perform a match/non-match task. J Neurosc 32: 6161-6169.
25. Haider B, McCormick DA (2009) Rapid neocortical dynamics: Cellular and network mechanisms.Neuron 62: 171–189.
26. Amit DJ, Brunel N (1997) Model of global spontaneous activity and local structured activity duringdelay periods in the cerebral cortex. Cerebral Cortex 7: 237-252.
27. Wang XJ (2001) Synaptic reverberation underlying mnemonic persistent activity. Trends Neurosci24: 455-463.
28. Wang HX, Gao WJ (2009) Cell type-specific development of NMDA receptors in the interneuronsof rat prefrontal cortex. Neuropsychopharmacology 34: 2028–2040.
29. Wohrer A, Humphries M, Machens C (2013) Population-wide distributions of neural activity duringperceptual decision-making. Prog Neurobiol 103: 156–193.
30. Woloszyn L, Sheinberg DL (2012) Effects of long-term visual experience on responses of distinctclasses of single units in inferior temporal cortex. Neuron 74: 193–205.
31. Lui L, Pasternack T (2011) Representation of comparison signals in cortical area MT during adelayed direction discrimination task. J Neurophys 106: 1260-1273.
32. Brunel N, Wang XJ (2001) Effects of neuromodulation in a cortical network model of object workingmemory dominated by recurrent inhibition. J Comput Neurosci 11: 63-85.
33. Li L, Miller E, Desimone R (1993) The representation of stimulus familiarity in anterior inferotem-poral cortex. J Neurophys 69: 1918-1929.
34. Shu Y, Hasenstaub A, Badoual M, Bal T, McCormick DA (2003) Barrages of synaptic activitycontrol the gain and sensitivity of cortical neurons. J Neurosci 23: 10388–10401.
35. Baylis GC, Rolls ET (1987) Responses of neurons in the inferior temporal cortex in short term andserial recognition memory tasks. Exp Brain Res 65: 614–622.
36. Miller EK, Desimone R (1991) A neural mechanism for working and recognition memory in inferiortemporal cortex. Science 254: 1377-1379.
37. Woloszyn L, Sheinberg DL (2009) Neural dynamics in inferior temporal cortex during a visualworking memory task. J Neurosc 29: 5494–5507.

25
38. Lueschow A, Miller E, Desimone R (1994) Inferior Temporal Mechanisms for Invariant ObjectRecognition. Cereb Cortex 4: 523-531.
39. Rawley J, Constantinidis C (2011) Effects of task and coordinate frame of attention in area 7a ofthe primate posterior parietal cortex. J Vision 10: 12.1-1216.
40. Steinmetz M, Connor C, Constantinidis C, McLaughlin J (1994) Covert attention suppresses neu-ronal responses in area 7a of the posterior parietal cortex. J Neurophys 72: 1020–1023.
41. Steinmetz M, Constantinidis C (1995) Neurophysiological evidence for a role of posterior parietalcortex in redirecting visual attention. Cereb Cortexl 5: 448-456.
42. Ringo J (1996) Stimulus specific adaptation in inferior temporal and medial temporal cortex in themonkey. Behav Brain Res 76: 191–197.
43. Rainer G, Miller EK (2000) Effects of visual experience on the representation of objects in theprefrontal cortex. Neuron 27: 179-189.
44. Wiggs C, Martin A (1998) Properties and mechanisms of perceptual priming. Curr Opin Neurobiol8: 227–233.
45. Moldakarimov S, Bazhenova M, Sejnowski T (2010) Perceptual priming leads to reduction of gammafrequency oscillations. PNAS 107: 5640-5645.
46. Brunel N, Lavigne F (2009) Semantic priming in a cortical network model. J Cogn Neurosci 21:2300-2319.
47. Takeda M, Naya Y, Fujimichi R, Takeuchi D, Miyashita Y (2005) Active maintenance of associativemnemonic signal in monkey inferior temporal cortex. Neuron 48: 839–848.
48. Suzuki WA, Miller EK, Desimone R (1997) Object and place memory in the macaque entorhinalcortex. J Neurophysiol 78: 1062-1081.
49. Cole BJ, Hillmann M (1994) Effects of benzodiazepine receptor ligands on the performance of anoperant delayed matching to position task in rats: opposite effects of FG 7142 and lorazepam.Psychopharmacology (Berl) 115: 350–357.
50. Ohno M, Yamamoto T, Watanabe S (1992) Intrahippocampal injections of benzodiazepine andmuscimol impair working memory but not reference memory of rats in the three-panel runwaytask. Eur J Pharmacol 219: 245–251.
51. Thiel CM, Henson RN, Morris JS, Friston KJ, Dolan RJ (2001) Pharmacological modulation ofbehavioral and neuronal correlates of repetition priming. J Neurosci 21: 6846–6852.
52. Wang Y, Fujita I, Murayama Y (2000) Neuronal mechanisms of selectivity for object featuresrevealed by blocking inhibition in inferotemporal cortex. Nature neuroscience 3: 807–813.
53. Sohal V, Hasselmo M (2000) A model for experience- dependent changes in the responses of infer-otemporal neurons. Network 11: 169-190.
54. Wang Y, Markram H, Goodman PH, Berger TK, Ma J, et al. (2006) Heterogeneity in the pyramidalnetwork of the medial prefrontal cortex. Nat Neurosci 9: 534–542.
55. Yakovlev V, Fusi S, Berman E, Zohary E (1998) Inter-trial neuronal activity in inferior temporalcortex: a putative vehicle to generate long-term visual associations. Nature Neurosci 1: 310-317.

26
56. Yakovlev V, Amit D, Romani S, Hochstein S (2008) Universal memory mechanism for familiarityrecognition and identification. J Neurosci 28: 239–248.
57. Amit Y, Yakovlev V, Hochstein S (2013) Modeling behavior in different delay match to sampletasks in one simple network. Front Hum Neurosci 7:: 408. doi: 10.3389/fnhum.2013.00408.
58. Barbieri F, Brunel N (2007) Irregular persistent activity induced by synaptic excitatory feedback.Frontiers in Computational Neuroscience 1: 5.
59. Mongillo G, Hansel D, van Vreeswijk C (2012) Bistability and spatiotemporal irregularity in neu-ronal networks with nonlinear synaptic transmission. Phys Rev Lett 108: 158101.
60. Lisman JE, Idiart MA (1995) Storage of 7+/-2 short-term memories in oscillatory subcycles. Sci-ence 267: 1512-1515.
61. Mongillo G, Barak O, Tsodyks M (2008) Synaptic theory of working memory. Science 319: 1543.
62. Renart A, Moreno-Bote R, Wang XJ, Parga N (2007) Mean-driven and fluctuation-driven persistentactivity in recurrent networks. Neural Comput 19: 1–46.
63. Abramowitz M, Stegun IA (1970) Tables of mathematical functions. Dover Publications, NY.
64. Ostojic S, Brunel N (2011) From spiking neuron models to linear-nonlinear models. PLOS CompBiol 7: e1001056.

27

28
Tables
Selective populations p=6Coding level f=0.05Excitatory neurons NE=1600Selective excitatory neurons Nsel
E = pfNE=480Inhibitory neurons NI=400Membrane time const. excit. τE=0.02sMembrane time const. inhib. τI=0.01sThreshold membrane potential θ=20mVExternal noise excit.and inhib. σ=0.75mVStandard dev of µext σBG=1mVStandard dev of µstim σS=2mVMembrane reset potential excit. and inhib. VR= 10mVRefractory period τarp=0.0025sDecay time AMPA currents τAMPA=0.005sDecay time NMDA currents τNMDA=0.05sDecay time GABA currents τGABA=0.005sFraction of NMDA on excit. neurons XE=0.7Fraction of NMDA on inhib. neurons XI = 0.002EPSP on excit. JEE=0.025mVEPSP on inhib. JIE = 2.5JEE
IPSP on excit. JEI = 3JEE
IPSP on inhib. JII = 4JEE
Potentiation J+=0.156mVDepression J− = (JEE − J+f)/(1− f)Excit. spontaneous firing rate νspE =0.75HzInhib. spontaneous firing rate νspI =5HzTime step spiking neurons sim. dt=0.1msTime step simplified rate dynamics sim. dt=1ms
Table 1. Network parameters for simplified rate dynamics and spiking neurons simulations. In bold,the parameters used in the mean field analysis.