Capturing the epileptic trait: cortical excitability measures in patients and their unaffected...
15
BRAIN A JOURNAL OF NEUROLOGY Capturing the epileptic trait: cortical excitability measures in patients and their unaffected siblings Radwa A.B. Badawy, 1,2,3 Simon J. Vogrin, 1 Alan Lai 4 and Mark J. Cook 1,2 1 Department of Clinical Neurosciences, St Vincent’s Hospital, Fitzroy, Victoria 3065, Australia 2 Departments of Medicine, The University of Melbourne, Parkville, Australia 3 Departments of Electrical and Electronic Engineering, The University of Melbourne, Parkville, Australia 4 Bionics Institute, East Melbourne, Victoria, Australia Correspondence to: Dr. Radwa Badawy Department of Clinical Neurosciences, St Vincent’s Hospital, 41 Victoria Parade Fitzroy, Victoria 3065, Australia E-mail: [email protected] We used transcranial magnetic stimulation to investigate whether the cortical excitability changes observed amongst the different generalized and focal epilepsy syndromes are reflected in their asymptomatic siblings and if these changes depended on the clinical phenotype. We studied 157 patients with epilepsy (95 generalized and 62 focal) and their asymptomatic siblings (138 and 82, respectively). Motor threshold and paired pulse transcranial magnetic stimulation at short (2, 5, 10 and 15 ms) and long (100–300 ms) interstimulus intervals were measured. Results were compared to those of 12 control subjects and 20 of their siblings. There were no differences in cortical excitability between healthy control subjects and their siblings. Compared with control subjects, cortical excitability was higher in siblings of patients whether generalized (P 5 0.05; short and long inter- stimulus intervals) or focal (P 5 0.05; long interstimulus intervals). Compared with epilepsy, motor threshold was lower (P 5 0.05) in patients with juvenile myoclonic epilepsy compared with their siblings only early at onset in the drug naı¨ve state. In all groups (generalized and focal) cortical excitability was lower in siblings only at the long interstimulus intervals (250 and 300; P 5 0.05). Cortical excitability is higher in asymptomatic siblings of patients with generalized and focal epilepsy in a similar manner. The disturbance seems to involve intracortical inhibitory circuits even in the siblings of patients with a structural abnormality (acquired epilepsy). This implies there are certain genetic factors that predispose to both generalized and focal epilepsies and a complex genetic/environmental interaction then determines the clinical phenotype. Keywords: asymptomatic siblings; cortical excitability; epilepsy; seizures; transcranial magnetic stimulation Abbreviation: TMS = transcranial magnetic stimulation Introduction The epilepsies are a diverse group of conditions characterized and defined by paroxysmal activity in populations of cortical neurons that result in recurrent seizures. There is considerable evidence that there is an underlying genetic contribution to this condition and indeed a substantial subgroup of the epilepsies are specifically classified as ‘genetic’ epilepsies (Berg et al., 2010). Furthermore at the other end of the spectrum, there is mounting evidence that even lesional and post-traumatic epilepsies are underpinned by a genetic predisposition (Scher et al., 2011; Kabat and Krol, 2012). While a complex interaction between genetic and possibly doi:10.1093/brain/awt047 Brain 2013: Page 1 of 15 | 1 Received October 18, 2012. Revised November 27, 2012. Accepted January 13, 2013 ß The Author (2013). Published by Oxford University Press on behalf of the Guarantors of Brain. All rights reserved. For Permissions, please email: [email protected] Brain Advance Access published March 12, 2013 by guest on March 13, 2013 http://brain.oxfordjournals.org/ Downloaded from
Transcript of Capturing the epileptic trait: cortical excitability measures in patients and their unaffected...
BRAINA JOURNAL OF NEUROLOGY
Capturing the epileptic trait: cortical excitabilitymeasures in patients and their unaffected siblingsRadwa A.B. Badawy,1,2,3 Simon J. Vogrin,1 Alan Lai4 and Mark J. Cook1,2
1 Department of Clinical Neurosciences, St Vincent’s Hospital, Fitzroy, Victoria 3065, Australia2 Departments of Medicine, The University of Melbourne, Parkville, Australia3 Departments of Electrical and Electronic Engineering, The University of Melbourne, Parkville, Australia4 Bionics Institute, East Melbourne, Victoria, Australia
Correspondence to: Dr. Radwa BadawyDepartment of Clinical Neurosciences,St Vincent’s Hospital,41 Victoria Parade Fitzroy,Victoria 3065, AustraliaE-mail: [email protected]
We used transcranial magnetic stimulation to investigate whether the cortical excitability changes observed amongst the
different generalized and focal epilepsy syndromes are reflected in their asymptomatic siblings and if these changes depended
on the clinical phenotype. We studied 157 patients with epilepsy (95 generalized and 62 focal) and their asymptomatic siblings
(138 and 82, respectively). Motor threshold and paired pulse transcranial magnetic stimulation at short (2, 5, 10 and 15 ms) and
long (100–300 ms) interstimulus intervals were measured. Results were compared to those of 12 control subjects and 20 of their
siblings. There were no differences in cortical excitability between healthy control subjects and their siblings. Compared with
control subjects, cortical excitability was higher in siblings of patients whether generalized (P5 0.05; short and long inter-
stimulus intervals) or focal (P50.05; long interstimulus intervals). Compared with epilepsy, motor threshold was lower
(P5 0.05) in patients with juvenile myoclonic epilepsy compared with their siblings only early at onset in the drug naıve
state. In all groups (generalized and focal) cortical excitability was lower in siblings only at the long interstimulus intervals
(250 and 300; P5 0.05). Cortical excitability is higher in asymptomatic siblings of patients with generalized and focal epilepsy
in a similar manner. The disturbance seems to involve intracortical inhibitory circuits even in the siblings of patients with a
structural abnormality (acquired epilepsy). This implies there are certain genetic factors that predispose to both generalized and
focal epilepsies and a complex genetic/environmental interaction then determines the clinical phenotype.
Keywords: asymptomatic siblings; cortical excitability; epilepsy; seizures; transcranial magnetic stimulation
Abbreviation: TMS = transcranial magnetic stimulation
IntroductionThe epilepsies are a diverse group of conditions characterized and
defined by paroxysmal activity in populations of cortical neurons
that result in recurrent seizures. There is considerable evidence
that there is an underlying genetic contribution to this condition
and indeed a substantial subgroup of the epilepsies are specifically
classified as ‘genetic’ epilepsies (Berg et al., 2010). Furthermore
at the other end of the spectrum, there is mounting evidence that
even lesional and post-traumatic epilepsies are underpinned by
a genetic predisposition (Scher et al., 2011; Kabat and Krol,
2012). While a complex interaction between genetic and possibly
doi:10.1093/brain/awt047 Brain 2013: Page 1 of 15 | 1
Received October 18, 2012. Revised November 27, 2012. Accepted January 13, 2013! The Author (2013). Published by Oxford University Press on behalf of the Guarantors of Brain. All rights reserved.For Permissions, please email: [email protected]
Brain Advance Access published March 12, 2013
by guest on March 13, 2013
http://brain.oxfordjournals.org/D
ownloaded from

environmental factors is likely to influence the particular seizure
phenotype seen in these syndromes (Berkovic et al., 2006), alter-
ation of ion channels arising from genetic variation or functional
modification, is a potential unifying theme for the hyperexcitability
seen in individuals with epilepsy (Helbig et al., 2008).
Many large-scale epidemiological studies show that !5% of
patients have a first-degree relative with epilepsy (Beaussart and
Loiseau, 1969; Bianchi et al., 2003). In fact, the degree of familial
aggregation in the epilepsies is relatively high for a complex disorder
and is consistent with strong familial risk factors (Burton et al., 2005).
Because of that, family studies that compare epilepsy-affected
and unaffected family members have provided a powerful tool
in identifying other common and presumably genetically based
characteristics including behavioural traits (Hesdorffer et al., 2012),
cognitive abnormalities (Wandschneider et al., 2010), anatomy
(Scanlon et al., 2013) and EEG characteristics (Rodin and
Gonzalez, 1966; Doose et al., 1977; Atakli et al., 1999; Akgun
et al., 2009) in epilepsy. The reports of abnormalities on up to
50% of the EEG recordings of asymptomatic first degree family
members of patients with epilepsy (Rodin and Gonzalez, 1966;
Atakli et al., 1999; Akgun et al., 2009) as well as high amplitudes
in cortical somatosensory evoked potentials in asymptomatic siblings
of patients with juvenile myoclonic epilepsy (Atakli et al., 1999)
suggest a common tendency for a hyperexcitable cortex that
may or may not present itself as epilepsy. It would thus be interesting
to interrogate patterns of change in cortical excitability in affected
and unaffected family members.
Transcranial magnetic stimulation (TMS) provides an excellent
safe and sensitive in vivo means of measuring human cortical
excitability (Rossini and Rossi, 2007). Measurements made using
TMS are dependent on small excitatory and inhibitory networks of
interneurons and their synaptic interactions with each other and
with motor neurons (Rothwell, 1997). Hence TMS is uniquely able
to obtain information about the state of excitability of local neur-
onal circuits in vivo in the human brain. Using different TMS
testing paradigms, increased cortical excitability was found to be
the characteristic feature of the interictal state in patients with a
variety of epilepsy syndromes, both at onset and late in the course
of the seizure disorders (Reutens and Berkovic, 1992; Cantello
et al., 2000; Manganotti et al., 2000; Werhahn et al., 2000;
Hamer et al., 2005; Badawy et al., 2007). The pattern of increase
in cortical excitability has provided important insights into the
pathophysiology of different forms of epilepsy. Employing TMS
to study non-medicated/non-affected siblings of patients with
epilepsy has the potential to provide further information on the
underlying mechanisms of this complex disorder.
Materials and methods
Participant populationsThe study protocol was approved by the St Vincent’s Hospital Human
Research Ethics Committee and written informed consent was
obtained from each participant including parental consent from those
participants under the age of 18 years. The participants were divided
into different groups as follows.
Non-epilepsy control subjects and their siblingsTwelve healthy participants (seven females) and 20 of their siblings
(12 females) with a mean age of 22 years (range 14–45 years) without
a personal or family history of seizures or any other neurological
conditions. None of the participants were taking medication of any
kind. To facilitate result analysis, the participant first recruited was
included in the control group and his or her siblings were included
in the siblings group. There was no consanguinity in any of the parents
and there were no identical twins; however, this group included a
non-identical twin couple.
Patients with epilepsy and their siblingsWe report the findings from a subgroup of patients with different
generalized and focal epilepsy syndromes. These patients were
consecutively recruited through (i) Outpatient Epilepsy Clinic; and
(ii) screening the databases of the Epilepsy Clinic and Epilepsy
Surgery Program at St Vincent’s Hospital in Melbourne, Australia.
These are tertiary referral centres; the first provides the manage-
ment of patients with epilepsy and the latter aims for the character-
ization and pre-surgical evaluation of patients with refractory focal
epilepsy.
To prevent any hypothetical effect of prolonged long standing
epilepsy and to maintain homogeneity between the groups, only
participants under the age of 45 years were included. In addition,
participants under the age of 14 years were not included as normal
single and paired pulse TMS values in children under this age are
non-comparable to older participants and have not been established
in children with epilepsy (Quintana, 2005; Garvey and Mall, 2008).
Thus patients with childhood absence epilepsy and focal epilepsies of
childhood unfortunately could not be included.
The diagnoses were made by at least two experienced epileptolo-
gists who were unaware of the study based on clinical history, EEG
and imaging findings.
For the purposes of the current study, patients with neurologically
normal asymptomatic siblings (range 1–4) within the same age range
(14–45 years) who had never experienced any form of seizures
were included in a separate analysis. There were no identical twins;
however, there were discordant (one affected twin) non-identical
twins (Table 1). There were also two consanguineous families as
shown in Table 1.
The patients were categorized based on the type of syndrome and
status at the time of testing (Table 1).
The syndrome category was subdivided into: (i) ‘genetic’ (previously
named idiopathic) generalized epilepsy syndromes presenting during
late childhood, adolescence and early adulthood. These included
juvenile myoclonic epilepsy, juvenile absence epilepsy and generalized
epilepsy with tonic-clonic seizures alone; and (ii) focal epilepsy syn-
dromes, which were divided into temporal lobe epilepsy and extra
temporal lobe epilepsy.
For status at the time of testing our previous studies showed that
TMS measures differ depending on whether the patient cohorts are
studied at onset prior to exposure to anti-epileptic drugs, become
seizure free after medication or continue to have refractory seizures
(Badawy et al., 2010, 2013). Consequently we further subdivided our
groups into: (i) drug naıve new onset epilepsy, these groups comprised
patients newly diagnosed with epilepsy. They were recruited on pres-
entation to the clinic and were studied with TMS within the same
week and prior to any exposure to anti-epileptic drugs; (ii) refractory
seizures, patients were considered refractory if they continued to have
ongoing seizures for at least 3 years despite trials of at least two
different anti-epileptic drugs at therapeutic doses (Kwan and Brodie,
2 | Brain 2013: Page 2 of 15 R. A. B. Badawy et al.
by guest on March 13, 2013
http://brain.oxfordjournals.org/D
ownloaded from

2000; Kwan et al., 2010). This included generalized or secondarily
generalized tonic-clonic seizures, absences, myoclonic seizures, focal
seizures with loss of awareness and unequivocal focal seizures com-
prising visual, auditory, motor, sensory or autonomic manifestations
with retained awareness. Isolated infrequent non-specific vague feel-
ings, uneasiness or brief deja vu were not considered seizures; and (iii)
seizure free, patients were included in the seizure free group if they
did not experience any of the seizures described above for at least 12
months before the TMS test.
Patient inclusion criteriaPatients were included in the study if they had: (i) generalized epi-
lepsy, generalized epileptiform abnormalities (3.5–5 Hz spike-wave) on
at least one EEG recording and a history of generalized tonic-clonic
seizures, myoclonic and/or absence seizures; (ii) focal epilepsy, syn-
dromic classification required that the seizure symptomatology (specif-
ically characteristics of the aura when consistently present) and the
EEG showed either a left or right-sided lateralization as well as local-
ization to a certain lobe. The EEG was considered localizing only if
definite and prominent sharp-slow discharges were seen consistently
over one region either frontal (Fp1-Fz-F3/ Fp2-Fz,F4), temporal
(T1-T3/ T2/T4), parietal (P3-C3/P4-C4) or occipital (O1/O2).
Patients with temporal intermittent rhythmic delta activity were
included in the temporal lobe epilepsy group only if the activity was
consistently recorded over one hemisphere. Non-specific slowing or
sharp waves were not considered lateralizing or localizing even if
only recorded on one side. Further localizing signs were found on
brain magnetic resonance images. Imaging was only routinely per-
formed on patients thought to have focal epilepsy. The findings
were available for all patients and are summarized in Table 2; and
(iii) normal neurological examination.
Patient exclusion criteriaPatients were excluded from the study for the following: (i) suspicion
of non-epileptic events (psychogenic non-epileptic seizures, migraine,
parasomnias etc.); (ii) had an undetermined epilepsy syndrome
(not clear whether generalized or focal epilepsy); (iii) seizure foci ori-
ginating in the vicinity of the motor area (seizure semiology or on
imaging); (iv) bilateral seizure foci; (v) in the drug naıve new onset
groups only: exposure to anti-epileptic drugs prior to the TMS study;
and (vi) previous cortical resections or craniotomies.
Table 1 Demographics of participants included in each group
Epilepsy syndrome Subgroup Number(numberoffemales)
Age inyears(range)
Age ofonsetin years(range)
Seizurefrequency;all types(range)
Anti-epilepticdrugs
Numberof siblings(numberof females)
Mean ageof siblingsin years(range)
Generalized epilepsy
Juvenile myoclonicepilepsy
Drug naıvenew onset
7 (4) 20 (14–26) – 4 (2–8) None 11 (7) 21 (14–30)
Refractoryseizures
12 (6) 25 (15–40) 18 (12–25) 6/month(2–14)
VPA, LEV, LTG, TPM 18 (11) 25 (14–43)
Seizure free 14 (6) 22 (15–43) 18 (12–25) 0 VPA, LEV, LTG, TPM 21 (11*) 25 (15–45)
Juvenile absenceepilepsy
Drug naıvenew onset
4 (2) 18 (14–23) – 4 (2–8) None 9 (4) 20 (15–26)
Refractoryseizures
12 (7) 24 (14–44) 23 (11–26) 8/month(2–16)
VPA, LEV, LTG, TPM 13 (7) 24 (16–39)
Seizure free 12 (7) 24 (16–39) 20 (12–22) 0 VPA, LEV, LTG, TPM 16 (10)# 22 (15–40)
Generalized epilepsywith tonic-clonicseizures
Drug naıvenew onset
7 (3) 20 (15–31) – 1 (1–2) None 17 (10)* 23 (16–44)
Refractoryseizures
14 (9) 25 (16–43) 22 (10–25) 4/year(2–12)
VPA, LEV, LTG, TPM 20 (9) 20 (14–45)
Seizure free 13 (7) 26 (16–45) 19 (11–26) 0 VPA, LEV, LTG, TPM 13 (6) 27 (15–40)
Focal epilepsy
Temporal lobeepilepsy
Drug naıvenew onset
6 (3) 24 (14–32) – 4 (1–6) None 7 (4)# 23 (14–40)
Refractoryseizures
14 (8) 27 (17–45) 20 (13–29) 7/month(2–14)
CBZ, GBP, LAC, LEV,LTG, OXC, TPM,VPA
18 (9) 25 (16–42)
Seizure free 14 (7) 26 (17–45) 22 (11–30) 0 CBZ, GBP, LAC, LEV,LTG, OXC, TPM,VPA
16 (8) 26 (14–45)
Extra-temporal lobeepilepsy
Drug naıvenew onset
5 (2) 25 (14–32) – 3 (1–5) None 11 (4) 22 (14–40)
Refractoryseizures
12 (6) 27 (19–43) 22 (13–29) 8/month(2–14)
CBZ, GBP, LAC, LEV,LTG, OXC, TPM,VPA
15 (8)* 23 (15–42)
Seizure free 11 (5) 29 (17–40) 24 (11–31) 0 CBZ, GBP, LAC, LEV,LTG, OXC, TPM,VPA
15 (8) 27 (15–45)
*A discordant twin couple; #A family with consanguineous parents.CBZ = carbamazepine; GBP = gabapentin; LAC = lacosamide; LEV = levetiracetam; LTG = lamotrigine; OXC = oxcarbazepine; TPM = topiramate; VPA = sodium valproate.
Cortical excitability in the epileptic trait Brain 2013: Page 3 of 15 | 3
by guest on March 13, 2013
http://brain.oxfordjournals.org/D
ownloaded from

Sibling exclusion criteriaSiblings of patients were excluded from the study for the following:
(i) a history of seizures, migraine or any other neurological condition;
(ii) suffering from any medical condition at the time of the study;
(iii) history of head trauma, or craniotomies; (iv) previous exposure
to anti-epileptic drugs; and (v) currently taking medication of any kind.
Electroencephalography recordingAll patients and each of their siblings underwent a routine clinical EEG
recording using the standard 10–20 electrode system on the same day
of TMS before the testing session. Digital EEG Recordings were per-
formed on an E-series EEG amplifier using Profusion EEG4 software
(Compumedics Ltd.). The EEG recording session lasted at least 25 min,
including hyperventilation and photic stimulation.
Transcranial magnetic stimulationBoth hemispheres were studied in each participant (patients and con-
trol subjects). During TMS, the participants sat in a comfortable, reclin-
ing chair. Surface electromyographic (EMG) recording was made from
the abductor pollicis brevis muscle. Stimuli were delivered to the
contralateral cerebral hemisphere by applying the appropriate direction
of coil current flow (anticlockwise for left cortical stimulation and
clockwise for right cortical stimulation), using a flat circular 9-cm diam-
eter magnetic coil (14 cm external diameter) with the centre of the coil
positioned over the vertex and held in a plane tangential to it using a
pair of Magstim 200 magnetic stimulators. Paired stimulation at vari-
ous interstimulus intervals was performed using a Bistim module to
connect two stimulators to the coil.
The motor evoked potentials were recorded and digitized online
through a CED 1401 interface (Cambridge Electronic Design Ltd)
and stored on computer for offline analysis. Signal software
(Cambridge Electronic Design Ltd) was used for automated acquisition
and marking of the recorded motor evoked potentials. Filters for the
acquisition were set to low frequency of 10 Hz and high frequency
of 5 kHz. Sweep speed for threshold determination and paired pulse
TMS at short interstimulus intervals was 100 ms and the sensitivity
was set to 100mV/division. For longer interstimulus intervals the
sweep was adjusted to 500 ms and sensitivity to 2 mV/division.
The motor evoked potential amplitude was measured from peak to
peak.
The experimental session lasted for 60–90 min and the following
parameters were recorded.
Motor thresholdMotor threshold was determined in all tested hemispheres while the
participant was at rest, verified by continuous visual and auditory EMG
feedback. Stimulation commenced at 30% of maximum output and
increased in 5% increments until the motor evoked potential was
established. One per cent changes in intensity were then used to
measure the threshold value. Motor threshold was defined as the
lowest level of stimulus intensity which produced a motor evoked
potential in the target muscle of peak-to-peak amplitude 4100 mV
on 550% of 10 trials (Rossini et al., 1994).
Intracortical inhibition and facilitationCortical recovery curves were derived using paired pulse TMS. For the
short interstimulus intervals of 2, 5, 10 and 15 ms, the first stimulus
was given at 80% of motor threshold and the second stimulus 20%
above motor threshold. Ten stimuli at 20% above motor threshold
without a preconditioning stimulus were also given. For longer inter-
stimulus intervals, the stimulation intensity was 20% above motor
threshold using paired stimuli in 50 ms increments at interstimulus
intervals of 100–300 ms. A minimum interval of 15 s was kept between
the delivery of each pair of stimuli. Stimuli were given at randomly
selected interstimulus intervals until a total of 10 at each interstimulus
interval was achieved.
Table 2 Findings on MRI in each of the focal epilepsy groups
Epilepsy syndrome Subgroup Findings
Temporal lobe epilepsy Drug naıve new onset 1 patient with hypertrophied amygdala5 patients lesion negative
Refractory seizures 4 patients with hippocampal sclerosis2 patients with cortical dysplasia
1 patient with a dysembryoplastic neuroepithelial tumour
7 patients lesion negative
Seizure free 2 patients with hippocampal sclerosis1 patient with temporal cyst
11 patients lesion negative
Extra-temporal lobe epilepsy Drug naıve new onset 1 patient with frontal cyst4 patients lesion negative
Refractory seizures 1 patient with parieto-occipital gliosis1 patient with parietal cortical dysplasia
2 patients with frontal cortical dysplasia
1 patient with frontal gliosis
1 patient with occipital gliosis
1 patient with occipital cyst
8 patients lesion negative
Seizure free 1 patients with frontal cyst1 patient with occipital cyst
9 patients lesion negative
4 | Brain 2013: Page 4 of 15 R. A. B. Badawy et al.
by guest on March 13, 2013
http://brain.oxfordjournals.org/D
ownloaded from

Recovery curves at short interstimulus intervals (2–15 ms) were con-
structed for each hemisphere using the ratio of the mean peak to peak
amplitude of the response [termed test response (TR)] at each inter-
stimulus interval following the conditioning stimulus given below
motor threshold expressed as the percentage of the mean motor
evoked potential (MEP) when the test stimulus was given alone with-
out a preconditioning stimulus (TR/MEP%).
Recovery curves at longer interstimulus intervals (100–300 ms) were
constructed for each hemisphere using the ratio of the mean
peak-to-peak amplitudes of the response to the second stimulus
termed the test response (TR) and the response to the first stimulus
termed the conditioning response (CR) at each interstimulus interval
measured as a percentage (TR/CR%).
To avoid any effect of diurnal variation in cortical excitability all
studies were performed between 10 am and 3 pm. Care was taken
to avoid clustering of any of the participants in a group to a particular
time, and the studies were spread evenly over this time interval in all
groups. Similarly, to avoid any hormonal effects related to variations
across the menstrual cycle, care was taken to avoid clustering of the
female participants in each group to a particular phase of the cycle and
they were spread evenly across the two phases (luteal and follicular) in
each group. It was requested of all participants to maintain regular
sleep patterns with 7 to 9 h of sleep the night before the test. In
patients, the results were only analysed after a minimum of 2 days
of seizure freedom on either side of the study was confirmed. This was
based on seizure diaries. No patients were excluded as a result of
seizures. In addition, no patient suffered a seizure during the TMS
study.
Each participant was given a unique alpha numeric code. This was
the only identifying feature on the TMS data acquired. The analysis
was performed after all participants had been tested. This ensured that
the investigator analysing the TMS results was blinded to clinical
information during the analysis.
Statistical analysisThe results from patients with generalized epilepsy, non-epilepsy con-
trol subjects and all their respective siblings were analysed according
to hemisphere dominance. This was assessed using the Edinburgh
Handedness Inventory (Oldfield, 1971). In patients with focal epilepsy
the results were analysed according to the ipsilateral (hemisphere with
presumed seizure focus) and contralateral hemisphere. This was based
on electroclinical and imaging findings.
Intergroup comparisons between clinical features (age, age at onset
of seizures, gender and seizure frequency) and anti-epileptic drug type
with change in cortical excitability was performed using paired t-test
and the chi-square test. This was done for each subgroup within each
syndrome and the homologous subgroup in the other syndromes
within its group (e.g. refractory juvenile myoclonic epilepsy with re-
fractory juvenile absence epilepsy and refractory generalized epilepsy
with tonic-clonic seizures etc.).
For cortical excitability measures (motor threshold and interstimulus
intervals) a two-way ANOVA was used. Each ANOVA had a between-
participants factor ‘group’ (patients and siblings of each group with
juvenile myoclonic epilepsy, juvenile absence epilepsy, generalized epi-
lepsy with tonic-clonic seizures, non-epilepsy control subjects and pa-
tients and siblings of each group with temporal lobe epilepsy,
extra-temporal lobe epilepsy, non-epilepsy) and a within-participant
factor ‘hemisphere’ (interhemispheric comparison).
For all analyses, P5 0.05 was chosen as the significance level.
Fisher’s Protected Least Significant Difference post hoc tests were
performed as appropriate. The analysis was performed on SPSS, 15.0
for Windows!.
The effect size was calculated for the significant results (motor
threshold and each interstimulus interval) using the formula:
Effect size = mean of siblings " mean of non-epilepsy controls /
standard deviation of non-epilepsy controls
The same formula was used comparing patients in each group to
their respective siblings, where siblings were considered the control
group.
Effect size 0.2 was considered small, 0.5 medium and 5 0.8 large
(Cohen, 1969).
Results
Electroclinical findingsThere were no intergroup differences in age, gender, age of
seizure onset, seizure frequency or different combinations of the
anti-epileptic drugs used in any of the patient sub-groups. There
were also no intergroup differences in age and gender between
patients and their respective siblings or between any of the sibling
groups (Table 1).
Table 3 summarizes the EEG findings recorded from each
patient group and their respective siblings on the day TMS was
performed.
Cortical excitability measuresThe results from both hemispheres were analysed in all patients.
The only group that showed interhemispheric differences was the
drug naıve new onset focal epilepsy group. In all the others, there
were no interhemispheric differences. Consequently the results of
both hemispheres will only be shown for the focal epilepsy groups.
For the remaining groups (generalized epilepsy and non-epilepsy
control subjects and their respective siblings) only the results of the
dominant hemisphere are shown.
The results in patients with different epilepsy syndromes are not
the subject of this paper and will be presented in detail and dis-
cussed in a separate report. Here they are shown for reference
only and are summarized in Table 4.
Cortical excitability amongst siblings in healthynon-epilepsy control subjects
The control group showed the expected results in both the short
and long interstimulus interval recovery curves, with inhibition of
the test response at interstimulus intervals 2 and 5 ms and facili-
tation at interstimulus intervals 10 and 15 ms, and test responses
approaching unity at all the tested long interstimulus intervals.
There was no difference between control subjects and their
siblings in motor threshold (Table 4) or at any interstimulus
interval (Fig. 1).
Cortical excitability in siblings of patients with different‘genetic’ generalized epilepsy syndromes
Motor threshold
The only difference in motor threshold was observed between
patients in the drug naıve new onset juvenile myoclonic epilepsy
Cortical excitability in the epileptic trait Brain 2013: Page 5 of 15 | 5
by guest on March 13, 2013
http://brain.oxfordjournals.org/D
ownloaded from

group and their siblings (Table 5). Motor threshold was lower
(denoting increased excitability) in patients compared with their
siblings. There were no other differences in motor threshold be-
tween the patients and their siblings in the other two juvenile
myoclonic epilepsy groups or in any of the groups with juvenile
absence epilepsy or generalized epilepsy with tonic-clonic seizures.
There were no intergroup differences in motor threshold be-
tween the siblings of any of the generalized epilepsy groups or
on comparison with non-epilepsy control subjects (Table 5).
Intracortical inhibition and facilitation
Comparison with non-epilepsy control subjects
An increase in cortical excitability was observed on comparing
patients’ siblings and non-epilepsy control subjects at the short
interstimulus interval 2 ms (P50.05, effect sizes 0.2–0.4) and
long interstimulus intervals 150, 250 and 300 ms (P50.05,
effect sizes 0.3–0.7), being most prominent in siblings of patients
with juvenile myoclonic epilepsy, more so those with refractory
seizures (Fig. 2).
Comparison with patients with generalized epilepsy
In the drug naıve-new onset groups, cortical excitability was
higher in patients compared with their siblings at the 150, 250
and 300 ms interstimulus intervals (P5 0.01, effect sizes ranging
0.5–0.7; maximum in juvenile myoclonic epilepsy). There were no
other differences at any of the short or remaining long interstimu-
lus intervals (Fig. 2).
In patients with refractory seizures, cortical excitability was
higher at all the long interstimulus intervals in patients compared
with their siblings (P5 0.01, effect sizes ranging 0.4–0.9; max-
imum in juvenile myoclonic epilepsy; Fig. 2). There were no dif-
ferences at any of the short interstimulus intervals.
There were no differences at any interstimulus interval between
seizure free patients with juvenile myoclonic epilepsy, juvenile
absence epilepsy or generalized epilepsy with tonic-clonic seizures
and their respective siblings (Fig. 2).
There were no intergroup differences at any interstimulus
interval between the siblings of any of the generalized epilepsy
groups.
Cortical excitability in siblings of patients with differentfocal epilepsy syndromes
Motor threshold
There were no differences between any of the patient groups with
either temporal lobe epilepsy or extra-temporal lobe epilepsy and
their respective siblings.
There was no intergroup difference in motor threshold between
the siblings of any of the focal epilepsy groups or on comparison
with non-epilepsy control subjects (Table 5).
Intracortical inhibition and facilitation
There were no interhemispheric differences in the siblings of either
group (temporal lobe epilepsy or extra-temporal lobe epilepsy).
Comparison with non-epilepsy control subjects
An increase in cortical excitability was observed on comparing
patient’s siblings and non-epilepsy control subjects at the long
interstimulus intervals 250 and 300 ms (P50.05, effect sizes
0.3–0.6), being most prominent in siblings of patients with refrac-
tory seizures in both groups (Fig. 3).
Comparison with patients with focal epilepsy
In the drug naıve-new onset groups, cortical excitability was
higher in the ipsilateral hemispheres of patients (both temporal
lobe epilepsy and extra-temporal lobe epilepsy) compared with
both hemispheres of their siblings at the 250 and 300 ms
interstimulus intervals (P50.05, effect sizes ranging 0.3–0.6).
There were no other differences at any of the short or remaining
Table 3 Percentage of participants with EEG abnormalities recorded on the day of the TMS test in each group
Group Subgroup Per cent withdefinite epileptiformdischarges
Per cent withnon-specificabnormalities
Juvenile myoclonic epilepsy Drug naıve, new onset 71 (12) 29 (18)Refractory seizures 83 (13) 17 (20)
Seizure free 42 (11) 44 (18)
Juvenile absence epilepsy Drug naıve, new onset 75 (11) 25 (18)Refractory seizures 75 (11) 25 (20)
Seizure free 41 (9) 42 (15)
Generalized epilepsy with tonic-clonic seizures Drug naıve, new onset 57 (8) 43 (14)Refractory seizures 71 (10) 29 (10)
Seizure free 38 (8) 30 (9)
Temporal lobe epilepsy Drug naıve, new onset 23 (0) 40 (14)Refractory seizures 36 (7) 42 (12)
Seizure free 15 (0) 21 (15)
Extra-temporal lobe epilepsy Drug naıve, new onset 23 (0) 30 (11)Refractory seizures 33 (7) 36 (14)
Seizure free 17 (0) 27 (11)
Values refer to patients and numbers in brackets refer to siblings. Definite epileptiform discharges included spike or poly-spike-waves, sharp-slow waves and temporalintermittent rhythmic delta activity. Non-specific abnormalities included slowing (diffuse or lateralized) and/or sharp waves.
6 | Brain 2013: Page 6 of 15 R. A. B. Badawy et al.
by guest on March 13, 2013
http://brain.oxfordjournals.org/D
ownloaded from

Tab
le4
Mai
nTM
Sfi
ndin
gs
inal
lth
epat
ient
gro
ups
and
thei
rre
spec
tive
sibli
ngs
Gro
up
Subgro
up
Pat
ients
Sibli
ngs
Moto
rth
resh
old
Pai
red-p
uls
eTM
SM
oto
rth
resh
old
Pai
red-p
uls
eTM
S
JME
Dru
gnaı
ve,
new
onse
tD
ecre
ased
Incr
ease
dex
cita
bili
tyat
the
2an
d5
ms
and
150,2
50
and
300
ms
ISIs
com
par
edw
ith
JAE
and
GE-
TC
San
dco
ntr
ols
.
–In
crea
sed
exci
tabili
tyat
the
2an
d5
ms
and
150,
250
and
300
ms
ISIs
com
par
edw
ith
contr
ols
.D
ecre
ased
exci
tabili
tyat
the
150,
250
and
300
ms
ISI
com
par
edw
ith
pat
ients
.N
odiffe
rence
sin
short
ISIs
com
par
edw
ith
pat
ients
.R
efra
ctory
seiz
ure
s–
Incr
ease
dex
cita
bili
tyat
the
2an
d5
ms
and
alllo
ng
ISIs
com
par
edw
ith
JAE
and
GE-
TC
San
dco
ntr
ols
.–
Incr
ease
dex
cita
bili
tyat
the
2an
d5
ms
and
150,
250
and
300
ms
ISIs
com
par
edw
ith
contr
ols
.D
ecre
ased
exci
tabili
tyat
alll
ong
ISIs
com
par
edw
ith
pat
ients
.N
odiffe
rence
sin
short
ISIs
com
par
edw
ith
pat
ients
.Se
izure
free
–In
crea
sed
exci
tabili
tyat
the
150,2
50
and
300
ms
ISIs
com
par
edw
ith
contr
ols
.–
Incr
ease
dex
cita
bili
tyat
the
2an
d5
ms
and
150,
250
and
300
ms
ISIs
com
par
edw
ith
contr
ols
.N
odiffe
rence
sin
short
or
long
ISIs
com
par
edw
ith
pat
ients
.JA
ED
rug
naı
ve,
new
onse
t–
Incr
ease
dex
cita
bili
tyat
the
2an
d5
ms
and
150,2
50
and
300
ms
ISIs
com
par
edw
ith
contr
ols
.–
Incr
ease
dex
cita
bili
tyat
the
2an
d5
ms
and
150,
250
and
300
ms
ISIs
com
par
edw
ith
contr
ols
.D
ecre
ased
exci
tabili
tyat
the
150,
250
and
300
ms
ISI
com
par
edw
ith
pat
ients
.N
odiffe
rence
sin
short
ISIs
com
par
edw
ith
pat
ients
.R
efra
ctory
seiz
ure
s–
Incr
ease
dex
cita
bili
tyat
the
2an
d5
ms
and
alllo
ng
ISIs
com
par
edw
ith
contr
ols
.–
Incr
ease
dex
cita
bili
tyat
the
2an
d5
ms
and
150,
250
and
300
ms
ISIs
com
par
edw
ith
contr
ols
.D
ecre
ased
exci
tabili
tyat
alll
ong
ISIs
com
par
edw
ith
pat
ients
.N
odiffe
rence
sin
short
ISIs
com
par
edw
ith
pat
ients
.Se
izure
free
–In
crea
sed
exci
tabili
tyat
the
250
and
300
ms
ISIs
com
par
edw
ith
contr
ols
.–
Incr
ease
dex
cita
bili
tyat
the
2an
d5
ms
and
150,
250
and
300
ms
ISIs
com
par
edw
ith
contr
ols
.N
odiffe
rence
sin
short
or
long
ISIs
com
par
edw
ith
pat
ients
.G
E-TC
SD
rug
naı
ve,
new
onse
tIn
crea
sed
exci
tabili
tyat
the
2an
d5
ms
and
150,2
50
and
300
ms
ISIs
com
par
edw
ith
contr
ols
.In
crea
sed
exci
tabili
tyat
the
2an
d5
ms
and
150,
250
and
300
ms
ISIs
com
par
edw
ith
contr
ols
.D
ecre
ased
exci
tabili
tyat
the
150,
250
and
300
ms
ISI
com
par
edw
ith
pat
ients
.N
odiffe
rence
sin
short
ISIs
com
par
edw
ith
pat
ients
.
(continued
)
Cortical excitability in the epileptic trait Brain 2013: Page 7 of 15 | 7
by guest on March 13, 2013
http://brain.oxfordjournals.org/D
ownloaded from

Tab
le4
Conti
nued
Gro
up
Subgro
up
Pat
ients
Sibli
ngs
Moto
rth
resh
old
Pai
red-p
uls
eTM
SM
oto
rth
resh
old
Pai
red-p
uls
eTM
S
Ref
ract
ory
seiz
ure
s–
Incr
ease
dex
cita
bili
tyat
the
2an
d5
ms
and
alllo
ng
ISIs
com
par
edw
ith
contr
ols
.–
Incr
ease
dex
cita
bili
tyat
the
2an
d5
ms
and
150,
250
and
300
ms
ISIs
com
par
edw
ith
contr
ols
.D
ecre
ased
exci
tabili
tyat
alll
ong
ISIs
com
par
edw
ith
pat
ients
.N
odiffe
rence
sin
short
ISIs
com
par
edw
ith
pat
ients
.Se
izure
free
–In
crea
sed
exci
tabili
tyat
the
250
and
300
ms
ISIs
com
par
edw
ith
contr
ols
.–
Incr
ease
dex
cita
bili
tyat
the
2an
d5
ms
and
150,
250
and
300
ms
ISIs
com
par
edw
ith
contr
ols
.N
odiffe
rence
sin
short
or
long
ISIs
com
par
edw
ith
pat
ients
.TLE
Dru
gnaı
ve,
new
onse
tIn
crea
sed
inip
sila
tera
lhem
ispher
eIn
crea
sed
exci
tabili
tyat
the
2an
d5
ms
asw
ella
s250
and
300
ms
ISIs
inip
sila
tera
lhem
ispher
eco
mpar
edw
ith
contr
alat
eral
hem
ispher
ean
dco
ntr
ols
.
Incr
ease
dex
cita
bili
tyat
the
250
and
300
ms
ISIs
com
par
edw
ith
contr
ols
.D
ecre
ased
exci
tabili
tyat
the
250
and
300
ms
ISI
com
par
edw
ith
ipsi
late
ralhem
ispher
ein
pat
ients
.N
odiffe
rence
sin
short
ISIs
com
-par
edw
ith
eith
erhem
ispher
ein
pat
ients
.R
efra
ctory
seiz
ure
sIn
crea
sed
inboth
hem
ispher
esIn
crea
sed
exci
tabili
tyat
the
2an
d5
ms
and
alllo
ng
ISIs
inboth
hem
ispher
esco
mpar
edw
ith
contr
ols
.–
Incr
ease
dex
cita
bili
tyat
the
250
and
300
ms
ISIs
com
par
edw
ith
contr
ols
.D
ecre
ased
exci
tabili
tyat
alll
ong
ISIs
com
par
edw
ith
both
hem
ispher
esin
pat
ients
.N
odiffe
rence
sin
short
ISIs
com
par
edw
ith
pat
ients
.Se
izure
free
Incr
ease
din
both
hem
ispher
esIn
crea
sed
exci
tabili
tyat
the
250
ms
ISI
inth
eip
si-
late
ralhem
ispher
eco
mpar
edw
ith
contr
ols
.No
diffe
rence
sco
mpar
edw
ith
contr
ols
atsh
ort
ISIs
inei
ther
hem
ispher
e.
–In
crea
sed
exci
tabili
tyat
the
250
and
300
ms
ISIs
com
par
edw
ith
contr
ols
.N
odiffe
rence
sin
short
or
long
ISIs
com
par
edw
ith
eith
erhem
ispher
ein
pat
ients
.Ex
tra-
TLE
Dru
gnaı
ve,
new
onse
t–
Incr
ease
dex
cita
bili
tyat
the
250
and
300
ms
ISIs
inip
sila
tera
lhem
ispher
eco
mpar
edw
ith
contr
alat
eral
hem
ispher
e.
–In
crea
sed
exci
tabili
tyat
the
250
and
300
ms
ISIs
com
par
edw
ith
contr
ols
.D
ecre
ased
exci
tabili
tyat
the
250
and
300
ms
ISI
com
par
edw
ith
ipsi
late
ralhem
ispher
ein
pat
ients
.In
crea
sed
exci
tabili
tyat
the
2an
d5
ms
asw
ellas
250
and
300
ms
ISIs
inip
sila
tera
lhem
ispher
eco
mpar
edw
ith
contr
ols
.N
odiffe
rence
sin
short
ISIs
com
par
edw
ith
eith
erhem
ispher
ein
pat
ients
.R
efra
ctory
seiz
ure
sIn
crea
sed
inboth
hem
ispher
esIn
crea
sed
exci
tabili
tyat
the
2an
d5
ms
and
alllo
ng
ISIs
inboth
hem
ispher
esco
mpar
edw
ith
contr
ols
.–
Incr
ease
dex
cita
bili
tyat
the
250
and
300
ms
ISIs
com
par
edw
ith
contr
ols
.D
ecre
ased
exci
tabili
tyat
alll
ong
ISIs
com
par
edw
ith
both
hem
ispher
esin
pat
ients
.N
odiffe
rence
sin
short
ISIs
com
par
edw
ith
pat
ients
.Se
izure
free
Incr
ease
din
both
hem
ispher
esIn
crea
sed
exci
tabili
tyat
the
250
ms
ISI
inth
eip
si-
late
ralhem
ispher
eco
mpar
edw
ith
contr
ols
.–
Incr
ease
dex
cita
bili
tyat
the
250
and
300
ms
ISIs
com
par
edw
ith
contr
ols
.N
odiffe
rence
sin
short
or
long
ISIs
com
par
edw
ith
eith
erhem
ispher
ein
pat
ients
.N
odiffe
rence
sco
mpar
edw
ith
contr
ols
atsh
ort
ISIs
inei
ther
hem
ispher
e.
GE-
TC
S=
gen
eral
ized
epile
psy
with
tonic
-clo
nic
seiz
ure
s;IS
I=in
ters
tim
ulu
sin
terv
al;
JAE
=ju
venile
abse
nce
epile
psy
;JM
E=
juve
nile
myo
clonic
epile
psy
;TLE
=te
mpora
llo
be
epile
psy
.
8 | Brain 2013: Page 8 of 15 R. A. B. Badawy et al.
by guest on March 13, 2013
http://brain.oxfordjournals.org/D
ownloaded from

long interstimulus intervals (Fig. 3). There were no differences be-
tween the contralateral hemispheres and either hemisphere in their
siblings.
In patients with refractory seizures, cortical excitability was
higher in both hemispheres at all the long interstimulus intervals
in patients with temporal lobe epilepsy and extra-temporal lobe
epilepsy compared with their siblings (P5 0.01, effect sizes
ranging 0.4–0.7; Fig. 3). There were no differences at any of
the short interstimulus intervals.
There were no differences at any interstimulus interval between
seizure free patients with temporal lobe epilepsy or extra-temporal
lobe epilepsy and their respective siblings (Fig. 3).
There was no inter-group difference at any interstimulus interval
between the siblings of any of the focal epilepsy groups.
Table 5 Motor threshold (mean # SD) for each participant group (patients and control subjects) and theirsiblings
Group Subgroup Participants /patientsmotor threshold(stimulusintensity %)
Siblings motorthreshold(stimulusintensity %)
Non-epilepsy controls 55.4 # 5.7 54.9 # 4.8
Juvenile myoclonic epilepsy Drug naıve, new onset 49.3 # 7.1 54.2 # 5.5Refractory seizures 53.8 # 5.2 55.0 # 5.2
Seizure free 56.4 # 7.1 54.6 # 6.6
Juvenile absence epilepsy Drug naıve, new onset 54.7 # 5.3 55.2 # 6.2Refractory seizures 55.3 # 5.5 56.2 # 4.7
Seizure free 56.9 # 4.8 55.6 # 6.4
Generalized epilepsy withtonic-clonic seizures
Drug naıve, new onset 53.9 # 7.9 53.7 # 4.6Refractory seizures 55.7 # 4.6 53.9 # 7.3
Seizure free 57.1 # 3.7 55.9 # 5.6
Temporal lobe epilepsy Drug naıve, new onset Hemisphere A 59.4 # 5.8 53.4 # 6.3Hemisphere B 54.2 # 5.7 55.1 # 3.9
Refractory seizures Hemisphere A 60.6 # 5.2 52.7 # 6.6Hemisphere B 60.7 # 4.8 55.8 # 7.0
Seizure free Hemisphere A 62.6 # 5.1 54.9 # 5.6Hemisphere B 60.9 # 5.7 55.7 # 6.1
61.1 # 4.9 55.2 # 5.6
Extra-temporal lobe epilepsy Drug naıve, new onset Hemisphere A 57.3 # 6.1 54.8 # 6.2Hemisphere B 55.5 # 5.6 55.1 # 7.3
Refractory seizures Hemisphere A 61.1 # 4.8 52.7 # 5.5Hemisphere B 60.5 # 6.3 53.5 # 6.4
Seizure free Hemisphere A 63.0 # 5.9 52.9 # 7.6Hemisphere B 61.7 # 5.9 54.6 # 4.9
Hemisphere A = the ipsilateral hemisphere (hemisphere with seizure focus) in patients and the dominant hemisphere in siblings; Hemisphere B = thecontralateral hemisphere in patients and the non-dominant hemisphere in siblings.
Figure 1 Short and long interstimulus interval (ISI) recovery curves with error bars for the dominant hemisphere in non-epilepsy controlsubjects and their siblings. Ratios 5100% indicate inhibition and ratios 4100% indicate facilitation. CR = conditioning response;MEP = motor evoked potential; TR = test response.
Cortical excitability in the epileptic trait Brain 2013: Page 9 of 15 | 9
by guest on March 13, 2013
http://brain.oxfordjournals.org/D
ownloaded from

Figure 2 Short and long interstimulus interval (ISI) recovery curves with error bars for the dominant hemisphere in patients withgeneralized epilepsy and their siblings. Ratios 5100% indicate inhibition and ratios 4100% indicate facilitation. The upper boundary ofthe grey shaded area represents non-epilepsy controls. GE-TCS = generalized epilepsy with tonic-clonic seizures; JAE = juvenile absenceepilepsy; JME = juvenile myoclonic epilepsy; TLE = temporal lobe epilepsy.
10 | Brain 2013: Page 10 of 15 R. A. B. Badawy et al.
by guest on March 13, 2013
http://brain.oxfordjournals.org/D
ownloaded from

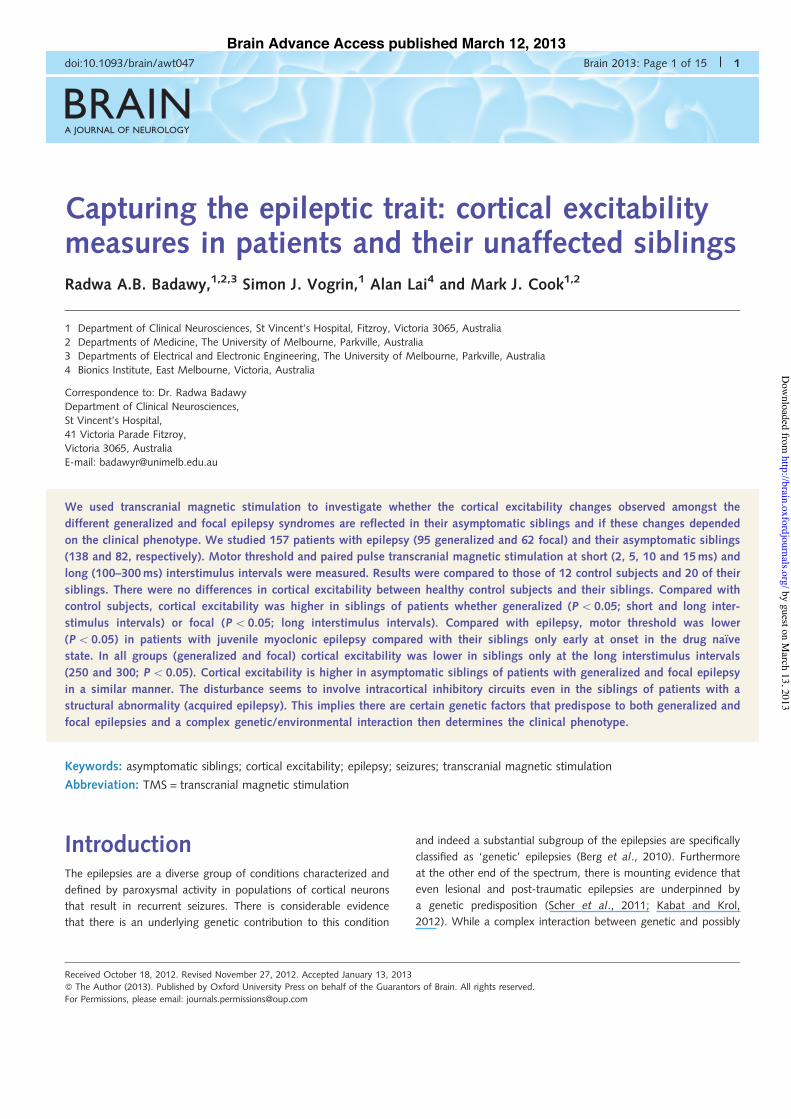
Figure 3 Short and long ISI recovery curves with error bars for both hemispheres in patients with focal epilepsy and their siblings. Ratios5100% indicate inhibition and ratios 4100% indicate facilitation. Hemisphere A = the ipsilateral hemisphere (hemisphere with seizurefocus) in patients and the dominant hemisphere in siblings. Hemisphere B = the contralateral hemisphere in patients and the non-dominanthemisphere in siblings. The upper boundary of the grey shaded area represents non-epilepsy controls. GE-TCS = generalized epilepsy withtonic-clonic seizures; JAE = juvenile absence epilepsy; JME = juvenile myoclonic epilepsy; TLE = temporal lobe epilepsy.
Cortical excitability in the epileptic trait Brain 2013: Page 11 of 15 | 11
by guest on March 13, 2013
http://brain.oxfordjournals.org/D
ownloaded from

DiscussionIn the present study we report that asymptomatic/unaffected sib-
lings of patients with epilepsy have a similar cortical excitability
profile to their affected siblings. We found evidence of cortical
hyper-excitability in the asymptomatic siblings of patients with
various types of generalized and focal epilepsy, being more prom-
inent in siblings of patients with generalized epilepsy syndromes.
This suggests an underlying increased susceptibility for a lowered
seizure threshold in families with epilepsy.
Electroencephalography abnormalitiesWhile the current investigation concentrated on using TMS to
study cortical excitability, we also conducted a routine EEG on
patients on the day of study and the results of those studies
also revealed aspects of increased excitability. We found
epileptiform discharges in the EEG of 83% of patients with gen-
eralized epilepsy and 30% of patients with focal epilepsy. This is
similar to previous reports (Goodin and Aminoff, 1984; Gregory
et al., 1993; Glick, 2002). Also as expected, the percentage was
highest in juvenile myoclonic epilepsy, and in all groups was more
frequently seen in patients with refractory seizures (Sundaram
et al., 1990).
Furthermore, in asymptomatic siblings definite epileptiform dis-
charges were recorded in up to 13% and non-specific abnormal-
ities were found in a further 20%. Again this was more common
in the siblings of patients with juvenile myoclonic epilepsy and
notably in most groups was more common if the patients were
refractory. These findings of increased prevalence of interictal epi-
leptiform discharges in siblings of patients with epilepsy is similar
to that reported elsewhere (Doose et al., 1977; Atakli et al., 1999;
Akgun et al., 2009). Abnormalities were reported in many more
siblings of patients with generalized (50%) and focal epilepsy
(33%) in an earlier study (Rodin and Gonzalez, 1966). This
latter study, however, did not categorize the abnormalities into
definitely epileptiform and non-specific categories, and this could
explain the higher incidence. It is known that !10% of normal
people may have non-specific EEG abnormalities and !1% may
have epileptiform paroxysmal activity without seizures (Gregory
et al., 1993). Thus our results indicate a much higher prevalence
of epileptiform discharges in families with epilepsy compared with
the general population and suggest an underlying increased excit-
ability in those cohorts. The substrate underlying this increase in
cortical excitability was investigated using TMS to quantify motor
threshold as well as intracortical inhibition and facilitation (using
short and long recovery curves).
Patterns of disturbances in corticalexcitabilityIn the current study, cortical excitability was higher in patients
with juvenile myoclonic epilepsy compared with the other two
generalized epilepsy syndromes. This effect was not replicated in
the siblings of these cohorts who all showed a similar increase in
cortical excitability regardless of syndrome. In all groups with
generalized epilepsy the siblings showed increased cortical excit-
ability at the short interstimulus intervals of 2 and 5 ms and the
long interstimulus intervals 150, 250 and 300 ms compared with
control subjects. Cortical excitability was lower at the same long
interstimulus intervals in siblings compared with patients, with no
differences at short interstimulus intervals observed. These find-
ings indicate that there is indeed a degree of cortical
hyper-excitability or defective inhibition in siblings of patients
with generalized epilepsy regardless of type of syndrome.
Similarly, despite the differences at least in the early drug
naıve state between patients with temporal lobe epilepsy and
extra-temporal lobe epilepsy, cortical excitability is increased in
the siblings of these two cohorts in a similar manner. It was only
observed in the long interstimulus intervals of 250 and 300 ms
compared with control subjects. But when compared with pa-
tients, there were also no differences at any of the short inter-
stimulus intervals suggesting a mild degree of hyperexcitability at
the short interstimulus intervals, although it is not as prominent
as that observed in generalized epilepsies. In addition, as seen in
the figures, in control participants, the long recovery curve
showed a small peak at 200 ms, with a dip at 250 ms and a
gradual increase toward the end of the curve. This pattern was
absent in the siblings of patients (generalized and focal) where a
pattern similar to that observed in drug naıve patients (uninflu-
enced by the effects of anti-epileptic drugs or chronic seizures)
was seen. In both those cohorts, the measures at 200 ms re-
mained fairly constant (at !100% regardless of group), and
cortical excitability at the 250–300 ms interstimulus interval
increased significantly.
Increased excitability at interstimulus intervals of 2–5 ms most
likely represents defective GABAA mediated mechanisms
(Boroojerdi, 2002) whereas the increase at the longer interstimulus
intervals is most likely mediated by GABAB circuits (Mott and
Lewis, 1994; McDonnell et al., 2007; Florian et al., 2008). The
findings thus indicate defective function within inhibitory circuits
that is likely mediated through abnormal genetic mechanisms.
These abnormalities are not only present in generalized epilepsies
with a presumed genetic basis, but also in patients with focal
epilepsy resulting from a clear structural abnormality known to
provoke seizures. This confirms the postulated overlap in the neu-
rodevelopmental genes responsible for both brain structure and
the expression of the disease in patients with lesional and
post-traumatic epilepsies (Scher et al., 2011; Kabat and Krol,
2012).
The findings suggest that there are both shared and distinct
genetic components across generalized and focal epilepsy syn-
dromes. Furthermore, given that the vast majority of relatives of
patients with epilepsy are clinically healthy (all the siblings inves-
tigated in our study were asymptomatic) it would appear that the
inheritable genetic trait alone is insufficient to determine the
phenotypic presentation, other factors be they environmental or
acquired play a role as well.
Studies have shown that although the risk of seizures is higher
in first-degree relatives of patients with idiopathic epilepsies than
in those of patients with symptomatic epilepsies, the risk is still
higher in the latter than in the relatives of control subjects
(Ottman et al., 1996). In animal models, the expression of
12 | Brain 2013: Page 12 of 15 R. A. B. Badawy et al.
by guest on March 13, 2013
http://brain.oxfordjournals.org/D
ownloaded from

GABAA receptor subunits have been shown to occur before the
development of seizures, suggesting that these changes are causa-
tive and that alterations in receptor density occur when seizures
are established (Brooks-Kayal et al., 1998). Moreover, age de-
pendence of such changes has been observed (Zhang et al.,
2004). Clinical studies of families that have ‘idiopathic epilepsies’,
including some with genes of large effect, can show diverse
phenotypes. This demonstrates that factors other than the ‘epi-
lepsy genes’—be they acquired factors or modifier genes—in part
determine the phenotype (Scheffer and Berkovic, 1997). The role
of minor acquired factors (e.g. breech birth and minor head inju-
ries), acting on a presumed genetic predisposition, is the most
contentious (Deymeer and Leviton, 1985). Thus, non-genetic fac-
tors might well contribute to epilepsies that have a predominant
genetic aetiology; however, the nature and attributable risk of
those factors has not yet been elucidated (Berkovic et al., 2006).
Another interesting finding in our focal epilepsy cohorts was
that cortical excitability increased in both hemispheres in siblings
whereas in drug naıve patients with new onset epilepsy, cortical
excitability measures in the unaffected hemisphere did not differ
compared with control subjects. Cortical excitability measures in
that hemisphere were only abnormal in patients with refractory
seizures. The lack of lateralization in siblings suggest that in these
patients cortical excitability changes are not reflective of focal
structural abnormalities but merely as the partial expression of a
more diffuse disturbance of excitability within neuronal networks.
It would appear that at least early in the course of the disease and
prior to the detrimental effect of recurrent seizures, cortical excit-
ability decreases in the unaffected hemisphere possibly as a pro-
tective mechanism to prevent seizure spread. This effect is lost
with time as a result of recurrent seizures or even (less likely)
may be the cause of more seizures. The relationship of neuronal
plasticity to epilepsy is complex, with evidence that seizures them-
selves can alter ion channel gene expression and subunit stoichi-
ometry (Shah et al., 2004; Brewster et al., 2005), and that
resistance to anti-epileptic drugs might be associated with alter-
ation in the function of various channels (Remy and Beck, 2006).
Further support for this comes from our recent findings of pro-
gressive changes in cortical excitability associated with refractory
seizures (Badawy et al., 2013). This may be why patients with a
seemingly identical diagnosis and drug choice are refractory to
medication while others become seizure free.
Figure 4 Schematic illustrating the proposed interaction underlying the epileptic phenotypic presentation. AEDs = anti-epileptic drugs.
Cortical excitability in the epileptic trait Brain 2013: Page 13 of 15 | 13
by guest on March 13, 2013
http://brain.oxfordjournals.org/D
ownloaded from

Concluding remarksAn underlying genetic susceptibility for patients to develop
epilepsy has been noted from a number of epidemiological studies,
and is supported by direct measurement of cortical excitability
using TMS. The evidence suggests that while epilepsy is a multi-
factorial condition, it appears to be unified by channel dysfunction
and in turn implicates genes at some basic level, even for the
lesional cases. As summarized in Fig. 4, a seizure is often triggered
by an initial precipitating event such as an acquired insult or other
environmental factors known to be associated with increased like-
lihood of seizure expression. This underlying genetic susceptibility
for seizures subsequent to the initial event is prone to increase,
and hence be represented as an epilepsy syndrome. The pheno-
typic presentation, however, including the frequency of seizures, is
an intrinsically complex interaction of various factors including
genetic dysfunction, actions of anticonvulsants and their efficacy,
along with other concomitant environmental factors influencing
seizure susceptibility. The opportunities presented by TMS in
directly evoking features of these dynamic susceptibility processes
may further elucidate how transitions in clinical presentation are
characterized and lead to increased efficacy when tailoring
management for these often complex syndromes.
AcknowledgementsWe wish to thank Dr Ingo Helbig for the initial formulation of the
study, Dr Wendyl D’Souza, Dr Michael Tan and Dr Karen Fuller
for their help in recruiting the patients and facilitating access to
their electro-clinical and imaging findings, Ms Agnes Iwasiw from
JLM Accutek Health Care for providing the TMS equipment,
Dr Danny Flanagan for his incredible support during all the
phases of the study, Mrs Shireen Cook, Professor David
Grayden, Mr Tim Nelson, Mr Richard Balson, Miss Nicola Beattie
and Mr Dean Freestone for the administrative and technical sup-
port they provided throughout the study, the EEG technicians at
St Vincent’s Hospital and the participants for their time.
ReferencesAkgun Y, Soysal A, Atakli D, Yuksel B, Dayan C, Arpaci B. Cortical
excitability in juvenile myoclonic epileptic patients and their asymp-tomatic siblings: a transcranial magnetic stimulation study. Seizure2009; 18: 387–91.
Atakli D, Soysal A, Atay T, Altintas H, Arpaci B, Baybas S. Somatosensoryevoked potentials and EEG findings in siblings of juvenile myoclonicepilepsy patients. Epileptic Disord 1999; 1: 173–7.
Badawy RA, Curatolo JM, Newton M, Berkovic SF, Macdonell RA.Changes in cortical excitability differentiate generalized and focalepilepsy. Ann Neurol 2007; 61: 324–31.
Badawy RA, Jackson GD, Berkovic SF, Macdonell RA. Cortical excitabilityand refractory epilepsy; a three year longitudinal transcranial magneticstimulation study. Int J Neural Syst 2013; 23: 1250030.
Badawy RA, Macdonell RA, Berkovic SF, Newton MR, Jackson GD.Predicting seizure control: cortical excitability and antiepileptic medica-tion. Ann Neurol 2010; 67: 64–73.
Beaussart M, Loiseau P. Hereditary factors in a random population of5200 epileptics. Epilepsia 1969; 10: 55–63.
Berg AT, Berkovic SF, Brodie MJ, Buchhalter J, Cross JH, van Emde Boas W,et al. Revised terminology and concepts for organization of seizuresand epilepsies: report of the ILAE Commission on Classification andTerminology, 2005-2009. Epilepsia 2010; 51: 676–85.
Berkovic SF, Mulley JC, Scheffer IE, Petrou S. Human epilepsies: inter-action of genetic and acquired factors. Trends Neurosci 2006; 29:391–7.
Bianchi A, Viaggi S, Chiossi E. Family study of epilepsy in first degreerelatives: data from the Italian Episcreen Study. Seizure 2003; 12:203–10.
Boroojerdi B. Pharmacologic influences on TMS effects. J ClinNeurophysiol 2002; 19: 255–71.
Brewster AL, Bernard JA, Gall CM, Baram TZ. Formation of heteromerichyperpolarization–activated cyclic nucleotide-gated (HCN) channels inthe hippocampus is regulated by developmental seizures. NeurobiolDis 2005; 19: 200–7.
Brooks-Kayal AR, Shumate MD, Jin H, Rikhter TY, Coulter DA.Selective changes in single cell GABA(A) receptor subunit expressionand function in temporal lobe epilepsy. Nat Med 1998; 4:1166–72.
Burton PR, Tobin MD, Hopper JL. Key concepts in genetic epidemiology.Lancet 2005; 366: 941–51.
Cantello R, Civardi C, Cavalli A, Varrasi C, Tarletti R, Monaco F, et al.Cortical excitability in cryptogenic localization-related epilepsy: interic-tal transcranial magnetic stimulation studies. Epilepsia 2000; 41:694–704.
Cohen JB. Statistical power analysis for the behavioral sciences.New York: Academic Press; 1969.
Deymeer F, Leviton A. Perinatal factors and seizure disorders: an epide-miologic review. Epilepsia 1985; 26: 287–98.
Doose H, Gerken H, Kiefer R, Volzke E. Genetic factors in childhoodepilepsy with focal sharp waves. II. EEG findings in patients andsiblings. Neuropadiatrie 1977; 8: 10–20.
Garvey MA, Mall V. Transcranial magnetic stimulation in children.Clin Neurophysiol 2008; 119: 973–84.
Glick TH. The sleep-deprived electroencephalogram: evidence andpractice. Arch Neurol 2002; 59: 1235–9.
Goodin DS, Aminoff MJ. Does the interictal EEG have a role in thediagnosis of epilepsy? Lancet 1984; 1: 837–9.
Gregory RP, Oates T, Merry RT. Electroencephalogram epileptiformabnormalities in candidates for aircrew training. ElectroencephalogrClin Neurophysiol 1993; 86: 75–7.
Florian J, Muller-Dahlhaus M, Liu Y, Ziemann U. Inhibitory circuits andthe nature of their interactions in the human motor cortex a pharma-cological TMS study. J Physiol 2008; 586: 495–514.
Hamer HM, Reis J, Mueller HH, Knake S, Overhof M, Oertel WH, et al.Motor cortex excitability in focal epilepsies not including the primarymotor area—a TMS study. Brain 2005; 128 (Pt 4): 811–8.
Helbig I, Scheffer IE, Mulley JC, Berkovic SF. Navigating the channelsand beyond: unravelling the genetics of the epilepsies. Lancet Neurol2008; 7: 231–45.
Hesdorffer DC, Caplan R, Berg AT. Familial clustering of epilepsy andbehavioral disorders: evidence for a shared genetic basis. Epilepsia2012; 53: 301–7.
Kabat J, Krol P. Focal cortical dysplasia—review. Pol J Radiol 2012; 77:35–43.
Kwan P, Arzimanoglou A, Berg AT, Brodie MJ, Allen Hauser W,Mathern G, et al. Definition of drug resistant epilepsy: consensusproposal by the ad hoc Task Force of the ILAE Commission onTherapeutic Strategies. Epilepsia 2010; 51: 1069–77.
Kwan P, Brodie MJ. Early identification of refractory epilepsy. N EnglJ Med 2000; 342: 314–9.
Manganotti P, Bongiovanni LG, Zanette G, Fiaschi A. Early and lateintracortical inhibition in juvenile myoclonic epilepsy. Epilepsia 2000;41: 1129–38.
McDonnell MN, Orekhov Y, Ziemann U. Suppression of LTP-like plasti-city in human motor cortex by the GABAB receptor agonist baclofen.Exp Brain Res 2007; 180: 181–6.
14 | Brain 2013: Page 14 of 15 R. A. B. Badawy et al.
by guest on March 13, 2013
http://brain.oxfordjournals.org/D
ownloaded from

Mott DD, Lewis DV. The pharmacology and function of central GABABreceptors. Int Rev Neurobiol 1994; 36: 97–223.
Oldfield RC. The assessment and analysis of handedness: The Edinburghinventory. Neuropsychologia 1971; 9: 97–113.
Ottman R, Annegers JF, Risch N, Hauser WA, Susser M. Relations ofgenetic and environmental factors in the etiology of epilepsy. AnnNeurol 1996; 39: 442–9.
Quintana H. Transcranial magnetic stimulation in persons younger thanthe age of 18. J ECT 2005; 21: 88–95.
Remy S, Beck H. Molecular and cellular mechanisms of pharmacoresis-tance in epilepsy. Brain 2006; 129 (Pt 1): 18–35.
Reutens DC, Berkovic SF. Increased cortical excitability in generalisedepilepsy demonstrated with transcranial magnetic stimulation. Lancet1992; 339: 362–3.
Rodin E, Gonzalez S. Hereditary components in epileptic patients.Electroencephalogram family studies. JAMA 1966; 198: 221–5.
Rossini PM, Barker AT, Berardelli A, Caramia MD, Caruso G, Cracco RQ,et al. Non-invasive electrical and magnetic stimulation of the brain,spinal cord and roots: basic principles and procedures for routine clin-ical application. Report of an IFCN committee. Electroencephalogr ClinNeurophysiol 1994; 91: 79–92.
Rossini PM, Rossi S. Transcranial magnetic stimulation: diagnostic,therapeutic, and research potential. Neurology 2007; 68: 484–8.
Rothwell JC. Techniques and mechanisms of action of transcranial stimu-lation of the human motor cortex. J Neurosci Methods 1997; 74:113–22.
Scanlon C, Ronan L, Doherty CP, Cavalleri GL, Tirupati S, Alhusaini S,et al. MRI-based brain structure volumes in temporal lobe epilepsypatients and their unaffected siblings: a preliminary study.J Neuroimag 2013; 23: 64–70.
Scheffer IE, Berkovic SF. Generalized epilepsy with febrile seizures plus.A genetic disorder with heterogeneous clinical phenotypes. Brain 1997;120 (Pt 3): 479–90.
Scher AI, Wu H, Tsao JW, Blom HJ, Feit P, Nevin RL, et al. MTHFRC677T genotype as a risk factor for epilepsy including post-traumaticepilepsy in a representative military cohort. J Neurotrauma 2011; 28:1739–45.
Shah MM, Anderson AE, Leung V, Lin X, Johnston D. Seizure-inducedplasticity of h channels in entorhinal cortical layer III pyramidalneurons. Neuron 2004; 44: 495–508.
Sundaram M, Hogan T, Hiscock M, Pillay N. Factors affecting interictalspike discharges in adults with epilepsy. Electroencephalogr ClinNeurophysiol 1990; 75: 358–60.
Wandschneider B, Kopp UA, Kliegel M, Stephani U, Kurlemann G,Janz D, et al. Prospective memory in patients with juvenilemyoclonic epilepsy and their healthy siblings. Neurology 2010; 75:2161–7.
Werhahn KJ, Lieber J, Classen J, Noachtar S. Motor cortex excitability inpatients with focal epilepsy. Epilepsy Res 2000; 41: 179–89.
Zhang G, Raol YH, Hsu FC, Coulter DA, Brooks-Kayal AR. Effects ofstatus epilepticus on hippocampal GABAA receptors are age-dependent. Neuroscience 2004; 125: 299–303.
Cortical excitability in the epileptic trait Brain 2013: Page 15 of 15 | 15
by guest on March 13, 2013
http://brain.oxfordjournals.org/D
ownloaded from