Acute cerebellar ataxia: differential diagnosis and clinical ...
Upload
independentCategory
view
3download
0
Cerebellar development in childhood onset schizophrenia andnon-psychotic siblings
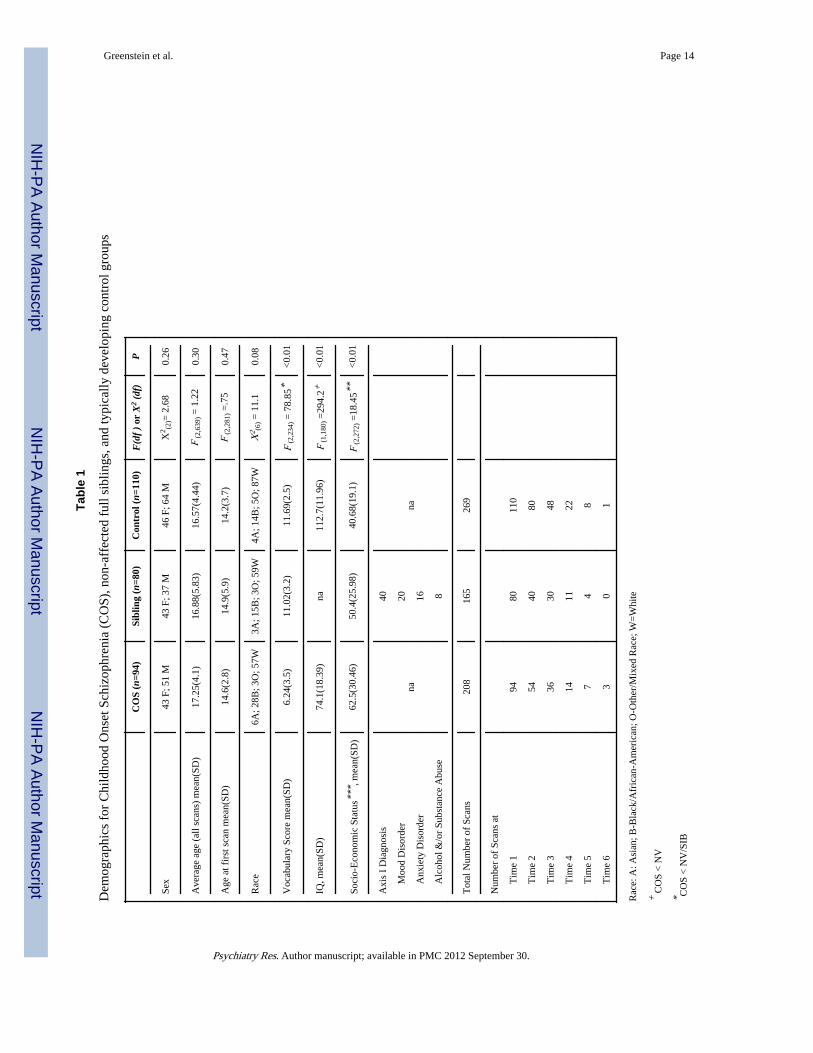
Deanna Greensteina, Rhoshel Lenroota,b,c, Liv Clausena, Nitin Gogtaya, and JudithRapoportaaChild Psychiatry Branch, NIMH/NIH, Bethesda, MDbSchool of Psychiatry, University of New South Wales, Randwick, New South WalescNeuroscience Research Australia, Sydney Australia
AbstractWe explored regional and total volumetric cerebellar differences in probands and their unaffectedfull siblings relative to typically developing participants. Participants included 94 (51 males)patients diagnosed with childhood onset schizophrenia (COS), 80 related non-psychotic siblings(37 males) and 110 (64 males) typically developing participants scanned longitudinally. Thesample mean age was 16.87(SD=4.7; range 6.5 to 29). We performed mixed model regressions toexamine group differences in trajectory and volume. The COS group had smaller bilateral anteriorlobes and anterior and total vermis volumes than controls. The COS group diverged from controlsover time in total, left, right, and bilateral posterior inferior cerebellum. Siblings did not have anyfixed volumetric differences relative to controls but differed from controls in developmentaltrajectories of total and right cerebellum, left inferior posterior, left superior posterior, andsuperior vermis. Results are consistent with previous COS findings and several reports ofdecreased cerebellar volume in adult onset schizophrenia. Sibling trajectories may represent a traitmarker, although the effect size for volumetric differences in early adulthood may be small.
KeywordsMRI; Psychosis; Neurodevelopment
1. IntroductionChildhood onset schizophrenia (COS) is a severe form of the disorder, often treatmentrefractory, and resembles poor outcome adult schizophrenia. Over the past 20 years, theNIMH COS project has documented developmental cortical brain abnormalities in COSwith COS cortical grey matter abnormalities in early adulthood resembling those seen inadult onset schizophrenia (Greenstein et al., 2006).
The cerebellum is also an important brain structure to explore in schizophrenia. It is nowseen as playing a role in cognition and behavior (Leiner et al., 1991; Andreasen and Pierson2008; Strick et al.2009), and cerebellar lesions have been shown to result in negative
Corresponding Author: Deanna Greenstein, Room 3N202 Building 10, Bethesda, MD 20892, [email protected].
Disclosures and acknowledgments: We have no conflicting or competing interests.
Publisher's Disclaimer: This is a PDF file of an unedited manuscript that has been accepted for publication. As a service to ourcustomers we are providing this early version of the manuscript. The manuscript will undergo copyediting, typesetting, and review ofthe resulting proof before it is published in its final citable form. Please note that during the production process errors may bediscovered which could affect the content, and all legal disclaimers that apply to the journal pertain.
NIH Public AccessAuthor ManuscriptPsychiatry Res. Author manuscript; available in PMC 2012 September 30.
Published in final edited form as:Psychiatry Res. 2011 September 30; 193(3): 131–137. doi:10.1016/j.pscychresns.2011.02.010.
NIH
-PA Author Manuscript
NIH
-PA Author Manuscript
NIH
-PA Author Manuscript

symptoms, and mood and behavior dysregulation (Tavano et al., 2007). Cross sectionalstructural MRI studies on adulthood onset schizophrenia (AOS) patients show mixed resultswith several studies reporting smaller volumes in the vermis, anterior, bilateral superiorposterior lobes, right and left hemispheres, and total volumes, and some reporting nosignificant results (see (Bottmer, Bachmann et al. 2005) for a review) (Gaser, Volz et al.1999; Okugawa, Nobuhara et al. 2007; Edwards, Newman et al. 2008; Tanskanen, Ridler etal. 2008; Thomann, Roebel et al. 2009). Notably, because there is only one longitudinalAOS study (Mane, Falcon et al. 2009), there is mimimal information regarding the evolutionof cerebellum abnormalities over time in adulthood. Earlier results from smaller subsamplesof COS patients included in the present study have supported progressive total cerebellarloss during adolescence as well as smaller total vermis and posterior lobe measures in COSpatients (Jacobsen, Giedd et al. 1997) (Keller, Castellanos et al. 2003). However, only oneof these studies was longitudinal, yielding a total of two reports of longitudinal cerebellardevelopment in schizophrenia.
In addition to the a paucity of information on subregional cerebellar developmental in theliterature, a second issue is the extent to which the brain changes seen in schizophreniaprobands at any age are trait markers or reflect the illness and/or its treatment. For example,twin studies indicate that some cortical abnormalities seen are illness related (Cannon,Thompson et al. 2002). One way of addressing this is the study of non-psychotic fullsiblings who share 50% of their genes with the probands but who have no clinical evidenceof schizophrenia or related disorders, and have never received treatment. A few studies haveinvestigated cerebellar abnormalities in nonpsychotic siblings of AOS probands (Staal,Hulshoff Pol et al. 2000; Honea, Meyer-Lindenberg et al. 2008), with one study reportingthat with relaxed significance level (p < 0.001, uncorrected), siblings have decreases in partsof the left cerebellum (Honea, Meyer-Lindenberg et al. 2008). The only study that hasexamined cerebellar development/change in this population (Brans, van Haren et al. 2008)did not report significant disease or familial effects with a 5-year follow-up in adulthood(mean age at baseline=41). Because early sibling gray matter differences appear tonormalize by early adulthood (Gogtay, Greenstein et al. 2007), it is especially important toexamine development from childhood through early adulthood to avoid false negatives.Also, NIMH developmental studies indicate that the cerebellum is among the last brainstructures to achieve adult volume (Tiemeier, Lenroot et al. 2009), and shows relativelylower heritability in childhood and adolescence (Wallace, Eric Schmitt et al. 2006). This hasled to speculation that the cerebellum may mediate later compensatory/adaptive plasticchanges in relation to pathology.
In the present study, longitudinal data were used to explore developmental cerebellardifferences in regional cerebellar volume between non-psychotic full siblings, affectedprobands, and age and sex matched controls. Based on a prospective study of corticaldevelopment in non-psychotic full siblings (Gogtay, Greenstein et al. 2007), wehypothesized that sibling cerebellar abnormalities in childhood would be diminished byearly adulthood. Based on our previous longitudinal study (Keller et al., 2003), wehypothesized that for total and regional cerebellar measures, the COS group would havesmaller volumes and would diverge from the control trajectory.
2. Methods2.1 Subjects
All probands are volunteers in an ongoing study of COS at the National Institute of MentalHealth and met DSM-IV criteria for schizophrenia with the onset of psychosis before their13th birthday. Exclusion criteria are a history of significant medical problems, substance
Greenstein et al. Page 2
Psychiatry Res. Author manuscript; available in PMC 2012 September 30.
NIH
-PA Author Manuscript
NIH
-PA Author Manuscript
NIH
-PA Author Manuscript
abuse, or a premorbid IQ below 70. Further details of patient selection are describedelsewhere (McKenna et al., 1994; Kumra et al., 1996).
In addition to following COS participants over time, we have also followed their siblings(SIB) at approximately two year intervals. Of the 127 full siblings in our study, 106 have notmet criteria for a schizophrenia spectrum disorder (schizophrenia, schizoaffective disorder,avoidant, paranoid and schizoid personality disorders), and 80 of these 106 have had at leastone passing scan between the ages of 6 and 30. Typically developing (TD) participants wereselected from a larger sample of volunteers recruited from the community as part of aprospective study of normal brain development (see Giedd 1999 for further details). TDparticipants were selected to match the COS and SIB groups for sex, age, and number ofrepeated scans. The distribution of age at scan was similar for COS, SIB and control groups.
2.2 MRI acquisitionT1-weighted images with contiguous 1.5-mm sections in the axial plane and 2.0-mmsections in the coronal plane were obtained using three-dimensional spoiled gradientrecalled echo in the steady state on a Signa 1.5-T scanner (General Electric MedicalSystems, Milwaukee, Wisconsin) (echo time=5 msec; repetition time=24 msec; flipangle=45°; acquisition matrix=256°×192; number of signals acquired=1; field of view=24cm). The original MR images were registered into standardized stereotaxic space using alinear transformation and corrected for nonuniformity artifacts (Sled, Zijdenbos et al. 1998).
We parcellated the cerebellum using the method developed by Pierson and colleagues at theUniversity of Iowa (Pierson, Corson et al. 2002) implemented in the BRAINS2 softwarepackage (Magnotta, Harris et al.). Briefly, trained tracers used 31 manually definedlandmarks in combination with a neural net algorithm to generate surface masks of eachcerebellar subregion. The surface masks were reviewed, edited manually, and subregionvolumes were measured and summed to provide the total cerebellar volume. The subregionswere created by dividing the left and right cerebellar cortices into anterior (lobules I–V anddelineated by the primary fissure), superior-posterior (lobule VI and crus I of VIIA,delineated in part by the by the horizontal fissure), and inferior-posterior lobes (lobulesVIIA-tuber through X) using the nomenclature of Larsell and Jansen (1972). The threehemispheric lobes consist predominantly of gray matter, although white matter branchingoff into the folia was included in the lobes.
The vermis was defined in each coronal slice by manual tracing with reference to guidetraces. A midline guide trace in the sagittal plane marked the superior, inferior, anterior, andposterior limits of the vermis, and guide traces in the axial plane were used to define thelateral borders. Regional subdivision was accomplished through placement of limitingboundaries in the sagittal plane, because the primary and prepyramidal fissures were readilyapparent throughout the vermis (Mackie et al., 2007).
2.3 ReliabilityAs was reported elsewhere (Mackie et al., 2007), for cerebellar lobes, initial intrarater andinterrater intraclass correlations (ICCs) were greater than 0.80 for all 5 tracers. For thevermis, initial intrarater ICCs were greater than 0.80, and interrater ICCs were greater than0.68. Following the initial phase of measuring, two tracers continued measuring cerebellarlobes over a four-year span. Longitudinal lobar (left and right anterior, superior posteriorand inferior posterior) intrarater ICCs over this period ranged from 0.69 (superior vermis) to0.99. All of these ICCs were approximately or at least 0.70, which is a qualitativelyacceptable (good) level of reliability (based on Fleiss (1986) who proposes a standard of0.40 to 0.75 as fair to good reliability, and above 0.75 as excellent). Concurrent lobar
Greenstein et al. Page 3
Psychiatry Res. Author manuscript; available in PMC 2012 September 30.
NIH
-PA Author Manuscript
NIH
-PA Author Manuscript
NIH
-PA Author Manuscript

interrater ICCs were excellent and ranged from 0.91 to 0.99, and longitudinal lobar interraterICCs were good to excellent and ranged from 0.72 to 0.96. ICCs were calculated using the“one -way random” option in SPSS. In addition to calculating ICCs, measurements weregraphed to examine tracer drift and systematic biases within tracers.
In the current sample, one tracer completed all of the vermis measurements that followed theinitial phase of measuring. Longitudinal ICCs for the vermis were 0.92 for the total vermis,and ranged from 0.70 to 0.98 for the three vermal subregions (anterior, superior andinferior). Finally, we attempted to ensure that tracers received a random assignment ofprobands, siblings, and/or controls. Also, all raters were blind to demographic data.However, all tracers did not trace cerebella from all groups, as they were not all employedduring all cerebellum-related projects.
2.4 Clinical measuresWe used age-appropriate versions of the Global Assessment of Functioning Scale (Shaffer etal., 1983) (APA, 1994) (GAS), the Brief Psychiatric Rating Scale (BPRS) (Guy 1976), theScale for the Assessment of Positive Symptoms (SAPS) (Andreasen 1984), and the Scale forthe Assessment of Negative Symptoms (SANS) (Andreasen 1983), to assess clinicalsymptoms in COS probands (ICCs for all measures > 0.80). We restricted ratings to NIHinpatient medication-free assessments to approximate comparable rater, treatment andenvironmental effects across participants. For siblings, we completed GAS scores, and weassessed DSM axis I and II symptoms with the Schedule for Affective Disorders andSchizophrenia for School-Age Children for siblings under 18 (Kaufman et al., 1997), theStructured Clinical Interview for DSM-IV-TR Axis I Disorders—Patient Edition for siblings18 and older, (First 2001) and the Structured Interview for the DSM-III PersonalityDisorders for siblings 18 and older, (Stangl et al., 1985) (ICCs > 0.80). Parent socio-economic status (SES) was measured using Hollingshead Scale (1975).
2.5 Cognitive measuresWe used age-appropriate versions of the Wechsler intelligence scales to assess the COS, TD,and sibling (SIB) groups. Because this study has been ongoing for over 15 years, we haveused several versions of the Wechsler scales, including: the WISC-R (Wechsler 1974 ),WAIS-R (Wechsler 1981), WISC-III (Wechsler 1991), WAIS-III (Wechsler 1997), and theWASI (Wechsler 1999). Siblings were only administered the Vocabulary subtest from oneof the above Wechsler tests to approximate IQ and age-appropriate versions of theCalifornia Verbal Learning Test (Delis 1994; Delis 2000). One thing to note is that COSpost-onset IQ scores are often below 70 but IQ before illness and NIH admission is alwaysat least 70 (see above exclusion criteria).
2.6 StatisticsWe tested for group demographic differences using one-way ANOVA for continuousvariables and chi-square test of independence for categorical variables. When the ANOVAgroup effect was significant, we used Tukey post hoc tests.
Polynomial mixed model regression analyses were used to examine cerebellar development.Mixed model regression has several advantages over more common statistical techniquessuch as repeated measures ANOVA. Specifically, mixed model regression accounts forunbalanced data measured at irregular time intervals and within-person correlation (Singerand Willett, 2003). We were thus able to include participants with varying numbers of scansand increase the statistical power with which we examined volume and age relationships. Inthese models, individuals with one scan contribute less information to slope parameters thanparticipants with multiple scans. Because we include all scans from all individuals, to
Greenstein et al. Page 4
Psychiatry Res. Author manuscript; available in PMC 2012 September 30.
NIH
-PA Author Manuscript
NIH
-PA Author Manuscript
NIH
-PA Author Manuscript

account for within-person and within family correlations, we included two randomintercepts—one for person nested within family and one for family. These intercepts aretreated as normally distributed, independent random effects, whereas beta coefficients forage (centered at the sample mean age of 16.87), group and age by group terms weremodeled as fixed effects. For a given structure, the ith measurement from the jth individualnested within the kth family was initially modeled as
β1, β2, and β3 show how volume changes with age. The intercept and β terms were allowedto vary by diagnostic group, producing three growth curves with different height and shapecharacteristics. For each cerebellar volume measure, we first determined the order of thedevelopmental growth curve (cubic, quadratic, or linear) using an F test of the combinedexplanatory power of the three highest order polynomial effects (one per group). Totalcerebellum, right and left hemispheres, left anterior and left inferior posterior lobes weremodeled as cubic curves. The right anterior and right superior posterior trajectories werequadratic curves, and vermal and inferior posterior trajectories were linear. After the orderwas established, we used F tests to determine group differences in the shape and heightparameters of the curves.
To explore group differences in early adulthood for regions with significant COS/TD and/orSIB/TD trajectory differences, we took two approaches: 1) using all scans, we re-centeredage at 23, which is at the 90th percentile of our age range and 2), we calculated t tests (COSvs. TD and SIB vs. TD) and Cohen’s d (Cohen 1988) using each person’s last (or only) scanafter age 20.
For regions where COS had smaller cerebellar volume across the age range, we exploredclinical and cognitive correlates of cerebellar volume using mixed model regressionanalyses. By including a random intercept per COS proband, we were able to examinerelationships between clinical and cognitive measures and cerebellum volumes whileaccounting for within person dependencies present when multiple scans per proband areused. For each regression, the dependent variable was cerebellar volume and theindependent variable was a clinical or cognitive measure; we also included age and sex ascovariates in these models.
For regions with significant COS/TD and SIB/TD trajectory differences, we exploredclinical and cognitive correlates of percent volume change (volume at last scan-volume atfirst scan)/volume at first scan). We used percent change to approximate linear andcurvilinear change over time and to examine the relationships between volumetric changeand clinical and cognitive correlates in a straightforward, easily accessible manner. For theCOS percent change/clinical and cognitive correlate analyses, we used Pearson productmoment correlations. For the SIB percent change/clinical and cognitive correlate analyses,we used a series of mixed model regressions in light of the presence of multiple siblings perfamily. For each regression, the dependent variable was cerebellar volume and theindependent variable was a clinical or cognitive measure. In view of the relatively largenumber of statistical tests, we set our alpha level at 0.01 for curve parameter comparisons, t-tests comparing volumes in early adulthood, and cognitive and clinical correlate analyses.Statistical assumptions were checked for ANOVAs, t-tests, mixed model regression andcorrelation analyses, and data were screened for outliers. We used SAS 9.2 for all analyses.
Greenstein et al. Page 5
Psychiatry Res. Author manuscript; available in PMC 2012 September 30.
NIH
-PA Author Manuscript
NIH
-PA Author Manuscript
NIH
-PA Author Manuscript

3. Results3.1 Demographics
There were no significant group differences in age, race, and sex (see Table 1), but groupsdiffered in mean Vocabulary, IQ, and parent SES (see Table 1). Because SES, IQ andVocabulary differences can be conceptualized as disease-related, they were not included ascovariates, as controlling for them would be controlling for illness-related variance. Theunequal numbers at each time point (and age) does not reflect attrition, rather, theunbalanced data reflects varying age at admission and length of time since study entry (<1 toapproximately 20 years), and failed scans, to a lesser extent
3.2 Longitudinal analysesResults are summarized in Table 2. The COS group’s developmental trajectory divergedfrom the TD group trajectory in total cerebellum, bilateral inferior-posterior lobes, and rightand left cerebellar hemisphere volumes. Notably, like the COS group, the SIB group’sdevelopment also diverged from the TD trajectory in total cerebellum, left inferior posterior,and total right hemisphere volumes (see Figure 1). The SIB group uniquely diverged fromthe TD trajectory in the left superior posterior lobe and converged with the TD trajectory inthe superior vermis.
The COS group had smaller volumes than the TD group over time (significant difference ataverage age without significant group*age interaction) in the following regions: bilateralanterior lobes, anterior vermis and total vermis. The SIB group did not have anysignificantly smaller regional or total volumes than the TD group over time. However, theSIB group had greater superior vermis volumes than the TD group in adolescence, but thisdifference diminished over time.
The COS group had smaller volumes than the SIB group over time in total, superior andanterior vermis. The SIB and COS trajectories only significantly diverged in the left anteriorlobe.
3.3 Group differences in early adulthoodWhen we re-centered age at 23 (rather than the sample average age) to determine iftrajectory differences confer volume differences in early adulthood, the COS group’sestimated volume was smaller than the TD group’s for all regions with significant COS/TDtrajectory differences (total, left and right hemispheres, and bilateral inferior-posterior lobes)(see Figure 2 for total, right hemisphere, and left inferior posterior volumes). Also at age 23,the SIB group’s right cerebellar (P =0.009) (see Figure 2) and left superior posterior(P=0.01) estimated volumes were significantly smaller than the TD group’s estimatedvolume, and a trend was evident for smaller SIB total cerebellum (see Figure 1).
When we included only one scan per person ages 20 and above, neither the SIB (n=39) northe COS (n=34) group significantly differed from the TD group (n=39) for any regional ortotal volume for which there were initial SIB/TD or COS/TD trajectory differences,respectively. Cohen’s d values were generally in the small (0.30) and small-to-medium(between 0.30 and 0.50) ranges with three d values less than 0.30 (COS v NV-- totalcerebellum d =0.38, right cerebellum d=0.39, left cerebellum d =0.36, left inferior posteriord =0.22, right inferior posterior d =0.17; SIB v NV-- total cerebellum =0.44, rightcerebellum d =0.45, left inferior posterior d =0.34, left superior posterior d=0.33, superiorvermis d =0.29).
Greenstein et al. Page 6
Psychiatry Res. Author manuscript; available in PMC 2012 September 30.
NIH
-PA Author Manuscript
NIH
-PA Author Manuscript
NIH
-PA Author Manuscript

3.4 Clinical and cognitive correlates3.4.1 COS clinical and cognitive correlations for regions with stable COS/TDdifferences—For regions where the COS group had smaller volumes across the age range(bilateral anterior lobes and anterior and total vermis), mixed model regression resultsyielded significant positive relationships between Full Scale IQ and left anterior (p=0.01),right anterior (P =0.0005), anterior vermis (P =0.0003) and total vermis (P<0.0001). VerbalIQ was significantly positively related to anterior vermis and total vermis volumes (P =0.002and P < 0.001, respectively), and Performance IQ was significantly positively related toright anterior lobe volume, anterior vermis and total vermis volumes (P =0.01, P =0.01, P=0.0005. respectively). When we included total grey mater plus total white matter (GMWM)as a covariate, all 3 total vermis/IQ relationships remained significant, as did the Full ScaleIQ and anterior vermis and right anterior lobe relationships (P< 0.01). The remainingsignificant cerebellum, IQ, PIQ, and VIQ relationships became trend level (P= 0.04 to 0.07)relationships when controlling for GMWM. When we included both TD and COS groups ina mixed effect regression model and tested group differences in IQ/volume relationships, novolume/IQ score relationship was significantly different between COS and TD groups.However, these comparisons should be interpreted with caution as the range of IQ scoresdiffers for COS and TD groups (COS IQ scores range from 44 to 126 and the TD groupranges from 78 to 141).
GAS score was significantly positively related to total vermis (P =0.006) (better functioning,greater vermis volume), although no other clinical measure (SAPS, SANS, BPRS) wassignificantly correlated with bilateral anterior lobes, anterior vermis or total vermis volumes.The SIB group did not have regions with consistently smaller volumes across the age rangeand as such, we did not perform a comparable set of analyses.
3.4.2 Percent change and clinical and cognitive correlations—When wecalculated percent change for the regions where the COS/TD trajectories diverged andcorrelated these change scores with the COS group’s IQ (Full Scale, Verbal andPerformance IQ) scores and clinical measures (GAS, SAPS, SANS, BPRS), no Pearsoncorrelation coefficients were statically significant.
When we calculated percent change for the regions where the SIB/TD trajectories divergedor converged and correlated these change scores with siblings’ scaled Vocabulary scores,GAS scores, number of schizophrenia spectrum symptoms (total of paranoid, schizoid,schizotypal, and avoidant personality disorder symptoms) and CVLT standard scores (Trials1–5 T score, short free and cued z scores, and long free and cued z scores), no significantrelationships emerged.
4. DiscussionOur findings are consistent with previous reports of cerebellar abnormalities inschizophrenia. Specifically, the divergent total cerebellum trajectory and the stable totalvermis difference between COS and TD groups are consistent with a previous study thatincluded a subset of the current sample (Keller et al., 2003). Also, smaller unadjusted totalcerebellum volume using the same semi-automated method has been reported in the cross-sectional AOS literature (Thomann et al., 2009), suggesting some consistency in thepresence of total cerebellar abnormalities in COS and AOS. Moreover, consistent withcurrent results, smaller unadjusted anterior lobes (Edwards et al., 2008), and smallerunadjusted anterior and total vermis measures in medication-naive first episode AOS(Nopoulos et al., 1999; Okugawa et al., 2007) have also been reported in the cross-sectionalAOS literature. Notably, current findings include positive relationships for these regions
Greenstein et al. Page 7
Psychiatry Res. Author manuscript; available in PMC 2012 September 30.
NIH
-PA Author Manuscript
NIH
-PA Author Manuscript
NIH
-PA Author Manuscript
(anterior lobes and anterior and total vermis) and postonset IQ, and total vermis volume andGAS score.
The significant relationship between IQ and the vermis has also been reported in AOSstudies (Nopoulo et al., 1999) childhood tumor studies (Puget et al., 2009) Joubert syndrome(vermal aplasia) (Steinlin 2007), and the fragile X literature (Mostofsky et al., 1998),suggesting that vermis/IQ relationships are not specific to schizophrenia and that congenitaland/or later vermis abnormalities can both interfere with overall cognitive functioning.However, this is not consistent with Stoodley and Schmahmann’s recent (Stoodley andSchmahmann 2010) conceptualization of cognitive impairment as localized in posteriorcerebellar regions. We also found a significant positive relationship between total vermisvolumes and GAS score in COS, which is more consistent with Stoodley andSchmahmann’s conceptualization of neuropsychiatric disorders as linked to the vermis.However, the remainder of our symptom/vermis relationship findings did not supportschizophrenia symptoms significantly correlating with vermal volume or change.
The SIB trajectories diverged from those of the TD group in a manner similar to COS fortotal, right, and left inferior volumes. This finding was counter to our hypothesis of anormalizing trend for siblings (based on cortical thickness results from Gogtay et al., 2007).The similarity between COS and SIB development in these regions also suggests thepossibility of a deviant trajectory that may be related to how familial genetic risk factorsand/or plastic response to risk affect brain growth. Although several SIB trajectoriesdiverged from the control trajectory in a manner similar to their affected COS siblings, theultimate “abnormality” in early adulthood is unclear. Based on the developmental curves,the SIB group has smaller volumes in early adulthood; however, limiting the data to onescan per person post 20 years, which is more representative of adult onset studies, did notsupport notable or significant adulthood volumetric cerebellar abnormalities in the SIBgroup. In addition, because no significant correlates of rate of change emerged, the clinicalrelevance of the diverging SIB and COS trajectories remains unclear. It would thus be ofparticular interest to obtain memory and theory of mind tests which have previously beenshown to relate to the posterior cerebellum (Andreasen and Pierson 2008).
More consistent with our hypothesis of plastic developmental change in siblings, the siblingsuperior vermis volume was significantly greater than both COS and TD groups inadolescence and converged with the TD trajectory over time. The NIMH developmentalstudies indicate that the cerebellum is among the last structures to achieve adult volume(Tiemeier, Lenroot et al., 2009), and shows relatively lower heritability (Wallace, Schmitt.et al., 2006). This, combined with our present finding, suggests that the vermis, specifically,the superior vermis, may mediate a compensatory/adaptive plastic changes in relation topathology.
Limitations to the study include the lack of germane cognitive measures for all groups. Aftercompiling results from functional MRI studies, Andreasen and Pierson (2008) reportedunique relationships between memory and theory of mind tasks and posterior regions of thecerebellum—regions for which either SIB and/or COS groups diverged from the TDtrajectory. While our list learning task measures did not correlate with SIB changes inposterior cerebellum, ideally, we would also have complete list learning, theory of mind,story memory and facial recognition testing results from probands, siblings and controls tofurther understand the relationship between divergent posterior cerebellar development andcognition. While we currently lack this data, long-term follow-up and additional cognitivetesting are ongoing. Another weakness is that we have had several cerebellum tracers overthe years, and while we have made concerted efforts to train and monitor manual tracers,having multiple, nonoverlapping manual tracers is a drawback.
Greenstein et al. Page 8
Psychiatry Res. Author manuscript; available in PMC 2012 September 30.
NIH
-PA Author Manuscript
NIH
-PA Author Manuscript
NIH
-PA Author Manuscript
A third limitation involves the debate over whether or not to covary for total corticalvolume. In informal analyses, when we included total grey matter plus total white matter(GMWM) as a covariate for TD/COS differences, many of the results which weresignificant (at alpha= 0.01) were reduced to trend level (P values from 0.02 to 0.11) results(see supplementary table). It is thus not clear if developmental and static COS/TDdifferences in these regions are a function of overall smaller brain volumes in COS patients.However, it is arguable that covarying for GMWM, like controlling for IQ, is comparable tocontrolling for illness-related variance and would thus result in type II errors. As this studywas exploratory in nature, we opted to air against type II errors and focus instead onuncorrected results in the manuscript while still presenting the reader with the covariedresults.
A final weakness of this study is that many siblings and controls have not passed the age ofrisk for schizophrenia or related disorders. Because we continue to follow up the siblingsand controls, we expect that this weakness will be attenuated over time.
Supplementary MaterialRefer to Web version on PubMed Central for supplementary material.
ReferencesAndreasen, NC. Scale for the Assessment of Negative Symptoms (SANS). Iowa City: University of
Iowa; 1983.
Andreasen, NC. Scale for the Assessment of Positive Symptoms (SAPS). Iowa City: University ofIowa; 1984.
Andreasen NC, Pierson R. The Role of the Cerebellum in Schizophrenia. Biological Psychiatry. 2008;64(2):81–88. [PubMed: 18395701]
American Psychaitric Association. Diagnostic and statistical manual of mental disorders: DSM-IV. 4.Washington, DC: American Psychiatric Association; 1994.
Bottmer C, Bachmann S, Pantel J, Essig M, Amann M, Schad LR, Magnotta V, Schrader J. Reducedcerebellar volume and neurological soft signs in first-episode schizophrenia. Psychiatry Research:Neuroimaging. 2005; 140(3):239–250.
Brans RGH, van Haren NEM, van Baal GCM, Staal WG, Schnack HG, Kahn RS, Pol H. LongitudinalMRI study in schizophrenia patients and their healthy siblings. The British Journal of Psychiatry.2008; 193(5):422–423. [PubMed: 18978326]
Cannon TD, Thompson PM, van Erp TG, Toga AW, Poutanen VP, Huttunen M, Lonqvist J,Standerskjold-Nordenstam CG, Narr KL, Khaledy M, Kaprio J. Cortex mapping reveals regionallyspecific patterns of genetic and disease-specific gray-matter deficits in twins discordant forschizophrenia. Proceedings of The National Academy of Sciences. 2002; 99(5):3228–3233.
Cohen, J. Statistical power analysis for the behavioral sciences. 2. Hillsdale, NJ: Erlbaum; 1988.
Delis, D. California Verbal Learning Test - Children’s Version. The Psychological Corporation; 1994.
Delis, DC. California Verbal Learning Test. 2. The Psychological Corporation; 2000.
Edwards CR, Newman S, Bismark A, Skosnik PD, O’Donnell BF, Shekhar A, Steinmetz JE, HetrickWP. Cerebellum volume and eyeblink conditioning in schizophrenia. Psychiatry Research:Neuroimaging. 2008; 162(3):185–194.
First, MB.; Spitzer, RL.; Gibbon, M.; Williams, JB. Structured Clinical Interview for DSM-IV-TRAxis I Disorders-Patient Edition (SCID-I/P). New York: New York State Psychiatric Institute;2001.
Fleiss, JL. The Design and Analysis of Clinical Experiments. John Wiley & Sons; New York: 1986.
Gaser C, Volz HP, Kiebel S, Riehemann S, Sauer H. Detecting Structural Changes in Whole BrainBased on Nonlinear Deformations--Application to Schizophrenia Research. NeuroImage. 1999;10(2):107–113. [PubMed: 10417245]
Greenstein et al. Page 9
Psychiatry Res. Author manuscript; available in PMC 2012 September 30.
NIH
-PA Author Manuscript
NIH
-PA Author Manuscript
NIH
-PA Author Manuscript

Giedd JN, Blumenthal J, Jeffries NO, Castellanos FX, Liu H, Zijdenbos A, Paus T, Evans AC,Rapoport JL. Brain development during childhood and adolescence: a longitudinal MRI study.Nature Neuroscience. 1999; 2:861–863.
Gogtay N, Greenstein D, Lenane M, Clasen L, Sharp W, Gochman P, Butler P, Evans A, Rapoport J.Cortical Brain Development in Nonpsychotic Siblings of Patients With Childhood-OnsetSchizophrenia. Archives of General Psychiatry. 2007; 64:772–780. [PubMed: 17606811]
Greenstein D, Lerch J, Shaw P, Clasen L, Giedd J, Gochman P, Rapoport J, Gogtay N. Childhoodonset schizophrenia: cortical brain abnormalities as young adults. Journal of Child Psychology andPsychiatry. 2006; 47(10):1003–1012. [PubMed: 17073979]
Guy, W. ECDEU Assessment Manual for Psychopharmacology: Publication ADM 76–338.Washington, DC: US Department of Health, Education, and Welfare; 1976. p. 158-169.
Honea RA, Meyer-Lindenberg A, Hobbs KB, Pezawas L, Mattay VS, Egan MF, Verchinski B,Passingham RE, Weinberger DR, Callicott JH. Is Gray Matter Volume an Intermediate Phenotypefor Schizophrenia? A Voxel-Based Morphometry Study of Patients with Schizophrenia and TheirHealthy Siblings. Biological Psychiatry. 2008; 63(5):465–474. [PubMed: 17689500]
Jacobsen LK, Giedd JN, Berquin PC, Krain AL, Hamburger SD, Kumra S, Lenane MC, Rapoport JL.Quantitative morphology of the cerebellum and fourth ventricle in childhood-onset schizophrenia.American Journal of Psychiatry. 1997; 154(12):1663–1669. [PubMed: 9396943]
Kaufman J, Birmaher B, Brent D, Rao U, Flynn C, Moreci P, Williamson D, Ryan N. Schedule forAffective Disorders and Schizophrenia for School-Age Children-Present and Lifetime Version (K-SADS-PL): Initial Reliability and Validity Data. Journal of the American Academy of Child andAdolescent Psychiatry. 1997; 37(7):980–988. [PubMed: 9204677]
Keller A, Castellanos FX, Vaituzis AC, Jeffries NO, Giedd JN, Rapoport JL. Progressive loss ofcerebellar volume in childhood-onset schizophrenia. American Journal of Psychiatry. 2003;160(1):128–133. [PubMed: 12505811]
Kumra S, Frazier JA, Jacobsen LK, McKenna K, Gordon CT, Lenane MC, Hamburger SD, Smith AK,Albus KE, Alaghband-Rad J, Rapoport JL. Childhood-onset schizophrenia. A double-blindclozapine-haloperidol comparison. Archives of General Psychiatry. 1996; 53(12):1090–1097.[PubMed: 8956674]
Larsell, O.; Jansen, J. The Comparative Anatomy and Histology of the Cerebellum: The HumanCerebellum, Cerebellar Connections, and the Cerebellar Cortex. Minneapolis: University ofMinnesota Press; 1972.
Leiner HC, Leiner AL, Dow RS. The human cerebro-cerebellar system: its computing, cognitive, andlanguage skills. Behavioural Brain Research. 1991; 44(2):113–128. [PubMed: 1751002]
Mackie S, Shaw P, Lenroot R, Pierson R, Greenstein DK, Nugent TF III, Sharp Wendy S, Giedd JayN, Rapoport Judith L. Cerebellar Development and Clinical Outcome in Attention DeficitHyperactivity Disorder. American Journal of Psychiatry. 2007; 164(4):647–655. [PubMed:17403979]
Magnotta VA, Harris G, Andreasen NC, O’Leary DS, Yuh WTC, Heckel D. Structural MR imageprocessing using the brains2 toolbox. Computerized Medical Imaging and Graphics. 2002; 26(4):251–264. [PubMed: 12074920]
Mane A, Falcon C, Mateos JJ, Fernandez-Egea E, Horga G, Lomena F, Bargallo N, Prats-Galino A,Bernardo M, Parellada E. Progressive gray matter changes in first episode schizophrenia: A 4-yearlongitudinal magnetic resonance study using VBM. Schizophrenia Research. 2009; 114(1–3):136–143. [PubMed: 19683418]
McKenna K, Gordon CT, Lenane M, Kaysen D, Fahey K, Rapoport JL. Looking for childhood-onsetschizophrenia: the first 71 cases screened. Journal of the American Academy of Child andAdolescent Psychiatry. 1994; 33(5):636–644. [PubMed: 8056726]
Mostofsky SH, Mazzocco MMM, Aakalu G, Warsofsky IS, Denckla MB, Reiss AL. Decreasedcerebellar posterior vermis size in fragile X syndrome: Correlation with neurocognitiveperformance. Neurology. 1998; 50(1):121–130. [PubMed: 9443468]
Nopoulos PC, Ceilley JW, Gailis EA, Andreasen NC. An MRI study of cerebellar vermis morphologyin patients with schizophrenia: evidence in support of the cognitive dysmetria concept. BiologicalPsychiatry. 1999; 46(5):703–711. [PubMed: 10472423]
Greenstein et al. Page 10
Psychiatry Res. Author manuscript; available in PMC 2012 September 30.
NIH
-PA Author Manuscript
NIH
-PA Author Manuscript
NIH
-PA Author Manuscript
Okugawa G, Nobuhara K, Takase K, Kinoshita T. Cerebellar Posterior Superior Vermis and CognitiveCluster Scores in Drug-Naive Patients with First-Episode Schizophrenia. Neuropsychobiology.2007; 56(4):216–219. [PubMed: 18382120]
Pierson R, Corson PW, Sears LL, Alicata D, Magnotta V, O’Leary D, Andreasen NC. Manual andSemiautomated Measurement of Cerebellar Subregions on MR Images. NeuroImage. 2002; 17(1):61–76. [PubMed: 12482068]
Puget S, Boddaert N, Viguier D, Kieffer V, Bulteau C, Garnett M, Callu D, Sainte-Rose Christian,Kalifa C, Dellatolas G, Grill J. Injuries to inferior vermis and dentate nuclei predict poorneurological and neuropsychological outcome in children with malignant posterior fossa tumors.Cancer. 2009; 115(6):1338–1347. [PubMed: 19195041]
Shaffer D, Gould MS, Brasic J, Ambrosini P, Fisher P, Bird H, Aluwahlia S. A Children’s GlobalAssessment Scale (CGAS). Archives of General Psychiatry. 1983; 40(11):1228–1231. [PubMed:6639293]
Singer, JD.; Willett, JB. Applied Longitudinal Data Analysis: Modeling Change and EventOccurrence. Oxford University Press; New York: 2003.
Sled JG, Zijdenbos AP, Evans AC. A nonparametric method for automatic correction of intensitynonuniformity in MRI data. IEEE Trans Med Imaging. 1998; 17(1):87–97. [PubMed: 9617910]
Sporn AL, Greenstein DK, Gogtay N, Jeffries NO, Lenane M, Gochman P, Clasen LS, Blumenthal J,Giedd JN, Rapoport JL. Progressive Brain Volume Loss During Adolescence in Childhood-OnsetSchizophrenia. American Journal of Psychiatry. 2003; 160(12):2181–2189. [PubMed: 14638588]
Staal WG, Hulshoff Pol HE, Schnack HG, Hoogendoorn MLC, Jellema K, Kahn RS. Structural BrainAbnormalities in Patients With Schizophrenia and Their Healthy Siblings. American Journal ofPsychiatry. 2000; 157(3):416–421. [PubMed: 10698818]
Stangl D, Pfohl B, Zimmerman M, Bowers W, Corenthal C. A Structured Interview for the DSM-IIIPersonality Disorders: A Preliminary Report. Archivens of General Psychiatry. 1985; 42(6):591–596.
Steinlin M. The cerebellum in cognitive processes: Supporting studies in children. The Cerebellum.2007; 6(3):237–241. [PubMed: 17786820]
Stoodley CJ, Schmahmann JD. Evidence for topographic organization in the cerebellum of motorcontrol versus cognitive and affective processing. Cortex. 2010; 46(7):831–844. [PubMed:20152963]
Strick PL, Dum RP, Fiez JA. Cerebellum and Nonmotor Function. Annual Review of Neuroscience.2009; 32(1):413–434.
Tanskanen P, Ridler K, Murray GK, Haapea M, Veijola JM, Jaaskelainen E, Miettunen J, Jones PB,Bullmore ET, Isohanni MK. Morphometric Brain Abnormalities in Schizophrenia in a Population-Based Sample: Relationship to Duration of Illness. Schizophrenia Bulletin. 2008:sbn141.
Tavano A, Grasso R, Gagliardi C, Triulzi F, Bresolin N, Fabbro F, Borgatti R. Disorders of cognitiveand affective development in cerebellar malformations. Brain. 2007; 130(10):2646–2660.[PubMed: 17872929]
Thomann PA, Roebel M, Dos Santos V, Bachmann S, Essig M, Schrader J. Cerebellar substructuresand neurological soft signs in first-episode schizophrenia. Psychiatry Research: Neuroimaging.2009; 173(2):83–87.
Tiemeier H, Lenroot RK, Greenstein DK, Tran L, Pierson R, Giedd JN. Cerebellum developmentduring childhood and adolescence: A longitudinal morphometric MRI study. Neuroimage. 2009
Wallace GL, Eric Schmitt J, Lenroot R, Viding E, Ordaz S, Rosenthal MA, Malloy E, Clausen L,Kendler K, Neale M, Giedd JN. A pediatric twin study of brain morphometry. Journal of ChildPsychology and Psychiatry. 2006; 47(10):987–993. [PubMed: 17073977]
Wechsler, D. Manual for the Wechsler Intelligence Scale for Children—Revised. New York:Psychological Corporation; 1974.
Wechsler, D. Wechsler Adult Intelligence Scale—Revised. New York: Psychological Corporation;1981.
Wechsler, D. Wechsler Intelligence Scale for Children. 3. New York: Psychological Corporation;1991. Manual
Greenstein et al. Page 11
Psychiatry Res. Author manuscript; available in PMC 2012 September 30.
NIH
-PA Author Manuscript
NIH
-PA Author Manuscript
NIH
-PA Author Manuscript
Wechsler, D. Manual for the Wechsler Adult Intelligence Scale. 3. New York: PsychologicalCorporation; 1997.
Wechsler, D. Wechsler Abbreviated Scale of Intelligence: manual. San Antonio, TX: PsychologicalCorporation; 1999.
Greenstein et al. Page 12
Psychiatry Res. Author manuscript; available in PMC 2012 September 30.
NIH
-PA Author Manuscript
NIH
-PA Author Manuscript
NIH
-PA Author Manuscript
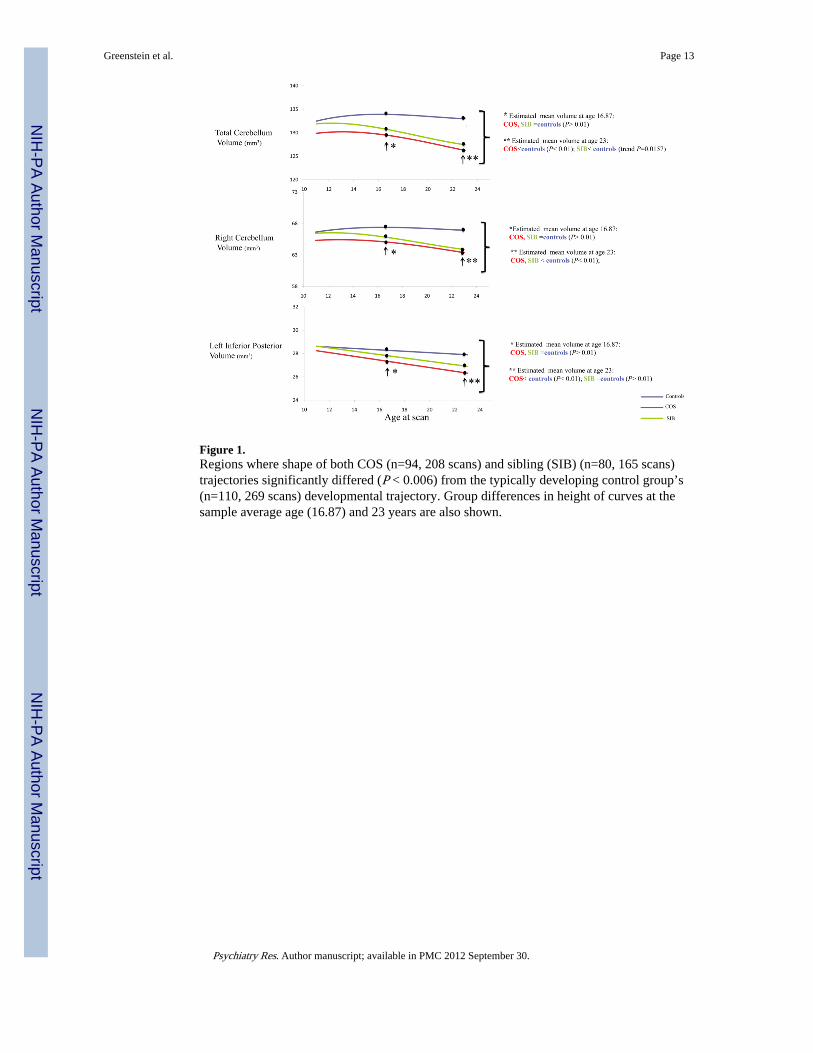
Figure 1.Regions where shape of both COS (n=94, 208 scans) and sibling (SIB) (n=80, 165 scans)trajectories significantly differed (P < 0.006) from the typically developing control group’s(n=110, 269 scans) developmental trajectory. Group differences in height of curves at thesample average age (16.87) and 23 years are also shown.
Greenstein et al. Page 13
Psychiatry Res. Author manuscript; available in PMC 2012 September 30.
NIH
-PA Author Manuscript
NIH
-PA Author Manuscript
NIH
-PA Author Manuscript
NIH
-PA Author Manuscript
NIH
-PA Author Manuscript
NIH
-PA Author Manuscript
Greenstein et al. Page 14
Tabl
e 1
Dem
ogra
phic
s fo
r C
hild
hood
Ons
et S
chiz
ophr
enia
(C
OS)
, non
-aff
ecte
d fu
ll si
blin
gs, a
nd ty
pica
lly d
evel
opin
g co
ntro
l gro
ups
CO
S (n
=94)
Sibl
ing
(n=8
0)C
ontr
ol (
n=11
0)F
(df
) or
X2
(df)
P
Sex
43 F
; 51
M43
F; 3
7 M
46 F
; 64
MX
2 (2)=
2.6
80.
26
Ave
rage
age
(al
l sca
ns)
mea
n(SD
)17
.25(
4.1)
16.8
8(5.
83)
16.5
7(4.
44)
F (2
,639
) = 1
.22
0.30
Age
at f
irst
sca
n m
ean(
SD)
14.6
(2.8
)14
.9(5
.9)
14.2
(3.7
)F
(2,2
81) =
.75
0.47
Rac
e6A
; 28B
; 3O
; 57W
3A; 1
5B; 3
O; 5
9W4A
; 14B
; 5O
; 87W
X2 (6
) = 1
1.1
0.08
Voc
abul
ary
Scor
e m
ean(
SD)
6.24
(3.5
)11
.02(
3.2)
11.6
9(2.
5)F
(2,2
34) =
78.
85*
<0.
01
IQ, m
ean(
SD)
74.1
(18.
39)
na11
2.7(
11.9
6)F
(1,1
80) =
294.
2+<
0.01
Soci
o-E
cono
mic
Sta
tus*
**, m
ean(
SD)
62.5
(30.
46)
50.4
(25.
98)
40.6
8(19
.1)
F (2
,272
) =18
.45*
*<
0.01
Axi
s I
Dia
gnos
is
na
40
na
Moo
d D
isor
der
20
A
nxie
ty D
isor
der
16
A
lcoh
ol &
/or
Subs
tanc
e A
buse
8
Tot
al N
umbe
r of
Sca
ns20
816
526
9
Num
ber
of S
cans
at
T
ime
194
8011
0
T
ime
254
4080
T
ime
336
3048
T
ime
414
1122
T
ime
57
48
T
ime
63
01
Rac
e: A
: Asi
an; B
-Bla
ck/A
fric
an-A
mer
ican
; O-O
ther
/Mix
ed R
ace;
W=
Whi
te
+ CO
S <
NV
* CO
S <
NV
/SIB
Psychiatry Res. Author manuscript; available in PMC 2012 September 30.

NIH
-PA Author Manuscript
NIH
-PA Author Manuscript
NIH
-PA Author Manuscript
Greenstein et al. Page 15**
CO
S <
NV
/SIB
; SIB
<N
V
*** SE
S is
inve
rsel
y sc
ored
(hi
gher
sco
res
indi
cate
low
er S
ES)
Psychiatry Res. Author manuscript; available in PMC 2012 September 30.

NIH
-PA Author Manuscript
NIH
-PA Author Manuscript
NIH
-PA Author Manuscript
Greenstein et al. Page 16
Tabl
e 2
Res
ults
fro
m lo
ngitu
dina
l ana
lyse
s co
mpa
ring
reg
iona
l and
tota
l cer
bella
r de
velo
pmen
t of
child
hood
ons
et s
chiz
ophr
enia
pro
band
s (n
=94
, 208
sca
ns),
typi
cally
dev
elop
ing
cont
rols
(n=
110,
269
sca
ns),
and
heal
thy
sibl
ings
(n=
80, 1
65 s
cans
)
Est
imat
ed m
ean
volu
me
(in
mm
3 ) (
SE)
at t
he s
ampl
e av
erag
e ag
e(1
6.87
yea
rs)
p va
lues
for
F t
est
for
heig
ht d
iffe
renc
es o
f cu
rves
at
sam
ple
aver
age
age
p va
lues
for
F t
est
for
grou
p di
ffer
ence
s in
sha
pe o
f tr
ajec
tory
CO
SC
ontr
olSi
blin
gC
OS
vs. C
ontr
olC
OS
vs. S
iblin
gSi
blin
g vs
. Con
trol
CO
S vs
. Con
trol
CO
S vs
. Sib
ling
Sibl
ing
vs. C
ontr
ol
Tot
al C
ereb
ellu
m12
9.4
(1.4
5)13
3.9
(1.3
5)13
0.64
(1.
75)
0.02
0.51
0.14
0.00
010.
530.
0006
Lef
t Hem
isph
eric
Lef
t Ant
erio
r5.
67 (
0.14
)6.
28 (
0.13
)6.
02 (
0.18
)0.
002
0.07
0.24
0.02
0.00
30.
11
Lef
t. In
feri
or-P
oste
rior
27.3
(0.
37)
28.2
6 (0
.34)
27.7
8 (0
.44)
0.06
0.32
0.39
0.00
010.
600.
006
Lef
t. Su
peri
or-P
oste
rior
23.4
4 (0
.32)
23.9
5 (0
.29)
23.0
6 (0
.39)
0.24
0.36
0.07
0.06
0.25
0.00
04
Tot
al L
eft C
ereb
ellu
m64
.39
(0.7
2)66
.51
(0.6
7)64
.86
(0.8
7)0.
030.
620.
140.
002
0.54
0.01
5
Rig
ht H
emis
pher
ic
Rig
ht A
nter
ior
5.74
(0.
15)
6.31
(0.
14)
5.92
(0.
18)
0.00
50.
370.
090.
450.
310.
72
Rig
ht I
nfer
ior-
Post
erio
r27
.71
(0.3
9)28
.75
(0.3
6)28
.46
(0.4
6)0.
050.
150.
620.
001
0.40
0.05
Rig
ht S
uper
ior
Post
erio
r23
.85
(0.3
4)24
.32
(0.3
2)23
.54
(0.4
2)0.
320.
470.
140.
020.
140.
02
Tot
al R
ight
Cer
ebel
lum
65.0
4 (0
.74)
67.4
(0.
69)
65.7
8 (0
.89)
0.02
0.43
0.15
0.00
030.
560.
0006
Ver
mis
Supe
rior
2.61
(0.
05)
2.69
(0.
05)
2.90
(0.
06)
0.21
<0.
0001
0.00
60.
050.
220.
002
Infe
rior
3.12
(0.
05)
3.30
(0.
05)
3.27
(0.
06)
0.02
0.03
0.73
0.32
0.76
0.57
Ant
erio
r3.
51 (
0.06
)3.
80 (
0.06
)3.
79 (
0.07
)0.
0004
0.00
060.
890.
030.
340.
31
Tot
al9.
23 (
0.13
)9.
79 (
0.12
)9.
95 (
0.16
)0.
002
<0.
0001
0.41
0.02
0.82
0.05
Psychiatry Res. Author manuscript; available in PMC 2012 September 30.
Copyright © 2022 FDOKUMEN