Cognitive Factor Structure and Invariance in People With Schizophrenia, Their Unaffected Siblings,...
11
Cognitive Factor Structure and Invariance in People With Schizophrenia, Their Unaffected Siblings, and Controls Dwight Dickinson 1–3,* , Terry E. Goldberg 4 , James M. Gold 2 , Brita Elveva ˚g 1 , and Daniel R. Weinberger 1 1 Clinical Brain Disorders Branch, National Institute of Mental Health, National Institutes of Health, Bethesda, MD; 2 Department of Psychiatry, University of Maryland School of Medicine, Baltimore, MD; 3 VISN 5 Mental Illness Research, Education and Clinical Center, Baltimore, MD; 4 Zucker Hillside Hospital, Long Island, NY *To whom correspondence should be addressed; Clinical Brain Disorders Branch, National Institute of Mental Health, National Institutes of Health, Building 10, Room 3C104, MSC 1379, Bethesda, MD 20892, USA; tel: 301-451-2123, fax: 301-480-4678, e-mail: [email protected]. Introduction: Separable, but positively correlated, factors emerge from analyses of cognitive test data in schizophre- nia and control samples (eg, verbal memory and processing speed) and these factors guide data reduction. Additionally, data support a hierarchical model of cognitive perfor- mance, in which these correlations reflect the influence of a higher-order factor, referred to as ‘‘g.’’ We tested these findings in large, carefully screened samples of people with schizophrenia (n 5 496), their unaffected siblings (n 5 504), and controls (n 5 823). Furthermore, we tested the hypothesis that cognitive performance in schizophrenia is more generalized across domains than among siblings and controls. Method: A combination of exploratory and confirmatory factor analyses (EFA and CFA) and multiple groups CFA (MCFA) was used. Results: EFA yielded fac- tors for verbal memory, visual memory, processing speed, working memory span, nback performance, and card sort- ing. The solution was consistent across groups, in terms of the factor assignments of individual cognitive variables and the magnitude of loadings. Method variance may have contributed to the card sorting, visual memory, and nback factors. CFA indicated that the hierarchical model, incor- porating a ‘‘g’’ factor, was a good fit for data from all groups. MCFA suggested that this hierarchical structure was fully invariant for controls and siblings. While the vari- able/factor loadings for the schizophrenia group also were invariant with comparison groups, factor/‘‘g’’ loadings were higher in schizophrenia, as were correlations among factor-based composite scores. Conclusions: Cognitive var- iables sort into domains consistently in schizophrenia, un- affected siblings, and controls. However, performance in schizophrenia is more generalized and less domain specific. Key words: cognition/general cognitive ability/factor analysis/structure invariance/data reduction Introduction Recently, we reported the results of exploratory and con- firmatory factor analyses (EFA and CFA) of cognitive data from 397 early participants in the genetics study of the Clinical Brain Disorders Branch, National Insti- tute of Mental Health (CBDB Sibling Study). 1 With data now available for more than 4 times as many par- ticipants, we revisited and extended that work. Across numerous factor analyses of schizophrenia sample data, separable factors emerge for cognitive per- formance domains, including learning and memory, pro- cessing speed, reasoning/problem solving, and working memory. 2 The factors are moderately correlated. 3 This structure is broadly consistent across schizophrenia and control groups 4 and our earlier analyses of ‘‘CBDB Sib- ling Study’’ data confirmed that the structure character- ized unaffected siblings of people with schizophrenia as well. 1 This consistent factor structure serves as a basis for data reduction, allowing combination of subgroups of individual measures into composite scores represent- ing the different cognitive domains. Given the large num- ber of overlapping cognitive variables available in the CBDB Sibling Study database and the desire to avoid redundant statistical tests, data reduction was a principal aim of the current analyses. In nonclinical populations, positive correlations among cognitive factors (eg, processing speed and working memory) are thought to reflect the influence of a higher- order factor, designated general cognitive ability or ‘‘g.’’ 5,6 The idea of general cognitive ability is related to IQ, but somewhat broader, encompassing cognitive abilities like episodic memory and spatial working memory that are only indirectly tapped by the most widely used IQ tests. 7 This stratified structure of cognitive performance—with ‘‘g’’ influencing performance in cognitive domains and Schizophrenia Bulletin vol. 37 no. 6 pp. 1157–1167, 2011 doi:10.1093/schbul/sbq018 Advance Access publication on March 29, 2010 Published by Oxford University Press on behalf of the Maryland Psychiatric Research Center. 2010. 1157
Transcript of Cognitive Factor Structure and Invariance in People With Schizophrenia, Their Unaffected Siblings,...

Cognitive Factor Structure and Invariance in People With Schizophrenia,Their Unaffected Siblings, and Controls
Dwight Dickinson1–3,*, Terry E. Goldberg4, James M. Gold2, Brita Elvevag1, and Daniel R. Weinberger1
1Clinical Brain Disorders Branch, National Institute of Mental Health, National Institutes of Health, Bethesda, MD; 2DepartmentofPsychiatry,UniversityofMarylandSchoolofMedicine,Baltimore,MD; 3VISN5Mental IllnessResearch,EducationandClinicalCenter,Baltimore, MD; 4Zucker Hillside Hospital, Long Island, NY
*To whom correspondence should be addressed; Clinical Brain Disorders Branch, National Institute ofMental Health, National Institutesof Health, Building 10, Room 3C104, MSC 1379, Bethesda, MD 20892, USA; tel: 301-451-2123, fax: 301-480-4678, e-mail:[email protected].
Introduction: Separable, but positively correlated, factorsemerge from analyses of cognitive test data in schizophre-nia and control samples (eg, verbal memory and processingspeed) and these factors guide data reduction. Additionally,data support a hierarchical model of cognitive perfor-mance, in which these correlations reflect the influenceof a higher-order factor, referred to as ‘‘g.’’ We tested thesefindings in large, carefully screened samples of people withschizophrenia (n 5 496), their unaffected siblings (n 5504), and controls (n 5 823). Furthermore, we tested thehypothesis that cognitive performance in schizophrenia ismore generalized across domains than among siblingsand controls. Method: A combination of exploratory andconfirmatory factor analyses (EFA and CFA) and multiplegroups CFA (MCFA) was used. Results: EFA yielded fac-tors for verbal memory, visual memory, processing speed,working memory span, nback performance, and card sort-ing. The solution was consistent across groups, in termsof the factor assignments of individual cognitive variablesand the magnitude of loadings. Method variance may havecontributed to the card sorting, visual memory, and nbackfactors. CFA indicated that the hierarchical model, incor-porating a ‘‘g’’ factor, was a good fit for data from allgroups. MCFA suggested that this hierarchical structurewas fully invariant for controls and siblings. While the vari-able/factor loadings for the schizophrenia group also wereinvariant with comparison groups, factor/‘‘g’’ loadingswere higher in schizophrenia, as were correlations amongfactor-based composite scores. Conclusions: Cognitive var-iables sort into domains consistently in schizophrenia, un-affected siblings, and controls. However, performance inschizophrenia is more generalized and less domain specific.
Key words: cognition/general cognitive ability/factoranalysis/structure invariance/data reduction
Introduction
Recently, we reported the results of exploratory and con-firmatory factor analyses (EFA and CFA) of cognitivedata from 397 early participants in the genetics studyof the Clinical Brain Disorders Branch, National Insti-tute of Mental Health (CBDB Sibling Study).1 Withdata now available for more than 4 times as many par-ticipants, we revisited and extended that work.Across numerous factor analyses of schizophrenia
sample data, separable factors emerge for cognitive per-formance domains, including learning and memory, pro-cessing speed, reasoning/problem solving, and workingmemory.2 The factors are moderately correlated.3 Thisstructure is broadly consistent across schizophrenia andcontrol groups4 and our earlier analyses of ‘‘CBDB Sib-ling Study’’ data confirmed that the structure character-ized unaffected siblings of people with schizophrenia aswell.1 This consistent factor structure serves as a basisfor data reduction, allowing combination of subgroupsof individual measures into composite scores represent-ing the different cognitive domains. Given the large num-ber of overlapping cognitive variables available in theCBDB Sibling Study database and the desire to avoidredundant statistical tests, data reduction was a principalaim of the current analyses.In nonclinical populations, positive correlations among
cognitive factors (eg, processing speed and workingmemory) are thought to reflect the influence of a higher-order factor, designated general cognitive ability or ‘‘g.’’5,6 The idea of general cognitive ability is related to IQ,but somewhat broader, encompassing cognitive abilitieslike episodic memory and spatial working memory thatareonlyindirectlytappedbythemostwidelyusedIQtests.7
This stratified structure of cognitive performance—with‘‘g’’ influencing performance in cognitive domains and
Schizophrenia Bulletin vol. 37 no. 6 pp. 1157–1167, 2011doi:10.1093/schbul/sbq018Advance Access publication on March 29, 2010
Published by Oxford University Press on behalf of the Maryland Psychiatric Research Center. 2010.
1157
domain factors influencing performance on individualcognitive tests—is known as the ‘‘hierarchical model.’’7
In earlier work with a nonoverlapping sample, the modelprovided a good characterization of data from schizo-phrenia patients and healthy controls.4
Despite the consistency in factor structure acrossschizophrenia and control groups, it is clear that thestructures are not fully invariant. Mean performance dif-fers reliably between these groups, to take one obviousexample. There is another less obvious respect in whichthe group factor structures appear to differ. Earlier anal-yses showed that, while the grouping of observed varia-bles into cognitive factors was the same for people withschizophrenia and healthy controls, the correlationsamong these factors and among domain compositesbased on the factors were higher in the schizophreniasample than in the controls.4 This finding suggests thatcognitive performance in schizophrenia is more general-ized and less domain specific than in healthy groups, butit has not been replicated or investigated in unaffectedsiblings. Such differences could have implications regard-ing the nature of the cognitive impairment in schizophre-nia, its relationship to genetic risk, and the use andinterpretation of different indexes of cognitive perfor-mance in genetics, neuroimaging, and other studies. Thecurrent studyhad3 aims: (a) to confirmand refine the cog-nitive factor structure derived in analyses of the first waveof theCBDBSiblingStudydata inorder toallowreductionof the number of variables used in analyses of these data;(b) to test for the presence in these data of a higher-orderfactor representinggeneral cognitiveabilityor ‘‘g’’; and (c)to examine dimensions of invariance for the proposedfactor structure across our large samples of schizophrenia,unaffected sibling, and control volunteers.
Methods
Participants
Data for analyses was drawn from 1824 volunteers in 3groups: 496 schizophrenia probands, 504 of their unaf-fected siblings, and 823 healthy controls. All were partic-ipants evaluated in the course of participation in theCBDB Sibling Study, which has been described previ-ously.8 Participants ranged in age from 18 to 60 yearsand were able to provide informed consent. All partici-pants were medically screened and completed separatediagnostic interviews with 2 research psychiatrists.9 Indi-viduals were included in the schizophrenia group if theyhad schizophrenia, schizoaffective disorder, psychosisnot otherwise specified, or schizoid personality disorder.Siblings were permitted to have a history ofmood/anxiety(;37%) or personality (;5%) disorder, although the ma-jority had no history (;58%). Controls were excluded ifthey had first-degree relatives with schizophrenia spec-trum disorders, if they were currently diagnosed withan Axis I or Axis II disorder, or if they were taking psy-
chotropic medication at the time of the study. Any personwith schizophrenia, sibling, or control was excluded if heor she had a history of head trauma with extended loss ofconsciousness, alcohol, or drug abuse within the past 6months, IQ less than 70, or evidence of learning disabil-ity. Schizophrenia participants were stable and receivingneuroleptic medications at the time of testing.
Neuropsychological Assessment
All participants were administered a neuropsychologicalbattery and 25 variables from a larger set were examinedin current analyses (table 1). The 25 variables were se-lected by consensus among experienced neuropsycholo-gists (T.E.G., J.M.G., and D.D.). These variables werejudged to satisfy 3 principal criteria: (1) they are variablesthat have been commonly used in schizophrenia research,representing key domains of performance impairment,(2) they had shown evidence of impaired performancein healthy siblings of patients with schizophrenia, sug-gesting that they might serve as intermediate cognitivephenotypes related to genetic risk for schizophrenia,and (3) they showed good distributional characteristicsacross each of the 3 CBDB Sibling Study subgroups inthis data set. Variables not meeting these criteria (gener-ally because of extreme floor or ceiling effects) includedthose from Gordon’s Continuous Performance Test,Benton’s Facial Recognition Test, and the 0-back condi-tion from the N-back task.
Statistical Analysis
Exploratory Analyses. All analyses were conducted us-ing SPSS v16.0 and AMOS v16.0 statistical software(SPSS, Inc., Chicago, IL, 2008). Separate exploratoryanalyses were conducted for schizophrenia participants,unaffected siblings, and healthy controls. Missing datawere excluded pairwise rather than listwise to maximizeour use of valid data (see Table 1 for counts of missingvalues).Our first aim of data reduction shaped the choice of
exploratory analyses.10 Subgroup data were subjectedto principal components analyses (PCA) followed byvarimax rotation, an approach that has been frequentlyused in schizophrenia research.2 PCA is not a true latentfactor analysis technique and some commentators rec-ommend that its use be restricted to data reduction.10 Be-cause we are interested in underlying structure inaddition to data reduction, we conducted a parallel ex-ploratory analysis using maximum likelihood estimationto check the sensitivity of our analysis to extractionmethod. In all analyses, factors with eigenvalues greaterthan 1.0 were retained. An individual variable was ex-cluded and analyses were redone if the variable didnot show a loading of at least 0.40 on any factor orif it showed a complex loading pattern (eg, loadingsof at least 0.40 on 2 or more factors).10
D. Dickinson et al.
1158
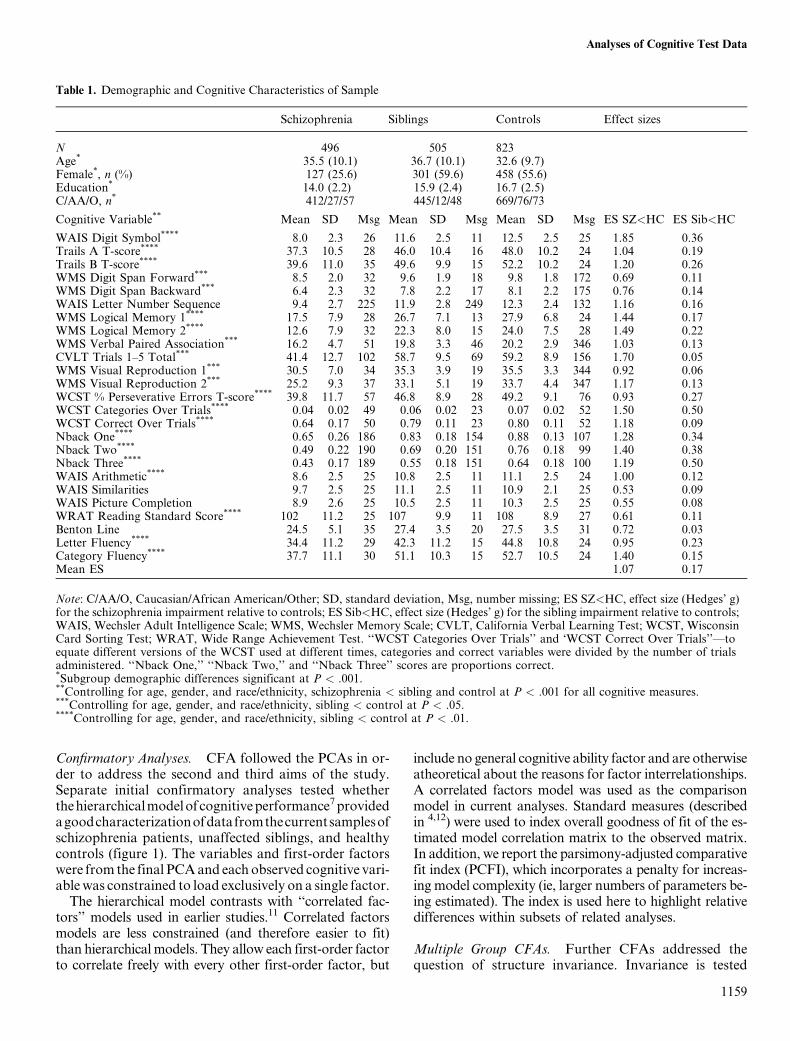
Confirmatory Analyses. CFA followed the PCAs in or-der to address the second and third aims of the study.Separate initial confirmatory analyses tested whetherthehierarchicalmodelofcognitiveperformance7providedagoodcharacterizationofdatafromthecurrentsamplesofschizophrenia patients, unaffected siblings, and healthycontrols (figure 1). The variables and first-order factorswere from the final PCAand each observed cognitive vari-able was constrained to load exclusively on a single factor.The hierarchical model contrasts with ‘‘correlated fac-
tors’’ models used in earlier studies.11 Correlated factorsmodels are less constrained (and therefore easier to fit)than hierarchical models. They allow each first-order factorto correlate freely with every other first-order factor, but
include no general cognitive ability factor and are otherwiseatheoretical about the reasons for factor interrelationships.A correlated factors model was used as the comparisonmodel in current analyses. Standard measures (describedin 4,12) were used to index overall goodness of fit of the es-timated model correlation matrix to the observed matrix.In addition, we report the parsimony-adjusted comparativefit index (PCFI), which incorporates a penalty for increas-ing model complexity (ie, larger numbers of parameters be-ing estimated). The index is used here to highlight relativedifferences within subsets of related analyses.
Multiple Group CFAs. Further CFAs addressed thequestion of structure invariance. Invariance is tested
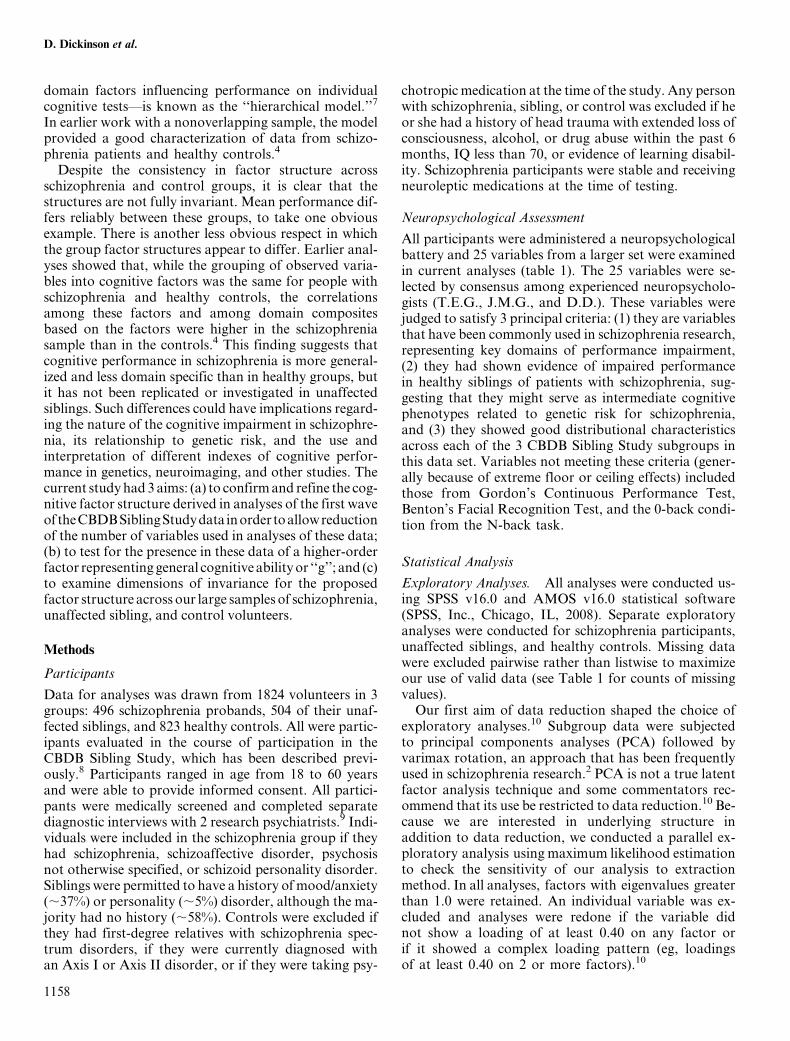
Table 1. Demographic and Cognitive Characteristics of Sample
Schizophrenia Siblings Controls Effect sizes
N 496 505 823Age* 35.5 (10.1) 36.7 (10.1) 32.6 (9.7)Female*, n (%) 127 (25.6) 301 (59.6) 458 (55.6)Education* 14.0 (2.2) 15.9 (2.4) 16.7 (2.5)C/AA/O, n* 412/27/57 445/12/48 669/76/73
Cognitive Variable** Mean SD Msg Mean SD Msg Mean SD Msg ES SZ<HC ES Sib<HC
WAIS Digit Symbol**** 8.0 2.3 26 11.6 2.5 11 12.5 2.5 25 �1.85 �0.36Trails A T-score**** 37.3 10.5 28 46.0 10.4 16 48.0 10.2 24 �1.04 �0.19Trails B T-score**** 39.6 11.0 35 49.6 9.9 15 52.2 10.2 24 �1.20 �0.26WMS Digit Span Forward*** 8.5 2.0 32 9.6 1.9 18 9.8 1.8 172 �0.69 �0.11WMS Digit Span Backward*** 6.4 2.3 32 7.8 2.2 17 8.1 2.2 175 �0.76 �0.14WAIS Letter Number Sequence 9.4 2.7 225 11.9 2.8 249 12.3 2.4 132 �1.16 �0.16WMS Logical Memory 1**** 17.5 7.9 28 26.7 7.1 13 27.9 6.8 24 �1.44 �0.17WMS Logical Memory 2**** 12.6 7.9 32 22.3 8.0 15 24.0 7.5 28 �1.49 �0.22WMS Verbal Paired Association*** 16.2 4.7 51 19.8 3.3 46 20.2 2.9 346 �1.03 �0.13CVLT Trials 1–5 Total*** 41.4 12.7 102 58.7 9.5 69 59.2 8.9 156 �1.70 �0.05WMS Visual Reproduction 1*** 30.5 7.0 34 35.3 3.9 19 35.5 3.3 344 �0.92 �0.06WMS Visual Reproduction 2*** 25.2 9.3 37 33.1 5.1 19 33.7 4.4 347 �1.17 �0.13WCST % Perseverative Errors T-score**** 39.8 11.7 57 46.8 8.9 28 49.2 9.1 76 �0.93 �0.27WCST Categories Over Trials**** 0.04 0.02 49 0.06 0.02 23 0.07 0.02 52 �1.50 �0.50WCST Correct Over Trials**** 0.64 0.17 50 0.79 0.11 23 0.80 0.11 52 �1.18 �0.09Nback One**** 0.65 0.26 186 0.83 0.18 154 0.88 0.13 107 �1.28 �0.34Nback Two**** 0.49 0.22 190 0.69 0.20 151 0.76 0.18 99 �1.40 �0.38Nback Three**** 0.43 0.17 189 0.55 0.18 151 0.64 0.18 100 �1.19 �0.50WAIS Arithmetic**** 8.6 2.5 25 10.8 2.5 11 11.1 2.5 24 �1.00 �0.12WAIS Similarities 9.7 2.5 25 11.1 2.5 11 10.9 2.1 25 �0.53 0.09WAIS Picture Completion 8.9 2.6 25 10.5 2.5 11 10.3 2.5 25 �0.55 0.08WRAT Reading Standard Score**** 102 11.2 25 107 9.9 11 108 8.9 27 �0.61 �0.11Benton Line 24.5 5.1 35 27.4 3.5 20 27.5 3.5 31 �0.72 �0.03Letter Fluency**** 34.4 11.2 29 42.3 11.2 15 44.8 10.8 24 �0.95 �0.23Category Fluency**** 37.7 11.1 30 51.1 10.3 15 52.7 10.5 24 �1.40 �0.15Mean ES �1.07 �0.17
Note: C/AA/O, Caucasian/African American/Other; SD, standard deviation, Msg, number missing; ES SZ<HC, effect size (Hedges’ g)for the schizophrenia impairment relative to controls; ES Sib<HC, effect size (Hedges’ g) for the sibling impairment relative to controls;WAIS, Wechsler Adult Intelligence Scale; WMS, Wechsler Memory Scale; CVLT, California Verbal Learning Test; WCST, WisconsinCard Sorting Test; WRAT, Wide Range Achievement Test. ‘‘WCST Categories Over Trials’’ and ‘WCST Correct Over Trials’’—toequate different versions of the WCST used at different times, categories and correct variables were divided by the number of trialsadministered. ‘‘Nback One,’’ ‘‘Nback Two,’’ and ‘‘Nback Three’’ scores are proportions correct.*Subgroup demographic differences significant at P < .001.**Controlling for age, gender, and race/ethnicity, schizophrenia < sibling and control at P < .001 for all cognitive measures.***Controlling for age, gender, and race/ethnicity, sibling < control at P < .05.****Controlling for age, gender, and race/ethnicity, sibling < control at P < .01.
1159
Analyses of Cognitive Test Data
through ‘‘multiple groups’’ CFA. These analyses proceedsequentially. First, all parameters are allowed to vary in-dependently between groups. In the following analyses,sets of key parameters are constrained to be equal acrossgroups. Significant deterioration in model fit with in-creasing equivalence constraints signals ‘‘noninvariance’’and provides information about which parts of the modelare noninvariant. For present purposes, the key dimen-sions of invariance are the variable/factor loadings andthe factor/‘‘g’’ loadings (figures 1a and 1b). We report3 MCFAs: people with schizophrenia compared withhealthy controls, people with schizophrenia versus theirunaffected siblings, and unaffected siblings versushealthy controls. For each set, the initial unconstrainedmodel (ie, with all parameters free to vary betweengroups) served as baseline. We then tested a model inwhich the CFA-derived variable/factor loadings were re-quired to be equal across groups, followed by a model inwhich both variable/factor loadings and factor/‘‘g’’ load-ings were constrained to be equal. The chi-square differ-ence test identified significant changes in model fit asadditional model constraints were applied. Additional in-formation about themagnitude and practical significanceof group differences in the 2 key parameter dimensionswas obtained through examination of changes in thevalues of the fit indexes described earlier.
Composite Correlations. Finally, composites were con-structed to represent each factor for each individual
with sufficient data. Scores on different measures wereconverted to z-scores using control means and standarddeviations and then averaged within domains to yielda domain composite. Unit-weighted composites wereused rather than loading-weighted factor scores becausesuch composites generally correlate very highly with fac-tor scores and because they are more replicable acrosslaboratories and samples.13 Raw domain compositescores were transformed as needed to enhance normality(ie, square or cube transformations to address negativeskew). A ‘‘g’’ composite was derived in similar fashion.These values are intended to be used in future analysesof CBDB Sibling Study data. We calculated Pearson’scorrelations among the domain composites by subgroupand tested for differences in the magnitude of the corre-lations across subgroups using a multigroup adaptationof Fisher’s test.14
Results
Participant Characteristics
Demographic statistics, cognitive variable performancefor each group, and effect sizes for the impairments inschizophrenia participants relative to controls and unaf-fected siblings relative to controls are reported in table 1.All groups were predominantly Caucasian, which maylimit the generalizability of findings to other racial andethnic groups. It is important to note the smaller percent-age of female participants in the schizophrenia group
Fig. 1. Final data reduction model. Loadings are for the schizophrenia sample only (n5 496). The model parameters (ie, arrows) in the areaindicatedbybracket ‘‘a’’ are the factor/‘‘g’’ loadings.Themodelparameters in the area indicatedbybracket ‘‘b’’ are the variable/factor loadings.
1160
D. Dickinson et al.

compared with the other groups. All further analysescontrolled for gender, age, and race/ethnicity, and sensi-tivity analyses explored whether gender differences be-tween groups affected key findings. We did not controlfor education as it is confounded with illness in patients15
and because current analyses are concerned mainly withassociations among variables rather than mean perfor-mance levels. The schizophrenia participants were mildlysymptomatic on average, as indicated by Positive andNegative Syndrome Scale scores (positive syndrome,mean = 13.5, SD = 6.4; negative syndrome mean =19.3, SD = 9.6). They performed significantly worsethan the sibling and control samples on all cognitivemeasures (all Ps < .001). The average effect size, therange of effects, and the maximal effect for Digit Symbolare all consistent with a recent meta-analysis.16 Althoughthe differences were generally small, unaffected siblingsperformed significantly worse than healthy controls on17 of 25 variables, and numerically worse on 6 of theremaining 8 variables. The average effect (�0.17; range0.09 to �0.50) was smaller than reported for relativesgenerally.17 Part of the reason is that only age-matchedsiblings (and not parents) were included in the unaffectedsibling sample here and siblings were carefully screenedfor schizophrenia spectrum diagnoses. In other ongoingwork, we are examining the effects of nonschizophreniaspectrum diagnoses on cognitive performance in our sib-ling sample.18 In general, however, the results are consis-tent with the growing body of evidence of small butreliable cognitive deficits in the close relatives of peopleof schizophrenia.
Exploratory PCA
In initial exploratory analyses, 7 of 25 variables showedcomplex and/or inconsistent loadings (the last 7 variablesin table 1). Consequently, while these variables wereretained for calculation of the ‘‘g’’ composite, theywere eliminated from the PCA. Results of the PCA arein table 2.For each subgroup, 6 parallel principal components
were derived, accounting for 76.4% of overall variancein the schizophrenia group, 72.9% in the sibling group,and 71.3% in the control group (variance accountedfor by each factor in each group is in table 2). Principalcomponents for verbal memory, processing speed, andspan measures emerged for each group. The remainingcomponents were defined by particular cognitive tests, in-cluding a card sorting component, a component for thenback measures, and one for the 2 visual reproductionmeasures. Typical loadings above .70 for individualmeasures within components mean that the variablesgenerally shared variance of 50% or more with the othervariables in a given component set. No variable showedimportant secondary loadings. Theprimary loadingswereconsistent acrossmeasureswithina component andacross
subgroups of people with schizophrenia, unaffectedsiblings, and controls.The emergence of 3 factors defined by specific tests
raised the question whether the test-based factors signifyimportant, separable constructs, or reflect shared testmethodology—so-called ‘‘method variance.’’ To shedlight on this question, we performed 2 further sets of fac-tor analyses. In the first (alternative 1), we retained onlyone variable each from the card sorting, nback, visual re-production groupings (Wisconsin Card Sorting Test[WCST] Perseverative Errors T-score, Nback Two, andvisual reproduction 1), but held other aspects of the 6-component solution constant. In the second (alternative2), we used the same 3 variables from the card sorting,nback and visual reproduction groupings as in alternative1, but also added back the seven variables that had showncomplex or inconsistent loadings in the prior analyses. Inboth solutions, memory, processing speed, and span com-ponents emerged for all groups (see table 3 for factorloadings from the alternative 1 solution). However, inother respects, these alternatives did not yield consistent,interpretable solutions across groups or variables. In al-ternative 1, for example, 4 factors emerged for controls,compared with only 3 for schizophrenia participants andtheir siblings. In the alternatives, loadings for the 3 var-iables retained from the card sorting, nback and visualreproduction groupings were split between factors andinconsistent from group to group. Predicted associations(eg, Nback Two and the span variables on a single work-ing memory component) did not emerge. The overall var-iance explained by alternative 1 (55.5%–60.5%) andalternative 2 (56.0%–60.2%) dropped sharply comparedwith the six-component solution for all groups (71.3%–76.4%). There was also a dramatic decline in the variancein WCST Perseverative Errors T-score, Nback Two, andVisual Reproduction 1 explained jointly by the factorsderived for alternative 1 and alternative 2 (ie, squaredmultiple correlations or communalities). For example,for the schizophrenia group, the preferred six-componentsolution explained variance in these 3 variables rangingfrom 77% to 89%, compared with 26%–40% for alterna-tive 1 and 27%–53% for alternative 2. In short, these ex-ploratory analyses did not point to a solution that wasboth interpretable and free of possible method variance.Sensitivity analyses showed that our preferred 6-com-
ponent solution is quite robust. Further subdividing our 3groups by gender did not change the findings apprecia-bly. The same 6-component solution held for all 6 group-ings. Minor differences appeared only in the solution forthe smallest subgroup (women with schizophrenia, n =127; eg, complex California Verbal Learning Test load-ings). It is likely that the differences were a function oflimited sample size. Additional evidence of robustnesscame from the sensitivity analyses using maximum likeli-hood factor analysis rather than PCA. In these analyses,6 factors corresponding to the 6 principal components
1161
Analyses of Cognitive Test Data

emerged for all 3 subgroups, with matching patterns offactor loadings.
Confirmatory Testing of the Hierarchical Model and ‘‘g’’
Table 4a shows various indices of model fit for the singlegroup CFAs. The hierarchical model, incorporatinga ‘‘g’’ factor (figure 1), provided a good fit to the datafor all 3 groups (eg, v2/df < 2.0, Tucker Lewis Index >.95, root mean square error of approximation <.05).For all groups, all variable and factor loading parameterswere significant (Ps < .001). In separate analyses bygroup, the 6 correlated factors model showed similarlygood fit for all groups. Slight numerical disadvantagesfor the hierarchical model relative to the correlated fac-tors model on some fit indices were offset by increasedparsimony, as reflected in relatively better values for
the PCFI. Again, sensitivity analyses considered thesemodels within gender subgroups and again gender differ-ences were minor. Figure 1 shows, for the full schizophre-nia sample only, the maximum likelihood standardizedregression weights (ie, loadings). The ‘‘g’’ loadings hereare slightly smaller than those from the earlier reporton the hierarchical model4 but, in general, there is sub-stantial consistency of results despite differences in thesamples, the cognitive test batteries, and the subtest com-position of cognitive domains.The factor loadings for the associationsof thebroad cog-
nitive ability factors with the general ability factor areslightly higher in each case in the schizophrenia groupthan in the siblingorcontrol groups (datanot shown).Con-sistentwith this,when the factorgroupingswereusedtocre-ate cognitive domain composites, the bivariate correlations
Table 2. Variable/Factor Loadings from Main Principal Components Analysis for Schizophrenia, Sibling, and Control samples
FactorVerbal Memory Card Sorting Nback Span Processing Speed Visual Memory
Cognitive variable Sz Sb Ct Sz Sb Ct Sz Sb Ct Sz Sb Ct Sz Sb Ct Sz Sb Ct
WAIS Digit Symbol 0.12 0.13 0.15 0.08 0.12 0.14 0.27 0.27 0.29 0.04 0.11 0.04 0.71 0.62 0.59 0.10 0.09 0.11Trails A T-score 0.02 �0.04 0.04 0.12 0.03 0.07 0.01 0.05 �0.03 0.09 �0.02 0.06 0.86 0.84 0.81 0.05 0.09 0.00Trails B T-score 0.17 0.08 0.10 0.12 0.13 0.02 0.19 0.12 0.13 0.32 0.23 0.18 0.71 0.77 0.78 0.08 0.03 0.07
WMS DigitSpan Forward
0.05 0.07 0.11 0.06 0.06 0.02 �0.01 0.08 0.06 0.85 0.79 0.80 0.07 0.05 0.00 0.10 �0.08 0.04
WMS DigitSpan Backward
0.15 0.08 0.14 0.12 0.10 0.09 0.24 0.14 0.09 0.77 0.80 0.80 0.15 0.09 0.08 0.05 0.10 0.11
WAIS LetterNumber Sequence.
0.28 0.23 0.14 0.16 0.12 0.07 0.25 0.16 0.12 0.67 0.78 0.75 0.20 0.15 0.22 0.10 0.12 0.02
WMS LogicalMemory 1
0.91 0.89 0.91 0.12 0.09 0.04 0.09 0.12 0.08 0.10 0.10 0.12 0.03 0.00 0.04 0.09 0.00 �0.01
WMS LogicalMemory 2
0.90 0.90 0.92 0.12 0.09 0.03 0.09 0.11 0.09 0.08 0.10 0.11 0.05 0.00 0.06 0.07 0.02 0.03
WMS VerbalPaired Association
0.67 0.70 0.54 0.13 0.00 0.14 0.11 �0.07 0.03 0.16 0.11 0.17 0.09 0.13 0.08 0.25 0.15 0.27
CVLT Trials1–5 Total
0.66 0.63 0.66 0.15 0.04 0.16 0.21 0.27 0.17 0.15 0.09 0.09 0.22 0.04 0.16 0.18 0.26 0.10
WMS VisualReproduction 1
0.19 0.12 0.08 0.09 0.15 0.16 0.22 0.13 0.10 0.13 0.03 0.08 0.11 0.11 0.04 0.88 0.89 0.90
WMS VisualReproduction 2
0.28 0.18 0.17 0.15 0.13 0.10 0.17 0.19 0.18 0.11 0.06 0.06 0.11 0.09 0.11 0.86 0.87 0.88
WCST % PerseverativeErrors T-score
0.08 0.01 0.03 0.84 0.85 0.83 0.18 0.07 �0.03 0.08 0.04 0.04 0.13 0.18 0.12 0.07 0.07 0.12
WCST CategoriesOver Trials
0.17 0.09 0.13 0.87 0.89 0.89 0.18 0.18 0.20 0.13 0.12 0.08 0.12 0.02 0.05 0.11 0.11 0.06
WCST CorrectOver Trials
0.21 0.10 0.17 0.89 0.89 0.91 0.15 0.19 0.17 0.12 0.14 0.07 0.09 0.08 0.06 0.08 0.13 0.12
Nback One 0.11 0.17 0.12 0.17 0.11 0.08 0.79 0.67 0.77 0.09 0.18 0.05 0.25 0.13 0.03 0.14 0.22 0.09Nback Two 0.15 0.09 0.09 0.21 0.15 0.12 0.84 0.86 0.86 0.15 0.14 0.12 0.14 0.16 0.12 0.12 0.09 0.08Nback Three 0.17 0.06 0.10 0.16 0.17 0.08 0.81 0.81 0.80 0.18 0.09 0.10 0.07 0.14 0.15 0.18 0.07 0.11
% Variance accountedfor by each factor:
16.2 14.9 14.4 14.1 13.8 13.6 13.6 12.4 12.6 11.4 11.5 11.1 11.2 10.3 9.8 9.8 9.9 9.7
Note: Abbreviations are explained in the first footnote to table 1. Bold values indicate the primary loading of each variable (rows) onthe various factors (columns). Sz, schizophrenia; Sb, siblings; Ct, controls.
1162
D. Dickinson et al.
between these domainswereuniformlyhigher in the schizo-phrenia group than in the comparison groups (table 5).The mean correlation for the schizophrenia sample
(r = .372) was smaller than the mean composite score cor-relation found in our earlier meta-analysis (ie, r = .45), al-thoughwithin theconfidence interval for that estimate (.35to .54).3 However, the schizophrenia mean was signifi-cantly larger than the mean correlations for the siblings(r = .239) or controls (r = .245; v2 [2 df] = 7.24, P = .027).There isamore restricted rangeof testperformanceamongsiblings and healthy controls than schizophrenia patients,most evident in the Visual Reproduction variables (table1).This could reducecorrelations in the siblingandcontrolgroups.However, removing the visualmemory compositefrom the correlation analysis did not appreciably changethe magnitude of the group mean correlations or the sta-tistical significance of the group differences.As a further test of the proposition that cognitive cor-
relations are higher in schizophrenia, we examined thepattern of correlations among the 7 individual variablesfrom the original 25 that were left out of the factor anal-ysis. Importantly, performance variance in these 7 vari-ables was similar across the 3 groups. The range ofcorrelations across groups was slightly compressed inthis comparison. However, the mean correlation inschizophrenia was largest (r = .339) and was significantlylarger than the mean correlation among controls (r =
.245; z = 1.73, P = .042). Correlations in siblings were in-termediate (r = .288) and not significantly different fromeither the schizophrenia or control samples. This patternof higher correlations in people with schizophrenia waspreserved in gender subgroups. Women showed slightlyhigher correlations than men for all groups but, in bothgenders, all bivariate correlations for pairs of cognitivecomposites were higher in the schizophrenia subgroupthan in the comparison groups.
Multiple Groups Analysis of Structure Invariance
Table 4b shows the fit indices associated with the various2-group analyses. In each pair, the ‘‘unconstrained’’model, with all parameters free to vary between thegroups, serves as baseline. Because the hierarchical modelprovided a good fit to the data from each of the groupsseparately, it was expected that the unconstrained modelfor each 2-group contrast would provide a similarlystrong fit. The second model for each contrast requiredthat individual loadings of each observed variable onits designated first-order cognitive factor (figure 1,bracket b) be the same for both groups, but left the load-ings of the domain factors on higher-order ‘‘g’’ (figure 1,bracket a) free to vary between the groups. In the analysisincluding controls and siblings, imposing this constraintimproved parsimony slightly (as shown by the change inPCFI) and hadnodeleterious effect onmodel fit, resulting
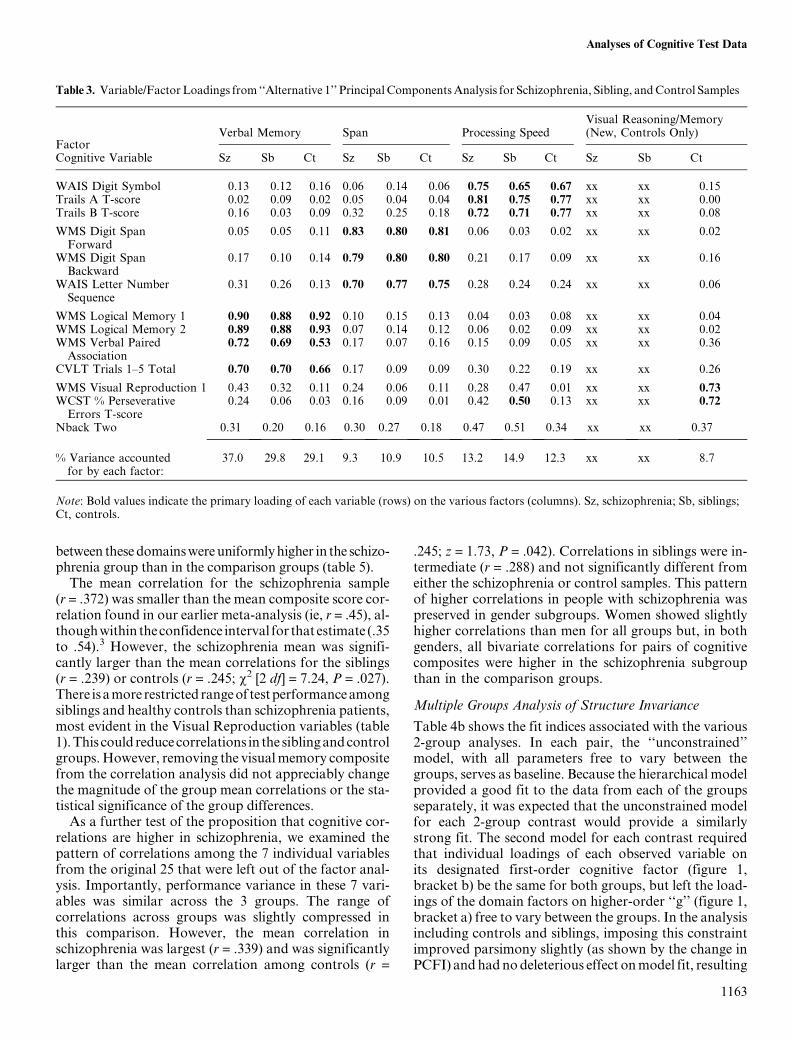
Table 3. Variable/Factor Loadings from ‘‘Alternative 1’’ Principal ComponentsAnalysis for Schizophrenia, Sibling, andControl Samples
FactorVerbal Memory Span Processing Speed
Visual Reasoning/Memory(New, Controls Only)
Cognitive Variable Sz Sb Ct Sz Sb Ct Sz Sb Ct Sz Sb Ct
WAIS Digit Symbol 0.13 0.12 0.16 0.06 0.14 0.06 0.75 0.65 0.67 xx xx 0.15Trails A T-score �0.02 �0.09 0.02 0.05 �0.04 0.04 0.81 0.75 0.77 xx xx 0.00Trails B T-score 0.16 0.03 0.09 0.32 0.25 0.18 0.72 0.71 0.77 xx xx 0.08
WMS Digit SpanForward
0.05 0.05 0.11 0.83 0.80 0.81 0.06 0.03 0.02 xx xx 0.02
WMS Digit SpanBackward
0.17 0.10 0.14 0.79 0.80 0.80 0.21 0.17 0.09 xx xx 0.16
WAIS Letter NumberSequence
0.31 0.26 0.13 0.70 0.77 0.75 0.28 0.24 0.24 xx xx 0.06
WMS Logical Memory 1 0.90 0.88 0.92 0.10 0.15 0.13 0.04 0.03 0.08 xx xx �0.04WMS Logical Memory 2 0.89 0.88 0.93 0.07 0.14 0.12 0.06 0.02 0.09 xx xx �0.02WMS Verbal PairedAssociation
0.72 0.69 0.53 0.17 0.07 0.16 0.15 0.09 0.05 xx xx 0.36
CVLT Trials 1–5 Total 0.70 0.70 0.66 0.17 0.09 0.09 0.30 0.22 0.19 xx xx 0.26
WMS Visual Reproduction 1 0.43 0.32 0.11 0.24 �0.06 0.11 0.28 0.47 0.01 xx xx 0.73WCST % PerseverativeErrors T-score
0.24 0.06 0.03 0.16 0.09 �0.01 0.42 0.50 0.13 xx xx 0.72
Nback Two 0.31 0.20 0.16 0.30 0.27 0.18 0.47 0.51 0.34 xx xx 0.37
% Variance accountedfor by each factor:
37.0 29.8 29.1 9.3 10.9 10.5 13.2 14.9 12.3 xx xx 8.7
Note: Bold values indicate the primary loading of each variable (rows) on the various factors (columns). Sz, schizophrenia; Sb, siblings;Ct, controls.
1163
Analyses of Cognitive Test Data
in a nonsignificant Dv2 and values for other indexes sim-ilar to those derived for the unconstrained model. Theseresults suggest that variable/factor loadings are consistentfor healthy controls and unaffected siblings. In the sepa-rate comparisons of schizophrenia patients with controlsand with unaffected siblings, Dv2 values indicate a statis-tically significant reduction in model fit when variable/factor loadings are constrained to be equal. However,the improvement in parsimony and the small magnitudeof change in main fit indexes after imposition of this con-straint suggest that any deterioration was of limited prac-tical significance. Thus, it is reasonable to considerloadings of individual variables on first-order cognitivedomain factors to be consistent across the 3 groups.
The same reasoning applies in the comparison of sib-lings and controls when adding the requirement that load-ings of the first-order factors on the higher-order ‘‘g’’factor must be equal between groups. Again,Dv2 is statis-tically significant but parsimony is improved with the ad-ditional constraintandchanges inother fit indexvaluesaremodest. It appears, then, that controls and siblings do notdiffer substantially in factor/‘‘g’’ loadings. The same is nottrue for people with schizophrenia. In the analysis withcontrols and the parallel analysis with siblings, adding
the constraint that factor/‘‘g’’ loadings be equal yields sig-nificant Dv2 values, no improvement in parsimony, andnotable deterioration of other indexes of model fit. Fac-tor/‘‘g’’ loadings are higher for people with schizophreniathan they are for healthy controls or unaffected siblings.
Discussion
Complementary exploratory and confirmatory analysesof the CBDB Sibling Study data yielded factors for verbalmemory, visual memory, processing speed, nback taskperformance, span task performance, and card sorting.The separation of individual cognitive test variablesinto factors was consistent across groups of individualswith schizophrenia, their unaffected siblings, and healthycontrols, and these factor groupingswere robust to sampledifferences in gender and other demographic variables.Analysesalso showedthat that thestrengthof the loadingsof the individual variables on the separate componentswas comparable (table 2). A series of MCFAs confirmedthis impression, showing that overall model fit deterio-rated only slightly when the magnitude of the loading ofeach individual cognitive measure on the specified cogni-tive domain factor was constrained to be the same across
Table 4. Confirmatory Factor Analysis Results
a. Single Group Models v2 df P v2/df TLI RMSEA PCFI
Schizophrenia onlyHierarchical model 205.423 127 <.001 1.618 .975 .035 .729Correlated factors model 182.457 118 <.001 1.546 .978 .033 .679
Healthy controls onlyHierarchical model 238.227 127 <.001 1.876 .974 .033 .728Correlated factors model 217.840 118 <.001 1.846 .975 .032 .678
Siblings onlyHierarchical model 246.449 127 <.001 1.941 .957 .043 .719Correlated factors model 218.249 118 <.001 1.850 .961 .041 .671
b. Multiple Group Contrasts Dv2 Ddf DPSchizophrenia vs controlsUnconstrained model — — — 1.747 .974 .024 .729Variable/factor loadings equal 106.611 12 <.001 2.069 .963 .028 .756Additionally, factor/’’g’’ loadings equal 934.472 35 <.001 4.769 .871 .053 .753
Schizophrenia vs siblingsUnconstrained model — — — 1.779 .975 .028 .724Variable/factor loadings equal 57.669 12 < .001 1.916 .969 .030 .754Additionally, factor/‘‘g’’ loadings equal 677.415 35 < .001 3.908 .893 .054 .755
Controls vs siblingsUnconstrained model — — — 1.908 .967 .026 .725Variable/factor loadings equal 12.487 12 .407 1.869 .969 .026 .759Additionally, factor/‘‘g’’ loadings equal 119.471 35 <.001 2.091 .961 .029 .817
Note: df, degrees of freedom; TLI, Tucker Lewis Index, RMSEA, root mean square error of approximation, PCFI, parsimonycomparative fit index; D, delta. Smaller v2/df ratios indicate better model fit, with values around 2.0 showing good fit in an absolutesense. TLI values are better as they approach 1.0 and values above .95 indicate good model fit. Values for the RMSEA are better asthey approach 0 and, below .05, are considered strong. The PCFI penalizes increasing model complexity (ie, larger numbers ofparameters being estimated). Higher values are better, but there is no rule of thumb for interpretation. The index is used here tohighlight relative differences within subsets of related analyses. For the multiple group analyses, Dv2 and Ddf indicate, respectively, thechange in v2 and the change in df with increasing invariance constraints. DP is the P value associated with the changes.
1164
D. Dickinson et al.

groups. The finding of invariance in the factor measure-ment configuration supports the conclusion that we aremeasuring the same constructs in each of the groups.19
A possible weakness of the current analysis is thatsome of the derived factors represent variables from sin-gle cognitive tests and may be better thought of as‘‘method factors’’ than as latent factors representing un-derlying constructs. Similar components or factors haveappeared periodically in schizophrenia research, espe-cially in regard to the WCST and Wechsler Adult Intel-ligence Scale Visual Reproduction.11,20,21 We exploredthe issue here in separate analyses that included onlyone variable each from theWCST, nback, and Visual Re-production. Consistent memory, processing speed, andspan factors emerged in the further analyses, offering ad-ditional support for these groupings. However, the alter-native analyses resulted in less variance explained thanthe 6-component solution—overall and in the 3 retainedvariables—and did not point to a consistent, interpret-able solution across groups. Additionally, relationshipsthat might have been hypothesized (eg, nback andspan variables on a single working memory component,or Visual Reproduction with verbal memorymeasures ona single episodic memory component) did not emerge inthe alternative analyses for any group. It would likely re-quire additional measures, conceptually related to thevariables underlying the card sorting, nback, and visualmemory factors here, to determine whether these factorsrepresent broader constructs that extend beyond the re-spective measurement methods used in this study. Al-though we cannot resolve the question with these data,our analyses suggest that card sorting, nback and VisualReproduction, at least in the context of this battery oftests, tap aspects of cognitive performance that are, toa meaningful degree, separable from each other andfrom other elements of the battery. Furthermore, whilemethod-influenced factors provide an incomplete ap-
proach to certain familiar constructs (eg, executive func-tioning and visual memory) and must be interpreted withcaution, they nevertheless provide an empirical basis forthe sorting of key variables in this large data set into sep-arate composites in order to avoid redundant statisticaltesting in other studies. For these reasons, we settled onthe 6-component solution as our preferred solution.The foregoing illustrates some general points about the
factor analytic literature in schizophrenia. On the onehand, factor analyses of schizophrenia data from any rea-sonably large, reasonably varied neuropsychological bat-tery reliably yield multiple correlated factors.2 Somevariablegroupingsareparticularlyrobust(eg,verbalmem-ory and processing speed) and emerge across studies withquite different test batteries.4,11 Such analyses can be usedeffectively to guide creation of factor-based compositesand/or a general ability composite. The current samplesand battery were carefully screened and selected andwere suitable for these purposes.On the other hand, factorsolutions vary somewhat as a function of the samples an-alyzed, the selectionof cognitive tests, andvariableswithintests,andarelikelytobeinfluencedbytestingmethodologyshared between variables.21 Obviously, the current sam-ples and battery are not immune from these criticisms.For example, it is not clear how our findings might havechangedifoursampleswerenotpredominantlyCaucasian,or ifwehadpermitted individualswith IQ less than70 tobeanalyzed, or ifwe had includedoneof the numberofmeas-ures thought to associatemost directlywith general cogni-tiveabilityor ‘‘g’’ (eg,Raven’sProgressiveMatrices).Also,the cullingprocess,which reduced theoriginal 25 variablesto 18,might not replicate in adifferent sample.Thus,whilecurrentanalysesareconsistent with broad findings of sep-arable factors from previous schizophrenia factor anal-yses and provide a basis for data reduction in the currentdata set, not all of the detailed findings here will gener-alize to studies using different samples and test batteries.
Table 5. Pearson’s Correlations for Domain Composites, By Group
Schizophrenia Siblings Controls
Processing speed <–> Verbal memory .302 .144 .268Processing speed <–> Span .393 .240 .274Processing speed <–> Nback .421 .348 .307Processing speed <–> Card sorting .323 .215 .237Processing speed <–> Visual memory .305 .206 .197Verbal memory <–> Span .376 .222 .305Verbal memory <–> Nback .381 .239 .236Verbal memory <–> Card sorting .360 .127 .149Verbal memory <–> Visual memory .443 .259 .232Span <–> Nback .376 .349 .253Span <–> Card sorting .319 .242 .199Span <–> Visual memory .328 .097 .219Nback <–> Card sorting .450 .329 .249Nback <–> Visual memory .461 .323 .282Card sorting <–> Visual memory .339 .226 .294
Mean .372 .239 .245
1165
Analyses of Cognitive Test Data
Another limitation of current work results from the useof the EFA results to specify factor-based compositesthat were then analyzed using CFA in the same dataset. This may have enhanced the fit of CFA models inthe current analyses and may limit the generalizabilityof findings. Two points offer reassurance in this regard.First, because of differences in the gender composition ofcurrent study samples, EFA and CFA solutions weretested separately in gender subgroups. Very consistent6-factor EFA solutions and hierarchical CFA modelsemerged for men and women across the samples. Second,independent evidence—based on nonoverlapping sam-ples and different test batteries—offers general supportfor both the multifactor EFA solution2 and the hierarchi-cal CFA model.4
We have argued previously that there is a generalizedcognitive deficit in schizophrenia22,23 and findings fromother groups are consistent.24 The hierarchical modelof human cognitive performance resolves any apparentinconsistency between general cognitive ability findingsand findings emphasizing separable factors. In thismodel, a broad latent factor representing general cogni-tive ability or ‘‘g’’ is drawn from the associations amongseparable, but positively correlated, latent factors repre-senting different cognitive domains.7 This model has beenshown to hold for nonclinical samples7 and a nonoverlap-ping schizophrenia sample4 and provides a conceptualfoundation for calculation of widely used global cognitiveperformance composites. Current analyses confirmed thesuitability of the model for unaffected siblings of schizo-phrenia patients as well as offering further support for itsapplication to patients themselves and healthy controls.
The hierarchical model reinforces the obvious pointthat there are different levels of analysis of cognitive per-formance and suggests that a fixed cognitive battery, suchas the MATRICS Consensus Cognitive Battery, will notbe suitable for all circumstances. A global indicator ofcognitive performance may be more appropriate forsome purposes (eg, evaluating broad effects of antipsy-chotic treatment on cognitive performance20,25 and pre-dicting functional outcome26). One recent report24 givesreason to think that a battery comprising just a few briefcognitive tests, carefully selected to yield a strong generalability composite, could serve research purposes whilesignificantly reducing research participant burden. Atthe same time, there is heterogeneity in the profiles of cog-nitive impairment in subgroupsofpeoplewith schizophre-nia.27,28 For work that capitalizes on this heterogeneityin an effort to identify more circumscribed pharmacolog-ical, neurophysiological, and molecular mechanisms,29
factor-level indicators may prove more useful and willrequire more extensive cognitive test batteries.
In addition to the evidence of strong parallels, analyseshighlighted group differences in the associations amongfirst-order cognitive factors. InMCFAs, overall model fitwas not affected when sibling and control groups were
constrained to have identical ‘‘g’’ loadings on top of iden-tical variable/factor loadings. However, fit deterioratedmarkedly when ‘‘g’’ loadings for the schizophrenia groupwere forced to be equal to ‘‘g’’ loadings for the siblingand control samples. The group differences were alsoreflected in correlations among the factor-based compo-sites. On average, these were significantly higher in theschizophrenia sample than in either their unaffected sib-lings or healthy controls. We found corresponding rela-tionships in a set of 7 distinct cognitive variables notincluded in the factor analysis. Furthermore, sensitivityanalyses showed the same pattern across schizophrenia,sibling, and control groups separately inmen andwomen,suggesting that gender does not moderate this effect.These analyses add to the evidence that cognitive perfor-
mance is more generalized in schizophrenia than in com-parison groups. For the schizophrenia and controlsamples, the findings parallel findings from our earlier re-port.4 The status of unaffected siblings of schizophreniapatients in this regard is less certain. Siblings showed cor-relations similar to controls when the analysis was confinedto the 6 factor-based composites but showed correlationsintermediate between patients and controls in analyses of7 distinct cognitive variables. Thus, the increased general-ization of cognitive performance in schizophrenia seemsto relate to illness, at least in part, including the experienceofchronicseriousillnessandtheeffectsoftreatment.Clarityabout whether generalized cognitive impairment is alsoinfluencedbygeneticandenvironmental risk factors sharedwith unaffected siblings awaits further research.These findings seem not to result from frequently noted
limitations of traditional cognitive measures (eg, their im-precision or multicomponent nature); obviously, the testbattery analyzed here was the same for all groups. Anal-yses controlled for group differences in demographic var-iables. In terms of psychometrics, there was a slightlymore restricted range of test performance among siblingsand healthy controls than schizophrenia patients (table1), but the differences were mostly minor and, wherethey were more pronounced (the Visual Reproductionvariables), appeared to have little effect on the analysisof associations. In sum, factor analyses supported a con-sistent sorting of cognitive test variables into cognitivedomains for people with schizophrenia, their unaffectedsiblings, and healthy controls, and consistent loadings ofindividual variables on specified factors across groups.The consistency supports the assumption that these con-structs have similar meaning in the populations repre-sented here. For siblings and controls, the associationsof these separable cognitive factors with the higher-ordergeneral ability factor were also uniform. However, thefactor/‘‘g’’ loadings were higher in schizophrenia andtranslated into significantly more highly correlatedcognitive domain composites for this group.Current analyses add to earlier work showing more
generalized cognitive performance in schizophrenia.3,4
1166
D. Dickinson et al.
It is possible that this could reflect a broad but definableeffect of illness on cognitive performance (eg, overreli-ance on effortful and prefrontally mediated processing).However, in the context of a disorder that affects develop-ment holistically, generalized performance may be betterinterpreted as a fundamental reflection of a more unitarygeneral ability than seen in comparison groups. It may befair, therefore, to ask the question: is ‘‘g’’ quite the sameconstruct in patients as it is in their siblings or controls?
Funding
Brief Assessment of Cognition in Schizophrenia testbattery (to T.E.G.).
Acknowledgments
This research was supported by the Intramural ResearchProgram of the National Institutes of Health, NationalInstitute of Mental Health. T.E.G. has consulted forMerck, Organon, Pfizer, and Wyeth; and has served asa consultant for Pfizer, Solvay, and AstraZeneca.D.D., B.E., and D.R.W. report no biomedical financialinterests or potential conflicts of interest.
References
1. Genderson MR, Dickinson D, Diaz-Asper CM, Egan MF,Weinberger DR, Goldberg TE. Factor analysis of neurocogni-tive tests in a large sample of schizophrenic probands, their sib-lings, and healthy controls. Schizophr Res. 2007;94:231–239.
2. Nuechterlein KH, Barch DM, Gold JM, Goldberg TE, GreenMF, Heaton RK. Identification of separable cognitive factorsin schizophrenia. Schizophr Res. 2004;72:29–39.
3. Dickinson D, Gold JM. Less unique variance than meets theeye: overlap among traditional neuropsychological dimen-sions in schizophrenia. Schizophr Bull. 2008;34:423–434.
4. Dickinson D, Ragland JD, Calkins ME, Gold JM, Gur RC.A comparison of cognitive structure in schizophrenia patientsand healthy controls using confirmatory factor analysis.Schizophr Res. 2006;85:20–29.
5. Jensen AR. The g Factor: The Science of Mental Ability.Westport, CT: Praeger; 1998.
6. Spearman C. ‘‘General intelligence,’’ objectively determinedand measured. Am J Psychol. 1904;15:201–293.
7. Carroll JB. Human Cognitive Abilities: A Survey of Factor-Analytic Studies. New York: Cambridge University Press;1993.
8. Egan MF, Goldberg TE, Kolachana BS, et al. Effect ofCOMT Val108/158 Met genotype on frontal lobe functionand risk for schizophrenia. Proc Natl Acad Sci U S A.2001;98:6917–6922.
9. First M, Spitzer R, Gibbon M, Williams J. Structured ClinicalInterview for Axis I DSM-IV. New York: Biometrics Re-search Department, New State Psychiatric Institute; 1994.
10. Costello AB, Osborne JW. Best practices in exploratory fac-tor analysis: four recommendations for getting the mostfrom your analysis. Pract Assess Res Eval. 2005;10(7):1–9.
11. Gladsjo JA, McAdams LA, Palmer BW, Moore DJ, Jeste DV,Heaton R. A six-factor model of cognition in schizophrenia
and related psychotic disorders: relationshipswith clinical symp-toms and functional capacity. Schizophr Bull. 2004;30:739–754.
12. Kline RB. Principles and Practice of Structural Equation Mod-eling. New York: The Guilford Press; 1998.
13. Fava JL, Velicer WF. An empirical comparison of factor, im-age, component, and scale scores. Multivariate Behav Res.1992;27:301–322.
14. Kullback S. Information Theory and Statistics. New York:John Wiley & Sons (Republished in 1997 by Dover Publica-tions, Inc.); 1959.
15. Resnick SM. Matching for education in studies of schizophre-nia. Arch Gen Psychiatry. 1992;49:246.
16. Dickinson D, Ramsey M, Gold JM. Overlooking the obvious:a meta-analytic comparison of digit symbol coding tasks andother cognitive measures in schizophrenia. Arch Gen Psychia-try. 2007;64:532–542.
17. Snitz BE, Macdonald AW 3rd, Carter CS. Cognitive deficitsin unaffected first-degree relatives of schizophrenia patients:a meta-analytic review of putative endophenotypes. SchizophrBull. 2006;32:179–194.
18. Wisner KM, Dickinson D, Gold JM, Weinberger DR,Elvevag B. A closer look at siblings discordant for schizophre-nia: the association of symptomatology and gender with cogni-tive phenotypes. Biol Psychiatry. 2009;65:186S–186S.
19. Schaie KW, Maitland SB, Willis SL, Intrieri RC. Longitudi-nal invariance of adult psychometric ability factor structuresacross 7 years. Psychol Aging. 1998;13:8–20.
20. Green MF, Marder SR, Glynn SM, et al. The neurocognitiveeffects of low-dose haloperidol: a two-year comparison withrisperidone. Biol Psychiatry. 2002;51:972–978.
21. Hobart MP, Goldberg R, Bartko JJ, Gold JM. Repeatablebattery for the assessment of neuropsychological status asa screening test in schizophrenia, II: convergent/discriminantvalidity and diagnostic group comparisons. Am J Psychiatry.1999;156:1951–1957.
22. Dickinson D, Iannone VN, Wilk CM, Gold JM. General andspecific cognitive deficits in schizophrenia. Biol Psychiatry.2004;55:826–833.
23. Dickinson D, Ragland JD, Gold JM, Gur RC. General andspecific cognitive deficits in schizophrenia: Goliath defeatsDavid? Biol Psychiatry. 2008;64:823–827.
24. Keefe RS, Bilder RM, Harvey PD, et al. Baseline neurocog-nitive deficits in the CATIE schizophrenia trial. Neuropsycho-pharmacology. 2006;31:2033–2046.
25. Keefe RS, Bilder RM, Davis SM, et al. Neurocognitive effectsof antipsychotic medications in patients with chronic schizo-phrenia in the CATIE Trial. Arch Gen Psychiatry. 2007;64:633–647.
26. Green MF, Kern RS, Braff DL, Mintz J. Neurocognitivedeficits and functional outcome in schizophrenia: are wemeasuring the ‘‘right stuff’’? Schizophr Bull. 2000;26:119–136.
27. Hill SK, Ragland JD, Gur RC, Gur RE. Neuropsychologicalprofiles delineate distinct profiles of schizophrenia, an inter-action between memory and executive function, and unevendistribution of clinical subtypes. J Clin Exp Neuropsychol.2002;24:765–780.
28. Weickert TW, Goldberg TE, Gold JM, Bigelow LB, EganMF,Weinberger DR. Cognitive impairments in patients withschizophrenia displaying preserved and compromised intellect.Arch Gen Psychiatry. 2000;57:907–913.
29. Nuechterlein KH, Green MF, Kern RS, et al. The MATRICSConsensus Cognitive Battery, Part 1: test selection, reliability,and validity. Am J Psychiatry. 2008;165:203–213.
1167
Analyses of Cognitive Test Data