Two-dimensional freezing criteria for crystallizing colloidal monolayers
Upload
independentCategory
view
3download
0
ORIGINAL ARTICLE
Modelling the freezing response of baker’s yeastprestressed cells: a statistical approachM.F. Kronberg1, P.I. Nikel1, P. Cerrutti2 and M.A. Galvagno1,2
1 Instituto de Investigaciones Biotecnologicas, IIB-CONICET, Universidad Nacional de San Martın, Buenos Aires, Argentina
2 Departamento de Ingenierıa Quımica, Facultad de Ingenierıa, Universidad de Buenos Aires, Pabellon de Industrias, Ciudad Universitaria, Buenos
Aires, Argentina
Introduction
During its production, application and storage in the bak-
ing industry, baker’s yeast Saccharomyces cerevisiae
encounters different stressful conditions including supra-
optimal temperatures, hyperosmolarity, low internal pH,
ionic toxicity, freezing and oxidation (Attfield 1997; Heg-
gart et al. 1999; Randez-Gil et al. 1999). There is some
degree of commonality in the nature of damage resulting
from the various stresses encountered. For this reason, it
was proposed that common protection and repair mecha-
nisms can provide tolerance to a broad range of environ-
mental insults. In fact, a single sublethal stress could
predispose to protection against subsequent lethal expo-
sure to the same or other types of stresses (Komatsu et al.
1990; Lewis et al. 1995; Thevelein and De Wilde 1999),
a phenomenon called ‘cross-protection’ (Siderius and
Mager 1997).
The damages and tolerance mechanisms induced by
freezing–thawing (FT) are not fully identified. However,
several hypotheses have been proposed to explain the
damage caused by slow freezing at )20�C (3�C min)1)
and thawing. For instance, cells are damaged by physical
changes associated with ice nucleation and dehydration
(Mazur 1970; Franks et al. 1983; Toner et al. 1993). They
can also be affected by changes in intracellular osmolarity
and pH, which lead to aggregation of macromolecules
and denaturation of proteins (Clegg et al. 1982; Franks
et al. 1983). Besides, an oxidative burst takes place during
thawing, with the concomitant generation of reactive oxy-
gen species and damage of cellular components (Park
et al. 1998).
Keywords
experimental design, freeze tolerance,
prestressed baker’s yeast, response surface
methodology, survival.
Correspondence
Miguel A. Galvagno, Laboratorio de
Microbiologıa Industrial, Departamento de
Ingenierıa Quımica, Facultad de Ingenierıa,
Universidad de Buenos Aires, (1428) Buenos
Aires, Argentina. E-mail: [email protected]
2007 ⁄ 0592: received 13 April 2007, revised 8
August 2007 and accepted 24 August 2007
doi:10.1111/j.1365-2672.2007.03588.x
Abstract
Aims: To study the effect of prestress conditions on the freezing and thawing
(FT) response of two baker’s yeast strains and the use of statistical analysis to
optimize resistance to freezing.
Methods and Results: Tolerance to FT of industrial strains of Saccharomyces ce-
revisiae was associated to their osmosensitivity and growth phase. Pretreatments
with sublethal stresses [40�C, 0Æ5 mol l)1 NaCl, 1Æ0 mol l)1 sorbitol or 5%
(v ⁄ v) ethanol] increased freeze tolerance. Temperature or hyperosmotic pre-
stresses increased trehalose contents, nevertheless no clear correlation was
found with improved FT tolerance. Plackett–Burman design and response sur-
face methodology were applied to improve freeze tolerance of the more osmo-
tolerant strain. Optimal prestress conditions found were: 0Æ779 mol l)1 NaCl,
0Æ693% (v ⁄ v) ethanol and 32Æ15�C.
Conclusions: Ethanol, saline, osmotic or heat prestresses increased freezing tol-
erance of two phenotypically distinct baker’s yeast strains. A relationship
among prestresses, survival and trehalose content was not clear. It was possible
to statistically find optimal combined prestress conditions to increase FT toler-
ance of the osmotolerant strain.
Significance and Impact of the Study: Statistically designed combination of
prestress conditions that can be applied during the production of baker’s yeast
could represent a useful tool to increase baker’s yeast FT resistance.
Journal of Applied Microbiology ISSN 1364-5072
716 Journal compilation ª 2007 The Society for Applied Microbiology, Journal of Applied Microbiology 104 (2008) 716–727
ª 2007 The Authors

Apart of being involved in signalling regulation, treha-
lose plays important functions in protecting membranes
and proteins in several organisms against the adverse
effects of stresses, such as heat, cold, anoxia and dissec-
tion, by stabilizing intact cells in the dry state (Crowe
and Crowe 1988, 1990; Elbein et al. 2003; Crowe 2007).
In S. cerevisiae, tolerance to freezing has generally been
correlated with the intracellular trehalose content,
although a direct correlation was not always found above
a certain threshold value (Attfield et al. 1994; Lewis et al.
1997; Sano et al. 1999; Folch-Mallol et al. 2004). Accu-
mulation of other solutes, such as amino acids and glyc-
erol, and expression of aquaporins were also reported to
increase the freezing resistance (Takagi et al. 1997, 2000;
Tanghe et al. 2002; Shima et al. 2003; Alves-Araujo et al.
2004).
Baker’s yeast quality is strongly dependent on physio-
logical conditioning during biomass production. Thus,
increased stress tolerance can be accomplished by manipu-
lating several factors in the propagation protocols; such as
specific growth rate, molasses pulses, osmolytes addition,
fermentation temperature, aeration, etc.; being the basis of
this approach the cross-protection phenomena above
mentioned (Attfield 1997; Galvagno and Cerrutti 2004).
Several works related to physiological conditioning of
baker’s yeast to FT were conducted using the ‘one-factor-
at-a-time’ technique (Lewis et al. 1997; Park et al. 1997,
1998; Alves-Araujo et al. 2004). However, this approach
failed in locating the region of optimum response because
it does not take into account any joint–factor interac-
tions. Statistical experimental designs are preferred as they
can simultaneously consider several factors at many dif-
ferent levels and allow to determine the interactions
among them using a smaller number of experiments.
Also, they can be used to assess the importance of indi-
vidual factors, appropriateness of their functional form,
and sensibility of the response to each factor.
The purpose of this work was to study the response to
FT of two industrial strains of S. cerevisiae representative
of the types of yeast produced by baker’s yeast manufac-
turers (Bell et al. 2001). We also studied the possible rela-
tionship between the enhanced tolerance to FT and
trehalose levels after exposure to mild-stress conditions.
Statistically designed experiments were used to find the
optimal prestress conditions enhancing yeast resistance to
FT of the osmotolerant strain.
Materials and methods
Yeast strains and growth conditions
Saccharomyces cerevisiae strains Y8 (BAFC 3084) and Y9
(BAFC 3083) were kindly provided by CALSA (Companıa
Argentina de Levaduras S.A.) and used throughout this
study. Y8 and Y9 strains are suited for high-sugar and
no-sugar doughs formulations respectively (supplier’s per-
sonal communication). Cells were grown and maintained
in YEP medium [5 g l)1 yeast extract, 5 g l)1 casein pep-
tone, 3 g l)1 KH2PO4, 3 g l)1 (NH4)2SO4, 10 g l)1 glu-
cose].
Inocula, consisting in a loop full of cells from an agar-
ized YEP plate (20 g l)1 agar), were incubated overnight
in YEP at 28�C and 200 rev min)1 in a rotatory shaker.
Working cultures were inoculated at an initial optical
density of 0Æ05 measured at 640 nm (OD640), and incu-
bated as described. Growth phases were monitored by
assaying glucose and ethanol in the culture supernatants,
and cells were tested for FT tolerance after 16–18 h incu-
bation (fermentative phase), 40 h incubation (respiratory
phase or exhaustion of glucose), and 8–10 h after entry
stationary phase (exhaustion of ethanol; Lewis et al.
1993).
Freezing tolerance assay
Cells, harvested by centrifugation at 1500 g for 10 min,
were washed three times by suspension and centrifugation
with equal volumes of 0Æ1 mol l)1 phosphate buffer (pH
6Æ0). After the final washing step, the pellet was sus-
pended at 1 · 107 cells ml)1 in YEP medium without glu-
cose (YEPNG). When necessary, cells suspended in
YEPNG medium were exposed to sublethal stress pre-
treatments before FT. FT stress was performed by expos-
ing 5 ml of the cellular suspension to two cycles of
freezing at –20�C for 20 and 4 h respectively, and thawing
at 25�C. Survival was determined by diluting cells in
phosphate buffer and plating them onto agarized YEP
plates in quadruplicate. FT survival was recorded after
freezing and the percentage of viable cells number
(CFU ml)1) obtained after FT was compared with values
of unfrozen samples.
Sublethal stress pretreatments
Mild-stress pretreatments were performed by incubating
5-ml aliquots of the cell suspension in YEPNG (c. 107
UFC ml)1) as follows: (a) heat-shock, cellular suspension
was incubated at 40�C in a 22 mm-Pyrex tube, and stress
was halted at 0�C; (b) ethanol, 5% (v ⁄ v) ethanol; (c) oxi-
dative, 5Æ0 mmol l)1 H2O2; (d) acid, 0Æ2% (v ⁄ v) acetic
acid; (e) saline, 0Æ5 mol l)1 NaCl; (f) osmotic, 1Æ0 mol l)1
sorbitol. Except for heat-shock, cells subjected to mild-
stresses were incubated at 25�C for 2 h and the stresses
were stopped by washing the cells with phosphate buffer.
Finally, cells suspended in YEPNG, were frozen and
thawed as described above. Mild-stress conditions were
M.F. Kronberg et al. Freezing tolerance of prestressed yeast strains
ª 2007 The Authors
Journal compilation ª 2007 The Society for Applied Microbiology, Journal of Applied Microbiology 104 (2008) 716–727 717

selected to provide a survival greater than 80% (i.e. suble-
thal stresses) after pretreatments.
Vitality assay
Vitality assay was performed by the acidification power
test described by Kara et al. (1988) modified as follows:
cells were harvested by centrifugation at 40–42 h cultiva-
tion and washed three times with phosphate buffer,
then suspended at 1–5 · 107 cells ml)1 in YEPNG, and
exposed to FT stress as described. Cells were washed three
times by suspension and centrifugation with chilled
bi-distilled water and suspended in an equal volume of
bi-distilled water at 25�C. The pH of the yeast suspension
was recorded for 10 min at 1 min intervals using a pH-
meter fitted with temperature compensation. Thereafter,
glucose was added at 10 g l)1 and pH was recorded as for
another 10 min at 1-min intervals.
Analytical procedures
Intracellular trehalose concentration
An aliquot of 5 ml of cell suspension (c. 5 · 107 cells)
was centrifuged, the cell pellet was washed with phos-
phate buffer, frozen immediately in liquid N2 and main-
tained at )80�C until analysis. Intracellular trehalose
concentration was assessed as described by Hounsa et al.
(1998). Briefly, trehalose was extracted from the samples
in 1 ml of boiling 0Æ25 mol l)1 Na2CO3 for 20 min.
Aliquots of 0Æ2 ml were neutralized by adding 0Æ1 ml of
1 mol l)1 acetic acid and 0Æ1 ml of buffer T
(0Æ30 mol l)1 sodium acetate and 0Æ03 mol l)1 CaCl2,
pH 5Æ5). Aliquots of 200 ll of this mixture were incu-
bated with an equal volume of trehalase (Sigma-Aldrich
T-8778, diluted 1 ⁄ 3; Sigma-Aldrich, St Louis, MO) for
1 h at 40�C. The glucose released was assayed as
described below. Trehalose concentration was expressed
as percentage of dry cellular mass (% w ⁄ w). Cell dry
weight was calculated from absorbance values (1 OD640
unit was equivalent to 0Æ59 ± 0Æ02 g l)1 for Y8, and
0Æ73 ± 0Æ03 g l)1 for Y9, by previously running calibra-
tion curves of OD640 vs cell dry weight).
Glucose and ethanol determinations
Glucose and ethanol were determined enzymatically in
aliquots of supernatants of culture broths: glucose was
assayed by the glucose oxidase–peroxidase method
(Wiener Laboratories, Rosario, Argentina) as recom-
mended by the supplier. Ethanol was determined using a
kit provided by Randox (Randox Laboratories Ltd,
Oceanside, CA, USA), based on the reaction with alcohol
dehydrogenase. Standard curves were constructed using
authentic glucose and ethanol solutions.
Statistical experimental designs and statistical analysis
In the screening step, a Plackett–Burman design (PBD), a
two-level multifactorial design based on the rationale
known as balanced incomplete blocks (Stanbury et al.
1986), was used. The key to this technique is forming
various combinations (which are called assemblies) of the
variables to be studied with varying amounts. With PBD,
up to N–1 components can be studied in N assemblies,
where N must be a multiple of four. As the number of
components used in this part of the study was four, a
design consisting of four assemblies was used. PBD
assumes that there are no interactions between the differ-
ent media constituents; then, a linear approach is consid-
ered to be sufficient for screening:
Y ¼ b0 þX
i
bixi i¼ 1; 2;:::;k ð1Þ
where Y is the estimated target function and bi represents
the regression coefficient and b0 the intercept. The main
effect of each factor can be simply calculated as the differ-
ence between the average of measurements made at the
high level (+1) of the factor and the average of measure-
ments at the low level ()1). Linear effects of temperature
(x1), NaCl (x2), ethanol (x3) and time of exposure (x4)
were evaluated.
To optimize the levels of critical factors in the prestress
medium, the response surface methodology was assessed
with a central composite design (CCD) using five coded
levels was applied. CCD (Box and Wilson 1951) and the
mathematical model are derived from orthogonal polyno-
mial fitting techniques. Significance of factorial interac-
tion of variables is considered to arrive at the optimum
condition. CCD is essentially a full 23-factorial design
with its eight cube points, two replications at the centre
point and six star points. Levels corresponding to the
centre and the walls of the cube are designated 0, )1, and
+1. A star point is the one that has an axial distance of
Fa (a = 1Æ682) for one factor and 0 for the other two fac-
tors. Central points provide additional degrees of freedom
for error estimation, which increases power when testing
the significance of effects and the a-value is the distance
of the axial points. A software package (Essential Regres-
sion 2Æ205 and Origin 7Æ5) was used to fit the second-
order model to the independent variables using the
following equation:
Y ¼ b0 þXk
i¼1
bixi þXk
j¼2
Xj�1
i¼1
bijxixj þXk
i¼1
biix2i ð2Þ
where Y is the dependent variable (response variable) to
be modelled, xi and xj are the independent variables
(factors), and b0, bi, bij and bii are the regression coeffi-
Freezing tolerance of prestressed yeast strains M.F. Kronberg et al.
718 Journal compilation ª 2007 The Society for Applied Microbiology, Journal of Applied Microbiology 104 (2008) 716–727
ª 2007 The Authors

cients of the model (intercept, linear, interactive and qua-
dratic coefficients respectively). When it was possible, the
model was simplified by dropping terms, which were not
statistically significant (P > 0Æ05) by an analysis of vari-
ance (anova). The lack-of-fit test was used to determine
whether the constructed model was adequate to describe
the observed data. The R2 statistic indicates the percent-
age of the variability of the optimization parameter that
is explained by the model. Three-dimensional surface
plots were drawn to illustrate the main and interactive
effects of the independent variables on the dependent
ones.
In both PBD and CCD, the response parameters were
the survival percentage and the trehalose content. Also, in
both designs the variable levels Xi were coded as xi
according to eqn (3):
xi ¼Xi � X0
DXii ¼ 1; 2; 3;:::;k ð3Þ
where xi and Xi are the dimensionless (codified) value
and the actual value of an independent variable, respec-
tively, X0 is the real value of an independent variable at
centre point and DXi the step change. All experiments
described in this paper were carried out at least by dupli-
cate and repeated at least three times.
Results
Viability and vitality after freezing and thawing
To investigate the sensitivity to FT stress of both strains,
we studied the maintenance of cell viability and vitality
following freezing stress. Viability after FT was examined
throughout the different phases of growth in batch
cultures using glucose as carbon source. As can be seen
in Fig. 1a, cells improved resistance to FT as they pro-
gressed from the fermentative to the respiratory phase
(implicating dependency on mitochondrial functions),
maintaining the survival values at the stationary phase.
These results are not surprising as yeast cells exiting
from the exponential phase and approaching to station-
ary phase of growth become more resistance to stresses
(Lewis et al. 1993). Similar results were found by Park
et al. (1997) using a laboratory strain of S. cerevisiae.
We also found that response of these industrial strains
to FT was not only growth-phase specific but also strain
dependent. Thus, the osmotolerant strain Y8 was
more resistant to FT than Y9 in all the growth phases
tested.
Given that high quality baker’s yeast production not
only depends on the maintenance of its viability but also
on its physiological status, it was important to determi-
nate yeast vitality or fermentative performance as well.
Hence, both yeast strains at the respiratory phase of
growth were subjected to the vitality assay after FT
(Fig. 1b). The acidification power was calculated by sub-
stracting the pH values of the yeast cell suspension at
20 min from the pH at 10 min (DpH). Upon addition of
glucose to the resting cell suspension, pH decrease was
similar in both strains in nonstressed cultures
(DpH = 1Æ25 and 1Æ28 for Y9 and Y8 respectively). On
the other hand, vitality of Y9 strain after freezing was sig-
nificantly reduced when compared with that of Y8
(DpH = 0Æ39 and 1Æ03 respectively). Moreover, values for
the acidification power test calculated before glucose
addition (i.e. DpH10 min ) DpH0 min), were 0Æ08 and 1Æ02
for Y9 and Y8 respectively. Taken together, these results
indicate that in the nonosmotolerant strain Y9 not only
the capability of cell duplication, but also glycolytic activ-
ity (reflecting fermentation performance) were signifi-
cantly affected by FT. The opposite was true for Y8.
According to the theory of the acidification power test
0
10
20
30
40(a)
(b)
Fermentative Respiratory Stationary
Growth phase
Sur
viva
l (%
)
4·0
4·5
5·0
5·5
6·0
6·5
7·0
0 5 10 15 20 25
pH
Time (min)
Figure 1 (a) Survival percentage after FT of two strains of baker’s
yeast at different growth phases: osmosensitive strain (Y9, open bars),
osmoresistant (Y8, closed bars). (b) Acidification power test at respira-
tory growth phase before (open symbols) and after FT (closed sym-
bols) of Y9 (squares) and Y8 strains (triangles). The results represent
the mean values ± SD of four independent experiments.
M.F. Kronberg et al. Freezing tolerance of prestressed yeast strains
ª 2007 The Authors
Journal compilation ª 2007 The Society for Applied Microbiology, Journal of Applied Microbiology 104 (2008) 716–727 719

(Kara et al. 1988), the first slope of the curves (0–10 min)
in Fig. 1b, suggests a higher accumulation of endogenous
energy reserves (glycogen and ⁄ or trehalose) in the osmo-
tolerant strain.
Improving FT resistance by pretreatments with sublethal
stresses
We investigated if the response of baker’s yeast to FT
stress was altered when cells in the respiratory phase (as
is the metabolic stage in fed-batch fermentations used for
baker’s yeast production), were previously exposed to dif-
ferent sublethal stresses. Cells were pretreated with differ-
ent stresses that baker’s yeast could encounter during
its production: hyperosmolar (0Æ5 mol l)1 NaCl or
1Æ0 mol l)1 sorbitol), metabolic (50 lg ml)1 cyclohexi-
mide), supra-optimal temperatures (40�C), and oxidative
(5 mmol l)1 H2O2); before being submitted to FT. As can
be seen in Fig. 2(a), only pretreatments with NaCl, heat,
ethanol or sorbitol improved FT tolerance in both strains.
For example, for the osmotic (sorbitol) prestress survival
values after FT were 89Æ33 and 70Æ68% (compared with
27Æ71% and 7Æ52% for the nonprestressed cells) for Y8
and Y9 respectively.
In S. cerevisiae, trehalose has been positively correlated
with stress tolerance (D’Amore et al. 1991; De Virgilio
et al. 1994; Lewis et al. 1995; Hounsa et al. 1998). In
accordance, we found that nonstressed cells of the FT-
resistant Y8 strain accumulated higher intracellular levels
of the disaccharide in the respiratory phase of growth,
than the less tolerant strain Y9 (4Æ52% vs 2Æ86%), showing
a higher viability values after FT (Figs 1 and 2a). To
investigate a possible relationship between trehalose levels
and FT, intracellular accumulation of this solute was
measured in prestressed cells of both strains before being
exposed to FT. Figure 2(b) also shows that trehalose con-
tent increased to values higher than 5% in Y8 after pre-
treatments with NaCl, heat or sorbitol, been these
increase accompanied by an increase in survival to FT
(Fig. 2a) suggesting a priori a relationship between FT
survival and trehalose accumulation for this strain. How-
ever, ethanol pretreatment, which improved survival in
both strains, did not produce a significant change in tre-
halose levels in Y8 nor in Y9 strains, suggesting that the
ethanol stress response operates through a pathway inde-
pendent from trehalose. Also, in Y9 prestress treatments
(except for ethanol), which improved survival to FT, pro-
duced an increase in trehalose levels attaining values up
to 3Æ5% in a stress-dependent manner (Fig. 2), and an
almost linear relationship between trehalose accumulation
and survival percentage after FT was found (R2 = 0Æ930;
data not shown). A different behaviour was found for the
osmotolerant strain Y8. In this strain, a linear relationship
between trehalose content and FT tolerance was not so
strong (R2 = 0Æ674), but a threshold value of c. 5% treha-
lose appears to be reached to increase FT survival
(Fig. 2b). Higher levels of trehalose were necessary for Y8
to attain survival values similar to those found for Y9
(5Æ61% and 3Æ34% respectively).
Taken together, these results indicate that the contribu-
tion of trehalose to tolerance to freezing is rather incon-
sistent, therefore trehalose content should not be used as
a general predictor of FT tolerance, at least in these
industrial strains.
Optimization of sublethal prestress conditions to
improve FT resistance by experimental designs
methodology
Taking into account that pretreatment with NaCl, heat
or ethanol improved FT tolerance in the strains under
study, it seemed worthwhile to investigate in more
detail the effect of those sublethal prestresses concomi-
tantly in Y8 to improve its FT survival. This strain
showed to be the more promising one to be manipu-
0
1
2
3
4
5
6
Con
trol
Oxi
dativ
e
Aci
dic
Sal
ine
Hea
t
Eth
anol
Osm
otic
0
20
40
60
80
100(a)
(b)
Sub-lethal stress pre-treatment
Sur
viva
l (%
) T
reha
lose
(%
w/w
)
Figure 2 (a) Survival percentage after FT and (b) intracellular treha-
lose content of the two baker’s yeast strains at respiratory growth
phase subjected or not to different sublethal prestresses as described
in Materials and methods. Osmosensitive strain (Y9, open bars), osmo-
resistant (Y8, closed bars). The results represent the mean values ± SD
of four independent experiments.
Freezing tolerance of prestressed yeast strains M.F. Kronberg et al.
720 Journal compilation ª 2007 The Society for Applied Microbiology, Journal of Applied Microbiology 104 (2008) 716–727
ª 2007 The Authors

lated physiologically to enhance its freeze tolerance
because after being submitted to certain prestress condi-
tions it could attain higher FT survival values (near to
90%). For this reason, it could be very useful to use Y8
in frozen dough technology.
To assess the relative importance of each sublethal
stress conditions on FT survival and on intracellular accu-
mulation of trehalose, the effect of NaCl, ethanol concen-
trations, temperature as well as the time of exposure to
pretreatments were first evaluated modulating the vari-
ables according to a PBD. Table 1 shows the PBD used,
the coded and the actual levels of the independent vari-
ables and the responses attained. The results show that
survival widely varied in the range from 20% to 100%,
depending on the conditions tested while trehalose levels
did not significantly changed.
Table 2 shows that of the four combined independent
variables only NaCl and ethanol had a relevant influ-
ence, with P < 0Æ05 (i.e. statistical confidence >95%) in
survival to freezing. NaCl combined with ethanol and
heat showed a significant effect on trehalose accumula-
tion. The equations obtained for survival to freezing and
for trehalose accumulation as a function of the actual
variables were:
Survival ð%Þ ¼ 94�886� 0�762 temperature ð�CÞþ 54�392 NaCl ðmol l�1Þ� 7�302 ethanol ð% v=vÞþ 0�019 incubation time ðhÞ
Trehalose ð% w=wÞ ¼ 4�286� 0�047 temperature ð�CÞþ 1�606 NaCl ðmol l�1Þþ 0�166 ethanol ð% v=vÞþ 0�125 incubation time ðhÞ
Regarding survival of Y8 after FT, among the pre-
treatments in the ranges assayed, ethanol had a negative
estimate, meaning that survival decreased as the ethanol
concentrations raised from 1% to 5% (v ⁄ v). On the
contrary NaCl influenced very significantly survival, hav-
ing at the same time a very large and positive estimate.
This means that the percentage of survival to FT
increased as the salt concentration changed from 0Æ2 to
1Æ0 mol l)1.
Saline prestress had a very significant effect on treha-
lose accumulation presenting at the same time the largest
estimate with respect to the other prestress conditions
assayed. The ethanol and temperature effect on the disac-
charide accumulation were slightly significant and pre-
sented a low estimate, meaning that they did not greatly
influence that response. On the other hand, exposition
times from 1 to 3 h to the different mild-stresses had not
a significant effect on survival to freezing nor on trehalose
accumulation.
Fisher’s F-test demonstrated that the model was signifi-
cant (Table 3). The lack of fit of the model was signifi-
cant (P < 0Æ05). This result means that the proposed
equation may not have included all appropriate functions
of independent variables or else that the experimental
Table 1 Plackett–Burman screening design and responses observed for Y8 strain
Trial
Factor level* Response�
Temperature NaCl Ethanol Incubation time Survival Trehalose
1 0� 35 0 0Æ6 0 3 0 2 97Æ21 4Æ28
2 +1 42 )1 0Æ2 )1 1 )1 1 67Æ51 3Æ15
3 )1 28 +1 1Æ0 +1 5 )1 1 88Æ31 5Æ15
4 +1 42 )1 0Æ2 +1 5 +1 3 20Æ51 4Æ33
5 +1 42 +1 1Æ0 +1 5 )1 1 88Æ61 4Æ42
6 )1 28 +1 1Æ0 )1 1 )1 1 82Æ80 5Æ61
7 0 35 0 0Æ6 0 3 0 2 109Æ41 4Æ09
8 )1 28 )1 0Æ2 )1 1 )1 1 92Æ90 3Æ45
9 +1 42 )1 0Æ2 +1 5 )1 1 18Æ82 3Æ97
10 )1 28 )1 0Æ2 +1 5 +1 3 36Æ90 4Æ09
11 )1 28 +1 1Æ0 +1 5 +1 3 98Æ28 6Æ52
12 )1 28 )1 0Æ2 )1 1 +1 3 71Æ88 3Æ64
13 +1 42 +1 1Æ0 )1 1 +1 3 105Æ81 4Æ33
14 +1 42 +1 1Æ0 )1 1 +1 3 105Æ81 4Æ33
15 0 35 0 0Æ6 0 3 0 2 102Æ30 4Æ45
*Temperature in �C, NaCl concentration in mol l)1, ethanol concentration in % (v ⁄ v), incubation time in h.
�Data represent the average of four independent experiments. Survival is expressed as a percentage, trehalose content in percentage of dry cellu-
lar mass.
�Numbers in the first column are the coded values of the variables.
M.F. Kronberg et al. Freezing tolerance of prestressed yeast strains
ª 2007 The Authors
Journal compilation ª 2007 The Society for Applied Microbiology, Journal of Applied Microbiology 104 (2008) 716–727 721
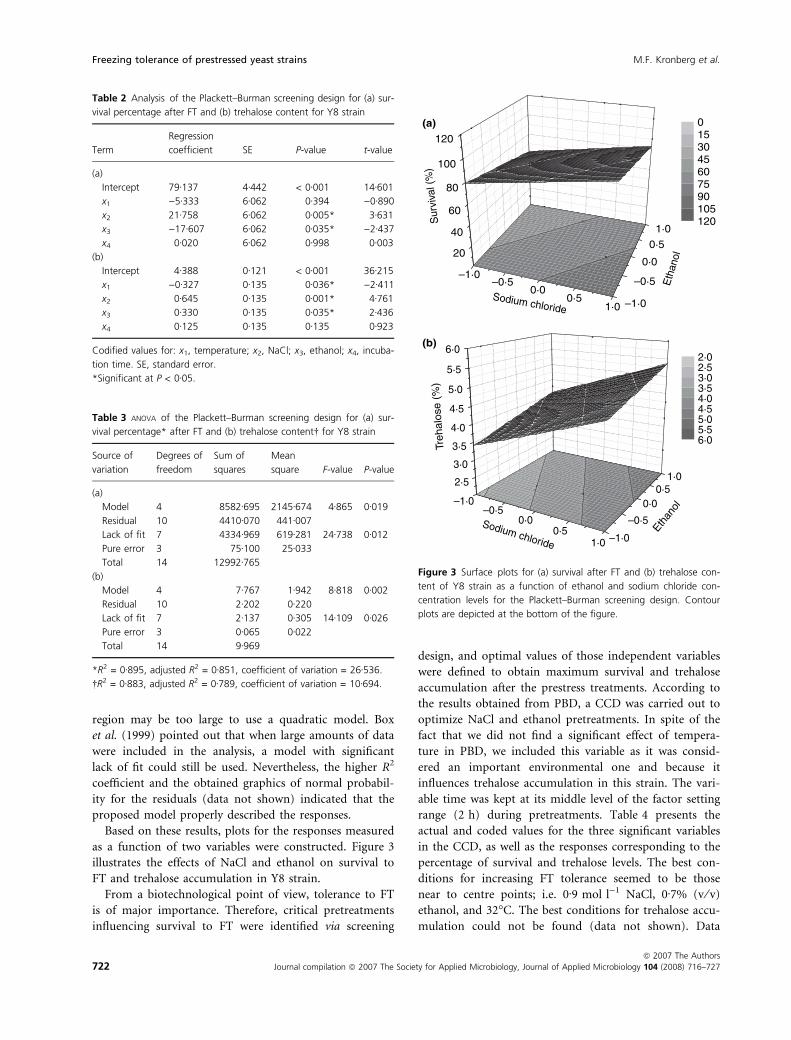
region may be too large to use a quadratic model. Box
et al. (1999) pointed out that when large amounts of data
were included in the analysis, a model with significant
lack of fit could still be used. Nevertheless, the higher R2
coefficient and the obtained graphics of normal probabil-
ity for the residuals (data not shown) indicated that the
proposed model properly described the responses.
Based on these results, plots for the responses measured
as a function of two variables were constructed. Figure 3
illustrates the effects of NaCl and ethanol on survival to
FT and trehalose accumulation in Y8 strain.
From a biotechnological point of view, tolerance to FT
is of major importance. Therefore, critical pretreatments
influencing survival to FT were identified via screening
design, and optimal values of those independent variables
were defined to obtain maximum survival and trehalose
accumulation after the prestress treatments. According to
the results obtained from PBD, a CCD was carried out to
optimize NaCl and ethanol pretreatments. In spite of the
fact that we did not find a significant effect of tempera-
ture in PBD, we included this variable as it was consid-
ered an important environmental one and because it
influences trehalose accumulation in this strain. The vari-
able time was kept at its middle level of the factor setting
range (2 h) during pretreatments. Table 4 presents the
actual and coded values for the three significant variables
in the CCD, as well as the responses corresponding to the
percentage of survival and trehalose levels. The best con-
ditions for increasing FT tolerance seemed to be those
near to centre points; i.e. 0Æ9 mol l)1 NaCl, 0Æ7% (v ⁄ v)
ethanol, and 32�C. The best conditions for trehalose accu-
mulation could not be found (data not shown). Data
Table 2 Analysis of the Plackett–Burman screening design for (a) sur-
vival percentage after FT and (b) trehalose content for Y8 strain
Term
Regression
coefficient SE P-value t-value
(a)
Intercept 79Æ137 4Æ442 < 0Æ001 14Æ601
x1 )5Æ333 6Æ062 0Æ394 )0Æ890
x2 21Æ758 6Æ062 0Æ005* 3Æ631
x3 )17Æ607 6Æ062 0Æ035* )2Æ437
x4 0Æ020 6Æ062 0Æ998 0Æ003
(b)
Intercept 4Æ388 0Æ121 < 0Æ001 36Æ215
x1 )0Æ327 0Æ135 0Æ036* )2Æ411
x2 0Æ645 0Æ135 0Æ001* 4Æ761
x3 0Æ330 0Æ135 0Æ035* 2Æ436
x4 0Æ125 0Æ135 0Æ135 0Æ923
Codified values for: x1, temperature; x2, NaCl; x3, ethanol; x4, incuba-
tion time. SE, standard error.
*Significant at P < 0Æ05.
Table 3 ANOVA of the Plackett–Burman screening design for (a) sur-
vival percentage* after FT and (b) trehalose content� for Y8 strain
Source of
variation
Degrees of
freedom
Sum of
squares
Mean
square F-value P-value
(a)
Model 4 8582Æ695 2145Æ674 4Æ865 0Æ019
Residual 10 4410Æ070 441Æ007
Lack of fit 7 4334Æ969 619Æ281 24Æ738 0Æ012
Pure error 3 75Æ100 25Æ033
Total 14 12992Æ765
(b)
Model 4 7Æ767 1Æ942 8Æ818 0Æ002
Residual 10 2Æ202 0Æ220
Lack of fit 7 2Æ137 0Æ305 14Æ109 0Æ026
Pure error 3 0Æ065 0Æ022
Total 14 9Æ969
*R2 = 0Æ895, adjusted R2 = 0Æ851, coefficient of variation = 26Æ536.
�R2 = 0Æ883, adjusted R2 = 0Æ789, coefficient of variation = 10Æ694.
–1·0–0·5
0·00·5
1·0
20
40
60
80
100
120
(a)
(b)
–1·0
–0·5
0·0
0·5
1·0
Sur
viva
l (%
)
Eth
anol
0153045607590105120
–1·0–0·5
0·00·5
1·0
2·5
3·0
3·5
4·0
4·5
5·0
5·5
6·0
–1·0
–0·5
0·00·5
1·0
Treh
alos
e (%
)
Ethan
ol
Sodium chloride
Sodium chloride
2·02·53·03·54·04·55·05·56·0
Figure 3 Surface plots for (a) survival after FT and (b) trehalose con-
tent of Y8 strain as a function of ethanol and sodium chloride con-
centration levels for the Plackett–Burman screening design. Contour
plots are depicted at the bottom of the figure.
Freezing tolerance of prestressed yeast strains M.F. Kronberg et al.
722 Journal compilation ª 2007 The Society for Applied Microbiology, Journal of Applied Microbiology 104 (2008) 716–727
ª 2007 The Authors

obtained for FT tolerance were analysed by multiple
regression (Table 5). The experimental results of the CCD
were fitted and explained with a second order polynomial
function [eqn (2)]. The significance of each coefficient
was determined by Student’s t-test and P-values, listed in
Table 5. As can be seen, linear and quadratic effects of
NaCl and ethanol, as well as the corresponding interactive
coefficient, were significant for survival, although at dif-
ferent levels.
Table 6 shows the results of anova for CCD. The lack
of fit of the regression model was not significant, and Fi-
scher’s F test demonstrated a high significance for the
regression. The fitness of the model was checked by the
determination coefficient (R2). In this case, the value of
R2 = 0Æ915 indicates that only 8Æ5% of the total variations
are not explained by the model. In addition, the value
of the adjusted determination coefficient (adjusted
R2 = 0Æ837) advocates for a high significance of the model
(Haaland 1987). At the same time, a relatively lower value
of the coefficient of variation (CV = 10Æ887) indicates an
improved precision and reliability of the experiments
(Montgomery 2001).
With the aim to increase FT survival, the most impor-
tant response from a biotechnological point of view, we
further studied the optimization of prestress conditions to
reach that objective. Trehalose accumulation studies were
also carried out.
Response surface plots were obtained as function of
two variables at a time (namely, NaCl and ethanol),
maintaining all other conditions at fixed levels. Percent-
age of survival for different combinations of prestress
conditions can be predicted from these plots (Fig. 4a).
The maximum predicted survival is indicated by the
surface confined in the response surface diagrams as can
be seen from the tri-dimensional response surface and
contour plots (representing the regression equation for
survival after FT), where the effect of pairwise interac-
tion of the two variables is depicted. Figure 4b shows
the response surface for trehalose accumulation, demon-
strating that its dependence on NaCl and ethanol levels
is quite different when compared with that of survival
percentage.
Combination of parameters resulting in optimal sur-
vival to FT was obtained by numerical analysis, solving
the system of partial derivatives (dY ⁄ dx1, dY ⁄ dx2,
dY ⁄ dx3) for the different independent variables. For sur-
vival, the optimal values for the variables in coded units
Table 4 Central composite design and responses observed for Y8
strain
Trial
Factor level* Response�
NaCl Ethanol Temperature Survival Trehalose
1 0� 0Æ9 0 0Æ7 a§ 42Æ73 67Æ84 3Æ68
2 0 0Æ9 0 0Æ7 )a 25Æ27 47Æ89 3Æ35
3 0 0Æ9 0 0Æ7 0 32Æ00 95Æ77 3Æ66
4 a 1Æ4 0 0Æ7 0 32Æ00 59Æ86 3Æ54
5 0 0Æ9 0 0Æ7 0 32Æ00 93Æ78 3Æ67
6 1 1Æ2 1 1Æ2 )1 28Æ00 68Æ84 3Æ11
7 )a 0Æ4 0 0Æ7 0 32Æ00 75Æ82 2Æ91
8 )1 0Æ6 1 1Æ2 )1 28Æ00 75Æ82 3Æ05
9 )1 0Æ6 )1 0Æ2 1 36Æ00 69Æ83 3Æ54
10 0 0Æ9 )a 0Æ0 0 32Æ00 81Æ41 4Æ11
11 0 0Æ9 0 0Æ7 0 32Æ00 90Æ01 3Æ72
12 )1 0Æ6 1 1Æ2 1 36Æ00 83Æ80 3Æ44
13 1 1Æ2 )1 0Æ2 1 36Æ00 61Æ85 3Æ62
14 1 1Æ2 1 1Æ2 1 36Æ00 67Æ84 3Æ52
15 0 0Æ9 a 1Æ5 0 32Æ00 77Æ81 3Æ72
16 )1 0Æ6 )1 0Æ2 )1 28Æ00 89Æ79 3Æ09
*Temperature in �C, NaCl concentration in mol l)1, ethanol concen-
tration in % (v ⁄ v).
�Data represent the average of four independent experiments. Sur-
vival is expressed as a percentage, trehalose content in percentage of
dry cellular mass.
�Numbers in the first column are the coded values of the variables.
§a = 1Æ682.
Table 5 Analysis of the central composite optimization design for
survival percentage after FT for Y8 strain
Term
Regression
coefficient SE P-value t-value
Intercept 92Æ829 4Æ682 <0Æ001 19Æ83
x1 )6Æ303 2Æ199 0Æ024* )2Æ87
x2 0Æ457 2Æ199 0Æ048* 2Æ21
x3 1Æ534 2Æ199 0Æ508 0Æ70
x12 )7Æ723 2Æ420 0Æ015* )3Æ19
x1x2 1Æ670 2Æ873 0Æ037* 3Æ58
x1x3 1Æ420 2Æ873 0Æ636 0Æ49
x22 )3Æ674 2Æ420 0Æ017* )2Æ51
x2x3 3Æ321 2Æ873 0Æ286 1Æ16
x32 )11Æ249 2Æ420 0Æ235 26Æ1
Codified values for: x1, sodium chloride; x2, ethanol; x3, temperature.
*Significant at P < 0Æ05.
Table 6 ANOVA of the central composite optimization design for sur-
vival percentage after FT for Y8 strain
Source of
variation
Degrees of
freedom
Sum of
squares
Mean
square F-value P-value
Model 9 2375Æ696 263Æ966 3Æ998 0Æ041
Residual 7 462Æ154 66Æ022
Lack of fit 5 445Æ037 89Æ007 10Æ400 0Æ090
Pure error 2 17Æ117 8Æ558
Total 16 2837Æ850
R2 = 0Æ915, adjusted R2 = 0Æ837, coefficient of variation = 10Æ887.
M.F. Kronberg et al. Freezing tolerance of prestressed yeast strains
ª 2007 The Authors
Journal compilation ª 2007 The Society for Applied Microbiology, Journal of Applied Microbiology 104 (2008) 716–727 723

were as follows: x1 = )0Æ404, x2 = )0Æ015 and x3 =
0Æ037; and the actual levels obtained by substituting the
respective values of xi in eqn (1) were: 0Æ779 mol l)1
NaCl, 0Æ693% (v ⁄ v) ethanol and 32Æ15�C. As stated pre-
viously, optimal values of the prestress conditions to
obtain maximal trehalose accumulation were quite dif-
ferent, indicating again that environmental conditions
conducive to optimum survival to freezing did not nec-
essarily parallel those conditions improving trehalose
accumulation.
Validation of the model was based on the optimum
values of NaCl, ethanol and temperature mentioned
above (carried out in four prestress independent experi-
ments). The predicted responses by the model were
93Æ33% for survival and 4Æ03% for trehalose, while the
actual responses were 92Æ59 ± 5Æ83% and 3Æ98 ± 0Æ45%
respectively. The results of the validation experiments
provide further evidence of the model applicability.
Discussion
In this study, we demonstrated that the principle of
cross-protection could be applied to optimize baker’s
yeasts tolerance to freezing by physiological conditioning.
To achieve this goal we used the methodology of experi-
mental designs, which represent a more balanced alterna-
tive to the ‘one-factor-at-a-time’ technique (for a review,
see Strobel and Sullivan 1999).
Preliminary experiments demonstrated that the osmo-
resistant strain was more tolerant to FT, thus confirming
a mechanistic similarity between osmotic and FT stress,
either in the type of injuries caused by the stresses (Hat-
ano et al. 1996; Hernandez-Lopez et al. 2003), or mecha-
nism for repairing damage that is sustained (Lewis et al.
1997). Also, we showed that FT tolerance was higher with
a respiratory metabolism or in the stationary phase of
growth, that are the physiological status of an industrially
manufactured baker’s yeast by a fed-batch protocol
with ⁄ without maturation period.
In commercial use, high quality baker’s yeast must be
able not only to survive to FT but also vitality or baking
performance has to be maintained. We showed that
the acidification power test could be used to assess yeast’s
fermentation performance. This test can be carried out
with a simple laboratory device, thus providing the basis
for a quality control method for selecting the best yeast
strain to resist the different stresses encountered during
its commercial and industrial uses. Moreover, this cheap
test can be conducted in a shorter period of time and
even could replace the time-consuming baking or gassing
power test carried out as a quality control test in baker’s
yeast manufacturing plants.
The importance of trehalose accumulation as a deter-
minant of baker’s yeast stability has been known for a
long time (Gancedo and Flores 2004). Our studies, car-
ried out with two representative strains of industrial
baker’s yeasts (Y8 and Y9) having distinctive phenotypes,
showed that the more freezing resistant (osmotolerant)
strain constitutively presented higher levels of trehalose
and that generally this parallels with increased freeze
resistance (Fig. 1), and our results suggest that trehalose
could play a role in FT. However, while in Y9 (osmosen-
sitive strain) a linear correlation between trehalose accu-
mulation and survival to FT was found, a lack of a strong
correlation between those parameters in Y8 would still
suggest a relationship between trehalose and freeze toler-
ance, even when a linear correlation could not be found.
Our results are in good agreement with those of other
authors, that have also noted inconsistencies between tre-
halose levels and stress tolerance (Gelinas et al. 1989;
Panek et al. 1990; Winkler et al. 1991; Slaugthter and
Nomura 1992; Ratnakumar and Tunnacliffe 2006) and
–2–1
01
2
50
60
70
80
90(a)
(b)
–2
–1
012
Sur
viva
l (%
)
Eth
anol
Sodium chloride
45·0051·2557·5063·7570·0076·2582·5088·7595·00
–2–1
0
1
2–2
–10
122·5
3·0
3·5
4·0
Tr
ehal
ose
(%)
Sodium chloride
Eth
anol
2·502·692·873·063·253·433·623·814·00
Figure 4 Response surface plots for (a) survival percentage after FT
and (b) trehalose content of Y8 strain as a function of ethanol and
sodium chloride concentration levels for the central composite design.
Contour plots are shown at the bottom of the figure.
Freezing tolerance of prestressed yeast strains M.F. Kronberg et al.
724 Journal compilation ª 2007 The Society for Applied Microbiology, Journal of Applied Microbiology 104 (2008) 716–727
ª 2007 The Authors

supported the idea that trehalose levels and stress toler-
ance are not strictly related in a linear manner, but a
threshold level of the disaccharide appears to be necessary
for relatively high stress tolerance to freezing (Attfield
et al. 1994; Lewis et al. 1997). This behaviour was exhib-
ited by Y8, as trehalose values higher than 5% were neces-
sary for this strain to present high resistance to FT.
On the other hand, trehalose did not directly contrib-
ute to increase tolerance to FT in the strains studied, as
ethanol pretreatment alone that produced a significant
increase in survival after freezing stress, did not produce
an accompanying increase in trehalose levels. It has not
to be overruled that the combined effect of other factors
apart from trehalose may contribute to stress tolerance in
these strains, thus dominating over the trehalose effect.
Although there was not a consistent relationship between
intracellular trehalose concentrations and freezing toler-
ance, the disaccharide might be recommended but
seemed to be not necessary to increase FT tolerance. The
increase of trehalose endogenous levels by manipulating
culture conditions could improve robustness of baker’s
yeast cells facing different stressing conditions during
industrial manipulation.
Statistical methods used in this study to find prestress
conditions conducive to increase FT tolerance of an
industrial strain of S. cerevisiae allowed us to assess not
only the effect of various prestress conditions separately
but also their interactions. Thus, ethanol pretreatment
applied concomitantly along with heat and NaCl were
conditions that significant increased trehalose levels. On
the other hand, under our experimental conditions
though heat pretreatment assayed alone was effective in
increasing survival to freezing, its influence when assayed
together with those of salt and ethanol pretreatments, was
overlooked against NaCl and ethanol pretreatments.
Moreover, ethanol pretreatment in combination with
temperature and NaCl was statistically significant to
increase freeze tolerance.
Optimal prestress conditions to obtain higher tolerance
to freezing and for trehalose accumulation (as indicative
of general robustness), were determined experimentally by
using response surface methodology. The validity of the
model was proved by fitting the values of the prestress
conditions into a model equation and by carrying out the
experiments using the optimal values of three prestress
conditions (salt, ethanol and heat). Response surface
methodology analysis allowed fine-tuning of the prestress
conditions needed to be applied to our industrial baker’s
yeast strain to increase their tolerance to freezing. We
found that NaCl pretreatment had statistically the greatest
effect in increasing FT tolerance; nevertheless, we estab-
lished also ethanol and temperature conditions to fix
other important process variables in baker’s yeast propa-
gation that be easily manipulated during yeast propaga-
tion even at an industrial scale.
Thus, we demonstrated that the simultaneous applica-
tion of prestress mild conditions [0Æ779 mol l)1 NaCl,
0Æ693% (v ⁄ v) ethanol and 32Æ15�C] for 1–2 h, condition
easy to fulfil during biomass production at an industrial
scale, should be applied to maximize survival of baker’s
yeast strains to FT. These conditions resulted in c. 93%
survival after freezing and thawing, which is much higher
than those obtained in the preliminary experiments, as
well as values reported in the literature (Lewis et al.
1997). We have to stress that although the results
reported herein cannot be directly extrapolated, they con-
stitute a significant approach to improve industrial
baker’s yeast performance in frozen dough technology.
Our results also indicate that the response surface
methodology can be a useful tool to find optimal condi-
tions for yeasts to be used in different industrial biotech-
nological process such as brewing, distiller’s fermentation
and wine making. It could constitute a valid alternative
to genetic improvement thus avoiding the technical diffi-
culties and possible problems with public acceptance of
strains developed using recombinant DNA technology.
Further experiments are now conducted to establish if
the prestress conditions we have found increasing toler-
ance to FT could be applied in a productive process at a
subpilot scale using a fed-batch fermentation employing
cane molasses as the main carbon substrate.
Acknowledgements
This work was supported by a research grant from the
Universidad de Buenos Aires, Argentina (Project I038).
We are grateful to Dr Susana Passeron for critically
reviewing the manuscript. MFK and PIN are graduate fel-
lows of CONICET, and MAG is a CONICET researcher.
References
Alves-Araujo, C., Almeida, M.J., Sousa, M.J. and Leao, C.
(2004) Freeze tolerance of the yeast Torulaspora delbrueckii:
cellular and biochemical basis. FEMS Microbiol Lett 240,
7–14.
Attfield, P.V. (1997) Stress tolerance: the key to effective
strains of industrial baker’s yeast. Nat Biotechnol 15, 1351–
1357.
Attfield, P.V., Kletsas, S. and Hazell, B.W. (1994) Concomitant
appearance of intrinsic thermotolerance and storage of tre-
halose in Saccharomyces cerevisiae during early respiratory
phase of batch-culture is CIF1-dependent. Microbiology
140, 2625–2632.
Bell, P.J.L., Higgins, V.J. and Attfield, P.V. (2001) Comparison
of fermentative capacities of industrial baking and wild-
M.F. Kronberg et al. Freezing tolerance of prestressed yeast strains
ª 2007 The Authors
Journal compilation ª 2007 The Society for Applied Microbiology, Journal of Applied Microbiology 104 (2008) 716–727 725

type yeasts of the species Saccharomyces cerevisiae in differ-
ent sugar media. Lett Appl Microbiol 32, 224–229.
Box, G.E.P. and Wilson, K.B. (1951) On the experimental
attainment of optimum conditions. J R Stat Soc Ser B 13,
1–45.
Box, G.E.O., Hunter, W. and Hunter, J. (1999) Statistics for
Experimenters. Barcelona: Reverte.
Clegg, J., Seitzs, P., Seitzs, W. and Hazelwood, C. (1982) Cellu-
lar responses to extreme water loss: the water-replacement
hypothesis. Cryobiology 19, 306–316.
Crowe, J.H. (2007) Trehalose as a ‘chemical chaperone’: fact
and fantasy. Adv Exp Med Biol 594, 143–158.
Crowe, L. and Crowe, J.H. (1988) Trehalose and dry dipalmi-
toyl phosphatidylcholine revisited. Biochim Biophys Acta
946, 193–201.
Crowe, L. and Crowe, J.H. (1990) Lyotropic effects of water
on phospholipids. In Water Science Reviews ed. Franks, F.
pp. 1–23 Cambridge: Cambridge University Press.
D’Amore, P., Crumplen, R. and Stewart, G. (1991) The
involvement of trehalose in yeast stress tolerance. J Ind
Microbiol 7, 191–196.
De Virgilio, C., Hottinger, T., Domınguez, J., Boller, T. and
Wiemken, A. (1994) The role of trehalose synthesis for the
acquisition of thermotolerance in yeast. Eur J Biochem 219,
179–186.
Elbein, A.D., Pan, Y.T., Pastuszak, I. and Carroll, D. (2003)
New insights on trehalose: a multifunctional molecule.
Glycobiology 13, 17R–27R.
Folch-Mallol, J.L., Garay-Arroyo, A., Lledias, F. and Covarru-
bias Robles, A.A. (2004) The stress response in the yeast
Saccharomyces cerevisiae. Rev Latinoam Microbiol 46, 24–
46.
Franks, F., Mathias, S., Calfre, P., Webster, S. and Brown, D.
(1983) Ice nucleation and freezing in undercooled cells.
Cryobiology 20, 298–309.
Galvagno, M.A. and Cerrutti, P. (2004) Increase of rising activ-
ity of commercial yeasts by application of stress conditions
during their propagation. Rev Argent Microbiol 36, 41–46.
Gancedo, C. and Flores, C.L. (2004) The importance of a func-
tional trehalose biosynthetic pathway for the life of yeasts
and fungi. FEMS Yeast Res 4, 351–359.
Gelinas, P., Fiset, G., Leduy, A. and Goulet, J. (1989) Effect of
growth conditions and trehalose content on cryotolerance
of bakers’ yeast in frozen doughs. Appl Environ Microbiol
55, 2453–2459.
Haaland, P. (1987) Experimental Design in Biotechnology. New
York: Marcel Dekker.
Hatano, S., Udou, M., Koga, N., Honjoh, K. and Miyamoto,
T. (1996) Impairment of the glycolytic system and actin in
baker’s yeast during frozen storage. Biosci Biotechnol Bio-
chem 60, 61–64.
Heggart, H.M., Margaritis, A., Pilkington, H., Stewart, R.J.,
Dowhanick, T.M. and Russell, I. (1999) Factors affecting
yeast viability and vitality characteristics: a review. Tech Q
36, 383–406.
Hernandez-Lopez, M.J., Prieto, J.A. and Randez-Gil, F. (2003)
Osmotolerance and leavening ability in sweet and frozen
sweet dough. Comparative analysis between Torulaspora
delbrueckii and Saccharomyces cerevisiae baker’s yeast
strains. Antonie van Leeuwenhoek 84, 125–134.
Hounsa, C.G., Brandt, E.V., Thevelein, J., Hohmann, S. and
Prior, B.A. (1998) Role of trehalose in survival of Saccha-
romyces cerevisiae under osmotic stress. Microbiology 144,
671–680.
Kara, B., Simpson, W. and Hammond, J. (1988) Prediction of
the fermentation performance of brewing yeast with the
acidification power test. J Inst Brew 94, 153–158.
Komatsu, Y., Kaul, S.C., Iwahashi, H. and Obuchi, K. (1990)
Do heat shock proteins provide protection against freez-
ing? FEMS Microbiol Lett 60, 159–162.
Lewis, J.G., Northcott, C., Learmonth, R.P., Attfield, P.V. and
Watson, K. (1993) The need for consistent nomenclature
and assessment of growth phases in diauxic cultures of
Saccharomyces cerevisiae. J Gen Microbiol 139, 835–839.
Lewis, J.G., Learmonth, R.P. and Watson, K. (1995) Induction
of heat, freezing and salt tolerance by heat and salt shock
in Saccharomyces cerevisiae. Microbiology 141, 687–694.
Lewis, J.G., Learmonth, R.P., Attfield, P.V. and Watson, K.
(1997) Stress co-tolerance and trehalose content in baking
strains of Saccharomyces cerevisiae. J Ind Microbiol Biotech-
nol 18, 30–36.
Mazur, P. (1970) Cryobiology: the freezing of biological sys-
tems. Science 168, 939–949.
Montgomery, D.C. (2001) Design and Analysis of Experiments.
New York: John Wiley & Sons.
Panek, A.C., Vania, J.J., Paschoalin, M.F. and Panek, D. (1990)
Regulation of trehalose metabolism in Saccharomyces cere-
visiae mutants during temperature shifts. Biochimie 72, 77–
79.
Park, J.I., Grant, C.M., Attfield, P.V. and Dawes, I.W. (1997)
The freeze-thaw stress response of the yeast Saccharomyces
cerevisiae is growth phase specific and is controlled by
nutritional state via the RAS-cyclic AMP signal transduc-
tion pathway. Appl Environ Microbiol 63, 3818–3824.
Park, J.I., Grant, C.M., Davies, M.J. and Dawes, I.W. (1998)
The cytoplasmic Cu, Zn superoxide dismutase of Saccharo-
myces cerevisiae is required for resistance to freeze-thaw
stress. Generation of free radicals during freezing and
thawing. J Biol Chem 273, 22921–22928.
Randez-Gil, F., Sanz, P. and Prieto, J.A. (1999) Engineering
baker’s yeast: room for improvement. Trends Biotechnol
17, 237–244.
Ratnakumar, S. and Tunnacliffe, A. (2006) Intracellular treha-
lose is neither necessary nor sufficient for desiccation toler-
ance in yeast. FEMS Yeast Res 6, 902–913.
Sano, F., Asakawa, N., Inoue, Y. and Sakurai, M. (1999) A
dual role for intracellular trehalose in the resistance of
yeast cells to water stress. Cryobiology 39, 80–87.
Shima, J., Sakata-Tsuda, Y., Suzuki, Y., Nakajima, R., Watana-
be, H., Kawamoto, S. and Takano, H. (2003) Disruption
Freezing tolerance of prestressed yeast strains M.F. Kronberg et al.
726 Journal compilation ª 2007 The Society for Applied Microbiology, Journal of Applied Microbiology 104 (2008) 716–727
ª 2007 The Authors

of the CAR1 gene encoding arginase enhances freeze toler-
ance of the commercial baker’s yeast Saccharomyces cerevi-
siae. Appl Environ Microbiol 69, 715–718.
Siderius, M. and Mager, W.H. (1997) General stress response:
in search of a common denominator. In Yeast Stress
Response ed. Hohmann, S. and Mager, W.H. pp. 213–230
Austin, TX: R.G. Landes Co.
Slaugthter, J.C. and Nomura, T. (1992) Intracellular glycogen
and trehalose contents as predictors of yeast viability.
Enzyme Microb Technol 14, 64–67.
Stanbury, P.F., Whitaker, A. and Hall, S.J., eds (1986) Media
for industrial fermentations. In Principles of Fermentation
Technology pp. 93–122 Oxford: Pergamon.
Strobel, R. and Sullivan, G. (1999) Experimental design for
improvement of fermentation. In Manual of Industrial
Microbiology and Biotechnology ed. Demain, A. and Davies,
J. pp. 80–93 Washington DC: ASM Press.
Takagi, H., Iwamoto, F. and Nakamori, S. (1997) Isolation of
freeze-tolerant laboratory strains of Saccharomyces cerevisi-
ae from proline-analogue-resistant mutants. Appl Microbiol
Biotechnol 47, 405–411.
Takagi, H., Sakai, K., Morida, K. and Nakamori, S. (2000)
Proline accumulation by mutation or disruption of the
proline oxidase gene improves resistance to freezing and
desiccation stresses in Saccharomyces cerevisiae. FEMS
Microbiol Lett 184, 103–108.
Tanghe, A., van Dijck, P., Dumortier, F., Teunissen, A., Hoh-
mann, S. and Thevelein, J. (2002) Aquaporin expression
correlates with freeze tolerance in baker’s yeast, and over-
expression improves freeze tolerance in industrial strains.
Appl Environ Microbiol 68, 5981–5989.
Thevelein, J. and De Wilde, J. (1999) Novel sensing mecha-
nism and target for the cAMP-protein kinase A pathway
in the yeast Saccharomyces cerevisiae. Mol Microbiol 33,
904–918.
Toner, M., Cravalho, E.G. and Karel, M. (1993) Cellular
response of mouse oocytes to freezing stress: prediction
of intracellular ice formation. J Biomech Eng 115,
169–174.
Winkler, K., Kienle, I., Burgert, M., Wagner, J.C. and Holzer,
H. (1991) Metabolic regulation of the trehalose content of
vegetative yeast. FEBS Lett 291, 269–272.
M.F. Kronberg et al. Freezing tolerance of prestressed yeast strains
ª 2007 The Authors
Journal compilation ª 2007 The Society for Applied Microbiology, Journal of Applied Microbiology 104 (2008) 716–727 727
Copyright © 2022 FDOKUMEN