Modeling with ANN and effect of pumice aggregate and air entrainment on the freeze–thaw...
9
Modeling with ANN and effect of pumice aggregate and air entrainment on the freeze–thaw durabilities of HSC Mehmet Burhan Karakoç a,⇑ , Ramazan Demirbog ˘a b , _ Ibrahim Türkmen a , _ Ibrahim Can c a _ Inönü University, Eng. Fac., Civil Enginering Dep., 44280 Malatya, Turkey b University Putra Malaysia, Engineering Faculty, Housing Research Center, Malaysia c Atatürk University, Eng. Fac., Civil Enginering Dep., 25240 Erzurum, Turkey article info Article history: Received 15 February 2011 Accepted 20 April 2011 Available online xxxx Keywords: Freeze–thaw Pumice aggregate High strength concrete Compressive strength Ultrasound pulse velocity Artificial neural network abstract The objective of this work is to calculate the compressive strength, ultrasound pulse velocity (UPV), rel- ative dynamic modulus of elasticity (RDME) and porosity induced into concrete during freezing and thawing. Freeze–thaw durability of concrete is of great importance to hydraulic structures in cold areas. In this paper, freezing of pore solution in concrete exposed to a freeze–thaw cycle is studied by following the change of concrete some mechanical and physical properties with freezing temperatures. The effects of pumice aggregate (PA) ratios on the high strength concrete (HSC) properties were studied at 28 days. PA replacements of fine aggregate (0–2 mm) were used: 10%, 20%, and 30%. The properties examined included compressive strength, UPV and RDME properties of HSC. Results showed that compressive strength, UPV and RDME of samples were decreased with increase in PA ratios. Test results revealed that HSC was still durable after 100, 200 and 300 cycles of freezing and thawing in accordance with ASTM C666. After 300 cycles, HSC showed a reduction in compressive strength between 6% and 21%, and reduc- tion in RDME up to 16%. For 300 cycles, the porosity was increased up to 12% for HSC with PA. In this paper, feed-forward artificial neural networks (ANNs) techniques are used to model the relative change in compressive strength and relative change in UPV in cyclic thermal loading. Then genetic algorithms are applied in order to determine optimum mix proportions subjected to 300 thermal cycling. Ó 2011 Elsevier Ltd. All rights reserved. 1. Introduction Durability is a key function for materials which are used in se- vere environments, and heightened durability of concrete is neces- sary as it is one of the most non-homogenous and demanding engineering materials used by mankind. It has been a significant scientific and technical problem to improve the durability and to prolong the service life of concrete. Used commonly for dams, hydraulic structures and offshore structures, there is now an increasing need for concrete to be used for the storage of very cold substances. In cold environments, freezing and thawing can be harmful for a porous brittle material such as concrete when it is subjected to lower temperatures [1]. A number of researchers have investigated the correlation be- tween lightweight aggregate and air entrainment on freeze–thaw durability of concrete [2–5]. Some of this previous work used only a simple measure of the pore structure, such as total pore volume, and other investigators examined only one or two different aggre- gates. The aim of this study was to measure the pore structure of coarse aggregate materials as completely as possible, and to examine a sufficiently large number of different aggregates so that a correlation between pore structure and expected D-cracking resistance could be formulated. The method of air entrainment by the incorporation of small air bubbles in the plastic concrete mix has proven to be eminently successful in improving the freeze–thaw durability of concrete. The beneficial effect of the method on hardened paste depends on two factors: the total air content and the spacing between the air entrained voids. Controlling these two factors within narrow limits during the mixing, transportation, placement, and finishing operations is a most difficult task because the air content is af- fected by numerous factors such as mix composition, temperature, and the time taken for the mixing and finishing operations. The sit- uation is made worse by the lack of a test for determining void spacing in the plastic mix. Only after hardening can the spacing be measured, and then by a cumbersome and lengthy procedure, at a time when corrective measures are no longer possible. Fur- thermore, incorporation of air weakens the concrete significantly, a serious drawback. In fact, the amount of air for frost protection is restricted usually to 6% in order to avoid excessive reduction of mechanical properties. All these difficulties can be overcome when the voids necessary for durability are provided by the 0950-0618/$ - see front matter Ó 2011 Elsevier Ltd. All rights reserved. doi:10.1016/j.conbuildmat.2011.04.068 ⇑ Corresponding author. E-mail address: [email protected] (M.B. Karakoç). Construction and Building Materials xxx (2011) xxx–xxx Contents lists available at ScienceDirect Construction and Building Materials journal homepage: www.elsevier.com/locate/conbuildmat Please cite this article in press as: Karakoç MB et al. Modeling with ANN and effect of pumice aggregate and air entrainment on the freeze–thaw durabil- ities of HSC. Constr Build Mater (2011), doi:10.1016/j.conbuildmat.2011.04.068
-
Upload
independent -
Category
Documents
-
view
0 -
download
0
Transcript of Modeling with ANN and effect of pumice aggregate and air entrainment on the freeze–thaw...

Construction and Building Materials xxx (2011) xxx–xxx
Contents lists available at ScienceDirect
Construction and Building Materials
journal homepage: www.elsevier .com/locate /conbui ldmat
Modeling with ANN and effect of pumice aggregate and air entrainment on thefreeze–thaw durabilities of HSC
Mehmet Burhan Karakoç a,⇑, Ramazan Demirboga b, _Ibrahim Türkmen a, _Ibrahim Can c
a _Inönü University, Eng. Fac., Civil Enginering Dep., 44280 Malatya, Turkeyb University Putra Malaysia, Engineering Faculty, Housing Research Center, Malaysiac Atatürk University, Eng. Fac., Civil Enginering Dep., 25240 Erzurum, Turkey
a r t i c l e i n f o
Article history:Received 15 February 2011Accepted 20 April 2011Available online xxxx
Keywords:Freeze–thawPumice aggregateHigh strength concreteCompressive strengthUltrasound pulse velocityArtificial neural network
0950-0618/$ - see front matter � 2011 Elsevier Ltd. Adoi:10.1016/j.conbuildmat.2011.04.068
⇑ Corresponding author.E-mail address: [email protected] (M.B. Ka
Please cite this article in press as: Karakoç MB eities of HSC. Constr Build Mater (2011), doi:10.
a b s t r a c t
The objective of this work is to calculate the compressive strength, ultrasound pulse velocity (UPV), rel-ative dynamic modulus of elasticity (RDME) and porosity induced into concrete during freezing andthawing. Freeze–thaw durability of concrete is of great importance to hydraulic structures in cold areas.In this paper, freezing of pore solution in concrete exposed to a freeze–thaw cycle is studied by followingthe change of concrete some mechanical and physical properties with freezing temperatures. The effectsof pumice aggregate (PA) ratios on the high strength concrete (HSC) properties were studied at 28 days.PA replacements of fine aggregate (0–2 mm) were used: 10%, 20%, and 30%. The properties examinedincluded compressive strength, UPV and RDME properties of HSC. Results showed that compressivestrength, UPV and RDME of samples were decreased with increase in PA ratios. Test results revealed thatHSC was still durable after 100, 200 and 300 cycles of freezing and thawing in accordance with ASTMC666. After 300 cycles, HSC showed a reduction in compressive strength between 6% and 21%, and reduc-tion in RDME up to 16%. For 300 cycles, the porosity was increased up to 12% for HSC with PA. In thispaper, feed-forward artificial neural networks (ANNs) techniques are used to model the relative changein compressive strength and relative change in UPV in cyclic thermal loading. Then genetic algorithms areapplied in order to determine optimum mix proportions subjected to 300 thermal cycling.
� 2011 Elsevier Ltd. All rights reserved.
1. Introduction
Durability is a key function for materials which are used in se-vere environments, and heightened durability of concrete is neces-sary as it is one of the most non-homogenous and demandingengineering materials used by mankind. It has been a significantscientific and technical problem to improve the durability and toprolong the service life of concrete. Used commonly for dams,hydraulic structures and offshore structures, there is now anincreasing need for concrete to be used for the storage of very coldsubstances. In cold environments, freezing and thawing can beharmful for a porous brittle material such as concrete when it issubjected to lower temperatures [1].
A number of researchers have investigated the correlation be-tween lightweight aggregate and air entrainment on freeze–thawdurability of concrete [2–5]. Some of this previous work used onlya simple measure of the pore structure, such as total pore volume,and other investigators examined only one or two different aggre-gates. The aim of this study was to measure the pore structure of
ll rights reserved.
rakoç).
t al. Modeling with ANN and ef1016/j.conbuildmat.2011.04.06
coarse aggregate materials as completely as possible, and toexamine a sufficiently large number of different aggregates so thata correlation between pore structure and expected D-crackingresistance could be formulated.
The method of air entrainment by the incorporation of small airbubbles in the plastic concrete mix has proven to be eminentlysuccessful in improving the freeze–thaw durability of concrete.The beneficial effect of the method on hardened paste dependson two factors: the total air content and the spacing between theair entrained voids. Controlling these two factors within narrowlimits during the mixing, transportation, placement, and finishingoperations is a most difficult task because the air content is af-fected by numerous factors such as mix composition, temperature,and the time taken for the mixing and finishing operations. The sit-uation is made worse by the lack of a test for determining voidspacing in the plastic mix. Only after hardening can the spacingbe measured, and then by a cumbersome and lengthy procedure,at a time when corrective measures are no longer possible. Fur-thermore, incorporation of air weakens the concrete significantly,a serious drawback. In fact, the amount of air for frost protectionis restricted usually to 6% in order to avoid excessive reductionof mechanical properties. All these difficulties can be overcomewhen the voids necessary for durability are provided by the
fect of pumice aggregate and air entrainment on the freeze–thaw durabil-8

Table 1Chemical composition of PC, SF and PA (%).
Component PC SF PA
SiO2 19.6 93.7 69.78Al2O3 4.77 0.3 11.16Fe2O3 2.91 0.35 2.11CaO 62.00 0.8 2.47MgO 3.2 0.85 0.6SO3 2.69 0.34 0.06C 2.69 0.52 4.66Na2O 0.35 – 4.33K2O 0.53 – 2.87Chlor (Cl�) 0.0082 – 0.0496Sulfide (S�2) 0.1 0.1–0.3Undetermined 0.38Free CaO 0.25
Table 2The physical and mechanical properties of PC.
Specific gravity (g/cm3) 3.10Specific surface (cm2/g) 3389Setting time initial (min) 170Volume expansion (mm) 2Compressive strength (MPa) 2 days 28.6
28 days 53.4
Table 3The physical properties of pumice aggregate.
Specific weight 2.2 g/cm3
Unit weight 450–750 kg/m3
Porosity 70–85%Specific heat 0.32 kCal/kg�CMelting point 1300 �CThermal conductivity 0.12–0.70 W/m KThermal expansion 0.003–0.007 mm/m �C
2 M.B. Karakoç et al. / Construction and Building Materials xxx (2011) xxx–xxx
addition of porous particulate substances to the plastic mix. In thismanner voids can be provided in the required number, size anddistribution by adding an appropriate amount of a suitable mate-rial [2]. With the deterioration of existing structures, durabilityof concrete is of great concern [3]. For hydraulic structures in coldareas, freeze–thaw durability of concrete is especially important.Freeze–thaw durability of concrete has close relationship with itspore structure. The volume, radius, and size distribution of poresdecide the freezing point of pore solution and the amount of iceformed in pores [4].
Freezing and thawing resistance of recycled aggregate concreteis still questionable due to the great diversity in quality and com-position of the demolished concretes. Dillmann [5] determined theeffect of the strength level of the source concrete on the freezingand thawing resistance of concrete incorporating recycled coarseand fine aggregate in different replacement ratios. Forster et al.[6] reported that freezing and thawing results differ dependingon the original aggregate type. Recycled concrete containingfreeze–thaw susceptible coarse aggregate performed better asaggregate in the new concrete than concrete containing that stoneas coarse aggregate.
Almost one third of the concrete volume cast in the Nordiccountries must possess adequate freeze–thaw durability. Themajority of concrete durability research and test methods concen-trate on the degradation of the concrete surface due to the freezingand thawing loads, while only during the last decade has the inter-nal damage of the frost action gained increasing attention. It hasbeen noticed that internal damage has been the dimensioning cri-terion in concretes produced with a low water-binder ratio. Thetwo classical freezing and thawing theories of concrete are basedon the research work by Powers and coworkers. The theory ofhydraulic pressure is considered valid nowadays only in very satu-rated conditions and even Powers replaced it by the theory of os-motic pressure [7]. Freezing and thawing action can cause severedeterioration to external building products. The primary cause ofdamage is due to the hydraulic pressures that develop as waterfreezes. As water freezes, it expands, exerting tensile forces onthe material. Once these forces exceed the strength of the material,cracking occurs, causing irreversible damage. During subsequentthawing, the water then moves through the cracks, expandingthem further, and is present to cause more damage when freezingoccurs again [8].
Pumice is the most widely used of the natural lightweightaggregates. Pumice is a volcanic rock whose porous structure isformed by dissolved gases precipitated during the cooling as thelava hurtles through the air. The connectivity of the pore structuremay range from completely closed to completely open. Pores rang-ing from hundreds of microns to a few microns are visible. Thepores appear irregular in shape and well connected; a higher mag-nification SEM picture of a fracture surface shows that the fineporosity presents the same features [9].
The feed-forward architecture, also known as the multilayerpreceptron, is the most popular network architecture used byresearchers in various structural material characterization andmodeling studies. Ghaboussi et al. [10] describe use of the BP neu-ral network (NN) for modeling behavior of conventional materialssuch as concrete in the state of plane stress under monotonic biax-ial loading. Brown et al. [11] demonstrate the applicability of NNsto composite material characterization. They use the BP algorithmto predict thermal and mechanical properties of composite materi-als. The BP algorithm also has been used for constitutive modelingof concrete [12] and viscoplastic materials [13]. Yeh [14] uses theBP algorithm to model the concrete workability in the design of ahigh performance concrete mixture.
Using to PA instead of normal aggregate requires an accurateknowledge of the physical and durability performance properties
Please cite this article in press as: Karakoç MB et al. Modeling with ANN and efities of HSC. Constr Build Mater (2011), doi:10.1016/j.conbuildmat.2011.04.06
of the normal aggregate concrete produced. Even though much isknown about the physical properties, durability performance isnot well understood because of limited and contradictory researchresults. Therefore, it appears that the widespread use of PA will belimited until extensive research is conducted to clarify the circum-stances in which this construction material may be regarded asfrost-resistant and to identify the major factors that affect its frostdurability. This paper helps to identify the primary factors affectingthe resistance to freezing and thawing of PA.
2. Materials and methods
Portland cement (CEM I 42.5) was utilized in preparing the concrete specimens.Silica fume (SF) and PA were obtained from Antalya Electro Metallurgy Enterpriseand Van-Ercis� zone in Turkey, respectively. The chemical composition of the mate-rials used in this study was summarized in Table 1. The physical and mechanicalproperties of portland cement and the physical properties of PA summarized simi-larly in Tables 2 and 3, respectively. The specific gravity of SF and PA were 2.20 and1.08, respectively. The percentages of PA that replaced fine aggregate (0–2 mm) inthis study were: 0%, 10%, 20% and 30%. The used w/b ratios were 0.25, 0.30 and 0.35.In addition, a group samples with air entraining was used for w/b ratios. The binderdosage and the dosage of SF were kept constant at 500 kg/m3 and 7%, respectively,throughout the study. Modified polycarboxylates based polymer was used as asuperplasticizer, it conformed to Type F of ASTM C494 F (high-range water reducer)at a dosage of 0.75, 1.50 and 2.0 ml/kg of cement, for 0.25, 0.30 and 0.35 w/b ratios,respectively.
Freeze–thaw durability tests were conducted on specimens that were cured for28 days. ASTM C 666 (Procedure B) was used to assess the durability of concretesubjected to cyclic freezing and thawing. Freezing and thawing cycle lasted for5 h. Deterioration was monitored by means of UPV measurements. Measurementswere made every 100 cycles up to 300. During the experiments, temperaturechange at the center of the specimen was measured using a specially designedthermocouple.
fect of pumice aggregate and air entrainment on the freeze–thaw durabil-8

M.B. Karakoç et al. / Construction and Building Materials xxx (2011) xxx–xxx 3
The lightweight aggregates were first mixed, with water needed for dry surface-saturated for half an hour before blending. For each mixture, 100 mm diameters and200 mm height cylinder molds were used. The maximum size of coarse aggregatewas 16 mm. The samples were tested for UPV and compressive strength in accor-dance with ASTM C597 and ASTM C39 respectively. In addition, RDME values mea-sured according to formulation in ASTM C666 (Eq. (1)). Durability factor iscalculated in Eq. (2). The relative dynamic modulus of elasticity Pc, is determinedfrom:
Pc ¼ ðn1=nÞ2 � 100 ð1Þ
where Pc, is the relative dynamic modulus of elasticity, after c cycles of freezing andthawing, percent; n the fundamental transverse frequency at 0 cycles of freezing andthawing, in Hz, and n1 is the fundamental transverse frequency at c cycles of freezingand thawing, in Hz.
The durability factor (DF) is determined from the RDME using the followingexpression:
DF ¼ PN=M ð2Þ
where DF is the durability factor of the test specimen, P the relative dynamic mod-ulus of elasticity at N cycles, %, N the number of cycles at which P reaches the spec-ified minimum value for discontinuing the test or the specified number of cycles atwhich the exposure is to be terminated, whichever is less, and M is the specifiednumber of cycles at which the exposure is to be terminated. In this investigation,M is taken as 300 cycles.
The volume of permeable voids was determined in accordance with ASTM C642.Volume of permeable voids is defined as the void volume which is emptied duringthe specified drying and filled with water during the subsequent immersion andboiling [15].
2.1. Artificial neural networks
Artificial neural networks (ANNs) are information-processing systems that havecertain performance characteristics in common with biological NNs. A neural netconsists of a large number of simple processing elements called neurons or nodes.A NN is characterized by (1) its pattern of connections between the neurons (calledits architecture), (2) its method of determining the weights on the connections(called its training or learning algorithm) and (3) its activation function. The basicstructure of an ANN is shown in Fig. 1. The ANN shown in Fig. 1 has links only be-tween nodes in immediately adjacent layers and is often referred to as a feed-forward (FF) network or a multi-layer perceptron (MLP) network. The feed-forwardNNs with back-propagation (BP) learning algorithm are the most widely used NNs[16,17]. Determining the best values of all the weights is called training the ANN.Details on the ANNs and the BP training algorithm (to estimate the network param-eters) can be found in [17–19]. Most applications require networks that contain atleast three types of layers:
� The input layer consists of nodes that receive an input from the external envi-ronment. These nodes do not perform any transformations upon the inputsbut just send their weighted values to the nodes in the immediately adjacent,usually ‘hidden,’ layer.� The hidden layer consists of nodes that typically receive the transferred
weighted inputs from the input layer, perform their transformations by an acti-vation function on it, and pass the output to the next adjacent output layer.� The output layer consists of node(s) that receive the hidden-layer output and
send it to the user.
The NN training is an unconstrained nonlinear minimization problem in whichare weights of a network are iteratively modified to minimize the root meansquared error (rmse) between the desired and actual output values for all outputnodes over all input patterns. The back-propagation (BP) algorithm [20] has beenthe most commonly used training algorithm. The Levenberg–Marquardt (LM) algo-rithm, a standard second-order nonlinear least-squares technique, based on theback-propagation process to increase the speed [21] and efficiency of the training[22] was used for training the ANN models in the present study. The activation
Fig. 1. A typical feed-forward artificial neural network architecture.
Please cite this article in press as: Karakoç MB et al. Modeling with ANN and efities of HSC. Constr Build Mater (2011), doi:10.1016/j.conbuildmat.2011.04.06
function is also called the transfer function. It determines the relationship betweeninputs and outputs of a node and a network. In general, the activation functionintroduces a degree of nonlinearity that is valuable for most ANN applications.
In the present work, the NNs trained with the error BP algorithm to obtain theoptimum network weight values. As an activation function, the hyperbolic tangent(tanh) function was used. The ANN modeling is implemented within the MATLABneural networks toolbox.
2.2. Genetic algorithms (GAs)
Genetic algorithms (GAs) are stochastic optimization algorithms based on theconcepts of biological evolutionary theory [23]. They consists in maintaining a pop-ulation of chromosomes (individuals), which represent potential solutions to theproblem to be solved, that is, the optimization of a function, generally very complex.Each individual in the population has an associated fitness, indicating the utility oradaptation of the solution that it represents. A GA starts off with a population ofrandomly generated chromosomes and advances toward better chromosomes byapplying genetic operators, modeled on the genetic processes occurring in nature.During successive iterations, called generations, the chromosomes are evaluatedas possible solutions. Based on these evaluations, a new population is formed usinga mechanism of selection and applying genetic operators such as crossover andmutation.
Although there are many possible variants on the basic GA, the operation of astandard genetic algorithm is described in the following steps:
1. Randomly create an initial population of chromosomes.2. Compute the fitness of every member of the current population.3. If there is a member of the current population that satisfies the problem
requirements then stop. Otherwise, continue to the next step.4. Create an intermediate population by extracting members from the current
population using a selection operator.5. Generate a new population by applying the genetic operators of crossover and
mutation to this intermediate population.6. Go back to step 2.
3. Application and results
3.1. Compressive strength and freeze–thaw durability
The values of compressive strength for control, PA and AEAspecimens are given in Table 4 in which the data are based onthe average results from three specimens of each concrete mixture.The 40 MPa strength limit characteristic for high performance con-crete was met after 28 days for all mixtures. Adding PA to themixes in the ratios of 10%, 20% and 30% decreased compressivestrength 6%, 21% and 30%; 5%, 18% and 31%; and 11%, 18% and29%, respectively, for w/b ratios was 0.25, 0.30 and 0.35, at 28 daysunexposed to the freezing and thawing cycles. Adding AEA to themixes, similarly, decreased compressive strength 1, 14 and 25,respectively, for w/b ratios was 0.25, 0.30 and 0.35, at 28 daysunexposed to the freezing and thawing cycles. After 10%, 20%and 30% of the PA replacement of aggregate decreased the strengthof the sample more than that of the control sample. Reductions inthe compressive strength at 28 days may be because of the weakstructure of PA aggregates. Compressive strength is a function ofdensity. Many investigators [24–34] reported that the compressivestrength decreased because the density decreased with increasinglightweight aggregate ratio instead of the normal aggregate. How-ever, air entrainment greatly reduces the mechanical strength [35].
The compressive strength of the mixtures was measured after28 days. The compressive strength of samples is shown that thestrength of the mixtures with PA was lower than for the referencemixtures. An explanation for the smaller compressive strength of
Table 4Compressive strength of samples unexposed to freeze–thawing cycles.
Mixtures Control 10% PA 20% PA 30% PA AEA
w/b ratios 0.25 77.09 72.66 60.54 53.99 76.070.30 73.13 69.26 59.61 50.11 62.580.35 65.13 57.92 53.68 46.05 49.15
fect of pumice aggregate and air entrainment on the freeze–thaw durabil-8
4 M.B. Karakoç et al. / Construction and Building Materials xxx (2011) xxx–xxx
the PA mixture might be found in the change of the microstructureof the concrete, where the capillary pores will be replaced to alarge extent by empty pores, which are the remnants of the satu-rated PA particles.
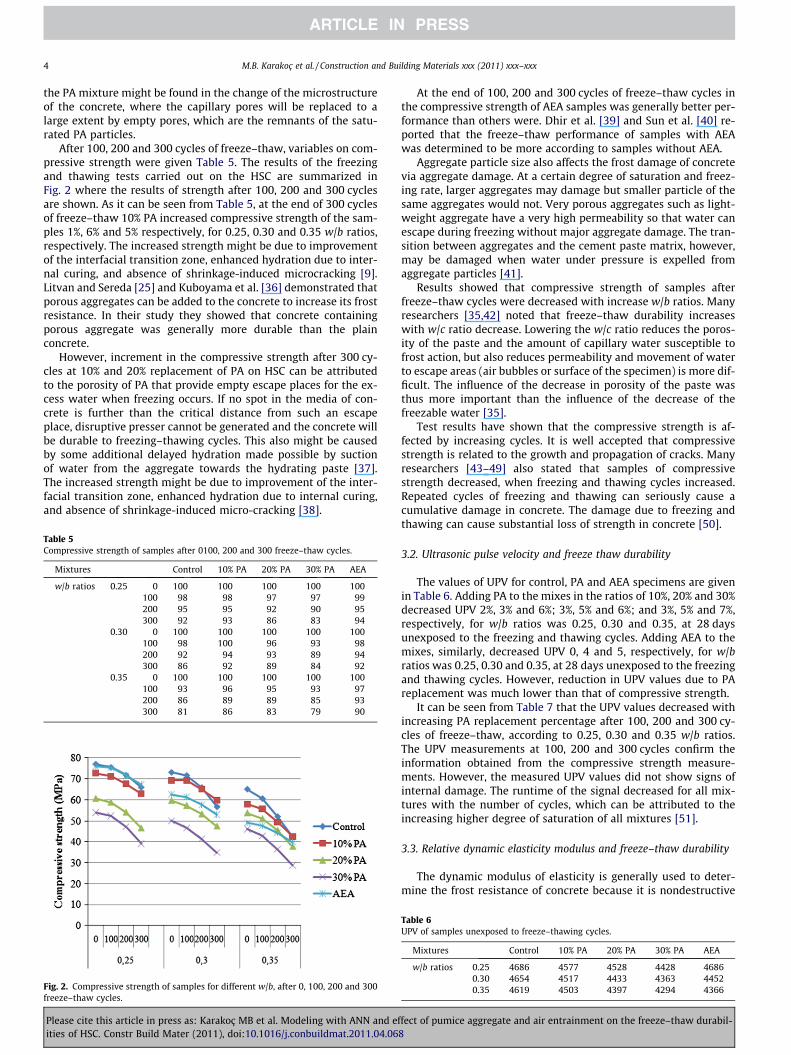
After 100, 200 and 300 cycles of freeze–thaw, variables on com-pressive strength were given Table 5. The results of the freezingand thawing tests carried out on the HSC are summarized inFig. 2 where the results of strength after 100, 200 and 300 cyclesare shown. As it can be seen from Table 5, at the end of 300 cyclesof freeze–thaw 10% PA increased compressive strength of the sam-ples 1%, 6% and 5% respectively, for 0.25, 0.30 and 0.35 w/b ratios,respectively. The increased strength might be due to improvementof the interfacial transition zone, enhanced hydration due to inter-nal curing, and absence of shrinkage-induced microcracking [9].Litvan and Sereda [25] and Kuboyama et al. [36] demonstrated thatporous aggregates can be added to the concrete to increase its frostresistance. In their study they showed that concrete containingporous aggregate was generally more durable than the plainconcrete.
However, increment in the compressive strength after 300 cy-cles at 10% and 20% replacement of PA on HSC can be attributedto the porosity of PA that provide empty escape places for the ex-cess water when freezing occurs. If no spot in the media of con-crete is further than the critical distance from such an escapeplace, disruptive presser cannot be generated and the concrete willbe durable to freezing–thawing cycles. This also might be causedby some additional delayed hydration made possible by suctionof water from the aggregate towards the hydrating paste [37].The increased strength might be due to improvement of the inter-facial transition zone, enhanced hydration due to internal curing,and absence of shrinkage-induced micro-cracking [38].
Table 5Compressive strength of samples after 0100, 200 and 300 freeze–thaw cycles.
Mixtures Control 10% PA 20% PA 30% PA AEA
w/b ratios 0.25 0 100 100 100 100 100100 98 98 97 97 99200 95 95 92 90 95300 92 93 86 83 94
0.30 0 100 100 100 100 100100 98 100 96 93 98200 92 94 93 89 94300 86 92 89 84 92
0.35 0 100 100 100 100 100100 93 96 95 93 97200 86 89 89 85 93300 81 86 83 79 90
Fig. 2. Compressive strength of samples for different w/b, after 0, 100, 200 and 300freeze–thaw cycles.
Please cite this article in press as: Karakoç MB et al. Modeling with ANN and efities of HSC. Constr Build Mater (2011), doi:10.1016/j.conbuildmat.2011.04.06
At the end of 100, 200 and 300 cycles of freeze–thaw cycles inthe compressive strength of AEA samples was generally better per-formance than others were. Dhir et al. [39] and Sun et al. [40] re-ported that the freeze–thaw performance of samples with AEAwas determined to be more according to samples without AEA.
Aggregate particle size also affects the frost damage of concretevia aggregate damage. At a certain degree of saturation and freez-ing rate, larger aggregates may damage but smaller particle of thesame aggregates would not. Very porous aggregates such as light-weight aggregate have a very high permeability so that water canescape during freezing without major aggregate damage. The tran-sition between aggregates and the cement paste matrix, however,may be damaged when water under pressure is expelled fromaggregate particles [41].
Results showed that compressive strength of samples afterfreeze–thaw cycles were decreased with increase w/b ratios. Manyresearchers [35,42] noted that freeze–thaw durability increaseswith w/c ratio decrease. Lowering the w/c ratio reduces the poros-ity of the paste and the amount of capillary water susceptible tofrost action, but also reduces permeability and movement of waterto escape areas (air bubbles or surface of the specimen) is more dif-ficult. The influence of the decrease in porosity of the paste wasthus more important than the influence of the decrease of thefreezable water [35].
Test results have shown that the compressive strength is af-fected by increasing cycles. It is well accepted that compressivestrength is related to the growth and propagation of cracks. Manyresearchers [43–49] also stated that samples of compressivestrength decreased, when freezing and thawing cycles increased.Repeated cycles of freezing and thawing can seriously cause acumulative damage in concrete. The damage due to freezing andthawing can cause substantial loss of strength in concrete [50].
3.2. Ultrasonic pulse velocity and freeze thaw durability
The values of UPV for control, PA and AEA specimens are givenin Table 6. Adding PA to the mixes in the ratios of 10%, 20% and 30%decreased UPV 2%, 3% and 6%; 3%, 5% and 6%; and 3%, 5% and 7%,respectively, for w/b ratios was 0.25, 0.30 and 0.35, at 28 daysunexposed to the freezing and thawing cycles. Adding AEA to themixes, similarly, decreased UPV 0, 4 and 5, respectively, for w/bratios was 0.25, 0.30 and 0.35, at 28 days unexposed to the freezingand thawing cycles. However, reduction in UPV values due to PAreplacement was much lower than that of compressive strength.
It can be seen from Table 7 that the UPV values decreased withincreasing PA replacement percentage after 100, 200 and 300 cy-cles of freeze–thaw, according to 0.25, 0.30 and 0.35 w/b ratios.The UPV measurements at 100, 200 and 300 cycles confirm theinformation obtained from the compressive strength measure-ments. However, the measured UPV values did not show signs ofinternal damage. The runtime of the signal decreased for all mix-tures with the number of cycles, which can be attributed to theincreasing higher degree of saturation of all mixtures [51].
3.3. Relative dynamic elasticity modulus and freeze–thaw durability
The dynamic modulus of elasticity is generally used to deter-mine the frost resistance of concrete because it is nondestructive
Table 6UPV of samples unexposed to freeze–thawing cycles.
Mixtures Control 10% PA 20% PA 30% PA AEA
w/b ratios 0.25 4686 4577 4528 4428 46860.30 4654 4517 4433 4363 44520.35 4619 4503 4397 4294 4366
fect of pumice aggregate and air entrainment on the freeze–thaw durabil-8

Table 7UPV of samples after 0, 100, 200 and 300 freeze–thaw cycles.
Mixtures Control 10% PA 20% PA 30% PA AEA
w/b ratios 0.25 0 100 100 100 100 100100 100 100 99 96 100200 99 98 98 95 99300 97 97 96 93 98
0.30 0 100 100 100 100 100100 100 101 98 95 99200 98 99 97 95 99300 94 96 94 93 97
0.35 0 100 100 100 100 100100 99 98 95 94 99200 97 98 94 92 99300 92 97 93 91 96
M.B. Karakoç et al. / Construction and Building Materials xxx (2011) xxx–xxx 5
to concrete specimens. The variation in the value of the modulusover the entire duration of freezing and thawing cycles providesa good indication of the variation in the strength of the concretespecimen. The strength variation, in turn, reflects the degree ofthe resistance to freezing and thawing [52].
The deterioration of concrete in rapid freeze–thaw testing isnormally measured as loss of resonance frequency, or as the corre-sponding calculated loss of relative dynamic modulus. To get a bet-ter understanding of how the test exposure affects the concrete,the crack pattern developed in concretes not able to withstand thistype of testing can be inspected [53].
The durability factor was calculated with the UPV variations(Eq. (2)). The square of the UPV is proportional to the dynamicmodulus of elasticity which is used to determine the durability fac-tor [35]. As it can be seen from Table 8 that freeze–thaw results ofthe HSCs made with different PA ratios were determined at 100,200 and 300 cycles. It is noteworthy from the results in Table 8 thatthe RDME of samples decreased with increasing PA replacementpercentage after 100, 200 and 300 cycles of freeze–thaw, accordingto 0.25, 030 and 0.35 w/b ratios. The test data indicated that all thetest cylinders had excellent performance in freezing and thawingcycling with durability factors ranging from 84 to 96 after 300 cy-cles. The losses of RDME were fewer samples with 10% PA thancontrol samples, for 0.30 and 0.35 w/b ratios. Hence, it can be con-cluded that when 10% PA is added to HSC, its frost resistance can beraised. Therefore, the freeze–thaw durability of HSC admixture PAis much higher than that of HSC without PA.
The resistance of the HSC to freezing and thawing action is mostlikely due to an improved water and pore system, which resultedfrom decreasing the w/b ratio. In other words, lowering the w/b ra-tio reduced the number and volume of the capillary pores in the ce-ment paste, thus eliminating the chances of freezable water, whichis the main cause of internal expansive pressure [52].
Because everything is the same in the HSC except the fineaggregates, the lightweight aggregates seem to be the cause of
Table 8RDME of samples after 0, 100, 200 and 300 freeze–thaw cycles.
Mixtures Control 10% PA 20% PA 30% PA AEA
w/b ratios 0.25 0 100 100 100 100 100100 101 100 98 93 100200 99 96 97 91 98300 95 95 93 86 96
0.30 0 100 100 100 100 100100 100 101 96 91 99200 97 97 95 91 98300 89 92 89 86 94
0.35 0 100 100 100 100 100100 97 96 91 88 99200 95 95 89 85 98300 85 94 86 84 92
Please cite this article in press as: Karakoç MB et al. Modeling with ANN and efities of HSC. Constr Build Mater (2011), doi:10.1016/j.conbuildmat.2011.04.06
the positive effects on the development of the durability. Asknown, lightweight concrete exhibits a higher frost resistancedue to the existence of 20–50% voids in the lightweight aggregates.Many investigators [25,41,42,54–56] reported that the lightweightaggregate in concrete increased durability of freeze–thaw. How-ever, if the lightweight aggregate ratio is more than 10%, freeze–thaw resistance is reduced compared to control samples. Becauseof the increased volume of lightweight aggregate in concrete leadsto an increase in the weak aggregate phase, after a given propor-tion that has led to a reduction in compressive strength [38].
The main reason for the reduction in the RDME and durability ofHSC was the formation of micro-cracks during the hardening of thecement paste of concrete. A part of these micro-cracks may collectmoisture that may be frozen and expand at low temperatures,through which cracks may propagate and join each other and ulti-mately damage the microstructure of concrete. Meanwhile, con-crete under the repeated freeze–thaw cycling will produce newmicro-cracks, which mostly fall into the range of 0.1–10 lm in size.The formation of these micro-cracks is the result of the repeatedopposite direction of thermal stresses developed within the micro-structure. The decrease in values of the RDME results from the factthat the repeated freezing and expansion stresses coupled with thethermal stresses have exceeded the tensile strength of concrete,which leads to the formation of micro-cracks [12].
Also Cohen et al. [57] observed considerably lower influence offreeze–thaw cycles on compressive strength than on Young’s mod-ulus. Nevertheless, whether it is ordinary concrete or HPC, the frostresistance is dependent mainly upon its permeability, degree ofsaturation, amount of freezable water and rate of freezing.
A concrete containing porous aggregate, that was saturated al-ready at mixing and which have had no chance of drying, will al-ways have a low degree of frost resistance irrespectively of thew/c ratio and air content of the concrete [58]. However, Marzoukand Jiang [44] stated that the good durability of HSC can be attrib-uted to its low permeability and higher compressive strength.
Discussion of the durability results requires some deliberationon the mechanisms involved. There are two separate areas of inter-est, the paste and the aggregate. Since the aggregate was batch-air-dried and has a good durability record. As the temperature of theconcrete drops below 0 �C, ice begins to form in the larger capillar-ies and the concentration of alkalies in the remaining unfrozenpore solution increases. Thermodynamic equilibrium betweenthe ice and this solution and between this solution and the lessconcentrated solution in smaller, as yet unfrozen capillaries re-quires the movement of water. Consequently, pressure developsat the ice front as the capillary fills with ice and solution. This pres-sure causes expansion and possible disintegration. The introduc-tion of air bubbles provides space into which the water can flowand the development of pressure is avoided. A closely spaced sys-tem of fine air bubbles can provide the concrete with protection[59].
The reduction in w/b ratios can help reduce the crack size andimprove crack distribution with the porosity of concrete reducedsignificantly, besides the reduction of large diameter cracks, andthe distribution of pores tending towards smaller size pores.According to previous researchers, low w/c ratio concrete can resistfrost attack even without aerated treatments. However, there areother research works demonstrating that low w/c ratio concretestill suffers from frost attack, while directly correlating low void ra-tios to frost resistance has simplified the scenario. According to ourpractical experience and previous research works, factors affectingfrost resistance are numerous and important. Raw compositionmaterials of concrete, mixing procedure, curing, age, and eventreatment prior to testing, temperature conditions during tests,etc. may affect the results of frost resistance tests, thus inducingmisleading conclusions. As a result, it is common to find a large
fect of pumice aggregate and air entrainment on the freeze–thaw durabil-8
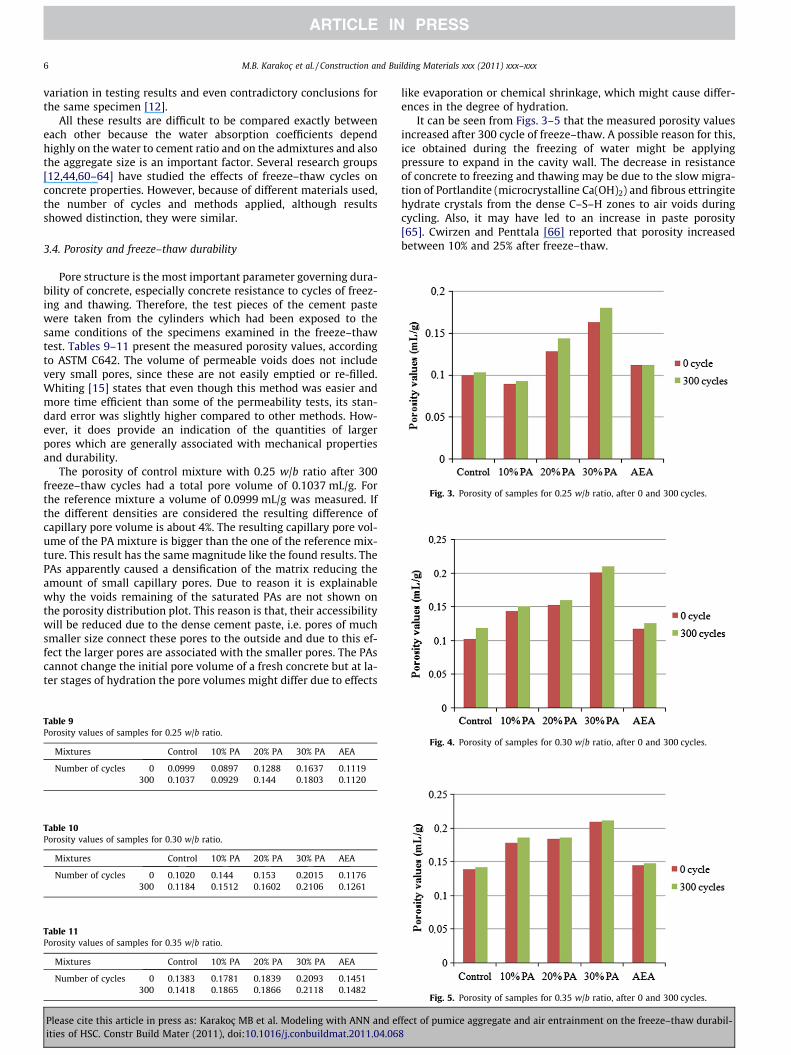
Fig. 3. Porosity of samples for 0.25 w/b ratio, after 0 and 300 cycles.
6 M.B. Karakoç et al. / Construction and Building Materials xxx (2011) xxx–xxx
variation in testing results and even contradictory conclusions forthe same specimen [12].
All these results are difficult to be compared exactly betweeneach other because the water absorption coefficients dependhighly on the water to cement ratio and on the admixtures and alsothe aggregate size is an important factor. Several research groups[12,44,60–64] have studied the effects of freeze–thaw cycles onconcrete properties. However, because of different materials used,the number of cycles and methods applied, although resultsshowed distinction, they were similar.
3.4. Porosity and freeze–thaw durability
Pore structure is the most important parameter governing dura-bility of concrete, especially concrete resistance to cycles of freez-ing and thawing. Therefore, the test pieces of the cement pastewere taken from the cylinders which had been exposed to thesame conditions of the specimens examined in the freeze–thawtest. Tables 9–11 present the measured porosity values, accordingto ASTM C642. The volume of permeable voids does not includevery small pores, since these are not easily emptied or re-filled.Whiting [15] states that even though this method was easier andmore time efficient than some of the permeability tests, its stan-dard error was slightly higher compared to other methods. How-ever, it does provide an indication of the quantities of largerpores which are generally associated with mechanical propertiesand durability.
The porosity of control mixture with 0.25 w/b ratio after 300freeze–thaw cycles had a total pore volume of 0.1037 mL/g. Forthe reference mixture a volume of 0.0999 mL/g was measured. Ifthe different densities are considered the resulting difference ofcapillary pore volume is about 4%. The resulting capillary pore vol-ume of the PA mixture is bigger than the one of the reference mix-ture. This result has the same magnitude like the found results. ThePAs apparently caused a densification of the matrix reducing theamount of small capillary pores. Due to reason it is explainablewhy the voids remaining of the saturated PAs are not shown onthe porosity distribution plot. This reason is that, their accessibilitywill be reduced due to the dense cement paste, i.e. pores of muchsmaller size connect these pores to the outside and due to this ef-fect the larger pores are associated with the smaller pores. The PAscannot change the initial pore volume of a fresh concrete but at la-ter stages of hydration the pore volumes might differ due to effects
Table 9Porosity values of samples for 0.25 w/b ratio.
Mixtures Control 10% PA 20% PA 30% PA AEA
Number of cycles 0 0.0999 0.0897 0.1288 0.1637 0.1119300 0.1037 0.0929 0.144 0.1803 0.1120
Table 10Porosity values of samples for 0.30 w/b ratio.
Mixtures Control 10% PA 20% PA 30% PA AEA
Number of cycles 0 0.1020 0.144 0.153 0.2015 0.1176300 0.1184 0.1512 0.1602 0.2106 0.1261
Table 11Porosity values of samples for 0.35 w/b ratio.
Mixtures Control 10% PA 20% PA 30% PA AEA
Number of cycles 0 0.1383 0.1781 0.1839 0.2093 0.1451300 0.1418 0.1865 0.1866 0.2118 0.1482
Please cite this article in press as: Karakoç MB et al. Modeling with ANN and efities of HSC. Constr Build Mater (2011), doi:10.1016/j.conbuildmat.2011.04.06
like evaporation or chemical shrinkage, which might cause differ-ences in the degree of hydration.
It can be seen from Figs. 3–5 that the measured porosity valuesincreased after 300 cycle of freeze–thaw. A possible reason for this,ice obtained during the freezing of water might be applyingpressure to expand in the cavity wall. The decrease in resistanceof concrete to freezing and thawing may be due to the slow migra-tion of Portlandite (microcrystalline Ca(OH)2) and fibrous ettringitehydrate crystals from the dense C–S–H zones to air voids duringcycling. Also, it may have led to an increase in paste porosity[65]. Cwirzen and Penttala [66] reported that porosity increasedbetween 10% and 25% after freeze–thaw.
Fig. 4. Porosity of samples for 0.30 w/b ratio, after 0 and 300 cycles.
Fig. 5. Porosity of samples for 0.35 w/b ratio, after 0 and 300 cycles.
fect of pumice aggregate and air entrainment on the freeze–thaw durabil-8
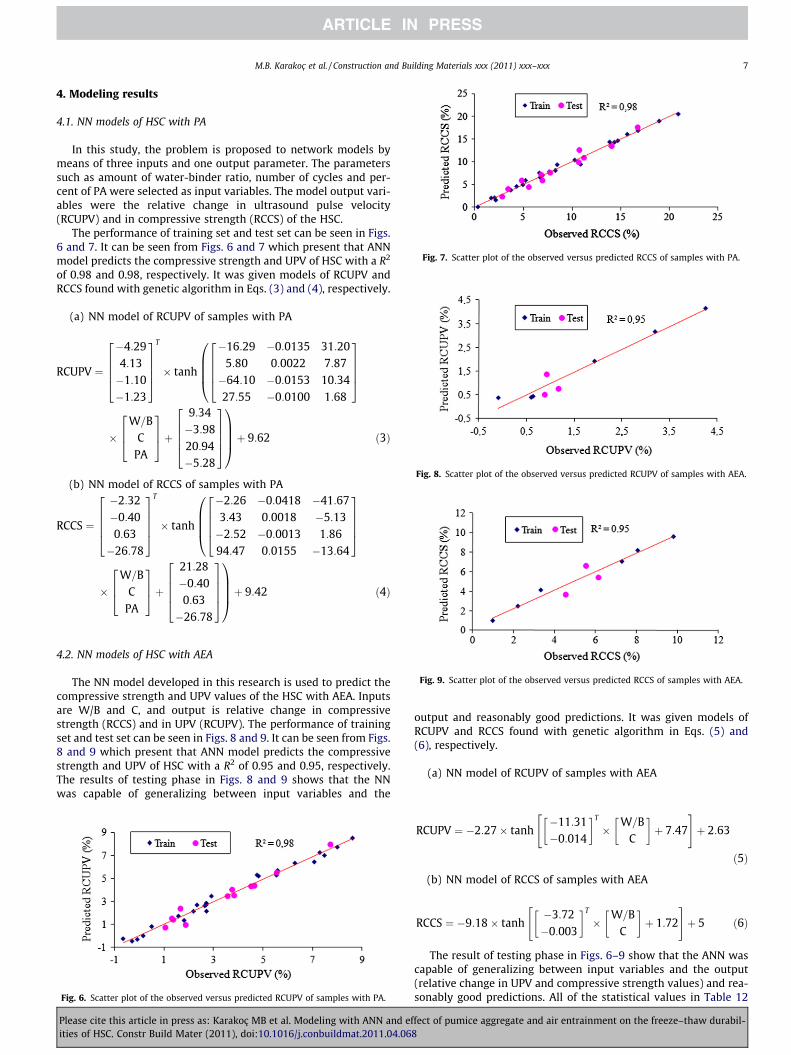
Fig. 7. Scatter plot of the observed versus predicted RCCS of samples with PA.
Fig. 8. Scatter plot of the observed versus predicted RCUPV of samples with AEA.
M.B. Karakoç et al. / Construction and Building Materials xxx (2011) xxx–xxx 7
4. Modeling results
4.1. NN models of HSC with PA
In this study, the problem is proposed to network models bymeans of three inputs and one output parameter. The parameterssuch as amount of water-binder ratio, number of cycles and per-cent of PA were selected as input variables. The model output vari-ables were the relative change in ultrasound pulse velocity(RCUPV) and in compressive strength (RCCS) of the HSC.
The performance of training set and test set can be seen in Figs.6 and 7. It can be seen from Figs. 6 and 7 which present that ANNmodel predicts the compressive strength and UPV of HSC with a R2
of 0.98 and 0.98, respectively. It was given models of RCUPV andRCCS found with genetic algorithm in Eqs. (3) and (4), respectively.
(a) NN model of RCUPV of samples with PA
RCUPV ¼
�4:294:13�1:10�1:23
26664
37775
T
� tanh
�16:29 �0:0135 31:205:80 0:0022 7:87�64:10 �0:0153 10:3427:55 �0:0100 1:68
26664
37775
0BBB@
�W=B
CPA
264
375þ
9:34�3:9820:94�5:28
26664
377751CCCAþ 9:62 ð3Þ
(b) NN model of RCCS of samples with PA
RCCS ¼
�2:32�0:400:63�26:78
26664
37775
T
� tanh
�2:26 �0:0418 �41:673:43 0:0018 �5:13�2:52 �0:0013 1:8694:47 0:0155 �13:64
26664
37775
0BBB@
�W=B
CPA
264
375þ
21:28�0:400:63�26:78
26664
377751CCCAþ 9:42 ð4Þ
Fig. 9. Scatter plot of the observed versus predicted RCCS of samples with AEA.
4.2. NN models of HSC with AEA
The NN model developed in this research is used to predict thecompressive strength and UPV values of the HSC with AEA. Inputsare W/B and C, and output is relative change in compressivestrength (RCCS) and in UPV (RCUPV). The performance of trainingset and test set can be seen in Figs. 8 and 9. It can be seen from Figs.8 and 9 which present that ANN model predicts the compressivestrength and UPV of HSC with a R2 of 0.95 and 0.95, respectively.The results of testing phase in Figs. 8 and 9 shows that the NNwas capable of generalizing between input variables and the
Fig. 6. Scatter plot of the observed versus predicted RCUPV of samples with PA.
Please cite this article in press as: Karakoç MB et al. Modeling with ANN and efities of HSC. Constr Build Mater (2011), doi:10.1016/j.conbuildmat.2011.04.06
output and reasonably good predictions. It was given models ofRCUPV and RCCS found with genetic algorithm in Eqs. (5) and(6), respectively.
(a) NN model of RCUPV of samples with AEA
RCUPV ¼ �2:27� tanh�11:31�0:014
� �T
�W=B
C
� �þ 7:47
" #þ 2:63
ð5Þ
(b) NN model of RCCS of samples with AEA
RCCS ¼ �9:18� tanh�3:72�0:003
� �T
�W=B
C
� �þ 1:72
" #þ 5 ð6Þ
The result of testing phase in Figs. 6–9 show that the ANN wascapable of generalizing between input variables and the output(relative change in UPV and compressive strength values) and rea-sonably good predictions. All of the statistical values in Table 12
fect of pumice aggregate and air entrainment on the freeze–thaw durabil-8
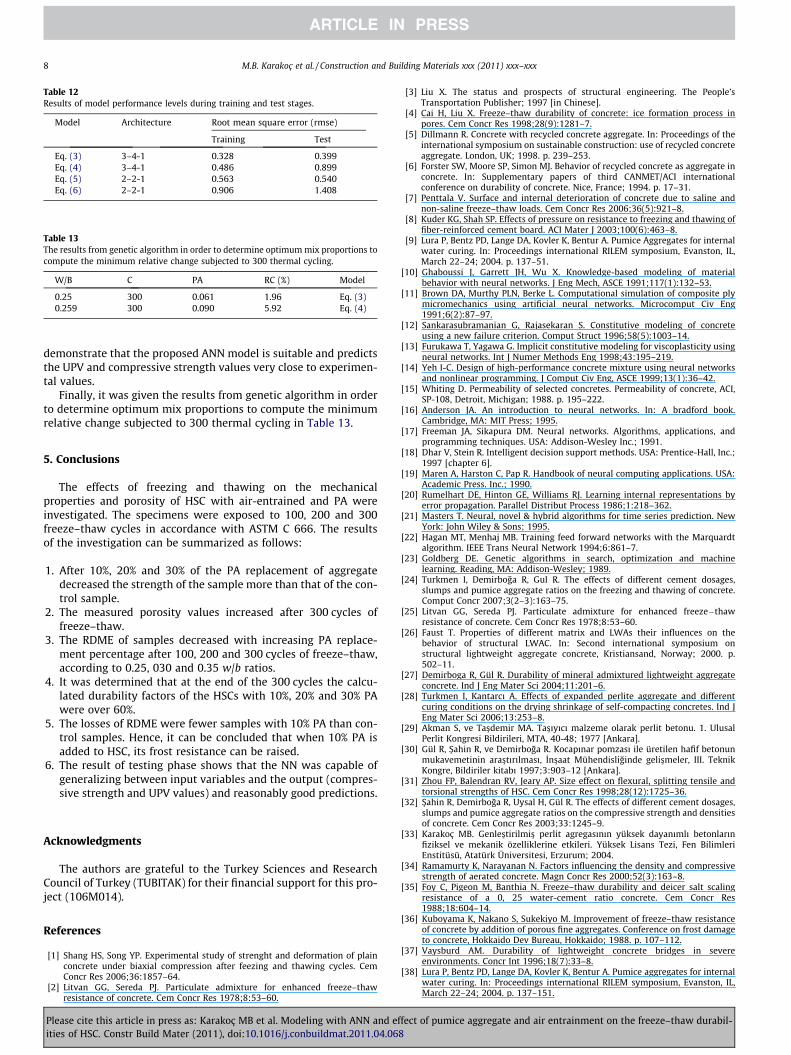
Table 12Results of model performance levels during training and test stages.
Model Architecture Root mean square error (rmse)
Training Test
Eq. (3) 3–4-1 0.328 0.399Eq. (4) 3–4-1 0.486 0.899Eq. (5) 2–2-1 0.563 0.540Eq. (6) 2–2-1 0.906 1.408
Table 13The results from genetic algorithm in order to determine optimum mix proportions tocompute the minimum relative change subjected to 300 thermal cycling.
W/B C PA RC (%) Model
0.25 300 0.061 1.96 Eq. (3)0.259 300 0.090 5.92 Eq. (4)
8 M.B. Karakoç et al. / Construction and Building Materials xxx (2011) xxx–xxx
demonstrate that the proposed ANN model is suitable and predictsthe UPV and compressive strength values very close to experimen-tal values.
Finally, it was given the results from genetic algorithm in orderto determine optimum mix proportions to compute the minimumrelative change subjected to 300 thermal cycling in Table 13.
5. Conclusions
The effects of freezing and thawing on the mechanicalproperties and porosity of HSC with air-entrained and PA wereinvestigated. The specimens were exposed to 100, 200 and 300freeze–thaw cycles in accordance with ASTM C 666. The resultsof the investigation can be summarized as follows:
1. After 10%, 20% and 30% of the PA replacement of aggregatedecreased the strength of the sample more than that of the con-trol sample.
2. The measured porosity values increased after 300 cycles offreeze–thaw.
3. The RDME of samples decreased with increasing PA replace-ment percentage after 100, 200 and 300 cycles of freeze–thaw,according to 0.25, 030 and 0.35 w/b ratios.
4. It was determined that at the end of the 300 cycles the calcu-lated durability factors of the HSCs with 10%, 20% and 30% PAwere over 60%.
5. The losses of RDME were fewer samples with 10% PA than con-trol samples. Hence, it can be concluded that when 10% PA isadded to HSC, its frost resistance can be raised.
6. The result of testing phase shows that the NN was capable ofgeneralizing between input variables and the output (compres-sive strength and UPV values) and reasonably good predictions.
Acknowledgments
The authors are grateful to the Turkey Sciences and ResearchCouncil of Turkey (TUBITAK) for their financial support for this pro-ject (106M014).
References
[1] Shang HS, Song YP. Experimental study of strenght and deformation of plainconcrete under biaxial compression after feezing and thawing cycles. CemConcr Res 2006;36:1857–64.
[2] Litvan GG, Sereda PJ. Particulate admixture for enhanced freeze–thawresistance of concrete. Cem Concr Res 1978;8:53–60.
Please cite this article in press as: Karakoç MB et al. Modeling with ANN and efities of HSC. Constr Build Mater (2011), doi:10.1016/j.conbuildmat.2011.04.06
[3] Liu X. The status and prospects of structural engineering. The People’sTransportation Publisher; 1997 [in Chinese].
[4] Cai H, Liu X. Freeze–thaw durability of concrete: ice formation process inpores. Cem Concr Res 1998;28(9):1281–7.
[5] Dillmann R. Concrete with recycled concrete aggregate. In: Proceedings of theinternational symposium on sustainable construction: use of recycled concreteaggregate. London, UK; 1998. p. 239–253.
[6] Forster SW, Moore SP, Simon MJ. Behavior of recycled concrete as aggregate inconcrete. In: Supplementary papers of third CANMET/ACI internationalconference on durability of concrete. Nice, France; 1994. p. 17–31.
[7] Penttala V. Surface and internal deterioration of concrete due to saline andnon-saline freeze–thaw loads. Cem Concr Res 2006;36(5):921–8.
[8] Kuder KG, Shah SP. Effects of pressure on resistance to freezing and thawing offiber-reinforced cement board. ACI Mater J 2003;100(6):463–8.
[9] Lura P, Bentz PD, Lange DA, Kovler K, Bentur A. Pumice Aggregates for internalwater curing. In: Proceedings international RILEM symposium, Evanston, IL,March 22–24; 2004. p. 137–51.
[10] Ghaboussi J, Garrett JH, Wu X. Knowledge-based modeling of materialbehavior with neural networks. J Eng Mech, ASCE 1991;117(1):132–53.
[11] Brown DA, Murthy PLN, Berke L. Computational simulation of composite plymicromechanics using artificial neural networks. Microcomput Civ Eng1991;6(2):87–97.
[12] Sankarasubramanian G, Rajasekaran S. Constitutive modeling of concreteusing a new failure criterion. Comput Struct 1996;58(5):1003–14.
[13] Furukawa T, Yagawa G. Implicit constitutive modeling for viscoplasticity usingneural networks. Int J Numer Methods Eng 1998;43:195–219.
[14] Yeh I-C. Design of high-performance concrete mixture using neural networksand nonlinear programming. J Comput Civ Eng, ASCE 1999;13(1):36–42.
[15] Whiting D. Permeability of selected concretes. Permeability of concrete, ACI,SP-108, Detroit, Michigan; 1988. p. 195–222.
[16] Anderson JA. An introduction to neural networks. In: A bradford book.Cambridge, MA: MIT Press; 1995.
[17] Freeman JA, Sikapura DM. Neural networks. Algorithms, applications, andprogramming techniques. USA: Addison-Wesley Inc.; 1991.
[18] Dhar V, Stein R. Intelligent decision support methods. USA: Prentice-Hall, Inc.;1997 [chapter 6].
[19] Maren A, Harston C, Pap R. Handbook of neural computing applications. USA:Academic Press. Inc.; 1990.
[20] Rumelhart DE, Hinton GE, Williams RJ. Learning internal representations byerror propagation. Parallel Distribut Process 1986;1:218–362.
[21] Masters T. Neural, novel & hybrid algorithms for time series prediction. NewYork: John Wiley & Sons; 1995.
[22] Hagan MT, Menhaj MB. Training feed forward networks with the Marquardtalgorithm. IEEE Trans Neural Network 1994;6:861–7.
[23] Goldberg DE. Genetic algorithms in search, optimization and machinelearning. Reading, MA: Addison-Wesley; 1989.
[24] Turkmen I, Demirboga R, Gul R. The effects of different cement dosages,slumps and pumice aggregate ratios on the freezing and thawing of concrete.Comput Concr 2007;3(2–3):163–75.
[25] Litvan GG, Sereda PJ. Particulate admixture for enhanced freeze�thawresistance of concrete. Cem Concr Res 1978;8:53–60.
[26] Faust T. Properties of different matrix and LWAs their influences on thebehavior of structural LWAC. In: Second international symposium onstructural lightweight aggregate concrete, Kristiansand, Norway; 2000. p.502–11.
[27] Demirboga R, Gül R. Durability of mineral admixtured lightweight aggregateconcrete. Ind J Eng Mater Sci 2004;11:201–6.
[28] Turkmen I, Kantarcı A. Effects of expanded perlite aggregate and differentcuring conditions on the drying shrinkage of self-compacting concretes. Ind JEng Mater Sci 2006;13:253–8.
[29] Akman S, ve Tas�demir MA. Tas�ıyıcı malzeme olarak perlit betonu. 1. UlusalPerlit Kongresi Bildirileri, MTA, 40-48; 1977 [Ankara].
[30] Gül R, S�ahin R, ve Demirboga R. Kocapınar pomzası ile üretilen hafif betonunmukavemetinin aras�tırılması, _Ins�aat Mühendisliginde gelis�meler, III. TeknikKongre, Bildiriler kitabı 1997;3:903–12 [Ankara].
[31] Zhou FP, Balendran RV, Jeary AP. Size effect on flexural, splitting tensile andtorsional strengths of HSC. Cem Concr Res 1998;28(12):1725–36.
[32] S�ahin R, Demirboga R, Uysal H, Gül R. The effects of different cement dosages,slumps and pumice aggregate ratios on the compressive strength and densitiesof concrete. Cem Concr Res 2003;33:1245–9.
[33] Karakoç MB. Genles�tirilmis� perlit agregasının yüksek dayanımlı betonlarınfiziksel ve mekanik özelliklerine etkileri. Yüksek Lisans Tezi, Fen BilimleriEnstitüsü, Atatürk Üniversitesi, Erzurum; 2004.
[34] Ramamurty K, Narayanan N. Factors influencing the density and compressivestrength of aerated concrete. Magn Concr Res 2000;52(3):163–8.
[35] Foy C, Pigeon M, Banthia N. Freeze–thaw durability and deicer salt scalingresistance of a 0, 25 water-cement ratio concrete. Cem Concr Res1988;18:604–14.
[36] Kuboyama K, Nakano S, Sukekiyo M. Improvement of freeze–thaw resistanceof concrete by addition of porous fine aggregates. Conference on frost damageto concrete, Hokkaido Dev Bureau, Hokkaido; 1988. p. 107–112.
[37] Vaysburd AM. Durability of lightweight concrete bridges in severeenvironments. Concr Int 1996;18(7):33–8.
[38] Lura P, Bentz PD, Lange DA, Kovler K, Bentur A. Pumice aggregates for internalwater curing. In: Proceedings international RILEM symposium, Evanston, IL,March 22–24; 2004. p. 137–151.
fect of pumice aggregate and air entrainment on the freeze–thaw durabil-8

M.B. Karakoç et al. / Construction and Building Materials xxx (2011) xxx–xxx 9
[39] Dhir RK, McCarthy MJ, Magee BJ. Impact of BS EN 450 PFA on concreteconstruction in the UK. Construct Build Mater 1998;12:59–74.
[40] Sun W, Zhang YM, Yan HD, Mu R. Damage and damage resistance of highstrength concrete under the action of load and freeze–thaw cycles. Cem ConcrRes 1999;29:1519–23.
[41] Soroushian P, Nagi M, Okwuegbu A. Freeze–thaw durability of lightweightcarbon fiber reinforced cement composites. ACI Mater J 1992;89:5.
[42] Detwiler RJ, Dalgleish BJ, Williamson RB. Assessing the durability of concretein freezing and thawing. ACI Mater J 1989;86:29–35.
[43] Jacobsen S, Sellevold EJ. Self healing of high strenght concrete afterdeterioration by freeze/thaw. Cem Concr Res 1996;26:55–62.
[44] Marzouk H, Jiang D. Effects of freezing and thawing on tension properties ofHSC. ACI Mater J 1994;91(6):577–86.
[45] Grabiec MA. Contribution to the knowledge of melamine superplasicizer effecton some characteristics of concrete after long periods of hardening. Cem ConcrRes 1999;29:699–704.
[46] Xie Y, Liu B, Yin J, Zhou S. Optimum mix parameters of high-strength self-compacting concrete with ultrapulverized fly ash. Cem Concr Res2002;32:477–80.
[47] Sabir BB. Mechanical properties and frost resistance of silica fume concrete.Cem Concr Compos 1997;19:285–94.
[48] Gao P, Wu S, Lin P, Wu Z, Tang M. The characterisitics of air void and frostresisttance of RCC with fly ash and expansive agent. Construct Build Mater2006;20:586–90.
[49] Hori M, Morihiro H. Micromechanical analysis on deterioration due to freezingand thawing in porous brittle materials. Int J Eng Sci 1998;36(4):511–22.
[50] S�ahin R, Gül R, Tas�demir MA, Çelik C. Determination of optimum conditions forfreeze–thaw resistance of concrete by measuring length change. In: Sixthinternational congress on advances in civil engineering, 6–8 October. Istanbul,Turkey: Bogazici University; 2004. p. 1055–64.
[51] Mönnig S, Lura P. Superabsorbent polymers-an additive to increase the freeze–thaw resistance of high strength concrete; 2007.
[52] Salem RH, Burdette EG, Jackson NM. Resistance to freezing and thawing ofrecycled agregate concrete. ACI Mater J 2003;100(3):216–21.
[53] Jacobsen S, Gran HC, Sellevold EJ, Bakke JA. High strength concrete-freeze/thaw testing and cracking. Cem Concr Res 1995;25(8):1775–80.
Please cite this article in press as: Karakoç MB et al. Modeling with ANN and efities of HSC. Constr Build Mater (2011), doi:10.1016/j.conbuildmat.2011.04.06
[54] Zhang MH, Gjorv OE. Microstructure of the interfacial zone betweenlightweight aggregate and cement paste. Cem Concr Res 1990;20:610–8.
[55] Öztok _I. High strength lightweight natural aggregate concrete. Master thesis,METU, Ankara; 1997.
[56] Elsharief A, Cohen M, Olek J. Influence of aggregate type and gradation on themicrostructure and durability properties of Portland cement mortar andconcrete. In: International RILEM symposium on concrete science andengineering: a tribute to Arnon Bentur; 2004. p. 213–22.
[57] Cohen MD, Zhou Y, Dolch WL. Non-air-entrained high strength concrete – is itfrost resistant? ACI Mater J 1992;89(4):406–15.
[58] Fagerlund G. Frost resistance of high performance concrete-some theoreticalconsiderations. In: Sommer H, editor. Durability of HPC, R_ILEM, 256. CachanCedex; 1994.
[59] Gifford PM, Gillott JE. Freeze–thaw durability of activated blast furnace slagcement concrete. ACI Mater J 1996;93(3):242–5.
[60] Malhotra VM. Mechanical properties, and freezing-and-thawing resistanceof non-air-entrained and air-entrained condensed silica-fume concreteusing ASTM test C 666, procedures A and B. ACI J, SP 1986;91–53:1069–94.
[61] Pigeon M, Aitcin PC, Laplante P. Comparative study of the air-void stability in anormal and a condensed silica fume field concrete. ACI Mater J 1987;84-M21:194–9.
[62] Hooton RD. Influence of silica fume replacement of cement on physicalproperties and resistance to sulfate attack, freezing and thawing, and alkali-silica reactivity. ACI Mater J 1993;90(2):143–51.
[63] Corinaldesi V, Moriconi G. Durable fiber reinforced self-compacting concrete.Cem Concr Res 2004;34:249–54.
[64] Peng GF, Ma Q, Hu HM, Gao R, Yao QF, Liu YF. The effect of air entrainment andpozzollans on frost resistance of 50–60 MPa grade concrete. Construct BuildMater 2007;21:1034–9.
[65] Nasser KW, Lai PSH. Resistance of fly ash concrete to freezing and thawing, SP132-12, Istanbul conference on fly ash; 1992. p. 284–302.
[66] Cwirzen A, Penttala V. Aggregate-cement paste transition zone propertiesaffecting the salt-frost damage of high-performance concretes. Cem Concr Res2005;35:671–9.
fect of pumice aggregate and air entrainment on the freeze–thaw durabil-8