Freeze fracturing of elastic porous media: a mathematical model
Upload
independentCategory
view
1download
0
A
EmwsEaef©
K
1
fsHactsrcipws
0d
Available online at www.sciencedirect.com
Journal of Power Sources 174 (2007) 206–220
Physical degradation of membrane electrode assemblies undergoingfreeze/thaw cycling: Micro-structure effects
S. Kim a,b, M.M. Mench a,∗a Fuel Cell Dynamics and Diagnostics Laboratory, Department of Mechanical and Nuclear Engineering,
The Pennsylvania State University, University Park, PA 16802, United Statesb Research & Development Division, Hyundai Motor Company, Yongin 446-912, Republic of Korea
Received 3 July 2007; received in revised form 18 August 2007; accepted 30 August 2007Available online 11 September 2007
bstract
The objective of this work is to investigate physical damage of polymer electrolyte fuel cell (PEFC) materials subjected to freeze/thaw cycling.ffects of membrane electrode assembly micro-structures (catalyst layer cracking, membrane thickness, and membrane reinforcement) and diffusionedia with micro-porous layers were analyzed by comparing scanning electron microscopy images of freeze/thaw cycled samples (−40 ◦C/70 ◦C)ith those of virgin material and thermal cycled samples without freezing (5 ◦C/70 ◦C). Ex situ testing performed in this study has revealed a
trong direction for the material choices in the PEFC and confirmed the previous computational model in the literature [S. He, M.M. Mench, J.lectrochem. Soc., 153 (2006) A1724–A1731; S. He, S.H. Kim, M.M. Mench, J. Electrochem. Soc., in press]. Specifically, the membrane electrode
ssemblies were found to be a source of water that can damage the catalyst layers under freeze/thaw conditions. Damage was found to occur almostxclusively under the channel, and not under the land (the graphite that touches the diffusion media). Conceptually, the best material to mitigatereeze-damage is a crack free virgin catalyst layer on a reinforced membrane that is as thin as possible, protected by a stiff diffusion media.2007 Elsevier B.V. All rights reserved.
e; Me
us
datpcmmice
eywords: Polymer electrolyte fuel cell; Degradation; Freeze/thaw; Frost heav
. Introduction
Hydrogen fuel cells are the most promising power sourceor the next generation of vehicles due to their high power den-ity, rapid dynamic response, and relatively benign emissions.owever, for fuel cell vehicles to be commercially viable, there
re several barriers to be overcome, including: durability, cost,old start ability, and hydrogen storage and delivery infrastruc-ure. Issues related to subfreezing operation, including rapidtart-up, energy consumption, survivability, and durability haveecently become the subjects of investigation. For fuel cell vehi-les to be competitive, they should deliver 90% of rated powern 30 s from a cold start at −20 ◦C, with less than 62.5 J/We
arasitic energy input [3]. Moreover, fuel cells should surviveithout damage after repeated soaking at −40 ◦C. Cold start andurvivability issues are attributed to the existence of residual liq-
∗ Corresponding author. Tel.: +1 814 865 0060; fax: +1 814 863 4848.E-mail address: [email protected] (M.M. Mench).
kwhla0i
378-7753/$ – see front matter © 2007 Elsevier B.V. All rights reserved.oi:10.1016/j.jpowsour.2007.08.111
mbrane
id water after shutdown, or water generation during the coldtart-up.
This paper is concerned with residual liquid water from shut-own. When fuel cells are exposed to a subfreezing ambienttmosphere, ice is formed. Expansion and contraction due tohe ice formation and melting process, and the frost heaverocess caused by capillary forces [1,2] can cause mechani-al stress or delamination in the fuel cell materials, leading toaterial degradation. On start-up, existence of ice or ice for-ation can also delay start-up time and require external energy
nput. Redistribution and the amount of residual water in fuelell materials during the shutdown play an important role inlucidating the damage mode. In the Nafion® membrane, threeinds of water phases, free water, freezable loosely boundedater, and non-freezable water exist. Non-freezable water isighly polarized in hydration shells and is unable to crystal-
ize. Free water behaves like bulk water which exhibits sharpfreezing peak in differential scanning calorimetry (DSC) at◦C. Freezable weakly bounded water interacts weakly with
on cores, which displays relatively broad freezing depression

S.Kim
,M.M
.Mench
/JournalofPower
Sources174
(2007)206–220
207
Table 1Summary of observed PEFC damage due to freezingReference Test mode Membrane CL MEA DM Test conditions Results Publication
T range (◦C) Number of cycles Purge/no purge
Wilson et al. [15] In situ F/T Nafion® 117 20 wt.% Pt/C(0.16 mg cm−2)
Decal process a ELAT hydrophobiccarbon cloth
−10/80 3 No purge (wet) No performance loss 1994
McDonald et al. [7]Ex situ F/T Nafion® 112 0.4 mg Pt/C cm−2 N/A None −40/80
385 Dry state (λ < 3) No remarkable physical damage;change in the molecular level
2004
In situ F/T Nafion® 112 0.4 mg Pt/C cm−2 N/A Carbon paper 385 Dry state (λ < 3) No remarkable physical damage;change in the molecular level
Liu [18]
Ex situ F/T(immersion)
Nafion® 112 N/A N/A None
−40/50
10 Immersed in water Severe CL loss; severe deformationof MEA
2006DSM N/A N/A None 10 Immersed in water No observable loss
In situ F/TNafion® 112 N/A N/A N/A 40 N/A No performance loss; no ECSA lossDSM N/A N/A N/A 40 N/A No performance loss; no ECSA loss
Patterson et al.[19,20]
In situ F/T N/A N/A N/A N/A −40/25 63 N/A No performance loss2006
Cold start-up N/A N/A N/A N/A −15 N/A N/A End cell loss
Mukundan et al.[16,17]
In situ F/T
Nafion® 1135 20 wt.% Pt/C(0.2 mg cm−2) Decal processa
Wet proofed carboncloth
−40/80100 No purge (wet) No performance loss
2006SGL 30 DCb 45 No purge (wet) Mechanical failure of GDL
Nafion® 1135 20 wt.% Pt/C(0.2 mg cm−2)
Wet proofed carboncloth
−80/80 10 No purge (wet) Performance loss; HFR increase;interfacial delamination GDL fail-ure
Cho et al. [10,11] In situ F/T Nafion® 11520 wt.% Pt/C(0.4 mg cm−2)
GDEc Wet proofed carbonpaper
−10/80 4 No purge (wet) Performance loss, ohmic andcharge transfer resistance increase;ECSA loss
2003
4 Dry purge (λ < 2) No performance loss; no ECSA loss 2004Gaylord [12] Field test (stationary) N/A N/A N/A Carbon paper Exposed to freezing N/A N/A DM fracture; membrane failure;
severe CL delamination2005
Meyers [13] In situ F/T Commercial MEAs(reinforced membrane)
N/A −20/NA 20 N/A Membrane cracks; CL delamina-tion
2005
Oszcipok et al.[21,22]
Cold start-upCatalyst coated membrane N/A −10 10 Dry purge Performance loss; ECSA loss;
Hydrophobicity loss (MPL, DM)2005
Catalyst coated membrane(0.4 mgPt cm−2)
Carbon cloth −10 7 Partial purge Significant performance loss 2006
Yan et al. [14] Cold start-up Nafion® 112,115,117 20 wt.% Pt/C GDEd Carbon paper/cloth −15 NA N/A Interfacial delamination; mem-brane hole
2006
Guo et al. [8]Ex situ F/T
Commercial MEAwith 30 �mmembrane and1.0 mg Pt cm−2
None−30/20
6Dry purge (λ < 4) Negligible damage
2006
No purge (wet) Severe damage;severe CL cracks
In situ F/T Carbon paper 20No purge (wet) Severe CL cracks;
ECSA loss; neg-ligible performanceloss; easy flooding
Dry purge (λ < 4) No physical dam-age; no performanceloss
Hou et al. [9] In situ F/T Nafion® 212 20 wt.% Pt/C(0.8 mgPt cm−2)
GDEe Carbon paper −20/60 20 Dry purge (λ < 2) No performance loss; no ECSAloss; no physical damage
2006
Abbreviations: F/T, freeze/thaw thermal cycling; DSM, dimensionally stable membrane; GDE, gas diffusion electrode; MEM, membrane.a Decal printing (TBA + form catalyst) and then hot pressing at 200 ◦C.b 20% PTFE treatment with MPL.c Catalyst ink sprayed on DM and then hot pressing at 140 ◦C.d Sprayed on DM and then hot pressed.e Sprayed on DM.

208 S. Kim, M.M. Mench / Journal of Power Sources 174 (2007) 206–220
F mal c(
b(e8atdtp
ccpHn
msiu[feFw[
ig. 1. Schematic and pictures of test setup used for the ex situ freeze/thaw therc) flow field plate and compression plate.
elow −20 ◦C [4–6]. The water content among the three phasesλ = H2O/SO3
−) in the Nafion® membrane is reported differ-ntly [4–6]: 17–20.8 (total), 2.2–13.1 (non-freezable water),.3–13.1 (weakly bounded water), and 0–4.9 (free water). Freez-ble water (weakly bounded and free water) redistributes duringhe shutdown and is a key factor for freeze/thaw (F/T) cyclingamage by ice lens formation [1,2]. However, water phase andransport behaviors under freezing conditions are not yet com-letely understood.
Existing findings on damage by freezing are summarizedhronologically in Table 1. One important result shows that fuel
ells dried during the shutdown experience neither observablehysical damage nor electrochemical losses by freezing [7–10].owever, there are conflicting results in case of a cell witho significant purge. Some reported physical damage, perfor-arsi
ycling tests. (a) Schematic of test setup, (b) vessel and assembled test cells, and
ance loss, and electrochemical loss (electrochemical catalyticurface area (ECSA), interfacial and charge transfer resistancencrease) [8,11–14]. Physical damage includes membrane fail-re (holes and cracks) [12–14], catalyst cracks and delamination8,13], pore distribution change [11], and gas diffusion mediaracture [12]. Others observed no significant performance lossven without dry purge during the shutdown [15–17]. UTCuel Cells observed severe damage owing to freezing, butith stack design changes, damage is reported to be prevented
13,19,20].Liu [18] investigated the effects of membrane reinforcement
nd diffusion media on freezing damage. Contrary to a non-einforced membrane electrode assembly (MEA) with a dimen-ionally stable reinforced membrane had no observable damagen the ex situ immersion F/T thermal cycling test, which indi-
S. Kim, M.M. Mench / Journal of Power Sources 174 (2007) 206–220 209
Ft
cIoi
f[[di
mamflsap
mtoioica
F7
atsf
sh9ppfdsbc
cumcwck
TT
M
NCNN
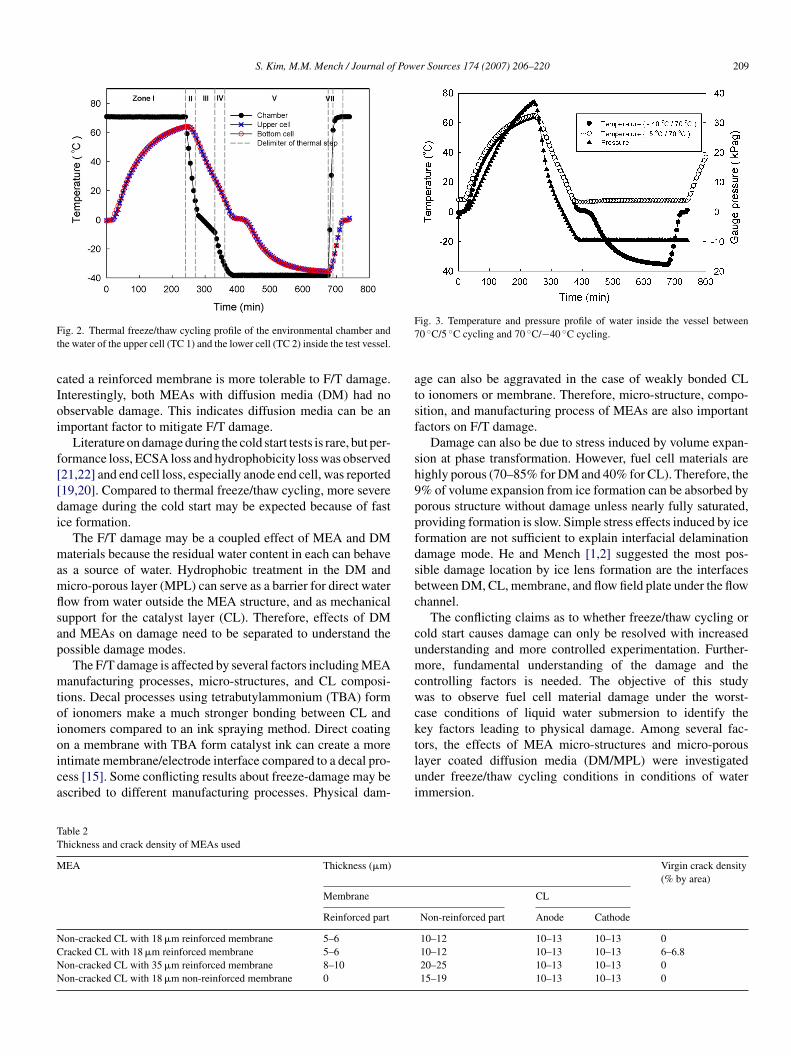
ig. 2. Thermal freeze/thaw cycling profile of the environmental chamber andhe water of the upper cell (TC 1) and the lower cell (TC 2) inside the test vessel.
ated a reinforced membrane is more tolerable to F/T damage.nterestingly, both MEAs with diffusion media (DM) had nobservable damage. This indicates diffusion media can be anmportant factor to mitigate F/T damage.
Literature on damage during the cold start tests is rare, but per-ormance loss, ECSA loss and hydrophobicity loss was observed21,22] and end cell loss, especially anode end cell, was reported19,20]. Compared to thermal freeze/thaw cycling, more severeamage during the cold start may be expected because of fastce formation.
The F/T damage may be a coupled effect of MEA and DMaterials because the residual water content in each can behave
s a source of water. Hydrophobic treatment in the DM andicro-porous layer (MPL) can serve as a barrier for direct waterow from water outside the MEA structure, and as mechanicalupport for the catalyst layer (CL). Therefore, effects of DMnd MEAs on damage need to be separated to understand theossible damage modes.
The F/T damage is affected by several factors including MEAanufacturing processes, micro-structures, and CL composi-
ions. Decal processes using tetrabutylammonium (TBA) formf ionomers make a much stronger bonding between CL andonomers compared to an ink spraying method. Direct coating
n a membrane with TBA form catalyst ink can create a morentimate membrane/electrode interface compared to a decal pro-ess [15]. Some conflicting results about freeze-damage may bescribed to different manufacturing processes. Physical dam-tlui
able 2hickness and crack density of MEAs used
EA Thickness (�m)
Membrane
Reinforced part
on-cracked CL with 18 �m reinforced membrane 5–6racked CL with 18 �m reinforced membrane 5–6on-cracked CL with 35 �m reinforced membrane 8–10on-cracked CL with 18 �m non-reinforced membrane 0
ig. 3. Temperature and pressure profile of water inside the vessel between0 ◦C/5 ◦C cycling and 70 ◦C/−40 ◦C cycling.
ge can also be aggravated in the case of weakly bonded CLo ionomers or membrane. Therefore, micro-structure, compo-ition, and manufacturing process of MEAs are also importantactors on F/T damage.
Damage can also be due to stress induced by volume expan-ion at phase transformation. However, fuel cell materials areighly porous (70–85% for DM and 40% for CL). Therefore, the% of volume expansion from ice formation can be absorbed byorous structure without damage unless nearly fully saturated,roviding formation is slow. Simple stress effects induced by iceormation are not sufficient to explain interfacial delaminationamage mode. He and Mench [1,2] suggested the most pos-ible damage location by ice lens formation are the interfacesetween DM, CL, membrane, and flow field plate under the flowhannel.
The conflicting claims as to whether freeze/thaw cycling orold start causes damage can only be resolved with increasednderstanding and more controlled experimentation. Further-ore, fundamental understanding of the damage and the
ontrolling factors is needed. The objective of this studyas to observe fuel cell material damage under the worst-
ase conditions of liquid water submersion to identify theey factors leading to physical damage. Among several fac-ors, the effects of MEA micro-structures and micro-porous
ayer coated diffusion media (DM/MPL) were investigatednder freeze/thaw cycling conditions in conditions of watermmersion.Virgin crack density(% by area)
CL
Non-reinforced part Anode Cathode
10–12 10–13 10–13 010–12 10–13 10–13 6–6.820–25 10–13 10–13 015–19 10–13 10–13 0
2 f Pow
2
2
ouLtt−fitwappsbsaMiut
cocu
(
(
ttfitlidil
wff1rn
3it0cpt(gS
uMlorwdpbpn−asinswoSatfMiuc
scIoaeu
2
tto
10 S. Kim, M.M. Mench / Journal o
. Method of approach
.1. Material testing
Fig. 1 shows a schematic of the ex situ test setup consistingf four test vessels, an environmental chamber (Thermal Prod-ct Solutions, Model: T10S-1.5), and a National InstrumentsabviewTM based data acquisition system. The test vessels were
hermally cycled and controlled by an integrated programmableemperature controller with an operating temperature range from
40 ◦C to 200 ◦C. A test cell consisted of two graphite floweld plates with seven channels (2 mm width and depth) and
wo stainless steel compression plates. Test samples were sand-iched by graphite plates and stainless steel compression plates,
nd compressed by bolts and spring lock washers by the sameressure forces as a normal fuel cell, which was verified byressure paper. The test cells were assembled with additionaltainless steel end plates in order to have similar temperatureoundary conditions. Two identical MEAs were tested in theame vessel, where the upper test cell was assembled withMEA without DM/MPL and the second lower cell with aEA with DM/MPL. Two additional DM/MPL materials were
nserted between the upper test cell and end plate to maintainniform compression and similar temperature boundary condi-ions.
The thermal profile of the environmental chamber wasalibrated, and Fig. 2 shows the measured thermal profilef the test bath and chamber. The thermal profile used forycling was set to the following by the internal programmablenit:
(I) soaking at 70 ◦C for 4 h 30 min;(II) cooling from 70 ◦C to 5 ◦C for 30 min;
(III) cooling from 5 ◦C to −10 ◦C for 1 h;IV) cooling from −10 ◦C to −40 ◦C for 30 min;(V) soaking at −40 ◦C for 5 h 15 min;VI) heating from −40 ◦C to 70 ◦C for 15 min.
As shown in Fig. 2, temperature profiles of the upper cell andhe lower cell are almost the same, so that comparison betweenwo test cells is valid. To identify damage induced by onlyreeze/thaw cycling, additional thermal cycling without freez-ng between 5 ◦C and 70 ◦C was also performed. To make heatransfer rates of two cases (without freezing/with freezing) simi-ar, the chamber temperature profile was calibrated. From Fig. 3,t is clear that temperature profile during the heat up and coolingown of both cases are almost the same, so legitimate compar-son is possible, and the potential heat transfer rate effect oniquid transport is not a factor in these tests.
Four MEA types, supplied by W.L. Gore and Associates,ere tested to investigate effects of membrane thickness, rein-
orcement of membrane, and virgin CL crack density. The
our MEA types consisted of (1) virgin non-cracked CL with8 �m reinforced membrane, (2) virgin cracked CL with 18 �meinforced membrane, (3) virgin non-cracked CL with 18 �mon-reinforced membrane, and (4) virgin non-cracked CL withMtcm
er Sources 174 (2007) 206–220
5 �m reinforced membrane. The composition and manufactur-ng processes of the CL of all four MEAs were identical, andhe Pt loading in the anode and cathode CL respectively was.4 mg cm−2. Micro-structures and compositions of anode andathode were also identical, which enabled us to eliminate com-ositional and manufacturing effects on F/T damage. All fourypes of MEAs experienced 30 thermal cycles with freezing−40 ◦C to 70 ◦C) and without freezing (5–70 ◦C). To investi-ate effects of DM/MPL on F/T damage, a paper DM/MPL,GL 10BB (SGL Carbon Group, USA) was used.
The MEAs without DM were directly in contact with liq-id water, the worst possible case. However, in case of theEAs with DM/MPL, SGL 10BB blocks direct contact of
iquid water with MEA if external pressure is not applied tovercome capillary pressure. Pressurizing the test vessels isequired to ensure the MEA humidified. In this ex situ test,ater vapor pressure increase as a result of temperature changeuring the F/T cycling was utilized, as shown in Fig. 3. Theressure of the sealed test vessel increases with temperature,ecause of water saturation vapor and ideal gas effects. Theressure was measured by a pressure transducer (Omega Engi-eering Inc., Model: PX209-30V15GI, gauge pressure range:100 kPag to 100 kPag). The gauge pressure reaches 37.92 kPag
t the maximum temperature and as cooling proceeds, the pres-ure decreases to −8.96 kPag. Even when the pressure profiles repeated, water saturation inside the porous media shouldot change with time, because the negligible hydrostatic pres-ure difference across the porous material fully immersed in theater cannot transport water out of the porous media. Basedn experimental capillary pressure versus saturation level ofGL10BB, the liquid water saturation level is estimated to bebout 50% in these conditions [25]. Therefore, water level inhe thermally cycled MEA with DM/MPL (SGL10BB) is aboveully vapor saturated. This test condition is less severe than
EA without DM/MPL (with 100% liquid contact), but is antic-pated to be more severe than actual fuel cell situations, allowings to observe the key factors in physical damage under F/Tonditions.
The thickness and surface crack density of tested MEAs areummarized in Table 2. The surface crack area density of virginracked MEA was measured by using ImageJ [26] software.t should be noted that cracks did not include internal voidsbserved occasionally in the membrane/catalyst layer interfaces,nd were a result of the manufacturing process. Five scanninglectron microscopy (SEM) images (magnification 50×) weresed to assess the average crack density.
.2. Sample preparation for SEM image
Tested samples were stored in a sealed zipper bag to main-ain the same humidity level. To observe morphologies by SEM,ested samples were exposed to ambient atmosphere to dryut for at least 8 h. Surface morphologies of thermally cycled
EAs without DM/MPL were observed using a sample holderemplate. The template had the same size as test samples, andonsisted of three windows across the channel to observe unifor-ity of damage. To observe the cross-sectional image of cycled
S. Kim, M.M. Mench / Journal of Pow
FMd
Mbabl
Mdtfbrsbmpoaiwc
sotSco
3
cafaw
3
rwwomdpetsc
ofMtaoicwc
offcMtcfaWu
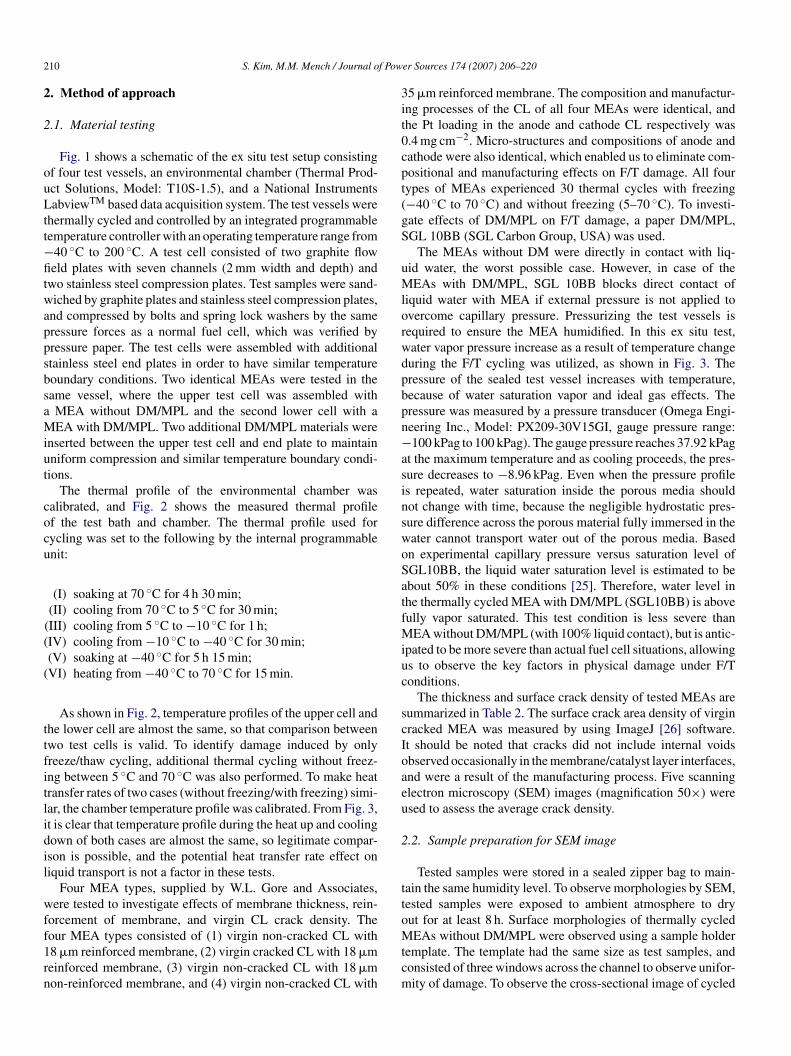
ig. 4. Typical cross-sectional and magnified images of CL surface of cycledEA with DM/MPL: (a) cross-sectional image and (b) magnified image of the
otted box of (a).
EAs without DM/MPL, sectioning of samples was preparedy applying a new razor blade vertically on the cycled samplecross the channel direction. The sectioned MEA was assem-led between aluminum templates having the same channel andand geometry.
To observe surface and cross-sectional images of cycledEAs with DM/MPL, the DM/MPL must be removed without
amage. The cycled DM/MPL-attached MEA was cut acrosshe channel. Then the DM/MPL sample was cut from the sur-ace side intended for observation, enabling the DM/MPL toe removed with negligible damage. By cutting with a newazor blade on the removed sliced MEA surface, sectionalamples were prepared. The cutting direction is important,ecause the sectioning itself may cause delamination. Theembrane/electrode interface under the membrane (bottom
art) may be delaminated, but delamination of the interfacef the top part should be negligible. Figures in this work
re shown as cut from top to bottom. A typical sectionedmage is shown in Fig 4. Surface images of cycled MEAith DM/MPL were observed by rotating and tilting the sameross-sectional sample. A close-up image of DM/MPL-removed
orn
er Sources 174 (2007) 206–220 211
urface (denoted as a dotted rectangle) is shown in the bottomf Fig. 4. The gap between MEA and DM/MPL was ascribedo uneven compression of sample holder, not to F/T damage.urface morphologies and cross-sectional images of virgin, F/Tycled, and thermally cycled but not frozen materials werebserved.
. Results
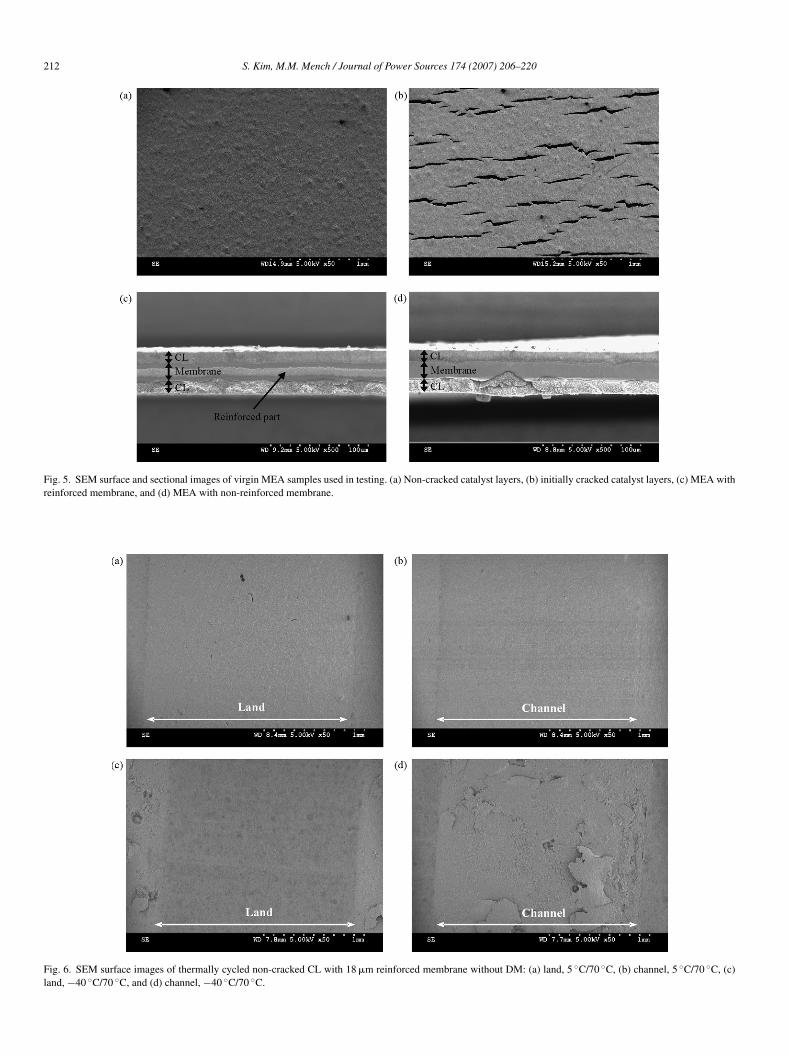
Fig. 5 shows surface SEM images of virgin MEAs withracked (6.0–6.8% by area) and non-cracked catalyst layers. Itlso shows sectional SEM images of virgin MEAs with rein-orced membrane [27] and non-reinforced membrane. It shouldlso be noted that membrane was exposed inside the cracks,hich can serve as water pooling sites.
.1. Thermal cycling effects of MEAs without DM
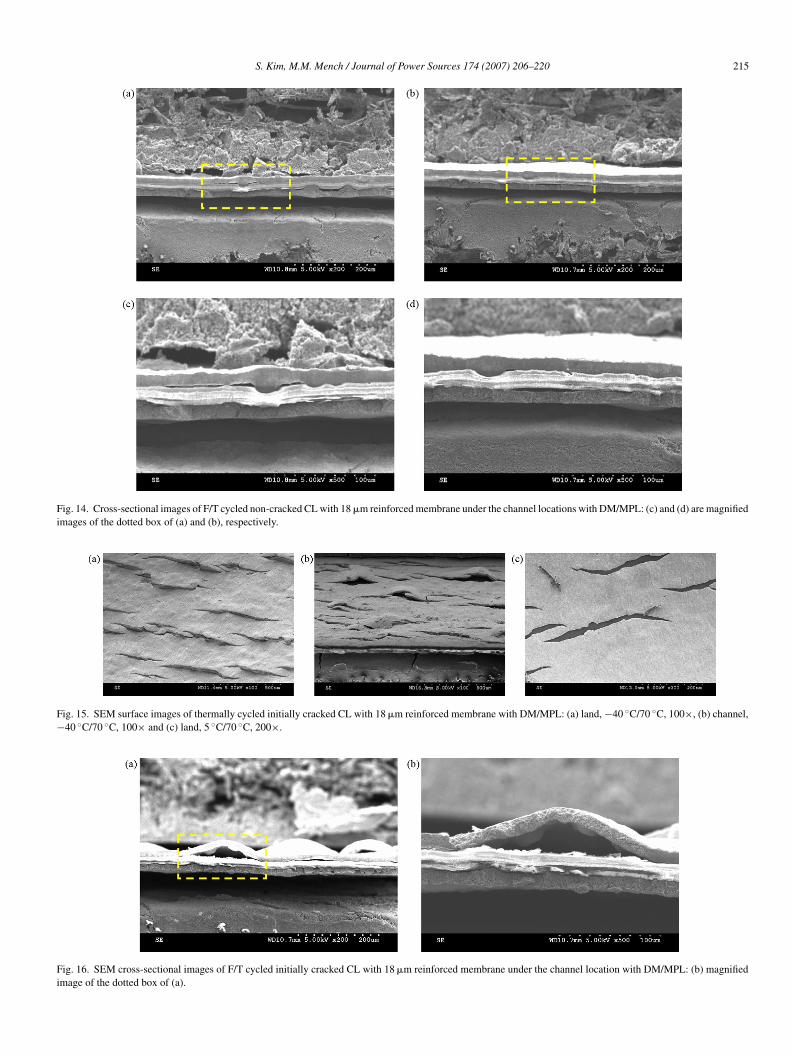
Fig. 6 shows images of the non-cracked CL with 18 �meinforced membrane. On the top row of images, no damageas observed in the condition subjected to thermal cyclingithout freeze between 5 ◦C and 70 ◦C. However, separationf catalyst layers was observed under the channel when ther-ally cycling with freezing from −40 ◦C to 70 ◦C. No such
amage was observed under the land, due to the high com-ression force applied, which restricts ice lens growth andxpansion damage. A cross-sectional view of the damage forhis configuration is given in Fig. 7, showing the catalyst layereparation exclusively under the channel location for the frozenondition.
Figs. 8 and 9 show surface and cross-sectional SEM imagesf a thermally cycled initially cracked CL with 18 �m rein-orced membrane without DM/MPL. Similar to the non-cracked
EA, the damage was observed under the channels. Due tohe initial cracking, however, it appears the resultant dam-ge after freeze/thaw cycling was more severe. It was alsobserved that simple thermal cycling without freeze did notnduce morphological damage. The membrane in the initiallyracked MEA, of which the membrane between the cracksas exposed to water, was not apparently damaged by F/T
ycling.Figs. 10 and 11 show surface and cross-sectional SEM images
f a thermally cycled initially non-cracked CL with 35 �m rein-orced membrane without DM/MPL. Interestingly, the damageor this MEA was much more severe than for the similar non-racked 18 �m reinforced case, indicating the thickness of theEA does play a role in the damage process, as predicted by
he modeling results [1]. Nearly, complete delamination of theatalyst layer under the channels was seen. Again, the non-rozen samples do not show any obvious morphological damage,lthough a thin crack along the channel/land interface was seen.e determined from other results that this was prevented with
se of the diffusion media.
Figs. 12 and 13 show surface and cross-sectional SEM imagesf a thermally cycled initially non-cracked CL with 18 �m non-einforced membrane without DM/MPL. The damage for thison-reinforced membrane case was much more severe than for
212 S. Kim, M.M. Mench / Journal of Power Sources 174 (2007) 206–220
Fig. 5. SEM surface and sectional images of virgin MEA samples used in testing. (a) Non-cracked catalyst layers, (b) initially cracked catalyst layers, (c) MEA withreinforced membrane, and (d) MEA with non-reinforced membrane.
Fig. 6. SEM surface images of thermally cycled non-cracked CL with 18 �m reinforced membrane without DM: (a) land, 5 ◦C/70 ◦C, (b) channel, 5 ◦C/70 ◦C, (c)land, −40 ◦C/70 ◦C, and (d) channel, −40 ◦C/70 ◦C.

S. Kim, M.M. Mench / Journal of Power Sources 174 (2007) 206–220 213
Fig. 7. Cross-sectional images of thermally cycled non-cracked CL with 18 �m reinforced membrane without DM: (a) −40 ◦C/70 ◦C, land, 500×, (b) −40 ◦C/70 ◦C,channel, 200× and (c) 5 ◦C/70 ◦C, channel, 500×.
Fr
tacSwiw
3
c
Fm
btvctnci
F
ig. 8. SEM surface images of F/T cycled initially cracked CL with 18 �meinforced membrane without DM located under the channel.
he similar case with a reinforced membrane. The extent of dam-ge is similar to the non-cracked 35 �m reinforced case. Nearlyomplete delamination of CL under the channels was observed.imilar to non-cracked CL with 35 �m reinforced membraneithout DM/MPL, a slight line crack along the channel/land
nterface was observed in the non-frozen MEA that is eliminatedith a DM.
.2. Thermal cycling effects with DM/MPL
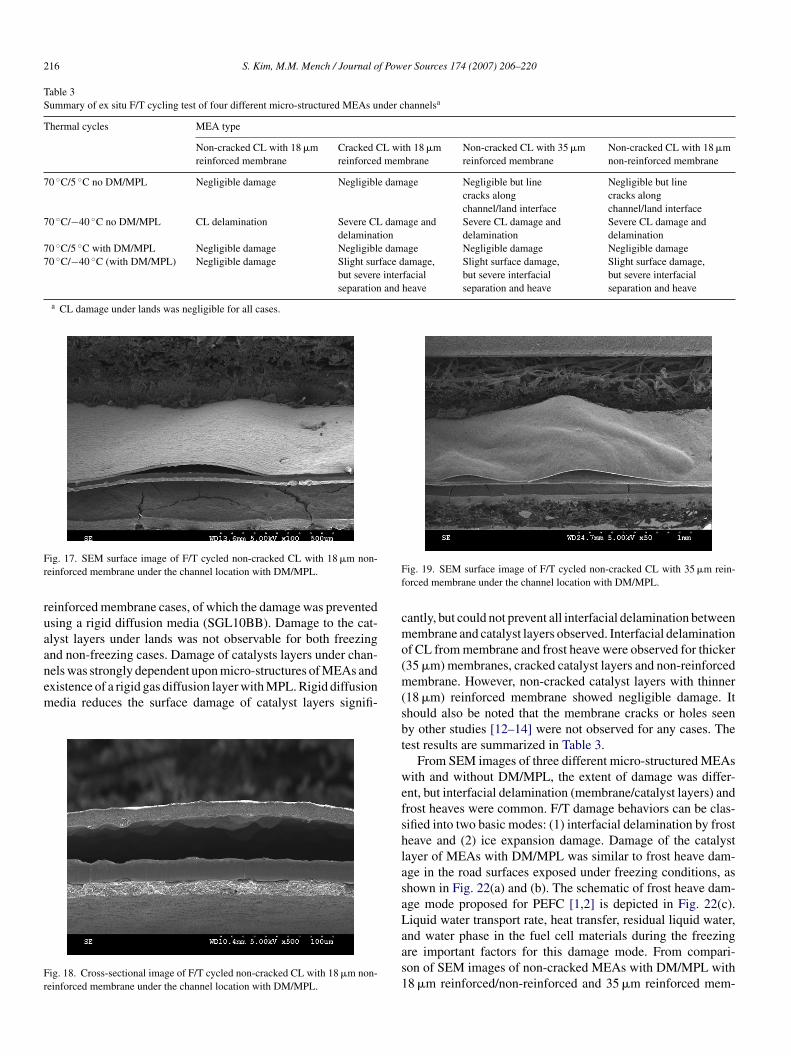
Fig. 14 shows cross-sectional SEM images of a thermallyycled initially non-cracked CL with 18 �m reinforced mem-
istw
ig. 10. SEM surface images of non-cracked CL with 35 �m reinforced membrane u
ig. 9. Sectional image of F/T cycled initially cracked CL with 18 �m reinforcedembrane without DM located under the channel.
rane with DM/MPL. The results from cycle testing indicatehat this configuration (thin, reinforced, with DM/MPL, withoutirgin cracks) is the most tolerant to freeze-damage. Unlike thease of the same MEA without DM (shown in Figs. 6 and 7),he surface morphology of CL under the channel was not sig-ificantly changed in this case. Some minor cracking under thehannels was observed in the frozen case, but it is unclear if thiss a result of sectioning, manufacturing, or freeze/thaw. Some
solated locations of CL bubbling can be seen, but they areporadic and the MEA remained largely intact. The commonrend of negligible under-the-land physically observable damageas detected. Thermal cycling without freeze did not cause anynder the channel locations without DM: (a) 5 ◦C/70 ◦C and (b) −40 ◦C/70 ◦C.

214 S. Kim, M.M. Mench / Journal of Power Sources 174 (2007) 206–220
Fr
dcF
omindhdn
ontopTDatth
Fr
swt
ofiomahtcdsst
4
F(
ig. 11. Cross-sectional images of F/T cycled initially cracked CL with 35 �meinforced membrane without DM located under the channel.
amage, and negligible damage under frozen conditions indi-ates that the DM/MPL combination can generally withstand/T cycling.
Figs. 15 and 16 show surface and cross-sectional SEM imagesf a thermally cycled initially cracked CL with 18 �m reinforcedembrane with DM/MPL. In this case, it is obvious that the
nitial cracks in CL promote severe damage. Compared to theon-cracked 18 �m case, the DM/MPL reduced the extent of F/Tamage observed in Figs. 8 and 9, but CL delamination and frosteave were observed under the channels. Under the lands, thereoes appear to be some morphological change in the cracks, buto delamination was observed.
Figs. 17 and 18 show surface and cross-sectional SEM imagesf a thermally cycled initially non-cracked CL with 18 �mon-reinforced membrane with DM/MPL. As in the non-DMesting, with these samples, there was much more severe damagef the under-the-channel location of the frozen samples com-ared to the reinforced membrane results of the same thickness.he DM/MPL reduced significant surface damage because theM/MPL can block liquid water contact in MEA as well as
bsorb stress due to ice expansion. However, it should be notedhat DM/MPL cannot completely prevent interfacial delamina-ion. A more dimensionally stable reinforced membrane [27] canelp to limit the damage. Again, the non-frozen samples do not
scw
ig. 12. SEM surface images of thermally cycled non-cracked CL with 18 �m non-reb) −40 ◦C/70 ◦C.
ig. 13. Cross-sectional images of F/T cycled non-cracked CL with 18 �m non-einforced membrane without DM located under the channel.
how any obvious morphological damage. Interestingly, thereas no thin crack along the channel/land interface observed, as
here had been for the case without DM.Figs. 19 and 20 show surface and cross-sectional SEM images
f a thermally cycled initially non-cracked CL with 35 �m rein-orced membrane with DM/MPL. Fig. 21 shows additional SEMmages of frost heave damage from under the channel locationsf the same MEA type having undergone freeze cycling. Theembrane in this case is reinforced, and protected by DM/MPL,
nd the virgin CL is non-cracked. However, the extensive frosteave damage and CL separation were observed compared tohe similar 18 �m reinforced membrane case. This demonstratesonclusively that the membrane itself can be a source of water foramage in CL. As in all cases, the non-frozen thermally cycledamples do not show any obvious morphological damage, andevere delamination or surface heave of frozen cells is limitedo under-the-channel locations.
. Discussion
In summary, thermal cycling without freeze did not causeignificant damage for all cases in the water immersion testonditions. However, line cracks along channel/land interfacesere observed for 35 �m reinforced membrane and 18 �m non-
inforced membrane without DM located under the channel: (a) 5 ◦C/70 ◦C and
S. Kim, M.M. Mench / Journal of Power Sources 174 (2007) 206–220 215
Fig. 14. Cross-sectional images of F/T cycled non-cracked CL with 18 �m reinforced membrane under the channel locations with DM/MPL: (c) and (d) are magnifiedimages of the dotted box of (a) and (b), respectively.
Fig. 15. SEM surface images of thermally cycled initially cracked CL with 18 �m reinforced membrane with DM/MPL: (a) land, −40 ◦C/70 ◦C, 100×, (b) channel,−40 ◦C/70 ◦C, 100× and (c) land, 5 ◦C/70 ◦C, 200×.
Fig. 16. SEM cross-sectional images of F/T cycled initially cracked CL with 18 �m reinforced membrane under the channel location with DM/MPL: (b) magnifiedimage of the dotted box of (a).
216 S. Kim, M.M. Mench / Journal of Power Sources 174 (2007) 206–220
Table 3Summary of ex situ F/T cycling test of four different micro-structured MEAs under channelsa
Thermal cycles MEA type
Non-cracked CL with 18 �mreinforced membrane
Cracked CL with 18 �mreinforced membrane
Non-cracked CL with 35 �mreinforced membrane
Non-cracked CL with 18 �mnon-reinforced membrane
70 ◦C/5 ◦C no DM/MPL Negligible damage Negligible damage Negligible but linecracks alongchannel/land interface
Negligible but linecracks alongchannel/land interface
70 ◦C/−40 ◦C no DM/MPL CL delamination Severe CL damage anddelamination
Severe CL damage anddelamination
Severe CL damage anddelamination
70 ◦C/5 ◦C with DM/MPL Negligible damage Negligible damage Negligible damage Negligible damage70 ◦C/−40 ◦C (with DM/MPL) Negligible damage Slight surface damage,
but severe interfacialseparation and heave
Slight surface damage,but severe interfacialseparation and heave
Slight surface damage,but severe interfacialseparation and heave
a CL damage under lands was negligible for all cases.
Fr
ruaanem
Fr
Ff
cmo
ig. 17. SEM surface image of F/T cycled non-cracked CL with 18 �m non-einforced membrane under the channel location with DM/MPL.
einforced membrane cases, of which the damage was preventedsing a rigid diffusion media (SGL10BB). Damage to the cat-lyst layers under lands was not observable for both freezingnd non-freezing cases. Damage of catalysts layers under chan-
els was strongly dependent upon micro-structures of MEAs andxistence of a rigid gas diffusion layer with MPL. Rigid diffusionedia reduces the surface damage of catalyst layers signifi-ig. 18. Cross-sectional image of F/T cycled non-cracked CL with 18 �m non-einforced membrane under the channel location with DM/MPL.
(m(sbt
wefshlasaLaas1
ig. 19. SEM surface image of F/T cycled non-cracked CL with 35 �m rein-orced membrane under the channel location with DM/MPL.
antly, but could not prevent all interfacial delamination betweenembrane and catalyst layers observed. Interfacial delamination
f CL from membrane and frost heave were observed for thicker35 �m) membranes, cracked catalyst layers and non-reinforcedembrane. However, non-cracked catalyst layers with thinner
18 �m) reinforced membrane showed negligible damage. Ithould also be noted that the membrane cracks or holes seeny other studies [12–14] were not observed for any cases. Theest results are summarized in Table 3.
From SEM images of three different micro-structured MEAsith and without DM/MPL, the extent of damage was differ-
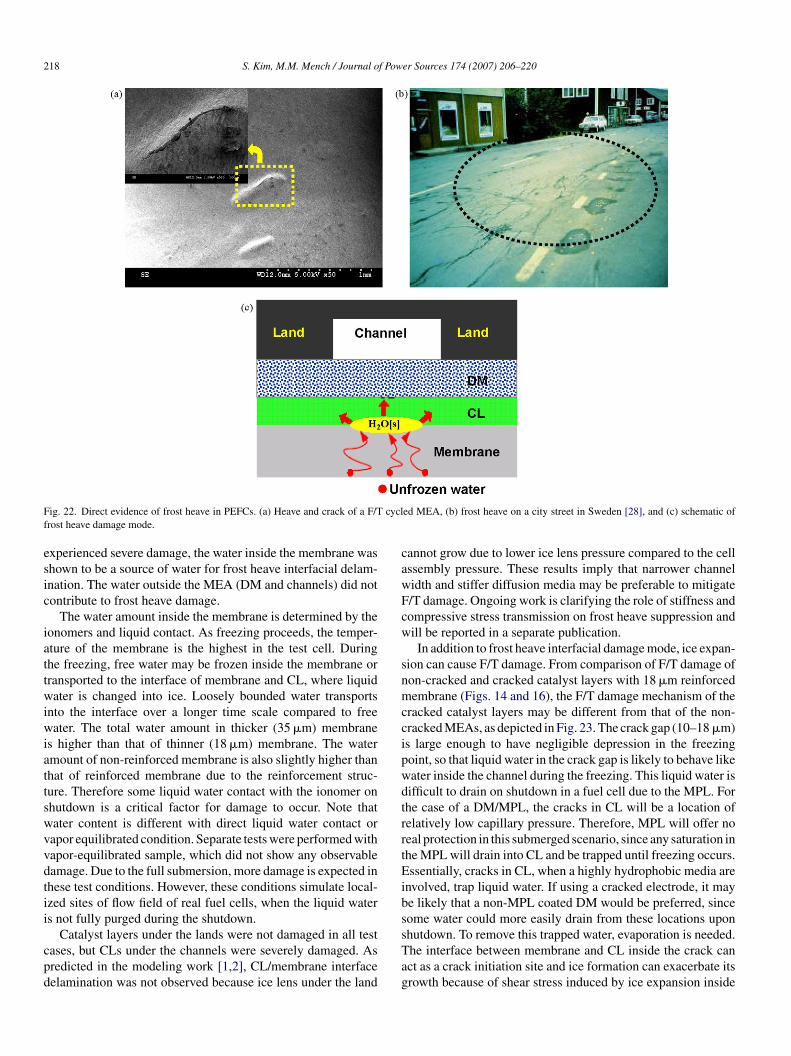
nt, but interfacial delamination (membrane/catalyst layers) androst heaves were common. F/T damage behaviors can be clas-ified into two basic modes: (1) interfacial delamination by frosteave and (2) ice expansion damage. Damage of the catalystayer of MEAs with DM/MPL was similar to frost heave dam-ge in the road surfaces exposed under freezing conditions, ashown in Fig. 22(a) and (b). The schematic of frost heave dam-ge mode proposed for PEFC [1,2] is depicted in Fig. 22(c).iquid water transport rate, heat transfer, residual liquid water,
nd water phase in the fuel cell materials during the freezingre important factors for this damage mode. From compari-on of SEM images of non-cracked MEAs with DM/MPL with8 �m reinforced/non-reinforced and 35 �m reinforced mem-
S. Kim, M.M. Mench / Journal of Power Sources 174 (2007) 206–220 217
F forcedt
bmbef
itetcd
whfw
tCnb
Fm
ig. 20. Cross-sectional images of F/T cycled non-cracked CL with 35 �m reinhe dotted box in (a).
ranes (Figs. 14, 18 and 20), the damage is ascribed to theembrane itself because the only difference was the mem-
rane thickness and reinforcement. The damage mode can bexplained by considering factors of frost heave damage in theollowing ways.
As mentioned in Section 2, heat transfer rate may be a factorn F/T damage, but it is not a factor in this study. In this study,he water content in the ionomers inside CL and membrane wasxpected to have liquid equilibrated water content (λ > 14), as
he MEAs were in direct contact with liquid water in these testonditions. Even if DM/MPL was used, the pressurized con-ition induced during the soaking step at 70 ◦C enabled liquidb1a
ig. 21. Additional SEM surface images from under the channel of thermally frozembrane with DM/MPL: (c) and (d) are magnified images of the dotted box in (a) a
membrane under the channel location with DM/MPL: (b) magnified image of
ater to penetrate into the catalyst layers, because the pressure isigher than the measured breakthrough pressure of about 7 kPagor virgin SGL10BB DM. Thus liquid water saturation in DMas expected to be more 50%.There are two water sources for ice lens growth. One is inside
he MEA, and the other is outside the MEA in the pores of theL and DM. The freezing point depression of diffusion media isegligible, and that of pores in the CL is less than 2 ◦C [23,24],ut water freezing inside the membrane occurs from 0 ◦C to
elow −20 ◦C [4–6]. From the fact that non-cracked CL with8 �m reinforced membrane experienced negligible F/T dam-ge while the non-cracked CL with 35 �m reinforced membraneen cycled (−40 ◦C to 70 ◦C) cycled non-cracked CL with 35 �m reinforcednd (b) each.
218 S. Kim, M.M. Mench / Journal of Power Sources 174 (2007) 206–220
F cyclf
esic
iattwiwiattswvvdtii
cpd
cawFcw
snmccipwdtrrtEibs
ig. 22. Direct evidence of frost heave in PEFCs. (a) Heave and crack of a F/Trost heave damage mode.
xperienced severe damage, the water inside the membrane washown to be a source of water for frost heave interfacial delam-nation. The water outside the MEA (DM and channels) did notontribute to frost heave damage.
The water amount inside the membrane is determined by theonomers and liquid contact. As freezing proceeds, the temper-ture of the membrane is the highest in the test cell. Duringhe freezing, free water may be frozen inside the membrane orransported to the interface of membrane and CL, where liquidater is changed into ice. Loosely bounded water transports
nto the interface over a longer time scale compared to freeater. The total water amount in thicker (35 �m) membrane
s higher than that of thinner (18 �m) membrane. The watermount of non-reinforced membrane is also slightly higher thanhat of reinforced membrane due to the reinforcement struc-ure. Therefore some liquid water contact with the ionomer onhutdown is a critical factor for damage to occur. Note thatater content is different with direct liquid water contact orapor equilibrated condition. Separate tests were performed withapor-equilibrated sample, which did not show any observableamage. Due to the full submersion, more damage is expected inhese test conditions. However, these conditions simulate local-zed sites of flow field of real fuel cells, when the liquid waters not fully purged during the shutdown.
Catalyst layers under the lands were not damaged in all testases, but CLs under the channels were severely damaged. Asredicted in the modeling work [1,2], CL/membrane interfaceelamination was not observed because ice lens under the land
sTag
ed MEA, (b) frost heave on a city street in Sweden [28], and (c) schematic of
annot grow due to lower ice lens pressure compared to the cellssembly pressure. These results imply that narrower channelidth and stiffer diffusion media may be preferable to mitigate/T damage. Ongoing work is clarifying the role of stiffness andompressive stress transmission on frost heave suppression andill be reported in a separate publication.In addition to frost heave interfacial damage mode, ice expan-
ion can cause F/T damage. From comparison of F/T damage ofon-cracked and cracked catalyst layers with 18 �m reinforcedembrane (Figs. 14 and 16), the F/T damage mechanism of the
racked catalyst layers may be different from that of the non-racked MEAs, as depicted in Fig. 23. The crack gap (10–18 �m)s large enough to have negligible depression in the freezingoint, so that liquid water in the crack gap is likely to behave likeater inside the channel during the freezing. This liquid water isifficult to drain on shutdown in a fuel cell due to the MPL. Forhe case of a DM/MPL, the cracks in CL will be a location ofelatively low capillary pressure. Therefore, MPL will offer noeal protection in this submerged scenario, since any saturation inhe MPL will drain into CL and be trapped until freezing occurs.ssentially, cracks in CL, when a highly hydrophobic media are
nvolved, trap liquid water. If using a cracked electrode, it maye likely that a non-MPL coated DM would be preferred, sinceome water could more easily drain from these locations upon
hutdown. To remove this trapped water, evaporation is needed.he interface between membrane and CL inside the crack canct as a crack initiation site and ice formation can exacerbate itsrowth because of shear stress induced by ice expansion inside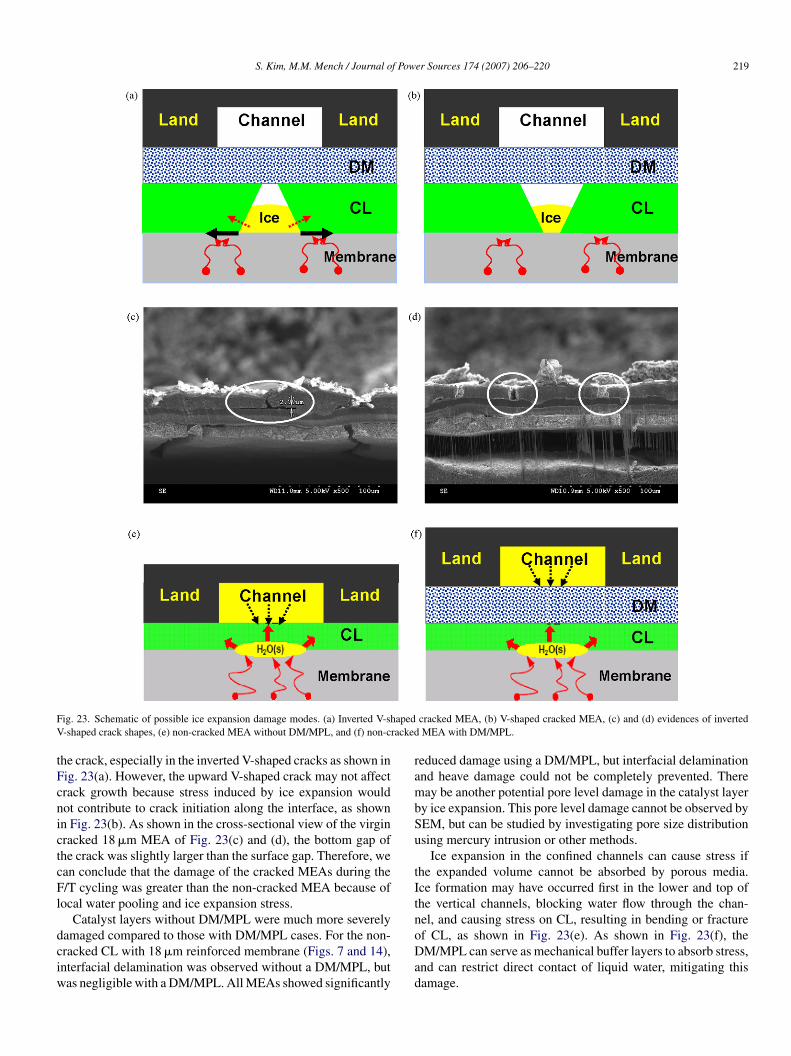
S. Kim, M.M. Mench / Journal of Power Sources 174 (2007) 206–220 219
F apedV racked
tFcnictcFl
dciw
rambSu
tItn
ig. 23. Schematic of possible ice expansion damage modes. (a) Inverted V-sh-shaped crack shapes, (e) non-cracked MEA without DM/MPL, and (f) non-c
he crack, especially in the inverted V-shaped cracks as shown inig. 23(a). However, the upward V-shaped crack may not affectrack growth because stress induced by ice expansion wouldot contribute to crack initiation along the interface, as shownn Fig. 23(b). As shown in the cross-sectional view of the virginracked 18 �m MEA of Fig. 23(c) and (d), the bottom gap ofhe crack was slightly larger than the surface gap. Therefore, wean conclude that the damage of the cracked MEAs during the/T cycling was greater than the non-cracked MEA because of
ocal water pooling and ice expansion stress.Catalyst layers without DM/MPL were much more severely
amaged compared to those with DM/MPL cases. For the non-racked CL with 18 �m reinforced membrane (Figs. 7 and 14),nterfacial delamination was observed without a DM/MPL, butas negligible with a DM/MPL. All MEAs showed significantly
oDad
cracked MEA, (b) V-shaped cracked MEA, (c) and (d) evidences of invertedMEA with DM/MPL.
educed damage using a DM/MPL, but interfacial delaminationnd heave damage could not be completely prevented. Thereay be another potential pore level damage in the catalyst layer
y ice expansion. This pore level damage cannot be observed byEM, but can be studied by investigating pore size distributionsing mercury intrusion or other methods.
Ice expansion in the confined channels can cause stress ifhe expanded volume cannot be absorbed by porous media.ce formation may have occurred first in the lower and top ofhe vertical channels, blocking water flow through the chan-el, and causing stress on CL, resulting in bending or fracture
f CL, as shown in Fig. 23(e). As shown in Fig. 23(f), theM/MPL can serve as mechanical buffer layers to absorb stress,nd can restrict direct contact of liquid water, mitigating thisamage.
2 f Pow
abstbmfnti
ttnatirods
5
ticScaeftotAiflFtmtiaaotwn
A
o
aihtK
R
[
[
[
[
[
[
[
[
[
[
[
[
[
[
[[[[27] S. Cleghorn, J. Kolde, W. Liu, in: W. Vielstich, H.A. Gasteiger, A. Lamm
20 S. Kim, M.M. Mench / Journal o
As shown in the thermal cycling without freezing, line crackslong the channel/land interfaces observed in thicker mem-rane and non-reinforced membrane were attributed to greaterwelling. Increased swelling exacerbates interfacial delamina-ion between membrane and catalyst layers and can accelerateoth F/T damage modes (frost heave and ice expansion). Theechanisms for this occurrence can be ionomer expansion of
rozen water inside the membrane, or ice lens formation, butevertheless the membrane is a source of damage. The thinnerhe membrane, the less the water, and therefore the less damages expected.
It is difficult to quantify the relative level of importance withhe testing done here, but clearly the diffusion media (eitherhrough the stiffness or highly hydrophobic MPL), the thick-ess, the reinforcement, and the initial surface cracks all playn important role in frost heave damage. It should be notedhat the damage from the membrane itself can likely be elim-nated with a purge of the system on shutdown to removeesidual liquid water in contact with the electrolyte. Reductionf the liquid contact with the membrane on shutdown by naturalrainage processes (non-parasitic effects) is a focus of continuedtudy.
. Conclusions
This extensive investigation of ex situ MEAs and DM/MPLesting has revealed very strong direction for the material choicesn the PEFC and helped to conceptually validate the previousomputational model performed of Mench and coworkers [1,2].pecifically, the membrane was found to be a source of water thatan damage the MEA upon thermal cycling to −40 ◦C. Dam-ge was found to occur almost exclusively under the channel,xcept for an along the land interface line crack that developsor non-DM equipped samples immersed in liquid. From the facthat there was no damage under the land in the worst scenariof direct liquid contact with no diffusion media, the channelo land ratio are also important factors in damage mitigation.lthough the larger land can be better for F/T, at a certain point
t would cause dead zones in the center of land and worsenooding in high RH conditions. The preferred material to reduce/T damage is a crack free catalyst layer with low water con-
ent and dimensionally stable membrane, with a stiff diffusionedia. The role of the DM is not yet fully understood. It helps
o provide a stiff boundary to prevent expansion and eliminatingnterfacial gaps which can serve as and a pooling location, ands a hydrophobic barrier to limit water intrusion. However, it canlso detrimentally trap residual liquid water in the catalyst layern shutdown. In order to prevent F/T damage, it is necessary thathe liquid contact with the membrane is reduced or eliminated,hich can be accomplished through a variety of parasitic andon-parasitic approaches beyond the scope of this work.
cknowledgements
This research was supported by the Advanced Technol-gy Center, R&D Division for Hyundai Motor Company. The
[
er Sources 174 (2007) 206–220
uthors are grateful to W.L. Gore and Associates for supply-ng MEA samples and to Dr. S. Cleghorn and Mr. M. Crum forelpful discussions and insight. The authors are also apprecia-ive of Mr. K. Heller’s help to analyze crack density and Dr. E.C.umbur’s measurement of breakthrough pressure.
eferences
[1] S. He, M.M. Mench, J. Electrochem. Soc. 153 (2006) A1724–A1731.[2] S. He, S.H. Kim, M.M. Mench, J. Electrochem. Soc. 154 (2007)
B1024–B1033.[3] US Department of Energy, Hydrogen Fuel Cells and Infrastructure Tech-
nologies Program, 2005. www.eere.energy.gov/hydrogenandfuelcells/mypp/pdfs/fuel cells.pdf.
[4] Y.S. Kim, L. Dong, M.A. Hickner, T.E. Glass, V. Webb, J.E. McGrath,Macromolecules 36 (2003) 6291–6295.
[5] M. Saito, N. Arimura, K. Hayamizu, T. Okada, J. Phys. Chem. B 109 (2005)3112–3119.
[6] A. Siu, J. Schmeisser, S. Holdcroft, J. Phys. Chem. B 110 (2006)6072–6080.
[7] R.C. McDonald, C.K. Mittelsteadt, E.L. Thompson, Fuel Cells 4 (2004)208–213.
[8] Q. Guo, Z. Qi, J. Power Sources 160 (2006) 1269–1274.[9] J. Hou, H. Yu, S. Zhang, S. Sun, H. Wang, B. Yi, P. Ming, J. Power Sources
162 (2006) 513–520.10] E.A. Cho, J.J. Ko, H.Y. Ha, S.A. Hong, K.Y. Lee, T.W. Lim, I.H. Oh, J.
Electrochem. Soc. 151 (2004) A661–A665.11] E.A. Cho, J.J. Ko, H.Y. Ha, S.A. Hong, K.Y. Lee, T.W. Lim, I.H. Oh, J.
Electrochem. Soc. 150 (2003) A1667–A1670.12] R. Gaylord, Stationary application and freeze/thaw, Presented at US Depart-
ment of Energy, Workshop on Fuel Cell Operations at Sub-FreezingTemperatures, Washington DC, 2005.
13] J.P. Meyers, Fundamental issues in subzero PEMFC startup and operation,Presented at US Department of Energy, Workshop on Fuel Cell Operationsat Sub-Freezing Temperatures, Washington DC, 2005.
14] Q. Yan, H. Toghiani, Y. Lee, K. Liang, H. Causey, J. Power Sources 160(2006) 1242–1250.
15] M.S. Wilson, J.A. Valerio, S. Gottesfeld, Electrochim. Acta 40 (1995)355–363.
16] R. Mukundan, Y.S. Kim, F. Garzon, B. Pivovar, ECS Trans. 1 (2006)403–413.
17] R. Mukundan, Y.S. Kim, F. Garzon, B. Pivovar, DOE Hydrogen ProgramAnnual Progress Report, 2006, pp. 926–929.
18] H. Liu, Dimensionally stable high performance membrane, Presented at USDepartment of Energy, Hydrogen Program Annual Merit Review Work-shop, Washington DC, 2006.
19] T. Patterson, R. Balliet, DOE Hydrogen Program Annual Progress Report,2006, pp. 910–912.
20] T. Patterson and J.P. Meyers, PEM fuel cell freeze durability and cold startproject, Presented at US Department of Energy, Hydrogen Program AnnualMerit Review Workshop, Washington DC, 2006.
21] M. Oszcipok, D. Riemann, U. Kronenwett, M. Kreideweis, M. Zedda, J.Power Sources 145 (2005) 407–515.
22] M. Oszcipok, M. Zedda, D. Riemann, D. Geckeler, J. Power Sources 154(2006) 404–411.
23] S. Ge, C.Y. Wang, Electrochem. Solid State Lett. 9 (2006) A499–A503.
24] S. Ge, C.Y. Wang, Electrochim. Acta 52 (2007) 4825–4835.25] E.C. Kumbur, K.V. Sharp, M.M. Mench, J. Electrochem. Soc., in press.26] http://rsb.info.nih.gov/ij/.
(Eds.), Handbook of Fuel Cells, Fundamentals, Technology and Applica-tions, 566, John Wiley & Sons, New York, 2003.
28] http://training.ce.washington.edu/WSDOT/Modules/04 design parameters/04-4 body.htm#thaw weakening.
Copyright © 2022 FDOKUMEN