SOLID FOODS FREEZE-DRYING SIMULATION AND EXPERIMENTAL DATA
26
Journal of Food Process Engineering 28 (2005) 107–132. All Rights Reserved. © Copyright 2005, Blackwell Publishing 107 SOLID FOODS FREEZE-DRYING SIMULATION AND EXPERIMENTAL DATA S. KHALLOUFI 1 , J.-L. ROBERT 2 and C. RATTI 1,3 1 Soils Science and Agri-Food Engineering Department 2 Civil Engineering Department Laval University Sainte-Foy G1K 7P4 QC Canada Accepted for Publication June 6, 2004 ABSTRACT This article presents a mathematical model describing the unsteady heat and mass transfer during the freeze drying of biological materials. The model was built from the mass and energy balances in the dried and frozen regions of the material undergoing freeze drying. A set of coupled nonlinear partial differential equations permitted the description of the temperature and pres- sure profiles, together with the position of the sublimation interface. These equations were transformed to a finite element scheme and numerically solved using the Newton-Raphson approach to represent the nonlinear problem and the interface position. Most parameters involved in the model (i.e., thermal conductivity, specific heat, density, heat and mass transfer coefficients etc.) were obtained from experimental data cited in the literature. The dehydration kinetics and the temperature profiles of potato and apple slabs were experi- mentally determined during freeze drying. The simulation results agreed closely with the water content experimental data. The prediction of tempera- ture profiles within the solid was, however, less accurate. INTRODUCTION Freeze drying is a dehydration process where water vapor is removed by sublimation from frozen materials, usually under conditions of low pressure and temperature. The advantage of this process is mainly related to the high final quality of products (Mellor 1978; Sagara and Ichiba 1994; Krokida and Maroulis 1997). This attribute is due to two main characteristics of freeze Blackwell Science, LtdOxford, UKJFPEJournal of Food Process Engineering0145-8876Copyright 2005 by Food & Nutrition Press, Inc., Trumbull, Connecticut.282107132Original Article FREEZE-DRYING SIMULATIONS. KHALLOUFI, J.-L. ROBERT and C. RATTI 3 Corresponding author. TEL: 418-656-2131 # 4593; FAX: 418-656-3723; EMAIL: [email protected]
-
Upload
independent -
Category
Documents
-
view
1 -
download
0
Transcript of SOLID FOODS FREEZE-DRYING SIMULATION AND EXPERIMENTAL DATA
Journal of Food Process Engineering
28
(2005) 107–132.
All Rights Reserved.
©
Copyright 2005, Blackwell Publishing
107
SOLID FOODS FREEZE-DRYING SIMULATION AND EXPERIMENTAL DATA
S. KHALLOUFI
1
, J.-L. ROBERT
2
and C. RATTI
1,3
1
Soils Science and Agri-Food Engineering Department
2
Civil Engineering DepartmentLaval University
Sainte-Foy G1K 7P4QC Canada
Accepted for Publication June 6, 2004
ABSTRACT
This article presents a mathematical model describing the unsteady heatand mass transfer during the freeze drying of biological materials. The modelwas built from the mass and energy balances in the dried and frozen regionsof the material undergoing freeze drying. A set of coupled nonlinear partialdifferential equations permitted the description of the temperature and pres-sure profiles, together with the position of the sublimation interface. Theseequations were transformed to a finite element scheme and numerically solvedusing the Newton-Raphson approach to represent the nonlinear problem andthe interface position. Most parameters involved in the model (i.e., thermalconductivity, specific heat, density, heat and mass transfer coefficients etc.)were obtained from experimental data cited in the literature. The dehydrationkinetics and the temperature profiles of potato and apple slabs were experi-mentally determined during freeze drying. The simulation results agreedclosely with the water content experimental data. The prediction of tempera-ture profiles within the solid was, however, less accurate.
INTRODUCTION
Freeze drying is a dehydration process where water vapor is removed bysublimation from frozen materials, usually under conditions of low pressureand temperature. The advantage of this process is mainly related to the highfinal quality of products (Mellor 1978; Sagara and Ichiba 1994; Krokida andMaroulis 1997). This attribute is due to two main characteristics of freeze
Blackwell Science, LtdOxford, UKJFPEJournal of Food Process Engineering0145-8876Copyright 2005 by Food & Nutrition Press, Inc., Trumbull, Connecticut.282107132Original Article
FREEZE-DRYING SIMULATIONS. KHALLOUFI,
J.-L. ROBERT and C. RATTI
3
Corresponding author. TEL: 418-656-2131 # 4593; FAX: 418-656-3723; EMAIL:[email protected]
108 S. KHALLOUFI, J.-L. ROBERT and C. RATTI
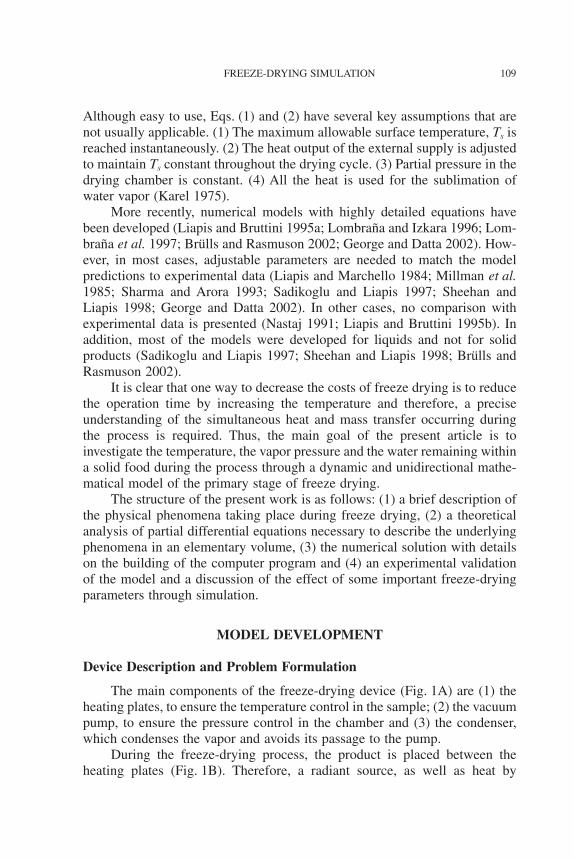
drying: (1) Water, representing more than 80% of food products, is frozen andtherefore cannot serve as a solvent reactant throughout the sublimationprocess; (2) Process temperatures are low (product temperatures are between
-
40 to
-
20C during sublimation and final temperatures, in the range of20–50C, depending on the heating plate temperature), so the deteriorationreactions (i.e., nonenzymatic reactions) are slow or are completely stoppedbecause of weak rate constant (Cheftel
et al.
1977).Despite the excellent quality of final products, the cost of the freeze-
drying process is fairly expensive (Lombraña
et al.
1997; Sadikoglu
et al.
1998) and its applicability remains mainly reserved to products of high marketvalue such as pharmaceutical products and some special foods (nutraceutical,baby foods, spices and coffee). This major disadvantage of freeze drying isdirectly related to the long processing times caused by the high materialresistance to heat transfer during the operation (Sagara and Ichiba 1994; Kuu
et al.
1995), the sample configuration, its own properties and the operatingconditions. In addition, the condenser temperature and the vacuum levelshould be maintained at their lowest values during the freeze-drying process.Energy constitutes a major cost factor, which is composed of the energynecessary for sublimation and desorption as well as the energy to supportvacuum and refrigeration.
An important part of previous investigations aimed to reduce freeze-drying times and consequently to lower the energy consumption, analyzingthe possibilities of controlling the heat intensity and the vacuum pressure andtherefore investigating possible ways of optimizing the freeze-drying pro-cess. Several studies were carried out in laboratories and in pilot scale plants(Sagara and Ichiba 1994; Kuu
et al.
1995; Liapis
et al.
1996). Simulation wasalso used as a preliminary tool for the evaluation of the freeze-drying pro-cess. Several theoretical models concerning the heat and mass transferphenomena during freeze drying can be found in the literature (Karel 1975;Mellor 1978; Liapis and Bruttini 1995a; Lombraña and Izkara 1996;Lombraña
et al.
1997).One of the earliest and most known models is that for solids with heat
and mass transfer through the dry layer (Karel 1975):
(1)
which, because of simultaneous heat and mass transfer process, is equivalentto:
(2)
tL m X X
Per P Ps f
i s
=-( )
-( )
2
8
r o
tL m X X
k T Ts f
d s i
=-( )
-( )
2
8
r o
FREEZE-DRYING SIMULATION 109
Although easy to use, Eqs. (1) and (2) have several key assumptions that arenot usually applicable. (1) The maximum allowable surface temperature,
T
s
isreached instantaneously. (2) The heat output of the external supply is adjustedto maintain
T
s
constant throughout the drying cycle. (3) Partial pressure in thedrying chamber is constant. (4) All the heat is used for the sublimation ofwater vapor (Karel 1975).
More recently, numerical models with highly detailed equations havebeen developed (Liapis and Bruttini 1995a; Lombraña and Izkara 1996; Lom-braña
et al.
1997; Brülls and Rasmuson 2002; George and Datta 2002). How-ever, in most cases, adjustable parameters are needed to match the modelpredictions to experimental data (Liapis and Marchello 1984; Millman
et al.
1985; Sharma and Arora 1993; Sadikoglu and Liapis 1997; Sheehan andLiapis 1998; George and Datta 2002). In other cases, no comparison withexperimental data is presented (Nastaj 1991; Liapis and Bruttini 1995b). Inaddition, most of the models were developed for liquids and not for solidproducts (Sadikoglu and Liapis 1997; Sheehan and Liapis 1998; Brülls andRasmuson 2002).
It is clear that one way to decrease the costs of freeze drying is to reducethe operation time by increasing the temperature and therefore, a preciseunderstanding of the simultaneous heat and mass transfer occurring duringthe process is required. Thus, the main goal of the present article is toinvestigate the temperature, the vapor pressure and the water remaining withina solid food during the process through a dynamic and unidirectional mathe-matical model of the primary stage of freeze drying.
The structure of the present work is as follows: (1) a brief description ofthe physical phenomena taking place during freeze drying, (2) a theoreticalanalysis of partial differential equations necessary to describe the underlyingphenomena in an elementary volume, (3) the numerical solution with detailson the building of the computer program and (4) an experimental validationof the model and a discussion of the effect of some important freeze-dryingparameters through simulation.
MODEL DEVELOPMENT
Device Description and Problem Formulation
The main components of the freeze-drying device (Fig. 1A) are (1) theheating plates, to ensure the temperature control in the sample; (2) the vacuumpump, to ensure the pressure control in the chamber and (3) the condenser,which condenses the vapor and avoids its passage to the pump.
During the freeze-drying process, the product is placed between theheating plates (Fig. 1B). Therefore, a radiant source, as well as heat by
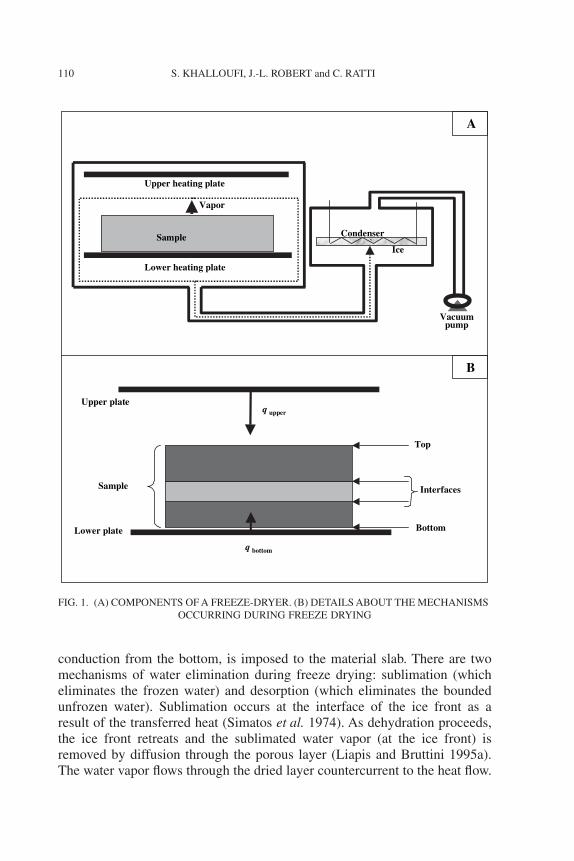
110 S. KHALLOUFI, J.-L. ROBERT and C. RATTI
conduction from the bottom, is imposed to the material slab. There are twomechanisms of water elimination during freeze drying: sublimation (whicheliminates the frozen water) and desorption (which eliminates the boundedunfrozen water). Sublimation occurs at the interface of the ice front as aresult of the transferred heat (Simatos
et al.
1974). As dehydration proceeds,the ice front retreats and the sublimated water vapor (at the ice front) isremoved by diffusion through the porous layer (Liapis and Bruttini 1995a).The water vapor flows through the dried layer countercurrent to the heat flow.
FIG. 1. (A) COMPONENTS OF A FREEZE-DRYER. (B) DETAILS ABOUT THE MECHANISMS OCCURRING DURING FREEZE DRYING
` Sample Condenser
Upper heating plate
Lower heating plate
Vapor
Ice
Vacuumpump
A
Top
Bottom
Sample
q upper
q bottom
Lower plate
Interfaces
Upper plate
B
FREEZE-DRYING SIMULATION 111
Then, it passes through the chamber to be finally collected on the condenserplate.
Theoretical Analysis and Governing Equations
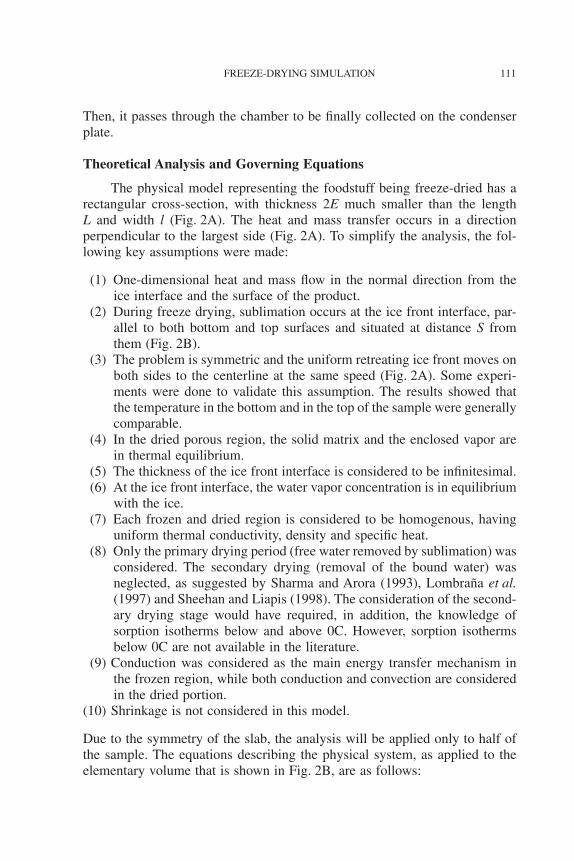
The physical model representing the foodstuff being freeze-dried has arectangular cross-section, with thickness 2
E
much smaller than the length
L
and width
l
(Fig. 2A). The heat and mass transfer occurs in a directionperpendicular to the largest side (Fig. 2A). To simplify the analysis, the fol-lowing key assumptions were made:
(1) One-dimensional heat and mass flow in the normal direction from theice interface and the surface of the product.
(2) During freeze drying, sublimation occurs at the ice front interface, par-allel to both bottom and top surfaces and situated at distance
S
fromthem (Fig. 2B).
(3) The problem is symmetric and the uniform retreating ice front moves onboth sides to the centerline at the same speed (Fig. 2A). Some experi-ments were done to validate this assumption. The results showed thatthe temperature in the bottom and in the top of the sample were generallycomparable.
(4) In the dried porous region, the solid matrix and the enclosed vapor arein thermal equilibrium.
(5) The thickness of the ice front interface is considered to be infinitesimal.(6) At the ice front interface, the water vapor concentration is in equilibrium
with the ice.(7) Each frozen and dried region is considered to be homogenous, having
uniform thermal conductivity, density and specific heat.(8) Only the primary drying period (free water removed by sublimation) was
considered. The secondary drying (removal of the bound water) wasneglected, as suggested by Sharma and Arora (1993), Lombraña
et al.
(1997) and Sheehan and Liapis (1998). The consideration of the second-ary drying stage would have required, in addition, the knowledge ofsorption isotherms below and above 0C. However, sorption isothermsbelow 0C are not available in the literature.
(9) Conduction was considered as the main energy transfer mechanism inthe frozen region, while both conduction and convection are consideredin the dried portion.
(10) Shrinkage is not considered in this model.
Due to the symmetry of the slab, the analysis will be applied only to half ofthe sample. The equations describing the physical system, as applied to theelementary volume that is shown in Fig. 2B, are as follows:
112 S. KHALLOUFI, J.-L. ROBERT and C. RATTI
Dried Layer
(a) Temperature profile. The complete energy balance presented bySadikoglu and Liapis (1997) for the tray freeze-drying process was applied tothe freeze drying of a food slab under vacuum (the inert gas flow is negligible).
FIG. 2. (A) GEOMETRICAL DIMENSIONS. (B) DISCRETIZATION USED IN THE NUMERICAL SOLUTION
E
a
Fr
E
0
dxd
dxf
qxd
mxd+dxd
qxf
qxf+dxf
mxd
qxd+dxd
b
Ey
zx
A
L
l
Frozenzone
S (t )
E
0
dxd
dxf
qxd
mxd+dxd
qxf
qxf+dxf
mxd
qxd+dxd
Driedzone
qxd
mxd+dxd
qxf
qxf+dxf
mxd
qxd+dxd
B
FREEZE-DRYING SIMULATION 113
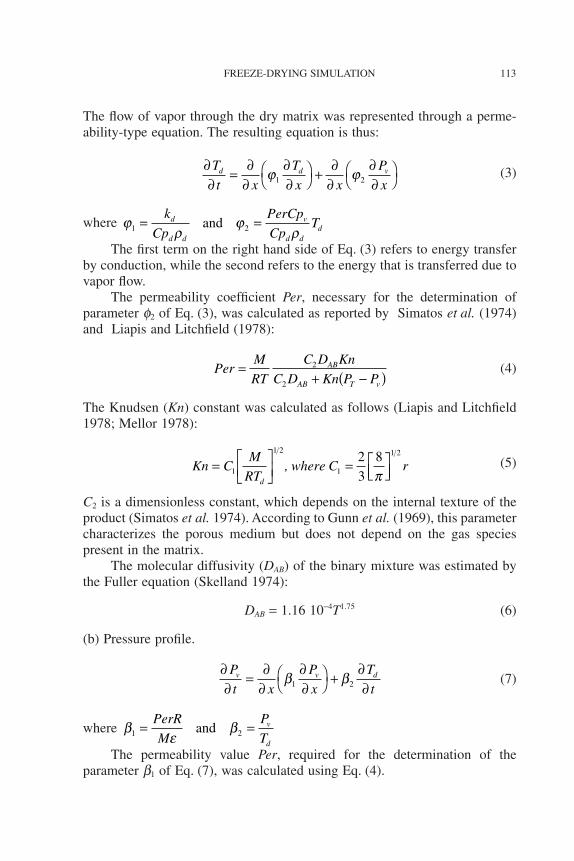
The flow of vapor through the dry matrix was represented through a perme-ability-type equation. The resulting equation is thus:
(3)
where
The first term on the right hand side of Eq. (3) refers to energy transferby conduction, while the second refers to the energy that is transferred due tovapor flow.
The permeability coefficient
Per
, necessary for the determination ofparameter
f
2
of Eq. (3), was calculated as reported by Simatos
et al.
(1974)and Liapis and Litchfield (1978):
(4)
The Knudsen (
Kn
) constant was calculated as follows (Liapis and Litchfield1978; Mellor 1978):
(5)
C
2
is a dimensionless constant, which depends on the internal texture of theproduct (Simatos
et al.
1974). According to Gunn
et al.
(1969), this parametercharacterizes the porous medium but does not depend on the gas speciespresent in the matrix.
The molecular diffusivity (
D
AB
) of the binary mixture was estimated bythe Fuller equation (Skelland 1974):
D
AB
=
1.16 10
-
4
T
1.75
(6)
(b) Pressure profile.
(7)
where
The permeability value
Per
, required for the determination of theparameter
b
1
of Eq. (7), was calculated using Eq. (4).
∂∂
=∂
∂∂∂
ÊË
ˆ¯ +
∂∂
∂∂
ÊË
ˆ¯
T
t x
T
x x
P
xd d vj j1 2
jr
jr1 2= =
k
Cp
PerCp
CpTd
d d
v
d ddand
PerM
RT
C D Kn
C D Kn P PAB
AB T v
=+ -( )2
2
Kn CM
RTwhere C r
d
= ÈÎÍ
˘˚̇
= ÈÎÍ
˘˚̇1
1 2
1
1 22
3
8,
p
∂∂
=∂
∂∂∂
ÊË
ˆ¯ +
∂∂
P
t x
P
x
T
tv v db b1 2
be
b1 2= =PerR
M
P
Tv
d
and
114 S. KHALLOUFI, J.-L. ROBERT and C. RATTI
Frozen Layer
In the frozen region, there is only heat transfer by conduction. Thus, thetemperature profile is represented by the following differential expression:
(8)
where
Boundary Conditions
At the surface,
¥
=
0
(a) Temperature. The boundary condition at the material surface can bedescribed by:
(9)
where
h
T
is the heat transfer coefficient. Two heat transfer coefficients wereconsidered for the simulations:
(1) one was obtained from the following theoretical expression:
(10)
where
s
is the Stefan-Boltzmann constant and
F
is the radiation viewfactor.
(2) another was an experimental heat transfer coefficient, which was reportedby Wang and Shi (1997, 1998).
(b) Pressure. A convection resistance coefficient (
h
P
), which depends on thetotal pressure (Lombraña and Izkara 1996), was considered for mass transferat the surface:
(11)
At the interface,
¥
=
S
(
t
)
S(t)
represents the interface position of the sublimation front, whichdepends on time. At this position, an additional equation was obtained fromthe energy balance on a differential element of thickness
dS
:
∂∂
=∂∂
∂∂
ÊË
ˆ¯
T
t
T
x
T
xf f fw
wr
=k
Cpf
f f
kT
xh T T td
dT d
∂∂
= - - [ ]( )• 0,
h F T T t T T tT d d= + [ ]( ) + [ ]( )• •s 2 2 0 0, ,
PerP
xh P P tv
T v
∂∂
= - [ ]( )• 0,
FREEZE-DRYING SIMULATION 115
(12)
The term on the left-hand side corresponds to the latent heat of sublimation.The right-hand side terms are the conductive heat fluxes in and out of thedifferential element. The mass flux of sublimated vapor can be expressed asfollows:
(13)
There should be no discontinuity in temperature at the interface (
S
[
t
]), thus:
(14)
For vapor pressure calculation, the thermodynamic equilibrium existingbetween the water vapor and the frozen product. was used at the interface(Clapeyron equation):
(15)
At the center,
¥
=
E
At the matrix center, because of the symmetry, adiabatic or zero heat fluxcondition can be supposed.
(16)
Initial Conditions
Uniform temperature and vapor pressure are chosen as initial conditions,thus:
0
<
x
<
E T(x,0) = Tini (17)
0 < x < S(0) P(x,0) = Pini (18)
Calculation of Water Remaining
(a) Initial water. The initial water, (X0) existing in the matrix before freezedrying, is:
(19)
(b) Sublimated water. The sublimated water represents the frozen water thatis eliminated from the matrix at each moment. This amount depends on theposition of the interface and can be expressed by:
DH m kT
xk
T
xdd
sf
f
ssub sub = -
∂∂
˘˚̇
+∂∂
˘˚̇
m WC FFdS
dtfsub = r
T Td S t f S t( ) ( )=
P AB
Tv S tS t
( )( )
= +ÊËÁ
ˆ¯̃
exp
∂∂
=T
xf 0
X WC Vf T0 = r
116 S. KHALLOUFI, J.-L. ROBERT and C. RATTI
(20)
(c) Remaining water. The amount of remaining water (Xr) is the sum of thefrozen water that has not been sublimated yet and the bound water, therefore:
(21)
The progress of remaining water can be followed by its comparison to theinitial water content (water remaining/initial water content, %):
(22)
MATERIALS AND METHODS
Experimental Data
Slabs (14-mm and 8-mm thickness) of potato and apple were chosen forfreeze-drying kinetic experiments. The samples were frozen in a medicalfreezer at -40C (Sanyo MDF-235, Japan) and freeze-dried in a Unitop 400 L(Virtis, NY) drying chamber connected to freezemobile 25 EL (Virtis). Thefrozen samples were placed on the freeze-dryer shelf, initially at -40C. Whenthe condenser temperature was less than -85C, the vacuum pump was turnedon. The heating system (1C/min) was started after the total pressure was lessthan 10 mtorr. The shelf temperature was set at 40C. Each experimentaldetermination of water content, after different process times, was done inde-pendently from the others. At the initial time, the 8- or 14-mm-thick food slabwas weighed and introduced into the freeze drier. It was left inside the freezedrier for a predetermined process time (1–8, 10, 12, 14 or 16 h) and then itwas removed and weighed. Then the experiment started all over again foranother predetermined process time. The experimental data for each processtime and for the slab thickness was obtained in triplicate. The maximumprocess times were 8 and 16 h for an 8-mm or 14-mm-thick slab, respectively.
The duration of the freeze drying was calculated from the momentwhen the heating system was started. To calculate the amount of water thatwas eliminated, the samples were weighed using a Mettler Toledo balance(PB 1502, ±0.01 g, Switzerland) before and after the freeze-drying opera-tion. Once freeze drying ended, the dry matter of each sample was deter-mined in a vacuum oven. The moisture contents of the samples wereestimated from the differences between the final freeze-dried weight and thedry matter. A comparison of the experimental data with the simulationresults was done using the ratio percentage Xr(t)/X0 (water remaining/initialwater content, %).
m t WC FF l L S tfsub( ) = ( )r
X t WC L l E FF S tr f( ) = - ( )( )r
X t
X
S t
EFFr
( )( ) = -
( )ÈÎÍ
˘˚̇
0
100 1%
FREEZE-DRYING SIMULATION 117
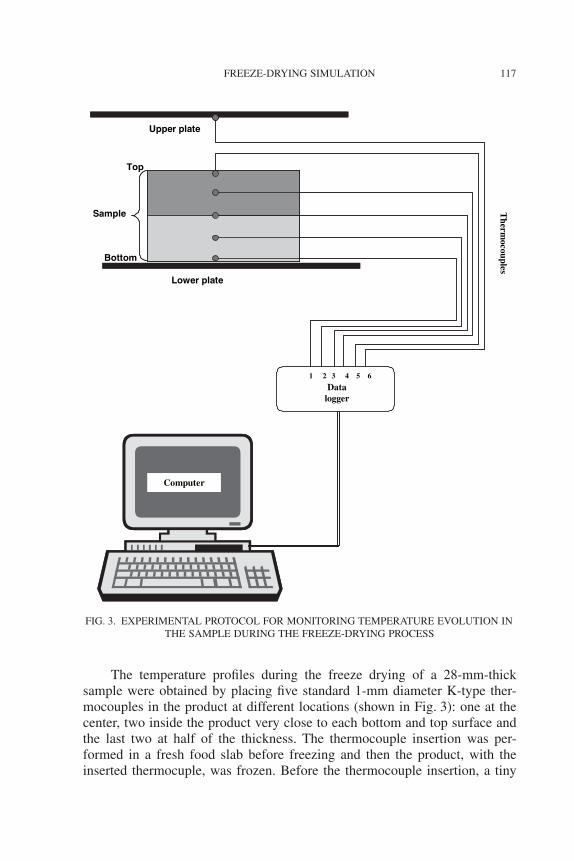
The temperature profiles during the freeze drying of a 28-mm-thicksample were obtained by placing five standard 1-mm diameter K-type ther-mocouples in the product at different locations (shown in Fig. 3): one at thecenter, two inside the product very close to each bottom and top surface andthe last two at half of the thickness. The thermocouple insertion was per-formed in a fresh food slab before freezing and then the product, with theinserted thermocuple, was frozen. Before the thermocouple insertion, a tiny
FIG. 3. EXPERIMENTAL PROTOCOL FOR MONITORING TEMPERATURE EVOLUTION IN THE SAMPLE DURING THE FREEZE-DRYING PROCESS
Bottom
Sample
Lower plate
Upper plate
Top
1 2 3 4 5 6
DataLogger
Therm
ocouples
Computer
1 2 3 4 5 6
Datalogger
Computer

118 S. KHALLOUFI, J.-L. ROBERT and C. RATTI
needle was inserted in the product where the thermocouple was to be placed(to serve as a guide in order to ease the thermocouple insertion) up to theposition where the thermocouple was supposed to be (i.e., 7 mm for themeasurement of the center temperature in a 14-mm-thick slab) and then adetermined length of the thermocouple was inserted. The placements of thethermocouples were supposed to be the length up to where the needle guidewas inserted. All measures of position and distances were determined by usinga micrometer Digimatic (CD 6 B, Mitutoyo Corporation, Japan). Duringfreeze drying, temperature variations were recorded by a digital data logger(21X Micrologger, Campbell Scientific Inc., UT), which was directly pluggedto the computer. The temperature acquisition was done at 1-min intervals.
Numerical Solution
To obtain a finite element (characterized by two node linear 1D element)form of the governing Eqs. (3), (7), (8) and (12), each region (frozen anddried) was divided into n elements of thickness dxd and dxf (Fig. 2B). Eqs. (3),(7) and (8) can be organized in a matrix form (Eq. 23):
(23)
The application of the finite element method transforms the matrices m andk into discrete forms, whose size depends on the number of elements chosen.Then an implicit Euler time marching method is applied, in which the non-linearity is treated by a Newton-Raphson method. Eventually, the condition(14) is applied (Eq. 24):
(24)
where DFd and DFf are the discrete variable increment vectors (Td and Pd forthe dried part and Tf for the frozen part), DTi is the increment of the commontemperature of the dried and frozen parts, Rd and Rf are the residuals, Kd andKf are matrices obtained from m and k. Originally, the sizes of the matriceswere (n + 1) ¥ (n + 1) and (l + 1) ¥ (l + 1). By the introduction of thecondition (14), the last temperature equation of Kd and the first of Kf are
1 0
1 02
1 2
1-
∂
∂∂
Ï
ÌÔ
ÓÔ
¸
˝Ô
˛Ô
=
∂∂
∂∂
ÊË
ˆ¯
∂∂
∂∂
ÊË
ˆ¯
∂∂
∂∂
ÊË
ˆ¯
È
Î
ÍÍÍ
˘
˚
˙˙˙
ÏÌÓ
¸˝˛b
j j
bm
d
v
k
d
v
T
dt
P
t
x x x x
x x
T
P124 34
1 244444 344444
K K
K K
K K
T
Rr n
k n n
d n n d n n l
d n f l
l n f l f l l
d n
i
f l
d n
d
d
[ ] { } [ ]
Ò · Ò ·[ ] { } [ ]
È
Î
ÍÍÍ
˘
˚
˙˙˙
{ }
{ }
Ï
ÌÔ
ÓÔ
¸
˝Ô
˛Ô
= -
{ }+( )
+ +
¥ ¥ ¥
¥ ¥
¥ ¥ ¥
¥
¥
¥1
1 1
1
1
1
10
0
0
1
1 1
DFD
DF,(( )
-( )
( )
{ }
Ï
ÌÔÔ
ÓÔÔ
¸
˝ÔÔ
˛ÔÔ
¥
r
k
R
f
f
f l
1
1 1
1
,
FREEZE-DRYING SIMULATION 119
combined to give the central equation of the system (24), which ensures thecoupling of the system. Indeed, the matrix system allows calculating thevariation of the two parameters (DT and DPv) at a given node as a function ofthe temperature and the vapor pressure values at the same node and at theneighborhood nodes.
A computer program was developed in Matlab 5.2 based on the previ-ously described numerical scheme. The program calculates for each value oftime, the temperature and vapor pressure spatial distributions, their averagevalues as well as the ice front position. It also calculates the instantaneous andthe cumulative values of the sublimating water. The specific heat, thermalconductivity, density and porosity of the complete physical model were con-sidered constant, but the developed numerical scheme could be easily adaptedto use complex expressions involving temperature, pressure- and/or humidity-dependent terms.
The knowledge of the interface position S(t) has a fundamental impor-tance in solving the freeze-drying problem. Since this position recedes con-tinuously, it adds additional calculations and complexity to the problem.Equation 13 was used to calculate the interface position at each time step (Dt).For this, the program considers the S value as a variable and its calculation isdone by iteration using the Newton Raphson method. This method was chosenupon the more traditional methods of evaluating S because it avoids interpo-lation without increasing the running time.
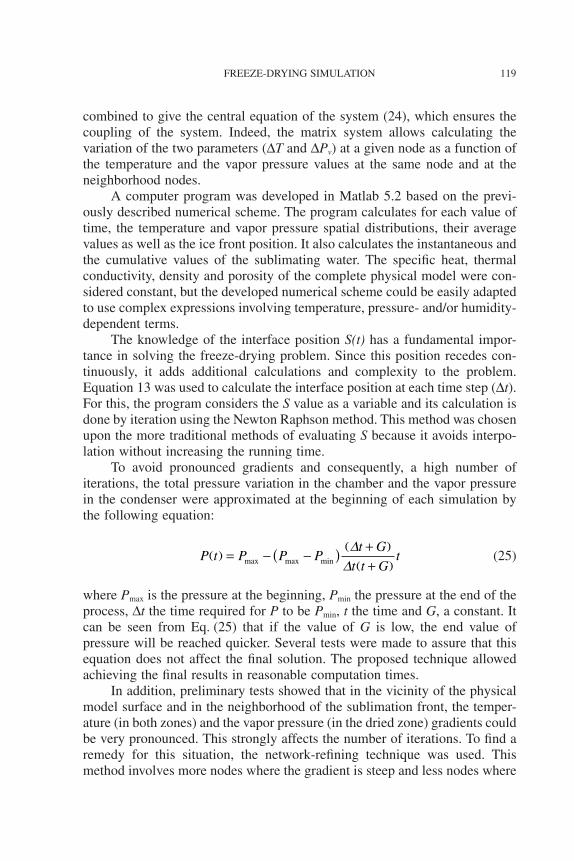
To avoid pronounced gradients and consequently, a high number ofiterations, the total pressure variation in the chamber and the vapor pressurein the condenser were approximated at the beginning of each simulation bythe following equation:
(25)
where Pmax is the pressure at the beginning, Pmin the pressure at the end of theprocess, Dt the time required for P to be Pmin, t the time and G, a constant. Itcan be seen from Eq. (25) that if the value of G is low, the end value ofpressure will be reached quicker. Several tests were made to assure that thisequation does not affect the final solution. The proposed technique allowedachieving the final results in reasonable computation times.
In addition, preliminary tests showed that in the vicinity of the physicalmodel surface and in the neighborhood of the sublimation front, the temper-ature (in both zones) and the vapor pressure (in the dried zone) gradients couldbe very pronounced. This strongly affects the number of iterations. To find aremedy for this situation, the network-refining technique was used. Thismethod involves more nodes where the gradient is steep and less nodes where
P t P P Pt G
t t Gt( ) = - -( ) +( )
+( )max max min
DD
120 S. KHALLOUFI, J.-L. ROBERT and C. RATTI
the gradient is flat, through an exponential function. Therefore, the networkwas refined at each small displacement of the sublimation front.
Even if an implicit scheme was used to solve the coupled equations(temperature and vapor pressure), the numerical solution stability was foundto be strongly dependent on initial conditions and particularly on the choiceof time step (Dt). To avoid the divergence of the solution, the time step (Dt)was continuously adjusted while running the program. After each solution,the Dt was reevaluated as a function of the number of iterations (from an initial0.01 s step up to 100 s or more) without affecting the solution convergence.
To be able to start the numerical calculation, an arbitrary initial thicknessof the dried layer was chosen (0.5% of the slab thickness), thus:
S(0) = 0.01E (26)
This initial thickness of dry layer should be considered as formed during thestart-up of the process before energy is supplied to the sample. This periodrepresents the time required for passing from the atmospheric to the vacuumpressure.
Physical Properties and Other Parameters
Table 1 shows all the parameters and expressions for physical propertiesused for the simulations, obtained from published values of similar materialsin the literature. It should be signaled, however, that some parameters such asC2 (see Eq. 4) were not easily available in the literature and, in addition,physical properties generally depend on the product composition, the freeze-drying device and on operating conditions. Therefore, the value C2 was esti-mated through preliminary simulations. The final values of permeability thatwere obtained using Eq. (4) for the two products (apple and potato) werefound to fall within the range of those reported by Kessler (1981) for somefood products, corroborating the predictions done on C2.
RESULTS AND DISCUSSION
Comparison with Experimental Results
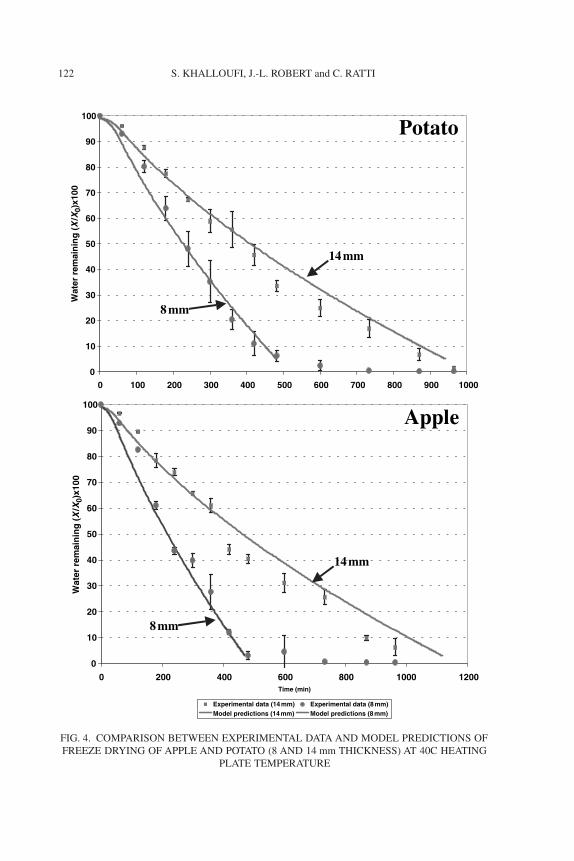
Figure 4 shows the experimental freeze-drying curves for 14- and 8-mm-thick apple and potato slabs at 40C. As expected, the effect of thickness onthe freeze-drying time was marked. Indeed, the sublimation of 50% of the icein the apple requires about 240 min if the thickness is 8 mm and about 400 minfor 14-mm thickness. As can be seen, freeze-drying times did not vary withthe square of the thickness. Other authors previously found a linear relation-

FREEZE-DRYING SIMULATION 121
TAB
LE
1.
PAR
AM
ET
ER
S A
ND
PH
YSI
CA
L P
RO
PER
TIE
S U
SED
FO
R S
IMU
LA
TIO
N
Par
amet
ers
Pota
toA
pple
Val
ues
Ref
eren
ces
Val
ues
Ref
eren
ces
r f (
kg/m
3 )10
22K
err
et a
l. (1
996)
787.
93K
hallo
ufi a
nd R
atti
(200
2)C
p f (
J/kg
K)
1.8
¥ 10
3L
ewis
(19
87)
2.84
¥ 1
03R
ao a
nd R
izvi
(19
95)
Kf (
W/m
.K)
1.09
Muj
umda
r (1
995)
1.28
9R
ao a
nd R
izvi
(19
95)
r d (
kg/m
3 )18
0K
roki
da a
nd M
arou
lis (
1997
)12
3.17
Kha
lloufi
and
Rat
ti (2
002)
Cp d
(J/k
gK)
1.66
¥ 1
03a
= 1.
35 ¥
10-7
. Kos
taro
poul
os a
nd S
arav
acos
(19
97)
a =
1.65
¥ 1
0-7K
osta
ropo
ulos
and
Sar
avac
os (
1997
)K
d(W
/m.K
)0.
0404
Kes
sler
(19
75)
0.03
37K
essl
er (
1981
)Œ
(%
)88
Kro
kida
and
Mar
oulis
(19
97)
90K
hallo
ufi a
nd R
atti
(200
2)F
F (
g/g)
4R
ao a
nd R
izvi
(19
95)
5R
ao a
nd R
izvi
(19
95)
WC
(g/
g)78
.62
Det
erm
ined
for
thi
s st
udy
84.3
6D
eter
min
ed f
or t
his
stud
yr
(m)
48 ¥
10-6
Est
imat
ed43
¥ 1
0-6M
ello
r (1
978)
C2
(dim
ensi
onle
ss)
0.07
Det
erm
ined
in
orde
r to
obt
aine
d th
e va
lue
ofpe
rmea
bilit
y ci
ted
by K
essl
er (
1981
)0.
05D
eter
min
ed i
n or
der
to o
btai
ned
the
valu
eof
per
mea
bilit
y ci
ted
by K
essl
er (
1981
)F
(di
men
sion
less
)0.
95G
iven
Com
mon
exp
ress
ions
and
par
amet
erE
xpre
ssio
nsR
efer
ence
s
Equ
ilibr
ium
equ
atio
n (v
apor
-gla
ss)
(P i
n Pa
and
T i
n K
)A
= 2
8.80
073
and
B =
-61
42.8
9Po
ling
et a
l. (2
001)
Lat
ent
heat
of
subl
imat
ion
( DH
sub)
(kJ
/kg)
. T i
n K
DHsu
b = -
0.00
37T
2 + 1
.750
2T +
263
0.4
Polin
g et
al.
(200
1)E
xter
nal
mas
s tr
ansf
er c
oeffi
cien
t (h
P) (
kg/P
a m
2 .s)
P in
Pa
hP =
15.
912
¥ 10
-3 P
-0.7
731
Lom
brañ
a an
d Iz
kara
(19
96)
hT (
W/m
2 .K)
6.7
Wan
g an
d Sh
i (1
997,
199
8)C
p v (
J/kg
K)
1.67
47 ¥
103
Litc
hfiel
d an
d L
iapi
s (1
982)
s (W
/m2 .K
4 )5.
676
¥ 10
-8L
iapi
s an
d M
arch
ello
(19
84)
R (
J/km
ol.K
)8.
314
¥ 10
3Sa
diko
glu
and
Lia
pis
(199
7)M
(kg
/km
ol)
18Sa
diko
glu
et a
l. (1
998)
PT
sat
sat
=+
Ê Ëˆ ¯
exp
AB
122 S. KHALLOUFI, J.-L. ROBERT and C. RATTI
FIG. 4. COMPARISON BETWEEN EXPERIMENTAL DATA AND MODEL PREDICTIONS OF FREEZE DRYING OF APPLE AND POTATO (8 AND 14 mm THICKNESS) AT 40C HEATING
PLATE TEMPERATURE
0
10
20
30
40
50
60
70
80
90
100
0 100 200 300 400 500 600 700 800 900 1000
Wat
er r
emai
nin
g (
X /X
0)x1
00
Time (min)
Experimental data (14 mm) Experimental data (8 mm)Model predictions (14 mm) Model predictions (8 mm)
0
10
20
30
40
50
60
70
80
90
100
0 200 400 600 800 1000 1200
Wat
er r
emai
nin
g (
X /X
0)x1
00
Potato
Apple
14 mm
8 mm
14 mm
8 mm
FREEZE-DRYING SIMULATION 123
ship between freeze-drying time and thickness, as Sharma and Arora (1995),for yoghurt under different heating transfer modes and Saravacos (1967), inthe case of apple and potato. In the literature, however, freeze-drying time isoften presented as proportional to the square of the piece size (see Eqs. 1 and2), because the process is usually explained from the diffusion theory. King(1968) explained the anomaly with respect to pure diffusion theory, based onan externally controlled (boundary layer) freeze-drying process, which couldclearly explain the linear relationship between freeze-drying time and productthickness.
The simulation of apple and potato freeze-drying kinetics was done bysolving the proposed model with the values listed in Table 1. Figure 4 showsa comparison between predicted and experimental results on water remainingin apple and potato as a function of freeze-drying time. As can be seen, theagreement between both values is close, indicating that the present one-dimensional model gives reasonably accurate results to predict freeze-dryingcurves. The RSMEs (root square mean errors) between predicted and exper-imental data were determined as 18.6 and 45.3 min for 8- and 14-mm-thickapple slabs and 9.7 and 50.8 min for 8- and 14-mm-thick potato slabs, respec-tively. The main differences between experimental and predicted values werefound for thicker slabs at the end of the process. An explanation for this couldbe (1) the absence of desorption in the model and/or (2) the mass transfer,happening by lateral surfaces, which could be more significant in the case ofthicker slabs.
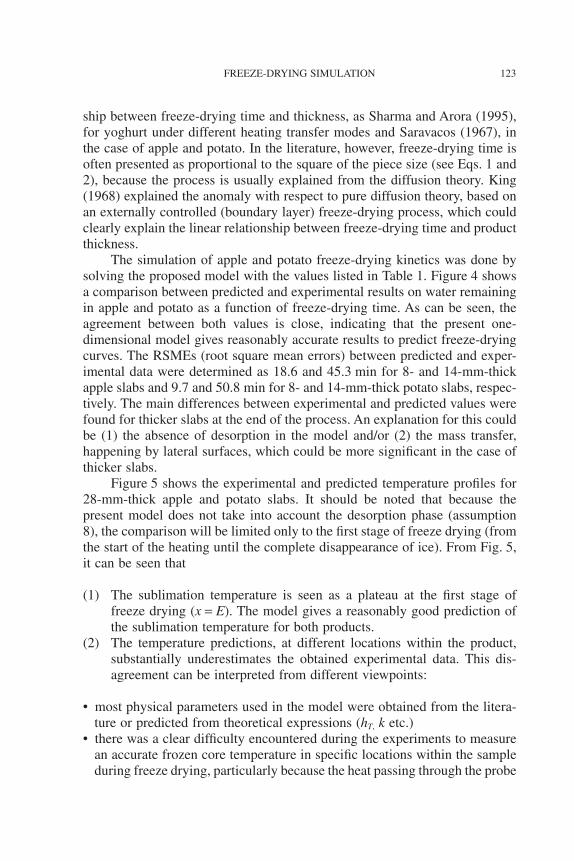
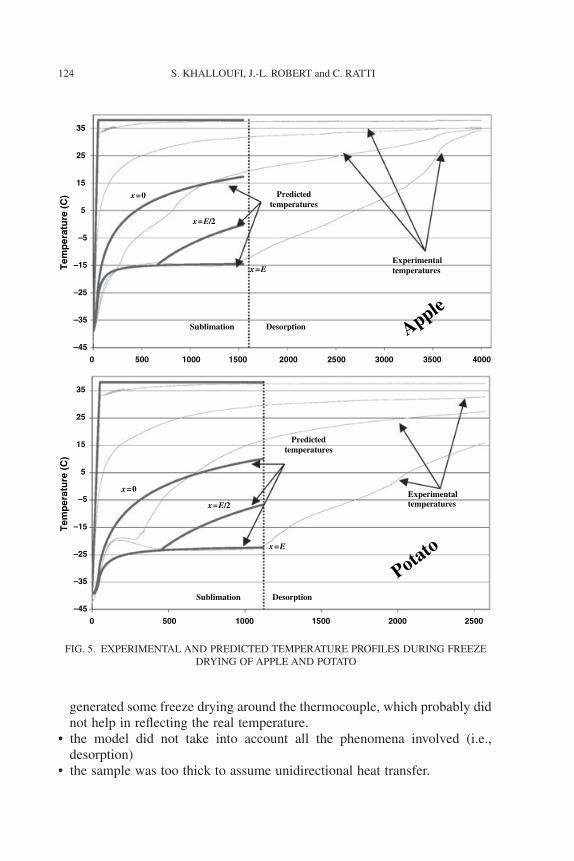
Figure 5 shows the experimental and predicted temperature profiles for28-mm-thick apple and potato slabs. It should be noted that because thepresent model does not take into account the desorption phase (assumption8), the comparison will be limited only to the first stage of freeze drying (fromthe start of the heating until the complete disappearance of ice). From Fig. 5,it can be seen that
(1) The sublimation temperature is seen as a plateau at the first stage offreeze drying (x = E). The model gives a reasonably good prediction ofthe sublimation temperature for both products.
(2) The temperature predictions, at different locations within the product,substantially underestimates the obtained experimental data. This dis-agreement can be interpreted from different viewpoints:
• most physical parameters used in the model were obtained from the litera-ture or predicted from theoretical expressions (hT, k etc.)
• there was a clear difficulty encountered during the experiments to measurean accurate frozen core temperature in specific locations within the sampleduring freeze drying, particularly because the heat passing through the probe
124 S. KHALLOUFI, J.-L. ROBERT and C. RATTI
generated some freeze drying around the thermocouple, which probably didnot help in reflecting the real temperature.
• the model did not take into account all the phenomena involved (i.e.,desorption)
• the sample was too thick to assume unidirectional heat transfer.
FIG. 5. EXPERIMENTAL AND PREDICTED TEMPERATURE PROFILES DURING FREEZE DRYING OF APPLE AND POTATO
25
35
00 00
Potato
0 500 10 1500 20 25
–45
–35
–25
–15
–5
5
15
00
Tem
per
atu
re (
C)
Desorp onSublimation
x = 0
x = E/2
x = E
temperatures
Predictedtemperatures
ti
25
35
00 00
Apple
0 500 10 1500 20 25
–45
–35
–25
–15
–5
5
15
00 0030 3500 4000
Tem
per
atu
re (
C)
Desorp onSublimation
x = 0
x = E/2
x = EExperimental
Experimental
temperatures
Predictedtemperatures
ti
FREEZE-DRYING SIMULATION 125
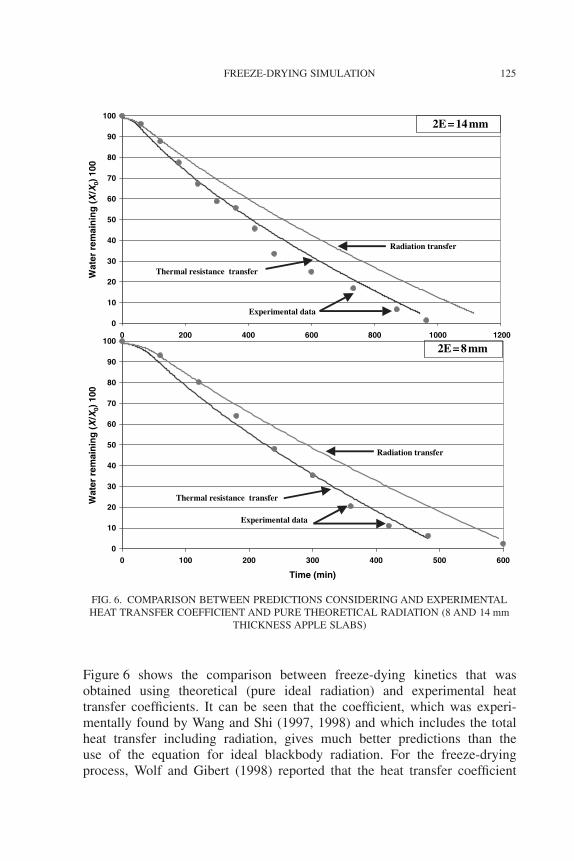
Figure 6 shows the comparison between freeze-dying kinetics that wasobtained using theoretical (pure ideal radiation) and experimental heattransfer coefficients. It can be seen that the coefficient, which was experi-mentally found by Wang and Shi (1997, 1998) and which includes the totalheat transfer including radiation, gives much better predictions than theuse of the equation for ideal blackbody radiation. For the freeze-dryingprocess, Wolf and Gibert (1998) reported that the heat transfer coefficient
FIG. 6. COMPARISON BETWEEN PREDICTIONS CONSIDERING AND EXPERIMENTAL HEAT TRANSFER COEFFICIENT AND PURE THEORETICAL RADIATION (8 AND 14 mm
THICKNESS APPLE SLABS)
0
10
20
30
40
50
60
70
80
90
100
0 200 400 600 800 1000 1200
0
10
20
30
40
50
60
70
80
90
100
0 100 200 300 400 500 600
Time (min)
Wat
er r
emai
nin
g (
X /X
0) 1
00W
ater
rem
ain
ing
(X
/X0)
100
2E = 8 mm
2E = 14 mm
Radiation transfer
Thermal resistance transfer
Experimental data
Radiation transfer
Thermal resistance transfer
Experimental data
126 S. KHALLOUFI, J.-L. ROBERT and C. RATTI
(hT) depends on pressure and its value varies from 4 W/m2.K at 1 Pa to50 W/m2.K at 100 Pa.
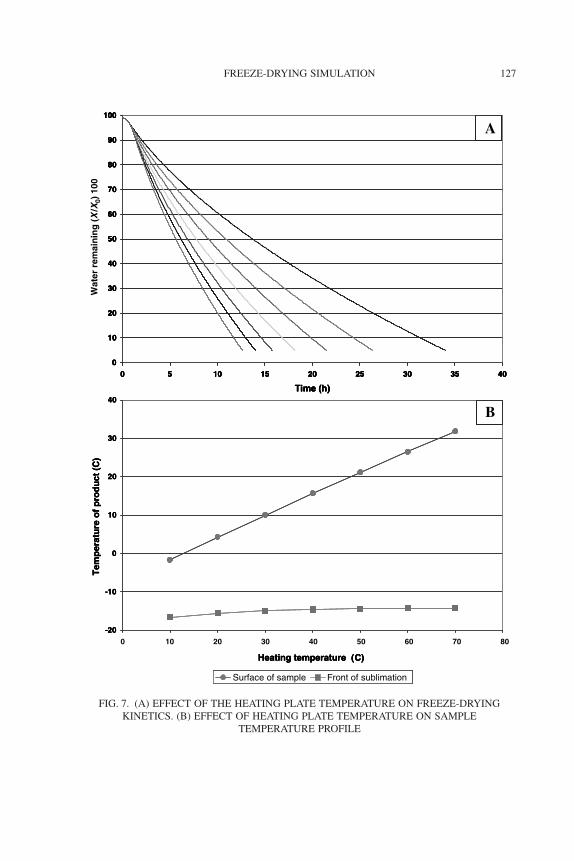
Figure 7A shows that the heating plate temperature significantly affectsthe freeze-drying kinetics. The sublimation process finishes at 12.6 h for aheating plate temperature of 70C, while only 47% of sublimation is achievedduring the same period if the heating plate temperature is 10C. The impact ofthe heating temperature on the surface and sublimation temperatures of thesample is given in Fig. 7B. It can be seen that, while increasing the heatingplate temperature does not markedly increase the frozen core temperature, theproduct surface temperature does. This finding can greatly help when opti-mizing the product quality during freeze drying. Hammami and René (1998)indicated that to avoid the collapse phenomena and the quality problemsduring freeze drying, the temperature of the frozen solid should be below themelting onset temperature and the temperature of the product in the dry zone,below the glass transition of the dry solids (Tgs). Two temperature limits wereshown to be essential during the freeze drying of a particular product: the icemelting onset temperature (Tm) and the glass transition temperature of the drysolids (Tgs). Nevertheless, from Fig. 7B, it can be concluded that the secondtemperature limit (glass transition of the dry solids) is a stronger optimizationparameter during freeze drying than the former.
CONCLUSIONS
Mathematical simulations were used to predict freeze-drying kinetics andtemperature profiles of food slabs and to study the impact of some parameterson the process. The nonlinear governing equations were solved numericallyand the results were compared to experimental data. The comparison revealeda very good agreement between predicted and experimental freeze-dryingkinetics and sublimation temperature, while the predicted temperature profilesdid not closely represent the experimental data. To improve the prediction ofthe present model, the following considerations should be taken into account:(1) to include a complex formulation of permeability, (2) to add the secondstage (desorption) of freeze drying (3) to consider two different thermalresistances (one for the bottom, taking into account the thermal contact withthe heating plate and the other for the top of the sample) and (4) to considertwo dimensional transfers. In addition, extra experimental research should bedone to determine physical properties, such as thermal conductivity as afunction of pressure, C2 coefficient, pore radius and isotherm function at twotemperatures (below and up 0C) etc.
The simulations showed that the use of an experimental heat transfercoefficient is a better option for simulation than to consider pure radiation
FREEZE-DRYING SIMULATION 127
FIG. 7. (A) EFFECT OF THE HEATING PLATE TEMPERATURE ON FREEZE-DRYING KINETICS. (B) EFFECT OF HEATING PLATE TEMPERATURE ON SAMPLE
TEMPERATURE PROFILE
0
10
20
30
40
50
60
70
80
90
100
0 5 10 15 20 25 30 35 40
Time (h)
-20
-10
0
10
20
30
40
Heating temperature (C)
Tem
per
atu
re o
f p
rod
uct
(C
)
Surface of sample Front of sublimation
0
10
20
30
40
50
60
70
80
90
100
0 5 10 15 20 25 30 35 40
Time (h)
0
10
20
30
40
50
60
70
80
90
100
0 5 10 15 20 25 30 35 40
Time (h)
0
10
20
30
40
50
60
70
80
90
100
0 5 10 15 20 25 30 35 40
Time (h)
Wat
er r
emai
nin
g (
X /X
0) 1
00
A
-20
-10
0
10
20
30
40
Heating temperature (C)
Tem
per
atu
re o
f p
rod
uct
(C
)
Surface of sample Front of sublimation
-20
-10
0
10
20
30
40
80706050403020100
Heating temperature (C)
Tem
per
atu
re o
f p
rod
uct
(C
)
Surface of sample Front of sublimation
B
128 S. KHALLOUFI, J.-L. ROBERT and C. RATTI
through a theoretical expression. In addition, the heating plate temperatureshowed a major effect on freeze-drying kinetics and surface temperature. Thissimulation program can therefore be used as a tool for the optimization of thefreeze-drying process.
NOMENCLATURE
r Mass density (kg/m3)s Stephan-Boltzmann constant values (J/s.m2.K4)DH Latent heat (kJ/kg)e PorosityC1 Knudsen constant value (m)C2 Dimensionless constantCp Specific heat (J/kgK)DAB Molecular diffusivity (m2/s)E Half the thickness (m)F Radiation view factorFF Frozen fraction of water (kg frozen water/kg total water)hP Mass transfer coefficient (kg/Pa m2 s)hT Heat transfer coefficient (J/m2.s.K)k Thermal conductivity (J/m.K.s)L Length (m)l Width (m)M Molecular weight (kg/kmol)m Vapor flux (kg/s.m2)P Pressure (Pa)Per Permeability (s)Pini Initial pressure (Pa)Pmax Pressure at the beginning (Pa)Pmin Pressure at the end (Pa)q Heat flux (J/s)R Gas constant value (J/kmol.K)r Pore radius of dried layer (m)S Interface position (m)T Temperature (K)Tini Initial temperature (K)t Time (s)Tg Glass transition temperature (K)Tm Melting temperature (K)V Volume (m3)WC Initial water content (kg water per kg fresh product)
FREEZE-DRYING SIMULATION 129
X Amount of water (kg)x Spatial position (m)
Subscript
• chamber conditionsd dryf frozenr remainings solidsat saturationsub sublimationT totalv vapor0 initial
REFERENCES
BRÜLLS, M. and RASMUSON, A. 2002. Heat transfer in vial lyophilization.Int. J. Pharm. 246, 1–16.
CHEFTEL, J.C., CHEFTEL, H. and BESANÇON, P. 1977. Introductiona la Biochimie et a la Technologie Des Aliments. Technique etDocumentation-Lavoisier, Paris, France.
GEORGE, J.P. and DATTA, A.K. 2002. Development and validation of heatand mass transfer models for freeze-drying of vegetable slices. J. FoodEng. 52, 89–93.
GUNN, R.D., CLARK, J.P. and KING, C.J. 1969. Mass transport in freezedrying basic studies and processing implications. In Recent Develop-ments in Freeze Drying, Vol 1, p. 260, International Institute of Refrig-eration, Paris, France.
HAMMAMI, C. and RENE, F. 1998. Determination of freeze-drying processvariables for strawberries. J. Food Eng. 32, 133–154.
KAREL, M. 1975. Heat and mass transfer in freeze drying. In Freeze Dryingand Advanced Food Technology, Chapter 14 (S.A. Goldbith, L. Rey andW.W. Rothamayr, eds.) pp. 177–202, Academic Press, New York, NY.
KERR, W.L., KAUTEN, R.J., OZILGEN, M., MCCARTHY, M.J. and REID,D.S. 1996. NMR imaging calorimertic, and mathematical modeling stud-ies of food freezing. J. Food Process Eng. 19, 363–384.
KESSLER, H.G. 1975. Heat and mass transfer in freeze drying of mixedgranular particles. In Freeze Drying and Advanced Food Technology,
130 S. KHALLOUFI, J.-L. ROBERT and C. RATTI
Chapter 16 (S.A. Goldbith, L. Rey and W.W. Rothmayr, eds.) pp. 223–239, Academic Press, Ltd, London, England.
KESSLER, H.G. 1981. Food Engineering and Dairy Technology. Kessler, VA;Freising, Germany.
KHALLOUFI, S. and RATTI, C. 2003. Quality deterioration of freeze-driedfoods as explained by glass transition temperature and internal structure.J. Food Sci. 68(3), 892–903.
KING, J. 1968. Rates of moisture sorption and desorption in porous driedfoodstuffs. Food Technol. 22(4), 165–171.
KOSTAROPULOS, A.E. and SARAVACOS, G.D. 1997. Thermal diffusivityof granular and porous foods at low moisture content. J. Food Eng. 33,101–109.
KROKIDA, M.K. and MAROULIS, Z.B. 1997. Effect of drying method onshrinkage and porosity. Drying Technol. 15(10), 2441–2458.
KUU, W.Y., MCSHANE, J. and WONG, J. 1995. Determination of masstransfer coefficient during freeze drying using modeling and parameterestimation techniques. Int. J. Pharm. 124, 241–252.
LEWIS, M.J. 1987. Physical Properties of Foods and Foods Processing Sys-tems. Horwood, E. Ltd., Chichester, England.
LIAPIS, A.I. and BRUTTINI, R. 1995a. Freeze drying. In Handbook ofIndustrial Drying, 2nd Ed., Chapter 10 (A.S. Mujumdar, ed.) pp. 309–343, Marcel Dekker, Inc., New York.
LIAPIS, A.I. and BRUTTINI, R. 1995b. Freeze-drying of pharmaceuticalcrystalline and amorphous solutes in vials: Dynamic multidimen-sional models of the primary and secondary drying stages and quali-tative features of the moving interface. Drying Technol. 13(1 and 2),43–72.
LIAPIS, A.I. and LITCHFIELD, R.J. 1978. Optimal control of freeze dryer-I. Chem. Eng. Sci. 34(7), 975–981.
LIAPIS, A.I. and MARCHELLO, J.M. 1984. Freeze drying a frozen liquid ina phial. Drying Technol. 2(2), 203–217.
LIAPIS, A.I., PIKAL, M.J. and BRUTTINI, R. 1996. Research and develop-ment needs and opportunities in freeze-drying. Drying Technol. 14(6),1265–1300.
LITCHFIELD, R.J. and LIAPIS, A.I. 1982. Optimal control of freeze dryer-II. Dynamic analysis. Chem. Eng. Sci. 37(1), 45–55.
LOMBRAÑA, J.I., DE ELVIRA, C. and VILLARÁN, M. 1997. Analysis ofoperating strategies in the production special foods in vials by freezedrying. Int. J. Food Sci. Technol. 32, 107–115.
LOMBRAÑA, J.I. and IZKARA, J. 1996. Experimental estimation of effec-tive transport coefficients in freeze drying for simulations and optimiza-tion purposes. Drying Technol. 14(3 and 4), 743–763.
FREEZE-DRYING SIMULATION 131
MELLOR, J.D. 1978. Fundamentals of Freeze Drying. Academic Press Inc,London, England.
MILLMAN, M.J., LIAPIS, I.A. and MARCHELLO, J.M. 1985. An analysisof lyophilization process using a sorption–sublimation model and variousoperational policies. Aiche J. 31(10), 1594–1604.
MUJUMDAR, A.S. 1995. Handbook of Industrial Drying, 2nd Ed., MarcelDekker, Inc., New York, NY.
NASTAJ, J. 1991. A mathematical modelling of heat transfer in freeze drying.In Drying 91 (A.S. Mujumdar and I. Filkova, eds.) pp. 405–413. Elsevier,London.
POLING, B., PRAUSNITZ., J. and O’CONNELL, J. 2001. Vapor pressuresand enthalpies of vaporization of pure fluids. In The Properties of Gasesand Liquids, 5th Ed., Chapter 7, p. 768, McGraw-Hill, New York, NY.
RAO, M.A. and RIZVI, S.S.H. 1995. Engineering Properties of Foods, 2ndEd., Marcel Dekker, New York, NY.
SADIKOGLU, H. and LIAPIS, A.I. 1997. Mathematical modeling of theprimary and secondary drying stages of bulk solution freeze-drying intrays: Parameter estimation and model discrimination by comparison oftheoretical results with experimental data. Drying Technol. 15(3 and 4),791–810.
SADIKOGLU, H., LIAPIS, A.I. and CROSSER, O.K. 1998. Optimal controlof the primary and secondary drying stages of bulk solution freeze dryingin trays. Drying Technol. 16(3–5), 399–341.
SAGARA, Y. and ICHIBA, J. 1994. Measurement of transport properties forthe dried layer of coffee solution undergoing freeze drying. DryingTechnol. 12(5), 1081–1103.
SARAVACOS, G. 1967. Effect of the drying method on the water sorption ofdehydrated apple and potato. J. Food Sci. 32, 81–84.
SHARMA, N.K. and ARORA, C.P. 1993. Prediction transient temperaturedistribution during freeze drying of yoghurt. Drying Technol. 11(7),1863–1883.
SHARMA, N.K. and ARORA, C.P. 1995. Influence of product thickness,chamber pressure and heating conditions on production rate of freeze-dried yoghurt. Int. J. Refrig. (UK) 18(5), 297–307.
SHEEHAN, P. and LIAPIS, A.I. 1998. Modeling of primary and secondarydrying stages of freeze drying of pharmaceutical products in vials:Numerical results obtained from solution of dynamic and spatially mul-tidimensional lyophilization model for different operational policies.Biotechnol. Bioeng. 60(6), 712–728.
SIMATOS, D., BLOND, G., DAUVOIS, P. and SAUVAGEOT, F. 1974. LaLyophilisation: Principes et Applications. Collection de l’AssociationNationale de la Recherche Technique, Paris, France.
132 S. KHALLOUFI, J.-L. ROBERT and C. RATTI
SKELLAND, A.H.P. 1974. Molecular diffusivities. In Diffusional MassTransfer, 1st Ed., Chapter 3, p. 510, Wiley, New York, NY.
WANG, Z.H. and SHI, M.H. 1997. Effects of heating methods on vacuumfreeze drying. Drying Technol. 15(5), 1475–1498.
WANG, Z.H. and SHI, M.H. 1998. Numerical study on sublimation con-densation phenomena during microwave freeze drying. Chem. Eng. Sci.53(18), 3189–3197.
WOLFF, E. and GIBERT, H. 1998. Développements technologiquesnouveaux en lyophilisation. J. Food Eng. 8, 91–108.