The detection and dimension of bubble entrainment and comminution
11
The detection and dimension of bubble entrainment and comminution T. G. Leighton, a) P. R. White, and M. F. Schneider Institute of Sound and Vibration Research, University of Southampton, Highfield, Southampton SO17 1BJ, United Kingdom ~Received 12 May 1997; accepted for publication 22 December 1997! Data on bubble entrainment and comminution are gathered in three experiments, involving the breakup of a disk of air trapped between two plates, and bubble cloud generation under a waterfall, and a plunging jet. In the second two cases, an automated acoustic system for characterizing the entrainment is employed. The data sets are compared with an existing theory for bubble fragmentation, in which a key parameter is the number of spatial dimensions associated with the insertion of randomly positioned planes which are used to divide up the bubble. While an appropriate best-fit theoretical curve can be obtained for the bubble population histograms generated by air disk comminution, waterfalls and plunging jets produce multimodal distributions which the theory cannot model. The differing roles of shape oscillations and surface waves in bubble fragmentation, and the issues involved with incorporating these into the model, are examined. © 1998 Acoustical Society of America. @S0001-4966~98!04804-8# PACS numbers: 43.30.Gv, 43.25.Yw @DB# INTRODUCTION Bubbles may be generated through a number of common processes, all of which relate to changes ~formation, rupture, closure, merging, etc.! of one or more gas/liquid interfaces. Bubbles may, for example, be entrained from an approxi- mately planar free surface; or a population might be gener- ated through comminution of an existing gas pocket. Energy from such processes, channeled through mechanisms involv- ing surface tension, hydrostatic, and hydrodynamic forces, etc., can generate bubble oscillation and consequently acous- tic emission. Minnaert 1 predicted that the natural frequency should vary inversely with bubble size. The bubble, behav- ing to first order as a lightly damped single degree of free- dom oscillator, 2 emits on entrainment an acoustic ‘‘signa- ture’’ resembling an exponentially decaying sinusoid. 3,4 Identification of these has enabled size distribution spectra from the acoustic emissions of bubbles entrained in brooks, streams, and waterfalls to be obtained. 5 The passive acoustic emissions associated with bubble formation, including such signatures, have been examined in a large number of sce- narios. Examples include the formation of bubble clouds by injection 6 or by the impact of bodies of water. 7–10 Several studies have examined entrainment by liquid jets. 11–16 Acoustic emissions and ‘‘signatures’’ have been identified with other forms of liquid drop impact, including rainfall, 17–20 and wave breaking. 21,22 Such studies have in turn led to studies of the underlying fluid dynamics 23,24 and investigations of the possibility of using the acoustic signals for monitoring purposes. 25–29 Longuet Higgins 30 produced an analysis which demon- strated how the problem of predicting the number and size of daughter bubbles might be approached and, noting the dearth of laboratory data, compared the theory with the measure- ments of earlier workers. 5,31–33 The entrainment is modeled by the dissection of a cubi- cal air body through the insertion of planes. The newly formed bubbles ~‘‘daughters’’! are represented by the rectan- gular sub-blocks thereby generated. Three sets of planes ex- ist, each set being parallel to a face of the cube and contain- ing m planes. The dimensionality ( D ) of the fragmentation reflects the number of sets used. The sets are inserted inde- pendently to one another ~Fig. 1!. For comparison of theory and experiment, the dimensionality and the number of planes are chosen to best fit the standard deviation and skewness of the data, and the height of the theoretical curve is adjusted to relate to the total number of bubbles and the bin width. In the natural world Longuet Higgins suggested that a one-dimensional event may occur when water is running over a smooth stone and entrains a cylindrical volume of air. The one-dimensional model considers a line segment of unit length, which is divided by m points spaced randomly into m 11 subsegments of typical length X . The probability den- sity p ( X ) of the length of this subsegment is p ~ X ! 5m~ 1 2X ! ~ m21 ! (provided 0 ,X ,1 and m .1), ~1! and the cumulative probability function P ( X ) is given by P ~ X ! 5 E p ~ X ! dX . ~2! The derivative of the cumulative probability function P ( X ) with respect to ln(X) gives the density of the distribu- tion: dP d $ ln~ X ! % 5 dP dX dX d $ ln~ X ! % 5 p ~ X ! X 5m~ 1 2X ! ~ m21 ! X . ~3! a! Electronic mail: [email protected] 1825 1825 J. Acoust. Soc. Am. 103 (4), April 1998 0001-4966/98/103(4)/1825/11/$10.00 © 1998 Acoustical Society of America
Transcript of The detection and dimension of bubble entrainment and comminution

The detection and dimension of bubble entrainmentand comminution
T. G. Leighton,a) P. R. White, and M. F. SchneiderInstitute of Sound and Vibration Research, University of Southampton, Highfield, Southampton SO17 1BJ,United Kingdom
~Received 12 May 1997; accepted for publication 22 December 1997!
Data on bubble entrainment and comminution are gathered in three experiments, involving thebreakup of a disk of air trapped between two plates, and bubble cloud generation under a waterfall,and a plunging jet. In the second two cases, an automated acoustic system for characterizing theentrainment is employed. The data sets are compared with an existing theory for bubblefragmentation, in which a key parameter is the number of spatial dimensions associated with theinsertion of randomly positioned planes which are used to divide up the bubble. While anappropriate best-fit theoretical curve can be obtained for the bubble population histograms generatedby air disk comminution, waterfalls and plunging jets produce multimodal distributions which thetheory cannot model. The differing roles of shape oscillations and surface waves in bubblefragmentation, and the issues involved with incorporating these into the model, are examined.© 1998 Acoustical Society of America.@S0001-4966~98!04804-8#
PACS numbers: 43.30.Gv, 43.25.Yw@DB#
o
.xergoeoyaveea-.ctk
cucscb
e
al
n-ea
re-
bi-ly
n-ex-
ain-
inde-
nesss ofd to
t aingair.unit
n-
INTRODUCTION
Bubbles may be generated through a number of commprocesses, all of which relate to changes~formation, rupture,closure, merging, etc.! of one or more gas/liquid interfacesBubbles may, for example, be entrained from an appromately planar free surface; or a population might be genated through comminution of an existing gas pocket. Enefrom such processes, channeled through mechanisms inving surface tension, hydrostatic, and hydrodynamic forcetc., can generate bubble oscillation and consequently actic emission. Minnaert1 predicted that the natural frequencshould vary inversely with bubble size. The bubble, behing to first order as a lightly damped single degree of frdom oscillator,2 emits on entrainment an acoustic ‘‘signture’’ resembling an exponentially decaying sinusoid3,4
Identification of these has enabled size distribution spefrom the acoustic emissions of bubbles entrained in broostreams, and waterfalls to be obtained.5 The passive acoustiemissions associated with bubble formation, including ssignatures, have been examined in a large number ofnarios. Examples include the formation of bubble cloudsinjection6 or by the impact of bodies of water.7–10 Severalstudies have examined entrainment by liquid jets.11–16
Acoustic emissions and ‘‘signatures’’ have been identifiwith other forms of liquid drop impact, includingrainfall,17–20 and wave breaking.21,22 Such studies have inturn led to studies of the underlying fluid dynamics23,24 andinvestigations of the possibility of using the acoustic signfor monitoring purposes.25–29
Longuet Higgins30 produced an analysis which demostrated how the problem of predicting the number and sizdaughter bubbles might be approached and, noting the de
a!Electronic mail: [email protected]
1825 J. Acoust. Soc. Am. 103 (4), April 1998 0001-4966/98/103(
n
i-r-ylv-s,us-
--
ras,
he-y
d
s
ofrth
of laboratory data, compared the theory with the measuments of earlier workers.5,31–33
The entrainment is modeled by the dissection of a cucal air body through the insertion of planes. The newformed bubbles~‘‘daughters’’! are represented by the rectagular sub-blocks thereby generated. Three sets of planesist, each set being parallel to a face of the cube and conting m planes. The dimensionality (D) of the fragmentationreflects the number of sets used. The sets are insertedpendently to one another~Fig. 1!. For comparison of theoryand experiment, the dimensionality and the number of plaare chosen to best fit the standard deviation and skewnethe data, and the height of the theoretical curve is adjusterelate to the total number of bubbles and the bin width.
In the natural world Longuet Higgins suggested thaone-dimensional event may occur when water is runnover a smooth stone and entrains a cylindrical volume ofThe one-dimensional model considers a line segment oflength, which is divided bym points spaced randomly intom11 subsegments of typical lengthX. The probability den-sity p(X) of the length of this subsegment is
p~X!5m~12X!~m21!
(provided 0,X,1 and m.1), ~1!
and the cumulative probability functionP(X) is given by
P~X!5E p~X!dX. ~2!
The derivative of the cumulative probability functioP(X) with respect to ln(X) gives the density of the distribution:
dP
d$ ln~X!%5
dP
dX
dX
d$ ln~X!%5p~X!X5m~12X!~m21!X.
~3!
18254)/1825/11/$10.00 © 1998 Acoustical Society of America

x
e
of
itinlc
deaonn
tan
befivb
t
rdipat
r
agtail
bbor
-uredm
nteras
thesure-
cedri-ehedi-
erehterblee
ence
thefalls
nu-eseles
en-
ency
u-in
tube
Replacing the line segment of unit length, divided bympoints, by a block of unit volume, divided bym parallelplanes, the probability density of the sub-blocks will be eactly the same as shown above.
Let R denote the radius of a spherical bubble of volumV, andR0 the radius of a bubble of volumeV0 , such that thenormalized bubble radii and volume arer 5R/R0 and n5V/V0 , respectively. The density of the distributionbubble radii is given by:
dP
d$ ln~r !%5
dP
dV
dV
d$ ln~r !%
5p~v !3v5m„12v…
~m21!3v. ~4!
In the two-dimensional model a cubical block of unvolume, which is split by two sets of perpendicular anddependent planes, is considered. The distributions are calated using numerical integration. In a similar way the mocan be extended to three dimensions, with distributions hing a much smaller mean. In all three cases the distributifor a large number of planes tend to limiting values of nozero standard deviation and skewness.
In this paper visual observations of air disc fragmention lead to studies of bubble entrainment in a waterfall aunder a plunging jet in the laboratory. The comparisontween the data sets and the theory is discussed in terms oassumptions inherent in the model, and the relative effectness of visual and acoustic techniques for monitoring bubentrainment.
I. OPTICAL METHODS
A so-called ‘‘two-dimensional’’ bubble~an ‘‘air disk’’ !was formed by injecting an air bubble into degassed wabetween two plates of polymethylmethacrylate~PMMA!separated by an O-ring. The energy for fragmentation is pvided by a repeatable combination of flow and pressureturbance. The apparatus consists of a U-tube which istially filled with degased water. It is connected by a hosethe PMMA plates at one end, and is stoppered at the othea top plate which can be opened~Fig. 2!. The bubble, whichis initially positioned at the center of the plates using a mnetic slider, expands when the vacuum pump reducesambient pressure. The top plate is then rapidly opened,the resulting liquid pressure change causes bubble osction, which is video recorded at 50 f.p.s.~frames per second!,1-ms exposure. The minimum pressure applied to the buwas 20 mbar~approximately 10 mbar higher than the vap
FIG. 1. The model of bubble fragmentation: a cube which is split bymplanes inserted fromD dimensions~each coordinate axis being perpendiclar to the respective cube face!. One of the daughter bubbles producedeach case is shaded.~a! D51, m52; ~b! D52, m51; ~c! D53, m52.
1826 J. Acoust. Soc. Am., Vol. 103, No. 4, April 1998
-
-u-lv-s
-
-d-
thee-le
er
o-s-r-
oby
-hendla-
le
pressure of water at 20 °C!. The pre-expansion and precollapse size of the bubble and its daughters were measusing a graticule magnifying glass. The partial vacuucaused deflection of the plates of about 0.2 mm in the ceand 0.06 mm at the O-ring when the lowest pressure wapplied. This deflection was taken into account whenbubble volumes were calculated. The release of the presleads to an oscillation of the plates~measured by accelerometer to be at 30 Hz and of 0.5-s duration! and an oscillatingwater flux. Bubbles having radii smaller than the distanbetween the plates were hemispherical, rather than cylincal ~Fig. 2!. Since the third dimension may influence thdynamics of such bubbles significantly more than for tlarger air disks, the transitional size between the two is incated on the plots of the results~Fig. 6!. In general 10–30breakups of one bubble size at a particular pressure wrecorded to obtain representative histograms of daugbubbles. The accuracy of the measurement of the bubvolume was65%. ~Reference 34 describes how the samapparatus can be modified to generate sonoluminescfrom more energetic bubble collapses.!
II. ACOUSTIC MEASUREMENTS OF ENTRAINMENTTHROUGH LIQUID IMPACT
A. Automated bubble signal recognition
Bubble generation was monitored through the use ofpassive acoustic emissions. Hydrophone data from waterand brooks had previously been examined,5 and the timeseries found to contain distinct exponentially decaying sisoids which are characteristic of bubble entrainment. Thwere used to obtain the size distribution of entrained bubbfrom the frequencies of the sinusoids. However in noisyvironments and with higher entrainment rates~where such‘‘signatures’’ overlap!, individual entrainments may not bdetected with this technique. Nevertheless a time-frequerepresentation~TFR! via the Gabor coefficients~see the Ap-pendix! can readily identify the bubble signatures~e.g., from
FIG. 2. The apparatus employed to fragment air disks, showing the U-equipment; and both plan and side views of the PMMA plates.
1826Leighton et al.: Bubble entrainment and comminution

yimhiffiFmrai
wer
on-e
ine,m
3ffirbozenbuon
inisis
aer-de-hethee.
bor
riti--
tion
ies,-
erepus
aterfall
myoca-
rd-
theta
enp
en2
; ththint
-imemed
rainfall over the ocean35!. Resolution in time and frequencis a compromise determined by the size of the windowposed upon the data. The procedure employs a routine wthresholds on the value and gradient of the Gabor coecients, then automatically counts and sizes the bubbles.the calculation of the Gabor coefficients, a damping paraeter with an e-folding time of 100 s21 was assumed, and fobubble counting the threshold of the Gabor coefficient wset to be three times the mean value of the coefficients, wthe gradient set equal to 0.3. These values were robustrespect to bubble counting. Entrainment data were gathfor analysis in this way in a small waterfall, and beneathwater jet which impacts a water surface from above.
Figures 3 and 4 show the efficacy of this techniqueartificial data. Figure 3~a! depicts a noise-free test signal cosisting of four transient components, each one being anponentially decaying sinusoid, such that two overlapppairs occur. In this example all these four components wchosen to have unit amplitude, with center frequencies 82.3, and 15.2 kHz, with epochs at 1, 2.12, 8, and 9.1respectively. All the signals had decay rates of 0.5 ms21. TheGabor coefficients are computed using an FFT size ofsamples and an assumed decay rate matching that osimulation. This time series was designed so that thecomponent lay exactly on the sampling lattice of the Gaexpansion, so that it could be represented by a single noncoefficient. The second component occurs at a frequewhich is on the sampling lattice of the Gabor expansion,occurs at a time which is between lattice points. The cverse is true of the third component~which lies betweenlattice points in frequency, but on the sampling latticetime!. Finally the fourth component lies at a point whichon neither the time or frequency lattice. The effect of th
FIG. 3. ~a! A noise-free test signal~artificial data! consisting of four expo-nentially decaying sinusoids. All have unit amplitude, with center frequcies 8, 6, 2.3, and 15.2 kHz, with epochs at 1, 2.12, 8, and 9.1 ms, restively. All the signals have e-folding decay rates of 0.5 ms21. ~b! Time-frequency representation of the magnitude of the Gabor coefficiassociated with the time series of~a! ~computed using an FFT size of 3samples and an assumed decay rate matching that of the simulation!. Thefirst transient lies exactly on the sampling lattice of the Gabor expansionsecond lies on the lattice in frequency but not in time; the third lies onlattice in time but not in frequency; and the fourth lies between lattice poin both frequency and time.
1827 J. Acoust. Soc. Am., Vol. 103, No. 4, April 1998
-ch-or-
sthitheda
n
x-gre6,s,
2thestrro
cyt-
choice on the Gabor expansion can be seen in Fig. 3~b!,which plots the magnitude of the Gabor coefficients asfunction of time and frequency. The first component genates a single-point spike. The second signal has a wellfined peak in time but is smeared in frequency, whilst for tthird the converse is true. The peak corresponding tofourth component is smeared in both frequency and timThis inconsistency can be mitigated by computing the Gaexpansion at a greater number of points.36 However, forcomputational ease, attention here is restricted to the ccally sampled distribution,37 which is adequate for the purposes of this investigation.
Figure 4~a! shows the same signal as Fig. 3~a! but withthe addition of Gaussian white noise, the standard deviaof which is 0.2. In the Gabor expansion shown in Fig. 4~b!the peaks are still clearly evident whereas in the time serFig. 4~a!, identification of signals typical of bubble entrainment is less easy.
B. Entrainment in a waterfall
The acoustic signals of newly entrained bubbles wmeasured in a brook on the Southampton University Camon 25.05.93. The hydrophone~Bruel & Kjaer 8104!, wasmounted on a steel rod at 15 cm depth beneath mean wlevel in a bubble field created at the base of a small water~height approximately 20 cm, called location A!; and at 10cm depth in a different bubble field approximately 30 caway ~location B!. The water was running very smoothlover the step. Two sets of data were obtained at each ltion. The hydrophone output was amplified~Bruel & Kjaer2635! and recorded~AIWA HHB 1 PRO DAT recorder, withflat frequency response from 20 Hz to 22 kHz! for 10 min atboth locations. Subsequently, the data from the field recoings were transmitted through a low-pass filter~Barr andStroud EF5/20, roll off approx. 48 dB/oct! into a data acqui-sition box, where they were acquired and digitized usingMATLAB software package. The time history of the da
-ec-
ts
ees
FIG. 4. ~a! Same as for Fig. 3~a!, but with the addition of Gaussian whitenoise, the standard deviation of which is 0.2.~b! Time-frequency representation of the magnitude of the Gabor coefficients associated with the tseries of~a! ~computed using an FFT size of 32 samples and an assudecay rate matching that of the simulation!.
1827Leighton et al.: Bubble entrainment and comminution

creside
anin
t
bd
r
h
e
eudb
egitd
orsen
argepre-
le.e
bersizethe
lieder ofingflefit
of
and. Itfitsdlesicalin
lesdi-
thetri-
edtion
nta-
wsless
showed that the most bubbles occurred in the frequenrange between 500 Hz and 2 kHz. The signal was acquiwith a sampling rate of 20 kHz while the low-pass filter waset to 10 kHz~although this provides no guard band to avoaliasing, no significant frequency components were presabove this frequency!.
C. Entrainment by a plunging liquid jet
The experiment was carried out in a 1.8 m31.2 m31.2 m deep glass reinforced plastic tank which wfilled to 1 m depth with fresh water. The tank was vibratioisolated from the floor by Tico pads. A hose, terminatinga glass tube~5 mm inner diameter!, was mounted near thewater surface at varying angles~Fig. 5!. Flow rate and jetangle were varied and recorded~the intention being to inves-tigate the relative effect of these rather than characterizejet completely13–15!. The hydrophone~Bruel & Kjaer 8105!was at;300 mm depth beneath the entrained bubbles,;150 mm off-axis. The hydrophone signal was amplifie~Bruel & Kjaer 2635! and recorded on a DAT-recorde~AIWA, Type HOB 1 PRO! or fed directly through a low-pass filter~Barr & Stroud EF5/20! into the MATLAB dataacquisition toolbox. The sample rate was 44 kHz, and tlow-pass filter set with a cutoff frequency of 20 kHz.
III. OPTICAL RESULTS OF AIR DISCFRAGMENTATION
Figure 6 shows the daughter populations produced wha two-dimensional bubble having initial diameterd0
57.5 mm expands under various pressure reductions to vaing values ofdg , the diameter when fully expanded. Thapplied pressure reduction, and consequently the subseqpressure step, were increased from the value just requirecause fragmentation. When a small pressure differencetween applied pressure and atmospheric pressure wasleased, giving low excitation energy, two daughter bubblwere produced. With higher excitation energies, more dauters were created. In regard to the dependence on the inbubble size, the release of a given pressure difference tento produce an increased number of daughter bubbles, asd0
increased.The data in Fig. 6 are compared with the theory. Th
measured radii of the air discs were converted into radiispheresRsph with the same volume. Depending on the aveage numberNavg of daughter bubbles per break-up, the bevalue of m with the appropriate curve was fitted. In all thcases the data is fitted optimally when the one-dimensiotheory for fragmentation is applied (D51). In Fig. 6~a! theaverage number of daughter bubbles isNavg52. The best fit
FIG. 5. Apparatus for entrainment by liquid jet.
1828 J. Acoust. Soc. Am., Vol. 103, No. 4, April 1998
yd
nt
s
he
ut
e
n
ry-
enttoe-re-sh-ialed
ef-t
al
is given by the one-dimensional theory withD51 and m51, shown as the dashed line in Fig. 6~a!. The theoreticalcurve does not fit the measured data, because no very ldaughter bubbles were observed. This suggests that theferred splitting occurred toward the middle of the bubbThis would give a more narrow distribution than would thrandom splitting that theory assumes. In Fig. 6~b! the exci-tation energy was increased, leading to an increased numof daughter bubbles. The mode of the measured bubbledistribution occurs at a smaller radius than does that ofprediction. A theoretical distribution havingD51, m53,andNavg54 @shown as the dashed line in Fig. 6~b!# gives thebest fit. Figure 6~c! shows a similar distribution, but with asmaller mean and less sharp peak. Augmenting the apppressure difference has generated an increased numbdaughter bubbles. Again, the theoretical curve for a splittin one dimension (D51), with an increased number oplanes~m55, Navg56!, produces a better fit than is possibwith the two- or three-dimensional theories. This optimalis shown by the dashed line in Fig. 6~c!. Increasing the ex-citation energy still further leads to a greater numberdaughter bubbles, as shown in Fig. 6~d!. Most of the bubblesare smaller than the transitional size between disklikehemispherical daughters, shown by the dotted vertical lineis therefore not surprising that no single theoretical curvethe entire data set in Fig. 6~d!, since the processes involvein the fragmentation of hemispherical and disklike bubbwould be expected to differ. The figure shows the theoretcurve forD51, m510 tends to cover the disklike bubblesthe distribution.
TheD51 best fit to the results suggests that the bubbfragmented in a process where splitting occurred in onerection only. In addition, if the plane were inserted nearcenter of the bubble, this would give the more narrow disbution which is observed. These hypotheses are confirmusing high speed video pictures taken from the fragmenta
FIG. 6. Histograms of the distribution of daughter bubbles after fragmetion of an air disk of initial diameterd057.5 mm for different excitationenergies, with the best-fit curve from theory. The dotted vertical line shothe transition diameter, such that measured radii smaller than this arethan the plate spacing.
1828Leighton et al.: Bubble entrainment and comminution
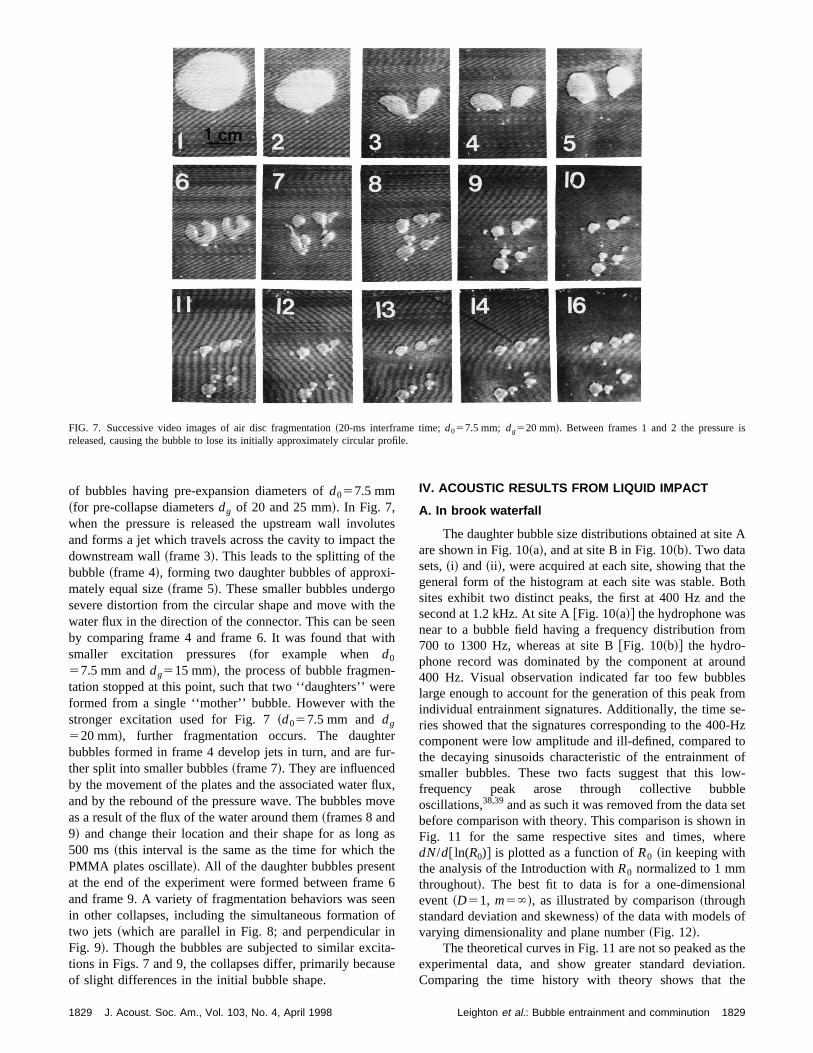
is
FIG. 7. Successive video images of air disc fragmentation~20-ms interframe time;d057.5 mm; dg520 mm!. Between frames 1 and 2 the pressurereleased, causing the bubble to lose its initially approximately circular profile.utth
i-othe
ith
-re
e
teu
fluo
aheteeeo
initas
e A
heoth
the
m
undesome--Hzto
t ofw-le
setin
ere
al
thetion.he
of bubbles having pre-expansion diameters ofd057.5 mm~for pre-collapse diametersdg of 20 and 25 mm!. In Fig. 7,when the pressure is released the upstream wall involand forms a jet which travels across the cavity to impactdownstream wall~frame 3!. This leads to the splitting of thebubble~frame 4!, forming two daughter bubbles of approxmately equal size~frame 5!. These smaller bubbles undergsevere distortion from the circular shape and move withwater flux in the direction of the connector. This can be seby comparing frame 4 and frame 6. It was found that wsmaller excitation pressures~for example when d0
57.5 mm anddg515 mm!, the process of bubble fragmentation stopped at this point, such that two ‘‘daughters’’ weformed from a single ‘‘mother’’ bubble. However with thstronger excitation used for Fig. 7~d057.5 mm anddg
520 mm!, further fragmentation occurs. The daughbubbles formed in frame 4 develop jets in turn, and are fther split into smaller bubbles~frame 7!. They are influencedby the movement of the plates and the associated waterand by the rebound of the pressure wave. The bubbles mas a result of the flux of the water around them~frames 8 and9! and change their location and their shape for as long500 ms~this interval is the same as the time for which tPMMA plates oscillate!. All of the daughter bubbles presenat the end of the experiment were formed between framand frame 9. A variety of fragmentation behaviors was sin other collapses, including the simultaneous formationtwo jets ~which are parallel in Fig. 8; and perpendicularFig. 9!. Though the bubbles are subjected to similar exctions in Figs. 7 and 9, the collapses differ, primarily becauof slight differences in the initial bubble shape.
1829 J. Acoust. Soc. Am., Vol. 103, No. 4, April 1998
ese
en
rr-
x,ve
s
6nf
-e
IV. ACOUSTIC RESULTS FROM LIQUID IMPACT
A. In brook waterfall
The daughter bubble size distributions obtained at sitare shown in Fig. 10~a!, and at site B in Fig. 10~b!. Two datasets,~i! and~ii !, were acquired at each site, showing that tgeneral form of the histogram at each site was stable. Bsites exhibit two distinct peaks, the first at 400 Hz andsecond at 1.2 kHz. At site A@Fig. 10~a!# the hydrophone wasnear to a bubble field having a frequency distribution fro700 to 1300 Hz, whereas at site B@Fig. 10~b!# the hydro-phone record was dominated by the component at aro400 Hz. Visual observation indicated far too few bubbllarge enough to account for the generation of this peak frindividual entrainment signatures. Additionally, the time sries showed that the signatures corresponding to the 400component were low amplitude and ill-defined, comparedthe decaying sinusoids characteristic of the entrainmensmaller bubbles. These two facts suggest that this lofrequency peak arose through collective bubboscillations,38,39and as such it was removed from the databefore comparison with theory. This comparison is shownFig. 11 for the same respective sites and times, whdN/d@ ln(R0)# is plotted as a function ofR0 ~in keeping withthe analysis of the Introduction withR0 normalized to 1 mmthroughout!. The best fit to data is for a one-dimensionevent~D51, m5`!, as illustrated by comparison~throughstandard deviation and skewness! of the data with models ofvarying dimensionality and plane number~Fig. 12!.
The theoretical curves in Fig. 11 are not so peaked asexperimental data, and show greater standard deviaComparing the time history with theory shows that t
1829Leighton et al.: Bubble entrainment and comminution

is
FIG. 8. Successive video images of air disk fragmentation~20-ms interframe time;d057.5 mm; dg525 mm!. Between frames 1 and 2 the pressurereleased. Two parallel jets~arrowed in frame 4! fragment the bubble~one jet appears before the other, as arrowed in frame 2!. In frame 8 another jet, whichcauses a daughter bubble to fragment, is arrowed.ltd
st
iontei-bjee
heatve
sur-as
Dur-theaterlesjet
bles
in-tcy.
3ow
bubbles are entrained sequentially, rather than simuneously, so that the data must be considered as summedtributions if comparison with theory is judging like againlike.
B. Entrainment by plunging liquid jet
Investigation was made of the bubble size distributentrained when a water jet strikes the surface of the waThe flow rate and the jet angle~measured between the horzontal and the direction of the water as it leaves the tu!were varied. Visual observation revealed that a minimumspeed was needed to entrain bubbles, below which notrainment occurred. The sole exception to this occurred wsmall surface waves on the water tank disturbed the wjet, resulting in bubble entrainment. Such surface wa
1830 J. Acoust. Soc. Am., Vol. 103, No. 4, April 1998
a-is-
r.
etn-n
ers
could be excited by entrained bubbles which rose to theface by buoyancy. The maximum jet speed employed wlimited to ensure that no subsequent splashes occurred.ing the experiment it became clear that, for large angles,main reason for entrainment was the disturbance of the wsurface by bubbles rising to the surface. For smaller angthe water jet carried the entrained bubbles away from theand the waves on the tank surface set up when the bubburst did not affect the water jet.
Figures 13–15 show histograms of the bubble entrament distributions. In part~i! of each figure the bubble coun(N) is shown as a function of the bubble natural frequenIn part ~ii !, dN/d@ ln(R0)# is plotted as a function ofR0 tocompare with the theory of the Introduction. Figure 1shows results from an experiment with a constant water fl
is
FIG. 9. Successive video images of air disk fragmentation~20-ms interframe time;d057.5 mm; dg520 mm!. Between frames 1 and 2 the pressurereleased. Two perpendicular jets fragment the bubble~arrowed in frame 5!. In frame 8 the involution of a daughter bubble occurs~arrowed!, but this is notsufficiently energetic to fragment the bubble.1830Leighton et al.: Bubble entrainment and comminution

eleinetl,in
tnsiaee°-fo
w
with
ntalenns
heorheand
l’’
ityry.us-besthetheaks
n-derter-o aion,
.
ts
eo
areher.ous
~2.5 l/min! and jet angles of 80°–30°. As expected from thvisual observations outlined above, the number of bubbentrained per time interval first decreased with a decreasangle and then increased again. All the distributions showa maximum at;2 kHz. In addition they had a peak a;700 Hz. At 80° the distribution is roughly monomodaand the best fit to theory is one dimensional, both indicata simple entrainment process. As the angle reduces to 60°multimodal distribution is measured. Although the ‘‘best’’ fiis for D53, the fit is poor, and suggests that processesincorporated in the theory~such as coalescence, and themultaneous occurrence of several types of entrainmentcomminution! are involved. The entrainment rate decreassharply ~75°! and then gradually increases again. High frquencies are generated. The rate remains high from 5530°, for whichD52 is the best fit, and which have distributions that are less multimodal, but still not as simple as80°.
FIG. 10. Bubble resonance distributions~50 s of brook data each!: ~a!:location A; ~b! location B. Two data sets,~i! and~ii !, are taken at each siteAcquisition: 10 ksamples/s with 5-kHz low-pass filter; damping 100@s21#;Gabor coefficient for bubble count: threshold533mean, gradient50.3. Thenumber of samples in each data set was 500 000; with 128 sample poineach time interval for the TFR.
FIG. 11. Comparison of measured bubble density distributions with thretical curves forD51 andm5` are shown.R0 is normalized to 1 mm.
1831 J. Acoust. Soc. Am., Vol. 103, No. 4, April 1998
sgd
gthe
ot-nds-to
r
Figures 14 and 16 record the results for varying florates, and constant angles~55° in Fig. 14; 70° in Fig. 15!. Asexpected, the numbers of bubbles entrained increasesflow rate in both cases. Multiple peaks are observed@see forexample Figs. 14~b! and 15~b!#. Except for the triviallysimple distribution presented in Fig. 15~a!, the distributionsare of the higher dimensions@D52 or 3 throughout Fig. 14;D53 for Fig. 15~b! and ~c!#.
V. DISCUSSION
This study reports measurements of three experimesystems: the comminution of a disk of air trapped betwetwo solid plates; and the generation of bubble populatiobeneath a natural waterfall and a plunging liquid jet. Tdata sets are then compared with a theory which the auth30
sets out as being a simple, ‘‘rough,’’ first approach to tproblem. As such, close agreement between theorymodel would not be expected.
The best agreement is obtained for the most ‘‘artificiascenario~in terms of geometry and mode of fragmentation!,that is, the comminution of an air disk. In this, a single cavbreaks up, in keeping with a key assumption of the theoThe fit between theory and data is poorer for the two acotically measured processes. Although attempts to find afit lead to the application of a one-dimensional model for twaterfall, and higher dimensions for the jet, even soagreement is not good, with the occurrence of multiple pein the measured distributions~the current theory can onlyproduce unimodal fits!.
There are a number of factors which, while being intrisic components of generation of bubble populations unwaterfalls and plunging jets, do not have immediate counparts in the theory. Both of these processes involve, tgreater or lesser extent, a surface. To a first approximat
in
-
FIG. 12. The data from the waterfalls which were displayed in Fig. 11condensed to four points~°! on the standard deviation/skewness plane. Tpoints are labeled~a!–~d! to show the dataset in Fig. 11 to which they refeThis display allows a comparison with the predictions obtained from vari(D,m) combinations: For each ofD51, 2, and 3, the range of values fromm51 to m5` is shown.
1831Leighton et al.: Bubble entrainment and comminution

FIG. 13. Histograms of~i! number of bubblesN against bubble natural frequenciesf ; and ~ii ! dN/d@ ln(R0)# as a function of bubble radiusR0 . R0 isnormalized to 1 mm. Part~ii ! shows the best fit theoretical curves, with the value ofD shown~the best-fit value ofm is ` throughout!. Each data set is takenover a period of 5 s. Jet flow rate 2.5 l/min. Surface-to-nozzle angle:~a! 80°; ~b! 75°; ~c! 70°; ~d! 60°; ~e! 55°; ~f! 50°; ~g! 40°; ~h! 30°.
emscud
ssn
sux-rsdha
y
enigaerp
oal
theter-
tersallulten-nslta-a
ghthe
’’ghjet,(wogleswo
ae
this surface is planar and ‘‘infinite,’’ and its disturbanccauses closure and detachment, and therefore the entrainof some daughter bubbles. While subsequent break-upthese bubbles would more closely fit the model, how acrately the free-surface event is described by the theorypends on details of the closure and detachment proceHowever, during the period in which these ‘‘subsequebreak-ups’’ occur, coalescence might also become an isA double peak in the population distribution might, for eample, be observed if a preferential bubble size is fiformed, and, later, coalesces. In addition to these fluidnamic issues, contributions from collective oscillations in twaterfall do not reflect bubble entrainment in the same was single-bubble emissions, but are interpreted as such bmeasurement system.
There are other factors inherent in bubble entrainmprocesses which might more readily be discussed in the lof the assumptions of the theory. Figure 16 shows the frmentation of large bubbles following injection. The lowbubble has the ‘‘hourglass’’ form characteristic of a shaoscillation dominated by a second-order (n52) axisymmet-ric spherical harmonic perturbation, an extreme versionwhich would divide it into two daughters of roughly equ
1832 J. Acoust. Soc. Am., Vol. 103, No. 4, April 1998
entof-
e-es.te:
ty-eythe
thtg-
e
f
size ~indeed the upper bubble was generated in this way!.40
Such low order shape oscillations may be modeled byinsertion of small numbers of planes at specific sites demined by the mode value,n, and not randomly as thetheory30 assumes. They will generate a number of daughof similar size, but few bubbles which are either very smor of a size comparable with the mother bubble. As a resone would expect the size distributions obtained experimtally when this occurs to show smaller standard deviatiothan are predicted by the theory. The assumption of simuneous insertion will be true for all planes related to minimin a given mode. However fragmentation may occur throua series of sequential shape oscillations, as indicated bypreliminary optical study. Figure 7 shows a ‘‘motherbubble undergoing fragmentation into four bubbles throurepeated division into halves. The mother is bisected by athe position of which is determined by a second ordern52) oscillation, and the same fate befalls the resulting tdaughters. The description entails the insertion of a sinplane associated with then52 oscillation on three occasion~once in the original bubble, and then once in each of its tdaughters!. Figure 6 shows a bubble being fragmented bythird-order (n53) shape oscillation, corresponding to th
1832Leighton et al.: Bubble entrainment and comminution

te
c
toth-a
o
s
o
o
l
h
e
ion
simultaneous insertion of the two parallel planes associawith the n53 mode, to produce three daughter bubbles.
However Fig. 16 also shows another method of produing daughter bubbles: The small bubbles in the picture we‘‘pinched off’’ from the peaks of capillary waves visible athe narrowest region of the lower bubble, and over muchthe upper bubble. Such capillary wave action can leavemother relatively intact,41 equivalent to the simultaneous insertion of planes at positions close to the bubble wall; or mdisintegrate the mother entirely.42
In a complicated entrainment event a great numberprocesses may occur, involving~as seen in Fig. 16! bothshape oscillations~where plane insertion is biased towardthe bubble center! and capillary waves~where the bias istoward the walls!. Being based upon a random positioning oplanes, it is clear that the theory of Longuet Higgins30 takesaccount of neither shape oscillations nor capillary wavesany individual bubble. However it is not clear to what extenthe superposition of many shape and surface oscillations
FIG. 14. Histograms of~i! number of bubblesN against bubble naturalfrequenciesf ; and ~ii ! dN/d@ ln(R0)# as a function of bubble radiusR0 . R0
is normalized to 1 mm. Part~ii ! shows the best fit theoretical curves, withthe value ofD shown~the best-fit value ofm is ` throughout!. Each data setis taken over a period of 4 s. Surface-to-nozzle angle is 55°. Jet flow rate~a!0.30; ~b! 0.60; ~c! 1.05; ~d! 1.60 l/min.
1833 J. Acoust. Soc. Am., Vol. 103, No. 4, April 1998
d
-re
fe
y
f
f
ntc-
FIG. 15. Histograms of~i! number of bubblesN against bubble naturafrequenciesf ; and ~ii ! dN/d@ ln(R0)# as a function of bubble radiusR0 . R0
is normalized to 1 mm. Part~ii ! shows the best fit theoretical curves, witthe value ofD shown~the best-fit value ofm is ` throughout!. Each data setis taken over a period of 4 s. Surface-to-nozzle angle is 70°. Jet flow rat~a!0.50; ~b! 0.90; ~c! 1.05; ~d! 3.20 l/min.
FIG. 16. Photograph of the bubble population produced following injectthrough a cm radius nozzle.
1833Leighton et al.: Bubble entrainment and comminution

s
leop
ur
kultahsenofons
t o
s
rm
io
thn
it-ly
dermthd
gl
in-
ie
e
thehat
e-me
alfine
asbor
ple
r,’’
ing
J.
Soc.
nd
ti,
ter
ic
a
curring in a population may be modeled by a random potioning of planes.
VI. CONCLUSIONS
Data are obtained on the number and size of bubbproduced by bubble entrainment and comminution, bothtically ~for the comminution of air disk! and acoustically~using an automated signal recognition system for measments under both waterfalls and plunging liquid jets!. Com-parison is made with a theory which is based on the breaof a cubical air pocket. Assumptions regarding the simuneous insertions of planes at random positions througsingle gas body do not take account of the specific waywhich a self-contained air pocket may fragment. Entrainmmay often be a population event. It may be the simplicitythe model which makes it versatile as a diagnostic toolthe dimension of bubble breakup under different conditio
ACKNOWLEDGMENTS
The authors wish to acknowledge the funding supporthe Natural Environment Research Council~GR3/9992!, andthe three referees for their careful and constructive analyof this manuscript.
APPENDIX: GABOR EXPANSIONS
Computing the Gabor expansion of a signal is one foof time-frequency analysis. The signal, sayx(t), is repre-sented as a sum of scaled time and frequency shifted versof a prototype signal,g(t), specifically:
x~ t !5 (n52`
`
(k52`
`
Cn,kg~ t2nDt !e2p ikD f t
5 (n52`
`
(k52`
`
Cn,kgn,k~ t !, ~A1!
wheregn,k(t)5g(t2nDt)e2p ikD f , Cn,k are the coefficientsof the expansion, andDt andD f are the intervals in the timeand frequency domains respectively. It should be notedthe representation~A1! maps the continuous time functiox(t) to the doubly infinite discrete setCn,k . The existence ofthe representation~A1! is by no means assured. For a suable functiong(t), the sampling grid has to be sufficientfine,43 specificallyDtD f <1.
Representation~A1! allows one to considerx(t) as be-ing made up of a sum of functions of the form ofgn,k(t).Many choices of the prototype functions can be maGabor44 considered a Gaussian function of the basic foe2t2. This choice is problematic since the computation ofexpansion coefficients is difficult. Friedlander anco-workers36,37 present a decomposition based on sinsided exponentials, i.e.,g(t)5e2lt for t.0. The decayingexponential form closely mimics the sound of a decaybubble and it is this form of Gabor transform which is employed in this paper. By matching the functions,gn,k(t), tothe expected data set, the signal representation is efficand is robust to the adverse affects of noise.
1834 J. Acoust. Soc. Am., Vol. 103, No. 4, April 1998
i-
s-
e-
p-a
int
fr.
f
es
ns
at
.
e
e
g
nt
While Eq.~A1! is a representational form, it fails to givinformation about how to compute the coefficientsCn,k .This computation is made considerably more simple iffunctiong(t) and the time-frequency grid are chosen so tgn,k(t) form an orthogonal basis, such that
E gn,k~ t !gm,1~ t !* 50 unlessn5m and k51, ~A2!
and
E gn,k~ t !gm,1~ t !* 5j for n5k and k51. ~A3!
Combining this with Eq.~A1! leads directly to
Cn,k51
j E x~ t !gn,k~ t !* dt. ~A4!
It can be shown43 that if the basis is to be orthogonal then thgrid must be such thatDtD f 51. However choosing an orthogonal basis is incompatible with the desire for good tiand frequency localization of the basis functions.43
In cases whereg(t) does not generate an orthogonbasis, but is reasonably well behaved, it is possible to dea biorthogonal function,45 g(t), such that
E gn,k~ t !gm,1~ t !50 unlessn5m and k51, ~A5!
and
E gn,k~ t !gm,1~ t !5j for n5k and k51, ~A6!
wheregn,k(t)5g(t2nDt)e2p ikD f and hence
Cn,k51
j E x~ t !gn,k~ t !dt. ~A7!
The biorthogonal function for the one-sided exponential ha relatively simple analytic form and consequently the Gacoefficients based on that expansion are conceptually simto compute. Further, Friedlander and Porat37 present a highlyefficient algorithm, requiring only 2 FFTs.
1M. Minnaert, ‘‘On musical air-bubbles and sounds of running watePhilos. Mag.16, 235–248~1933!.
2C. Devin, ‘‘Survey of thermal, radiation and viscous damping of pulsatair bubbles in water,’’ J. Acoust. Soc. Am.31, 1654–1667~1959!.
3M. Strasberg, ‘‘The pulsation frequency of nonspherical bubbles,’’Acoust. Soc. Am.25, 536–537~1953!.
4M. Strasberg, ‘‘Gas bubbles as sources of sound in water,’’ J. Acoust.Am. 28, 20–26~1956!.
5T. G. Leighton and A. J. Walton, ‘‘An experimental study of the souemitted from gas bubbles in a liquid,’’ Eur. J. Phys.8, 98–104~1987!.
6M. Nicholas, R. A. Roy, L. A. Crum, H. Oguz, and A. Prosperet‘‘Sound emissions by a laboratory bubble cloud,’’ J. Acoust. Soc. Am.94,3171–3182~1994!.
7A. R. Kolaini, R. A. Roy, and L. A. Crum, ‘‘An investigation of theacoustic emissions from a bubble plume,’’ J. Acoust. Soc. Am.89, 2452–2455 ~1991!.
8A. R. Kolaini, R. A. Roy, L. A. Crum, and M. Yi, ‘‘Low-frequencyunderwater sound generation by impacting transient cylindrical wajets,’’ J. Acoust. Soc. Am.94, 2809–2820~1993!.
9A. R. Kolaini, R. A. Roy, and D. L. Gardner, ‘‘Low-frequency acoustemissions in fresh and salt-water,’’ J. Acoust. Soc. Am.96, 1766–1772~1994!.
10H. N. Oguz, A. Prosperetti, and A. R. Kolaini, ‘‘Air entrapment by
1834Leighton et al.: Bubble entrainment and comminution

ntng
A.je
ionog
de
i.
,’’
nd.
ro
nd
is
ills
y
o
se
er-
te
n
tern
.
III.
of
ro-
he
ns
o-.
an-
bor
n
se:
hic
p
cy
andng.
falling water mass,’’ J. Fluid Mech.294, 181–207~1995!.11D. Kusabiraki, H. Niki, K. Yamagiwa, and A. Ohkawa, ‘‘Gas entrainme
rate and flow pattern of vertical plunging liquid jets,’’ Can. J. Chem. E68, 893–903~1990!.
12D. Kusabiraki, M. Murota, S. Ohno, K. Yamagiwa, M. Yasuda, andOhkawa, ‘‘Gas entrainment rate and flow pattern in a plunging liquidaeration system using inclined nozzles,’’ J. Chem. Eng. Jpn.23, 704–710~1990!.
13P. A. Hwang, Y. K. Yu, and J. Wu, ‘‘Temperature effects on generatand entrainment of bubbles induced by a water jet,’’ J. Phys. Ocean21, 1602–1605~1991!.
14F. Bonetto and R. T. Lahey, ‘‘An experimental study on air carryundue to a plunging liquid jet,’’ Int. J. Multiphase Flow19, 281–294~1993!.
15A. K. Bin, ‘‘Gas entrainment by plunging liquid jets,’’ Chem. Eng. Sc48, 3585–3630~1993!.
16A. Prosperetti and H. N. Oguz, ‘‘Air entrainment upon liquid impactPhilos. Trans. R. Soc. London355, 491–506~1997!.
17H. C. Pumphrey and A. J. Walton, ‘‘Experimental study of the souemitted by water drops impacting on a water surface,’’ Eur. J. Phys9,225–231~1988!.
18H. C. Pumphrey, L. A. Crum, and L. Bjo”rno”, ‘‘Underwater sound pro-duced by individual drop impacts and rainfall,’’ J. Acoust. Soc. Am.85,1518–1526~1989!.
19H. C. Pumphrey and P. A. Elmore, ‘‘The entrainment of bubbles by dimpacts,’’ J. Fluid Mech.220, 539–567~1990!.
20H. Medwin, A. Kurgan, and J. A. Nystuen, ‘‘Impact and bubble soufrom raindrops at normal and oblique incidence,’’ J. Acoust. Soc. Am.88,413–418~1990!.
21H. Medwin and M. W. Beaky, ‘‘Bubble sources of the Knudsen sea nospectra,’’ J. Acoust. Soc. Am.86, 1124–1130~1989!.
22G. E. Updegraff and V. C. Anderson, ‘‘Bubble noise and wavelet sprecorded 1 m below the ocean surface,’’ J. Acoust. Soc. Am.89, 2264–2279 ~1991!.
23M. S. Longuet-Higgins, ‘‘An analytical model of sound production braindrops,’’ J. Fluid Mech.214, 395–410~1990!.
24H. N. Oguz and A. Prosperetti, ‘‘Bubble entrainment by the impactdrops on liquid surfaces,’’ J. Fluid Mech.219, 143–179~1990!.
25J. A. Nystuen, ‘‘Rainfall measurements using underwater ambient noiJ. Acoust. Soc. Am.79, 972–982~1986!.
26J. A. Nystuen and D. M. Farmer, ‘‘The influence of wind on the undwater sound generated by light rain,’’ J. Acoust. Soc. Am.82, 270–274~1987!.
27H. N. Oguz and A. Prosperetti, ‘‘Numerical calculations of the underwanoise of rain,’’ J. Fluid Mech.228, 417–442~1991!.
28F. Laville, G. D. Abbott, and M. J. Miller, ‘‘Underwater sound generatioby rainfall,’’ J. Acoust. Soc. Am.89, 715–721~1991!.
1835 J. Acoust. Soc. Am., Vol. 103, No. 4, April 1998
.
t
r.
r
p
e
f
,’’
r
29J. A. Nystuen, ‘‘Quantitative rainfall measurement using the underwasound field,’’ in Proceedings of the Fourth International Meeting oNatural Physical Processes Related to Sea Surface Sound, edited by T. G.Leighton ~University of Southampton, Southampton, 1997!, pp. 73–81.
30M. S. Longuet-Higgins, ‘‘The crushing of air cavities in a liquid,’’ ProcR. Soc. London439, 611–626~1992!.
31Y. Toba, ‘‘Drop production by bursting air bubbles on the sea surfaceStudy by use of a wind flume,’’ Mem. Coll. Sci. Kyoto A29, 313–343~1961!.
32G. Updegraff, ‘‘In situ investigation of sea surface noise from a depth1 meter,’’ Ph.D. University of California at San Diego, 1989.
33H. Medwin and A. C. Daniel, ‘‘Acoustical measurements of bubble pduction by spilling breakers,’’ J. Acoust. Soc. Am.88, 408–412~1989!.
34T. G. Leighton, W. L. Ho, and R. Flaxman, ‘‘Sonoluminescence from tunstable collapse of a conical bubble,’’ Ultrasonics35, 399–405~1997!.
35T. G. Leighton, M. F. Schneider, and P. R. White, ‘‘Study of dimensioof bubble fragmentation using optical and acoustic techniques,’’ inPro-ceedings of the Third International Meeting on Natural Physical Prcesses Related to Sea Surface Sound, edited by M. J. Buckingham and JPotter~World Scientific, Singapore, 1995!, pp. 414–428.
36B. Friedlander and A. Zeira, ‘‘Oversampled Gabor representation for trsient signals,’’ IEEE Trans. Signal Process.43, 2088–2094~1995!.
37B. Friedlander and B. Porat, ‘‘Detection of transient signals by the Garepresentation,’’ IEEE Trans. Acoust. Speech Signal Process.37, 169–180 ~1989!.
38S. W. Yoon, L. A. Crum, A. Prosperetti, and N. Q. Lu, ‘‘An investigatioof the collective oscillations of a bubble cloud,’’ J. Acoust. Soc. Am.89,700–706~1991!.
39W. Carey and D. G. Browning, ‘‘Low frequency ocean surface noiMeasurement and theory,’’ inSea Surface Sound, edited by B. R. Kerman~Kluwer, Boston, 1988!, pp. 361–376.
40T. G. Leighton, K. J. Fagan, and J. E. Field, ‘‘Acoustic and photograpstudies of injected bubbles,’’ Eur. J. Phys.12, 77–85~1991!.
41T. G. Leighton,The Acoustic Bubble~Academic, London, 1994!, Fig.4.31.
42G. W. Willard, ‘‘Ultrasonically induced cavitation in water: a step-by-steprocess,’’ J. Acoust. Soc. Am.25, 669 ~1953!.
43I. Daubechies, ‘‘The wavelet transform: A method for time frequenlocalisation,’’ in Advanced Spectral Analysis and Array Processing, Vol.1, edited by S. Haykin~Prentice-Hall, Englewood Cliffs, NJ, 1991!, pp.366–417.
44D. Gabor, ‘‘Theory of communication,’’ J. Inst. Electr. Eng.93, 429–457~1946!.
45M. J. Bastiaans, ‘‘A sampling theorem for the complex spectrogram,Gabor’s expansion of a signal in Gaussian elementary signals,’’ Opt. E~Bellingham! 20, 594–598~1981!.
1835Leighton et al.: Bubble entrainment and comminution