
Modeling the Santa Monica Freeway Corridor - UC Berkeley
72
UC Berkeley Research Reports Title Modeling the Santa Monica Freeway Corridor: Simulation Experiments Permalink https://escholarship.org/uc/item/011174v9 Author Skabardonis, Alexander Publication Date 2002 eScholarship.org Powered by the California Digital Library University of California
-
Upload
khangminh22 -
Category
Documents
-
view
1 -
download
0
Transcript of Modeling the Santa Monica Freeway Corridor - UC Berkeley

UC BerkeleyResearch Reports
TitleModeling the Santa Monica Freeway Corridor: Simulation Experiments
Permalinkhttps://escholarship.org/uc/item/011174v9
AuthorSkabardonis, Alexander
Publication Date2002
eScholarship.org Powered by the California Digital LibraryUniversity of California
ISSN 1055-1425
January 2002
This work was performed as part of the California PATH Program of theUniversity of California, in cooperation with the State of California Business,Transportation, and Housing Agency, Department of Transportation; and theUnited States Department of Transportation, Federal Highway Administration.
The contents of this report reflect the views of the authors who are responsiblefor the facts and the accuracy of the data presented herein. The contents do notnecessarily reflect the official views or policies of the State of California. Thisreport does not constitute a standard, specification, or regulation.
Final Report for MOU 362
CALIFORNIA PATH PROGRAMINSTITUTE OF TRANSPORTATION STUDIESUNIVERSITY OF CALIFORNIA, BERKELEY
Modeling the Santa Monica FreewayCorridor: Simulation Experiments
UCB-ITS-PRR-2002-1California PATH Research Report
Alexander SkabardonisUniversity of California, Berkeley
CALIFORNIA PARTNERS FOR ADVANCED TRANSIT AND HIGHWAYS
Modeling the Santa Monica Freeway Corridor:Simulation Experiments
Alexander SkabardonisInstitute of Transportations StudiesUniversity of California, Berkeley

ii
ACKNOWLEDGMENTS
This study was performed as part of the California's PATH (Partners for Advanced Transit andHighways) Program (MOU-362) at the Institute of Transportation Studies (ITS) University ofCalifornia Berkeley.
We appreciate the assistance and cooperation of Lyle Devries, Koo Hong Chung and Cameron Waite,graduate student researchers at UC Berkeley who carried out the simulation experiments.
iii
Modeling the Santa Monica Freeway Corridor: Simulation Experiments
A. Skabardonis June 2001 ABSTRACT The report describes the findings of a study to develop a simulation testbed for the Santa Monica freeway corridor. The study created one of the largest freeway corridor networks coded for the CORSIM microscopic simulation model. The coded network consists of about 10 miles of I-10 freeway and a surface street network with 75 signalized intersections. The results from the simulation experiments indicate that several CORSIM model parameters need to be adjusted in order to accurately simulate freeway facilities for California conditions. The calibrated CORSIM model produced reasonable and consistent results for freeway lane drops, merging areas and weaving sections. Similar results were obtained from the limited experiments with the INTEGRATION simulation model. Recommendations are provided for developing a comprehensive simulation testbed for the study area including data collection requirements, model application, model calibration and validation and analysis of alternative ATMIS strategies. Keywords: Freeways, Simulation Models, Traffic Flow

iv
EXECUTIVE SUMMARY Objectives and Methodology
Advanced traffic management and traffic information systems (ATMIS) offer significant potential for reducing traffic congestion and systematically improving the operation of freeway corridors. ATMS include freeway surveillance and incident management systems, ramp metering, and adaptive traffic signal control systems. ATIS technologies provide travelers with navigational information and routing advice based on real-time information. Traffic simulation models could provide both offline evaluation of ATMIS strategies, and online operation of proposed systems.
A comprehensive evaluation of the state-of-the-art simulation models was undertaken under a previous PATH sponsored research study (MOU-270, Skabardonis et al, 1998). MOU-270 concluded that CORSIM and INTEGRATION appeared as the most comprehensive models with applications to date for simulating freeway corridors. The objectives of this study were to apply these two simulation programs on representative portions of the Santa Monica freeway corridor in Los Angeles to determine which simulation program can best simulate the study area, and develop recommendations for undertaking large scale simulation testbeds. The latest versions of the selected models were obtained and became operational. Existing field data and input files from past simulation studies of the study area were assembled and reviewed. Next, the input data file required for the CORSIM model was created. Considerable effort was spent to debug and verify the accuracy of the input coding. Numerous simulation runs were performed and the results were analyzed to assess the effectiveness of each model in replicating observed freeway operating conditions. Findings
The study created one of the largest freeway corridor networks coded for the CORSIM microscopic simulation model. The coded network consists of about 10 miles of I-10 freeway (both directions) and a surface street network with 75 signalized intersections, most of them along three major parallel arterials. The coded network is available and can be used in research and deployment studies to evaluate alternative ATMIS scenarios, provided that accurate traffic demand data are available. The results from the simulation experiments indicate that several CORSIM model parameters need to be adjusted in order to accurately simulate freeway facilities for California conditions. The key parameters include the car-following sensitivity factor, lane changing aggressiveness factor and % of freeway through vehicles that yield to oncoming traffic. The calibrated CORSIM model produced reasonable and consistent results for freeway lane drops and merging areas. The calibrated CORSIM model also reasonably replicated observed traffic operations on eight real-world weaving test sites for a range of traffic conditions. Similar results were obtained from the limited experiments with the INTEGRATION simulation model. The report provides recommendations for developing a simulation testbed for the Santa Monica freeway corridor including data collection requirements, model application, model calibration and validation and analysis of alternative ATMIS strategies.
v
TABLE OF CONTENTS Acknowledgments ii Abstract iii Executive Summary iv Table of Contents v List of Tables vii
CHAPTER 1. INTRODUCTION 1
1.1 Problem Statement 1
1.2 Objectives of the Study 1
1.3 Organization of the Report 2
CHAPTER 2. BACKGROUND 3
2.1 Requirements for ATMIS Modeling 3
2.2 Evaluation of Existing Simulation Models 3
2.3 Santa Monica Freeway Corridor: Previous Simulation Studies 5
CHAPTER 3. METHODOLOGY 8
3.1 Selection of the Simulation Models 8
3.2 Simulation Models Operational 8
3.3 Database Update 9
3.4 Model Testing 10 3.4.1 Simulation of Known Conditions 10 3.4.2 Simulation of ATMIS Strategies 10
CHAPTER 4. CORSIM MODEL SIMULATIONS 11
4.1 Overview of the Model 11
4.2 Develop Baseline CORSIM Input File 12 4.2.1 Conversion of the CORFLO Input File into CORSIM Format 13 4.2.2 Network Coding Modifications 13 4.2.3 Debugging/Verification of Input Data Coding 15
4.3 Baseline Simulation Runs 17 4.3.1 Freeway Lane Drop Simulation Experiment 17 4.3.2 Freeway On-Ramp Merging Simulation Experiment 18 4.3.3 Freeway Weaving Sections Simulation Experiment 18
vi
CHAPTER 5. INTEGRATION MODEL SIMULATIONS 25
5.1 Overview of the INTEGRATION Model 25
5.2 Simulation Experiments 26 CHAPTER 6. CONCLUSIONS 27
6.1 Summary of the Study Findings 27
6.2 Recommendations for Developing a Simulation Testbed 28 6.2.1 Data Collection/Processing 28 6.2.2 Model Application 30 6.2.3 Calibration/Validation 32 6.2.4 Analysis of Alternatives 34 REFERENCES 36 APPENDIX A. TRB PAPER on SIMULATION MODELS A-1
vii
LIST OF FIGURES Figure 2.1 The Santa Monica Freeway Corridor 6 Figure 4.1 Structure of the CORSIM Input File 12 Figure 4.2 FRESIM (CORSIM) Coding of Multi-Destination Ramps 14 Figure 4.3 Santa Monica Freeway Corridor CORSIM Network 16 Figure 4.4 Freeway Lane Drop: CORSIM Results—Default Parameter Values 20 Figure 4.5 Freeway Lane Drop: CORSIM Results—Adjusted Parameter Values 21 Figure 4.6 Freeway On-Ramp Merge: CORSIM Results 22 Figure 4.7 Freeway Weaving Sections: CORSIM Results 24 Figure 5.1 Freeway Lane Drop: INTEGRATION Results 26 Figure 6.1 Process for Practical Application of Simulation Models 29 Figure 6.2 I-10W pm peak Speed Contour Plot from Loop Detectors—PeMS System 34
LIST OF TABLES Table 4.1 Weaving Sections Database 23
1
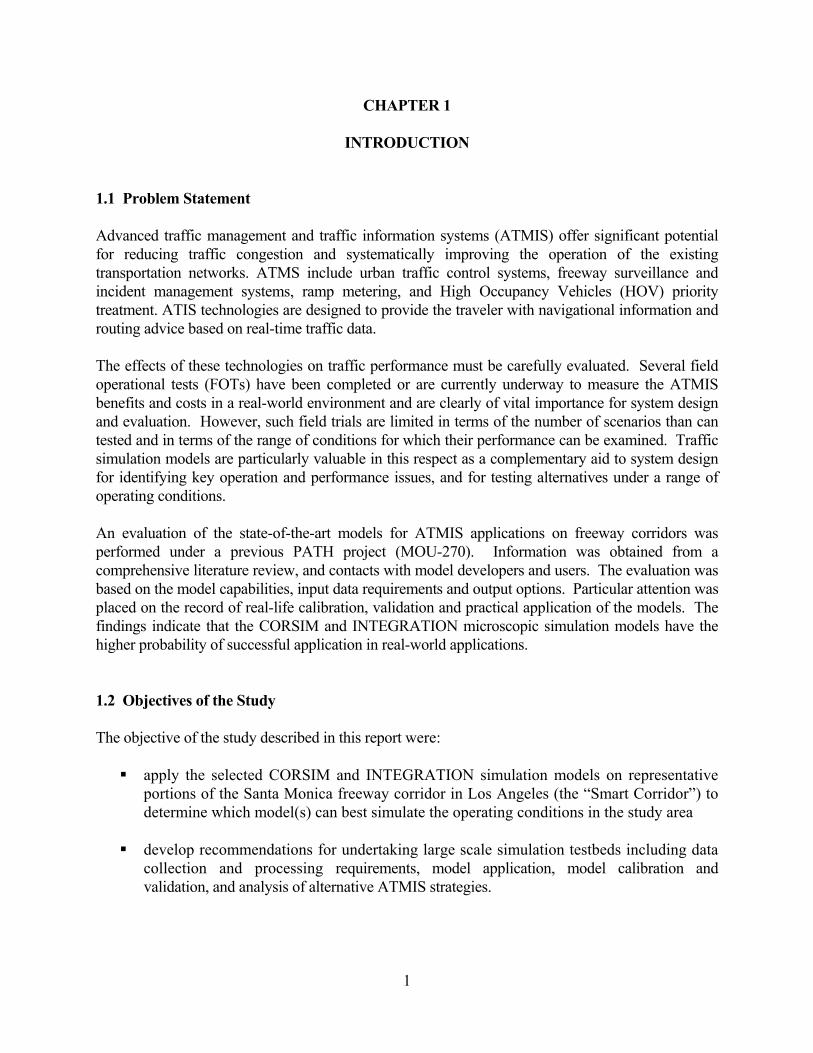
CHAPTER 1 INTRODUCTION 1.1 Problem Statement Advanced traffic management and traffic information systems (ATMIS) offer significant potential for reducing traffic congestion and systematically improving the operation of the existing transportation networks. ATMS include urban traffic control systems, freeway surveillance and incident management systems, ramp metering, and High Occupancy Vehicles (HOV) priority treatment. ATIS technologies are designed to provide the traveler with navigational information and routing advice based on real-time traffic data. The effects of these technologies on traffic performance must be carefully evaluated. Several field operational tests (FOTs) have been completed or are currently underway to measure the ATMIS benefits and costs in a real-world environment and are clearly of vital importance for system design and evaluation. However, such field trials are limited in terms of the number of scenarios than can tested and in terms of the range of conditions for which their performance can be examined. Traffic simulation models are particularly valuable in this respect as a complementary aid to system design for identifying key operation and performance issues, and for testing alternatives under a range of operating conditions. An evaluation of the state-of-the-art models for ATMIS applications on freeway corridors was performed under a previous PATH project (MOU-270). Information was obtained from a comprehensive literature review, and contacts with model developers and users. The evaluation was based on the model capabilities, input data requirements and output options. Particular attention was placed on the record of real-life calibration, validation and practical application of the models. The findings indicate that the CORSIM and INTEGRATION microscopic simulation models have the higher probability of successful application in real-world applications. 1.2 Objectives of the Study The objective of the study described in this report were:
apply the selected CORSIM and INTEGRATION simulation models on representative portions of the Santa Monica freeway corridor in Los Angeles (the “Smart Corridor”) to determine which model(s) can best simulate the operating conditions in the study area
develop recommendations for undertaking large scale simulation testbeds including data
collection and processing requirements, model application, model calibration and validation, and analysis of alternative ATMIS strategies.

2
1.3 Organization of the Report Chapter 2 of the report discusses key requirements for modeling ATMIS scenarios, presents the key findings from the evaluation of existing simulation models, and reviews past simulation studies on the Santa Monica freeway corridor. Chapter 3 describes the study methodology. The simulation experiments and the results are presented in Chapters 4 and 5. Chapter 6 summarizes the study findings and provides recommendations for undertaking a simulation study for the study corridor.
3
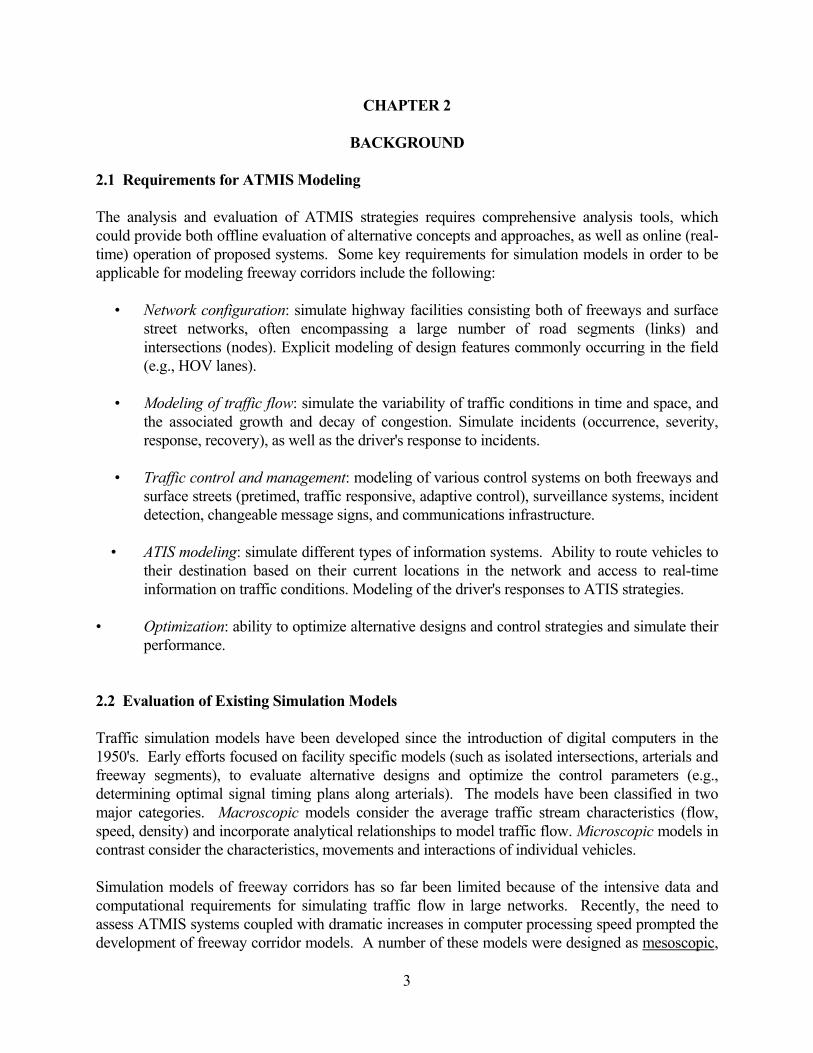
CHAPTER 2 BACKGROUND 2.1 Requirements for ATMIS Modeling The analysis and evaluation of ATMIS strategies requires comprehensive analysis tools, which could provide both offline evaluation of alternative concepts and approaches, as well as online (real-time) operation of proposed systems. Some key requirements for simulation models in order to be applicable for modeling freeway corridors include the following: • Network configuration: simulate highway facilities consisting both of freeways and surface
street networks, often encompassing a large number of road segments (links) and intersections (nodes). Explicit modeling of design features commonly occurring in the field (e.g., HOV lanes).
• Modeling of traffic flow: simulate the variability of traffic conditions in time and space, and
the associated growth and decay of congestion. Simulate incidents (occurrence, severity, response, recovery), as well as the driver's response to incidents.
• Traffic control and management: modeling of various control systems on both freeways and
surface streets (pretimed, traffic responsive, adaptive control), surveillance systems, incident detection, changeable message signs, and communications infrastructure.
• ATIS modeling: simulate different types of information systems. Ability to route vehicles to
their destination based on their current locations in the network and access to real-time information on traffic conditions. Modeling of the driver's responses to ATIS strategies.
• Optimization: ability to optimize alternative designs and control strategies and simulate their
performance. 2.2 Evaluation of Existing Simulation Models Traffic simulation models have been developed since the introduction of digital computers in the 1950's. Early efforts focused on facility specific models (such as isolated intersections, arterials and freeway segments), to evaluate alternative designs and optimize the control parameters (e.g., determining optimal signal timing plans along arterials). The models have been classified in two major categories. Macroscopic models consider the average traffic stream characteristics (flow, speed, density) and incorporate analytical relationships to model traffic flow. Microscopic models in contrast consider the characteristics, movements and interactions of individual vehicles. Simulation models of freeway corridors has so far been limited because of the intensive data and computational requirements for simulating traffic flow in large networks. Recently, the need to assess ATMIS systems coupled with dramatic increases in computer processing speed prompted the development of freeway corridor models. A number of these models were designed as mesoscopic,

4
simulating individual vehicles based on macroscopic flow relationships, and included dynamic traffic assignment (DTA) capabilities. An evaluation of the state-of-the-art models for ATMIS applications on freeway corridors was performed under a previous PATH project (MOU-270) (Skabardonis et al, 1998). Over 50 simulation models were identified. Information was obtained from a comprehensive literature review, and contacts with model developers and users. The evaluation was based on the model capabilities, input data requirements and output options. Particular attention was placed on the record of real-life calibration, validation and practical application of the models. Appendix A includes a paper presenting the models’ evaluation. The key findings of this evaluation process are summarized below for the leading simulation tools: INTEGRATION (Van Aerde, 1985): It appears as the most comprehensive single model
for ATMIS applications. Several studies by non-developers have demonstrated most of the model features. Problems were encountered on its application on the Santa Monica freeway corridor. However, the current model version (Van Aerde, 1996) overcomes several of the previous limitations regarding the simulation of traffic flow.
CORSIM (FHWA, 1995) : It is based on the widely used TRAF-NETSIM model, and the
FRESIM freeway model with a fairly good track record. Enhancements in user interface facilitate its practical application. Continuous support by FHWA and development of a number of control algorithms that can be readily interfaced with the simulation. Main limitation for current version the lack of features for ATIS modeling.
CORFLO (Lieu, 1991): Macroscopic modeling allows for fast execution times and analysis
of design and control scenarios. Several applications on freeways. The results from the applications in the Santa Monica freeway corridor were questionable. Lack of capabilities for simulating most of ATMIS applications.
PARAMICS (Duncan, 1995): Innovative software design and several modeling features
allow for comprehensive simulation of large networks. Applications in Britain show promising results, but there are limited applications in the US. The ongoing application and validation effort at UC Irvine would provide additional insights and experience regarding the capabilities of the model.
WATSim (Lieberman, 1996): The model is based on the well tested TRAF-NETSIM model
with several features to support ATMIS applications. However, there is a lack of application by non-model developers particularly on modeling freeways.
The findings from the models' evaluation indicate that CORSIM and INTEGRATION appear as the models with the higher probability of success in simulating real-life freeway corridors in the near-term. Therefore, it was recommended to apply both the CORSIM and INTEGRATION models to the Santa Monica freeway corridor in Los Angeles. The objectives of this application are: a) provide insights on the model capabilities in simulating the study area, and b) refine the data collection requirements based on the actual models usage, before developing a large scale simulation testbed. 2.3 Santa Monica Freeway Corridor: Previous Simulation Studies

5
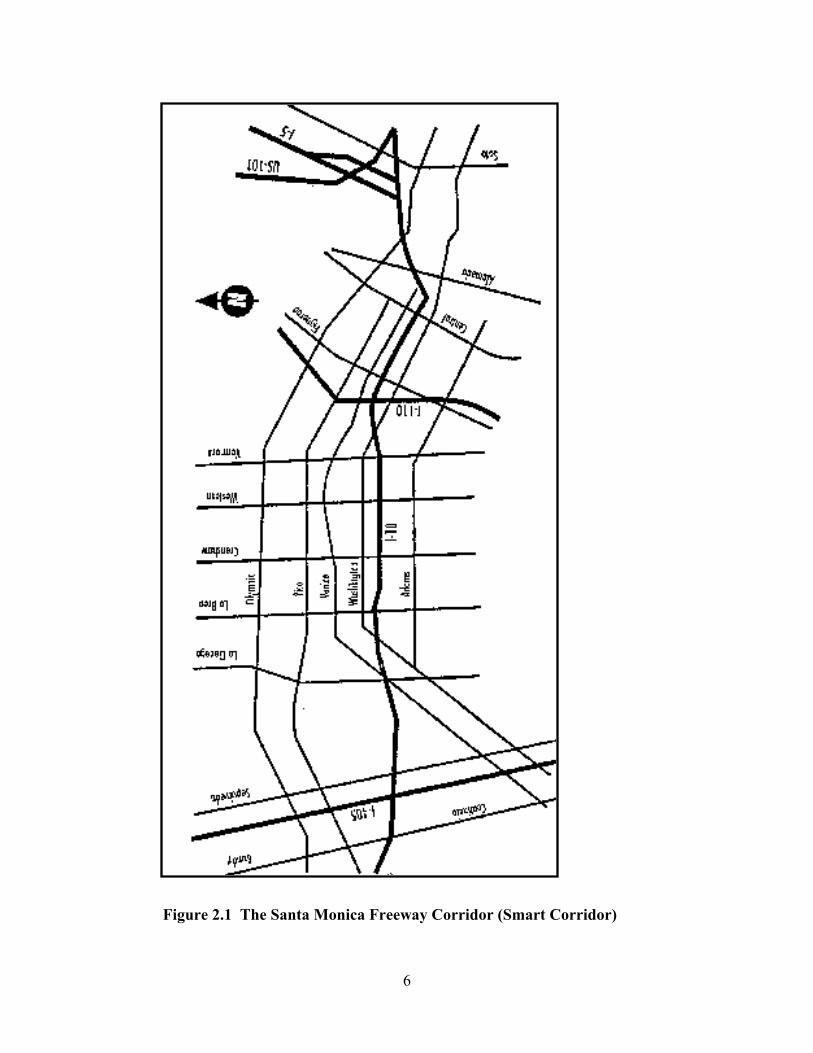
The Santa Monica freeway corridor (the “Smart Corridor”) is a joint demonstration project between the California Department of Transportation (Caltrans), Los Angeles Department of Transportation (LADOT), California Highway Patrol (CHP), Los Angeles Police Department (LAPD), Los Angeles Metropolitan Transportation Authority (LAMTA), and Southern California Rapid Transit District (SCRTD). The objectives are to improve traffic flow in the corridor through implementation of ATMIS strategies including ramp metering, signal timing optimization, incident management and motorist information systems. Advanced software and hardware is being implemented to allow the deployment of such strategies by the partner agencies in an integrated and coordinated fashion. The Smart Corridor includes a 14 mile section of the I-10 Santa Monica freeway (from the I-405 to the SR110) and a surface street network with five major parallel arterials and over 300 signalized intersections. Figure 2.1 shows a map of the Smart Corridor project area. The freeway section is instrumented with loop detectors that provide real time data to the Caltrans District 7 Transportation Management Center (TMC). Traffic signals are controlled by the City of Los Angeles' Automated Traffic Surveillance and Control (ATSAC) signal control system and operate as coordinated, grouped in several subsystems. Work in off-line evaluation of selected ATMIS strategies in the Smart Corridor through simulation begun at University of California Berkeley since 1988, first by using the FREQ and TRANSYT simulation models (Al-Deek et al, 1988) and later the INTEGRATION model (Bacon et al, 1995). Another simulation study was performed independently by the City of Los Angeles using the CORFLO simulation model (JHK at al, 1996). In the first study, the FREQ8 macroscopic simulation model for freeways and the TRANSYT-7F model for arterial streets were used to investigate the benefits of in-vehicle traveler information systems for recurrent and non-recurrent congestion. The study corridor included a 10 mile section of the Santa Monica freeway and three parallel arterials (Adams, Washington, and Venice). The FREQ8 model was calibrated by comparing observed freeway bottleneck locations and travel times. The arterial network was modeled using the TRANSYT-7F model, and calibrated using measured travel times along major arterials. The shortest travel times for each route through the corridor was calculated using the predicted travel times from the simulation models on the freeway and the arterials. The difference between the “freeway biased” route travel time and the shortest path travel time represents the time savings for those drivers with “perfect” information on real-time travel times who divert to the shortest path in the event of congestion on the mainline freeway. The results indicated that the travel time savings were much higher under incident conditions than savings under non-incident conditions. It was assumed that the proportion of drivers diverting to the surface streets is not large enough to cause significant changes in demand patterns (i.e., no re-assignment of traffic) on the study corridor.
6
Figure 2.1 The Santa Monica Freeway Corridor (Smart Corridor)

7
The second study used the INTEGRATION microscopic simulation model to model the entire Smart Corridor project area without restrictive assumptions on market penetration levels for vehicles equipped with traveler information systems. First, the accuracy of the INTEGRATION model was tested through a series of simulation experiments including modeling straight-pipe freeway sections, on-ramp merges, freeway sections with HOV lanes, and signalized arterials. Comparisons of the model predictions with theoretical results and field measurements indicated that INTEGRATION produced reasonable results. Next, the network was coded into the model. The study network consisted of 111 origin and destination nodes, 1747 nodes, and 3286 links. An extensive effort was undertaken to create synthetic origin-destination demand matrices required by the software for each half hour time slice from 6:00 am. to 8:00 pm. The results indicated that both accurate and complete input data, and enhancements to the INTEGRATION model are needed to produce a realistic simulation testbed for the entire corridor throughout the day. Model limitations included improved handling of vehicle interactions at signalized intersections (left-turning movements) and on links with complicated geometrics, as well as improving the traffic assignment algorithms and output features. The lack of comprehensive and consistent field data (on-ramp, off-ramp and turning movement counts at intersections) precluded the accurate estimation of the synthetically estimated O-D matrices. The entire Santa Monica freeway corridor project area was modeled using the CORFLO macroscopic simulation model, as part of the Smart Corridor project. The pm peak period was modeled. Considerable effort was spent to code the network and calibrate the model. The calibration was performed by LADOT using measured arterial travel times. However, the predicted delays were much higher than the actual field observed delays. Another limitation of CORFLO was the inability to re-assign traffic between the freeway and the surface streets, and the traffic demand changes had to be manually coded into the model. The previous simulation work on the smart corridor has provided valuable insights on the likely benefits of selected strategies, the data collection requirements for large scale simulations, and the capabilities and limitations of existing modeling tools. However, a detailed calibrated simulation testbed for the Smart corridor has not been completed largely because of both data and modeling limitations. Thus, there is still a need for a realistic simulation testbed for the study area.
8
CHAPTER 3
METHODOLOGY
3.1 Selection of the Simulation Models
Under the previous PATH research study (MOU-270) we identified and evaluated existing simulation models for freeway corridors and ATMIS applications. We also investigated the data availability on the Smart Corridor study area. The findings of the study can be summarized below: • CORSIM and INTEGRATION (version 2.0) appear as the most comprehensive models for
simulating freeway corridors. PARAMICS and WATSim are promising models but with limited application to-date.
• A comprehensive database and input files exist for the application of simulation models.
However, the availability of demand data (particularly O-D matrices) is limited and major data collection efforts would be required to produce an operational simulation testbed for the entire smart corridor.
The scope of this study is to apply and evaluate the CORSIM and INTEGRATION simulation models on representative portions of Smart Corridor to determine which model(s) can best simulate the selected freeway corridor, b) test the models’ capabilities in simulating ATMIS strategies.
The WATSim model was also available to the research team as part of the software development effort under a previous PATH project (MOU-172). However, it was not possible to include WATSim in the model testing given the time and budget constraints of the study. Also, WATSim currently is not available for general use by practitioners. The model can only be applied by the model developers in simulation studies.
The PARAMICS model has not been included in this evaluation because it is independently being tested by PATH staff at UC Irvine as part of the Southern California Testbed. 3.2 Simulation Models Operational The latest versions of the selected models CORSIM and INTEGRATION were obtained and installed on the research team's computers. Documentation of the use of the models is already in hand from the previous study (MOU-270).
CORSIM: The software was purchased from the McTrans Center. Software updates and the ITRAF interactive pre-processor also were provided from McTrans. Several Beta versions of the software with new features were also received from McTrans and FHWA throughout the study.
INTEGRATION is a proprietary software package. A copy of the software was received
free of charge by the developer Michael Van Aerde at the beginning of the study. An

9
updated model version were provided in June of 1999 (Van Aerde, 1999). Following the installation of the software, numerous model runs were performed with sample data sets to verify that the models are working correctly. 3.3 Database Update The scope of the study is to test the selected simulation models using previously collected data and input files for the Santa Monica freeway corridor. Therefore, the first step was to assemble and review previously collected field data and input data files. Next, create the input files required to run the CORSIM and INTEGRATION models. The following data were assembled from the previous simulation studies: a) the LADOT simulation effort using the CORFLO model, and the b) the modeling of the study area performed at UC Berkeley: Study area maps
Freeway and ramp geometrics (map, as-built plans and aerial photographs) Intersection geometrics and lane usage (LADOT ATSAC system intersection diagrams) Signal timing plans (LADOT ATSAC system) Ramp metering rates Arterial link volumes Freeway and ramp volumes Turning movement counts (approximately 100 intersections in the pm peak period) Link-node diagram of CORFLO coded network Link-node diagram of INTEGRATION coded network
Input data file for the CORFLO model (pm peak period) Input data files (including synthetic O-D matrices) for the INTEGRATION model The input file required for the CORSIM model, will be created from the existing CORFLO input data stream. CORFLO and CORSIM employ identical data input format with the exception of run control and program options. CORSIM also requires coding additional data for modeling actuated signals, ramp meters and surveillance systems. The existing input files for the INTEGRATION model include the coding of special left-turn links at signalized intersections. The coding of such links is no longer required for the latest model version, which explicitly handles left turn movements. However, it is required that additional information be coded for each network link (e.g., channelization, lane usage). The data files are currently being updated by a research team at UC Davis as part of another PATH research study, and will be made available to us to test the model. We will check and verify the data recoding. Following the update of the input data files, several model runs will be performed to verify that the input data have been coded correctly, and the models are working as intended. Input coding changes will be made as appropriate based on the review of the model runs.
10
3.4 Model Testing 3.4.1 Simulation of Known Conditions The selected simulation models will be tested on portions of the Smart Corridor using existing input and performance data for one peak period as follows: a) Freeway: a section of the freeway portion of the Smart Corridor for be simulated with each
model. Next, simulation runs will be performed and the runs will be analyzed to assess the effectiveness of each model in replicating observed freeway operating conditions.
b) Arterial: this test involves the modeling of an arterial (part of the Smart Corridor) to assess
the ability of the models in simulating surface street operations. The simulation results will be analyzed to assess the accuracy of the models.
c) Corridor testing: following the freeway and arterial tests, the selected models will be
applied to a portion of the Smart Corridor consisting of a freeway and a parallel arterial. Simulation runs will be performed to assess the model capabilities in simulating the existing conditions in the corridor.
The outcome of this test will determine the model to be used in simulating the entire Smart Corridor study area. 3.4.2 Simulation of ATMIS Strategies Apply the selected simulation models to test their ability in simulating ATMIS strategies. These strategies include the following: Ramp metering (local/systemwide) Signal timing optimization on surface streets Coordinated ramp metering and signal coordination Signal control to accommodate diversion Changeable message signs In-car information and guidance systems For each strategy, model capabilities, effort in data coding and model application and data requirements will be assessed.
11
CHAPTER 4
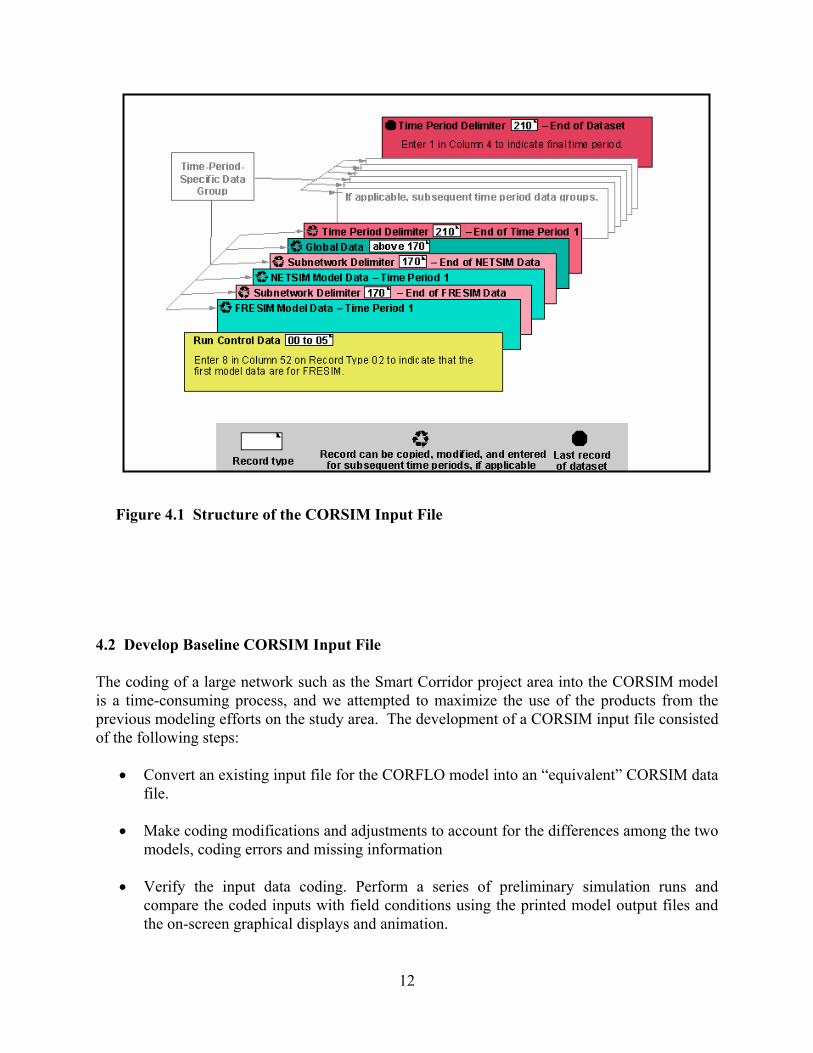
CORSIM MODEL SIMULATIONS 4.1 Overview of the CORSIM Model CORSIM is a microscopic stochastic simulation model consisting of the FRESIM model for freeways and the widely used TRAF-NETSIM model for the adjoining surface streets. Individual driver/vehicle characteristics are randomly assigned based on distributions of driver behavior and vehicle characteristics (up to 16 vehicle types). The movements and interaction of individual vehicles are simulated based on car-following, lane changing and queue discharge algorithms. CORSIM, probably by far has the most sophisticated algorithms for car-following and lane-changing to model traffic operations, oversaturated conditions and incidents. CORSIM can model a wide range of ATMS strategies, including pretimed and actuated signal controllers (isolated or coordinated), and local fixed-time or responsive ramp metering. It can simulate several types of surveillance systems and generate detector outputs (speed, flow, density) at user specified time intervals. Modeling of coordinated traffic responsive ramp metering is under development. However, the current version of CORSIM lacks traffic assignment algorithms and has very limited capabilities for modeling ATIS strategies. An enhanced model version with interfaces with dynamic traffic assignment algorithms is currently under development. This modeling system, called TrEPGS (Traffic Estimation, Prediction, and Guidance System), is currently being evaluated by the Oakridge National Laboratory (ORNL). CORSIM requires that the network is coded into links and nodes. Nodes represent intersections, and links one-way traffic streams. The interface of the freeway and surface streets subnetworks is handled through interface nodes. The input data are coded in a single ASCII file using "record (card) types" to distinguish between the various types of data. Each record type (RT) corresponds to specific inputs (e.g., freeway link geometrics). Figure 4.1 shows the structure of the CORSIM input data file. A graphical pre-processor (ITRAF) developed by ORNL is available for interactive data entry and editing through a graphical user interface (GUI). Because CORSIM is part of the FHWA’s TRAF family of models, the input coding is compatible with the input data file for the CORFLO macroscopic simulation model. Outputs from the CORSIM model include traffic performance measures (total travel time, moving time, delay time, queue time, stops, queue lengths) for each movement, link, network section and the total network. The model also calculates and reports air pollutant emissions and fuel consumption estimates per vehicle type. Several on screen graphical displays of input data and the results are provided including comparisons of MOEs from multiple computer runs, and animation of vehicle movements. CORSIM is operational under the Windows 95/98/NT/2000 operating system. The model runs under a shell software called TSIS, and includes the TRAFVue software for graphic displays and animation. The computer run time depends on the network size, number of vehicles processed, output options and control features been simulated.
12
Figure 4.1 Structure of the CORSIM Input File 4.2 Develop Baseline CORSIM Input File The coding of a large network such as the Smart Corridor project area into the CORSIM model is a time-consuming process, and we attempted to maximize the use of the products from the previous modeling efforts on the study area. The development of a CORSIM input file consisted of the following steps:
• Convert an existing input file for the CORFLO model into an “equivalent” CORSIM data file.
• Make coding modifications and adjustments to account for the differences among the two
models, coding errors and missing information
• Verify the input data coding. Perform a series of preliminary simulation runs and compare the coded inputs with field conditions using the printed model output files and the on-screen graphical displays and animation.

13
4.1.1 Conversion of the CORFLO Input File into CORSIM Format The input data file for the CORFLO model used as the starting point to develop a baseline CORSIM input file for the study area. This file simulates the pm peak period in a network that includes the I-10 freeway from Centinela Avenue (West of freeway I-405) on the West to freeway I-5 on the East, and five parallel arterials (Adams, Washington, Venice, Olympic, and Pico) with about 300 signalized intersections. Work on the file conversion began by examining the CORFLO input file structure and identifying the record types that include the same data. It was quickly realized that several changes were made to the latest CORSIM version and the input file is no longer directly compatible with the CORFLO input file structure, especially for the freeway network. For example, RT 15 in CORFLO specifies the length, number of lanes, special lanes (HOV), capacity, and free-flow speed for each freeway link. The same information is required in CORSIM (FRESIM), but the data must be specified in two separate RT’s, 19 and 20. Therefore, the file conversion required substantial manual editing to develop an input file with RT’s readable by CORSIM. 4.2.2 Network Coding Modifications Initial CORSIM runs using the file created as above produced numerous coding errors. It is important to note that CORSIM handles input file errors in systematic “Layers”. Once a certain error type has been corrected (and not until that error is completely corrected), the program looks for other errors within the data set. This process is repeated until no errors remain. The data set is examined hierarchically by the software to first find the lower-numbered errors, then work up to the higher-numbered errors. Most of the errors were related to the coding of the freeway sections and the connecting on- and off-ramps. Also, the coded nodes (intersections) on the surface streets exceeded the node and link size limit of the model. Freeway and ramp coding: The FRESIM freeway component model of CORSIM cannot directly model certain freeway geometric configurations, in particular, splitting and converging freeway ramp links. FRESIM does not allow a single lane on-ramp to diverge into multiple lanes for entering a freeway, or merge multiple lanes into a single lane off-ramp for exiting a freeway. To model such configurations, a dummy surface street link has to be inserted (part of the ramp link) and connected to two new ramp links with dummy nodes. The characteristics of the dummy link are identical to the actual ramp links. The dummy nodes are designated as interface nodes because the surface street link is modeled through NETSIM. This coding involves creating additional links and nodes, entering their characteristics into RT’s into NETSIM and specifying the appropriate traffic controls for the dummy nodes. Figure 4.2 illustrates the coding of an off-ramp splitting into a frontage road connected back to the freeway through an on-ramp, and to the surface street network. A series of surface street links have to be inserted to model the frontage road.

14
Figure 4.2 FRESIM (CORSIM) Coding of Multi-Destination Ramps Another source of numerous coding errors was the lack of coded auxiliary lanes in the original CORFLO input file. The CORSIM model requires that ramps are connected to the freeway mainline through acceleration, deceleration or full auxiliary lanes. Furthermore, the model requires that “lane balance” is maintained at each node (e.g., merge area). This means that the number of the lanes on the freeway and the ramp leaving the node should be greater or equal to the number of lanes entering the node. Therefore, most of the merging, diverging and weaving sections along the freeway mainline network had to be recoded with auxiliary lanes. In several instances, dummy links and nodes had to be coded to model complicated freeway geometrics with lane drops. Network Size: The CORSIM software can simulate up to a maximum of 250 nodes and 500 links on surface streets (NETSIM portion of the software), and 350 nodes and 600 links on freeways (FRESIM model). Therefore, the network size had to be reduced by adjusting spatial boundaries in order to be modeled with CORSIM.
Dummy Surface Street Links (NETSIM)
Freeway Links (FRESIM)
15
The revised network includes a section of I-10 freeway from the I-405 interchange to the West to I-110 to the East (the freeway network does not include the I-10/I-405 and I-10/I-110 interchanges). The revised surface street network includes three parallel arterials (Adams, Washington, and Venice), and about 75 signalized intersections. The reduction of the network proved to be a significant task. Most of the work involved deleting nodes and links, making sure that the link connectivity is maintained in the network, renumbering and shifting the network entry and exit nodes, and recalculating the input volumes at the entry nodes. The input volumes were calculated from the total link volumes and turning movements. In several cases such data were not available and had to be calculated from data available for the adjacent links and nodes. Once all these changes were made to the input data file, the CORSIM model was successfully run. 4.2.3 Debugging/Verification of the Input Data Coding Following the extensive modifications and adjustments, the “error free” input file was run through CORSIM. The model output was checked using the on-screen graphics and animation displays to verify that all the data have been entered correctly, as follows:
• The input geometrics were checked against aerial photographs of the I-10 freeway and intersection design diagrams
• Signal settings were checked against the signal timing cards from the ATSAC system
• Traffic volumes and turning movements were checked against available field measurements and outputs from previously calibrated simulation models (e.g., the FREQ model).
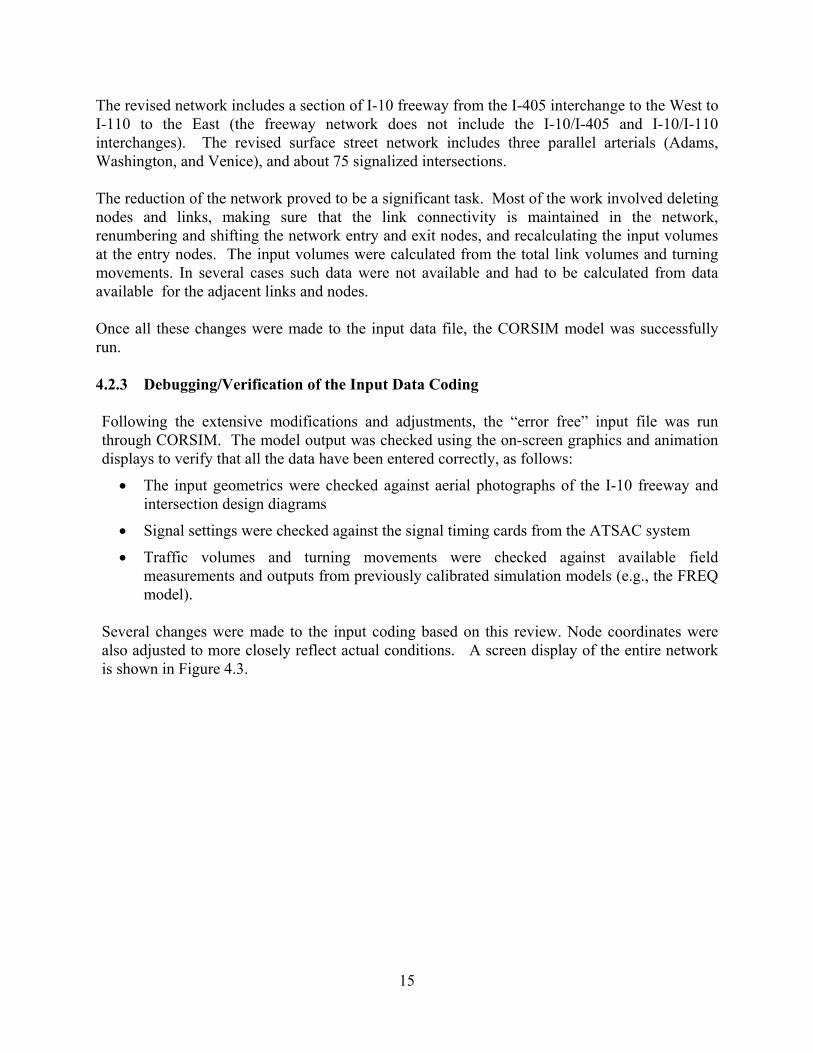
Several changes were made to the input coding based on this review. Node coordinates were also adjusted to more closely reflect actual conditions. A screen display of the entire network is shown in Figure 4.3.
16
Figure 4.3 Santa Monica Freeway Corridor CORSIM Network A. Entire Network
B. Network Detail
17
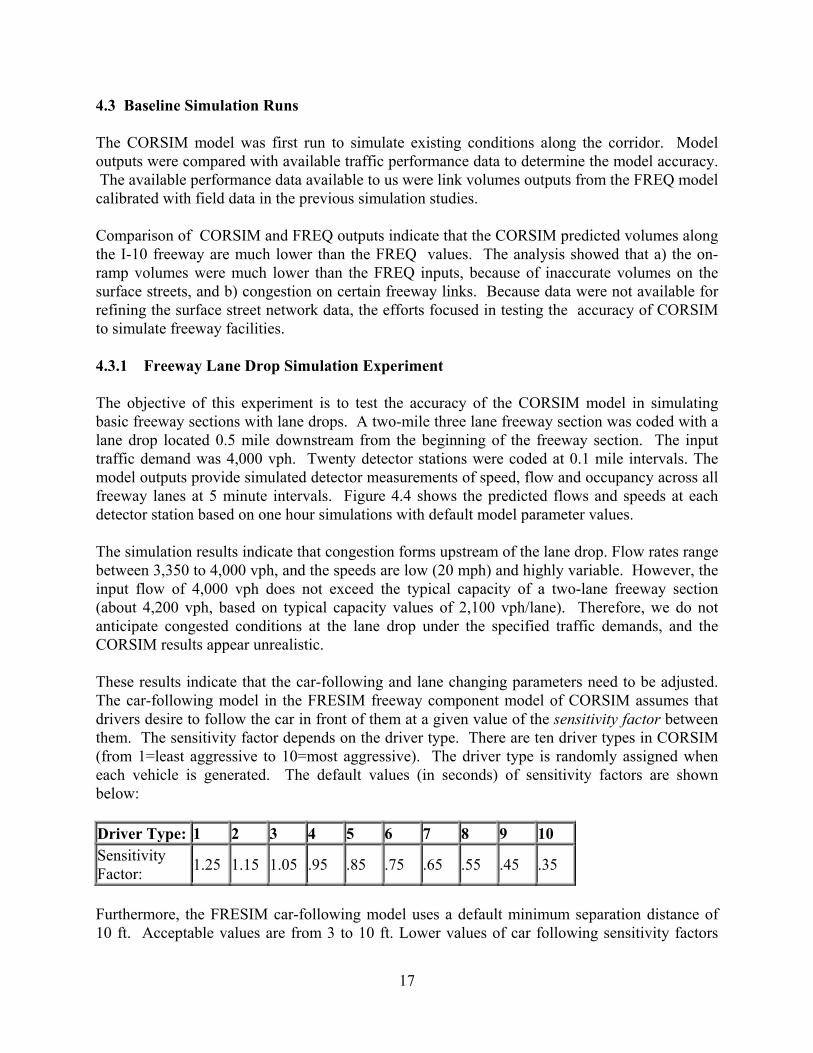
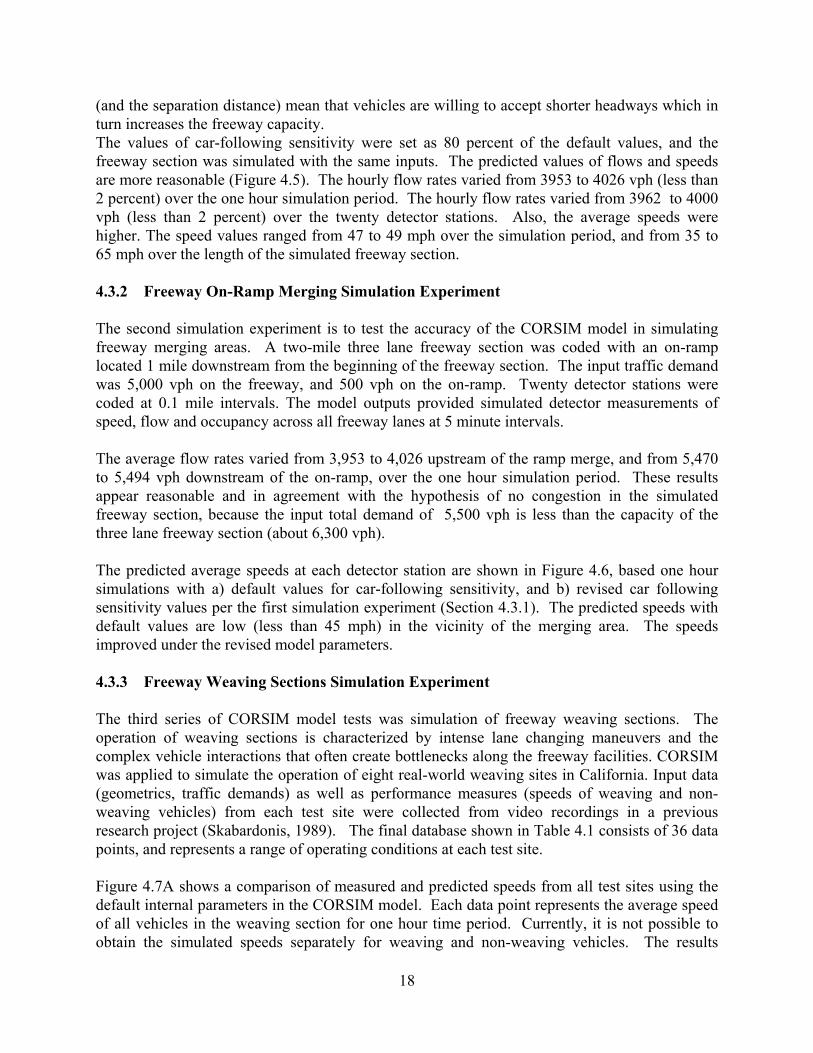
4.3 Baseline Simulation Runs The CORSIM model was first run to simulate existing conditions along the corridor. Model outputs were compared with available traffic performance data to determine the model accuracy. The available performance data available to us were link volumes outputs from the FREQ model calibrated with field data in the previous simulation studies. Comparison of CORSIM and FREQ outputs indicate that the CORSIM predicted volumes along the I-10 freeway are much lower than the FREQ values. The analysis showed that a) the on-ramp volumes were much lower than the FREQ inputs, because of inaccurate volumes on the surface streets, and b) congestion on certain freeway links. Because data were not available for refining the surface street network data, the efforts focused in testing the accuracy of CORSIM to simulate freeway facilities. 4.3.1 Freeway Lane Drop Simulation Experiment The objective of this experiment is to test the accuracy of the CORSIM model in simulating basic freeway sections with lane drops. A two-mile three lane freeway section was coded with a lane drop located 0.5 mile downstream from the beginning of the freeway section. The input traffic demand was 4,000 vph. Twenty detector stations were coded at 0.1 mile intervals. The model outputs provide simulated detector measurements of speed, flow and occupancy across all freeway lanes at 5 minute intervals. Figure 4.4 shows the predicted flows and speeds at each detector station based on one hour simulations with default model parameter values. The simulation results indicate that congestion forms upstream of the lane drop. Flow rates range between 3,350 to 4,000 vph, and the speeds are low (20 mph) and highly variable. However, the input flow of 4,000 vph does not exceed the typical capacity of a two-lane freeway section (about 4,200 vph, based on typical capacity values of 2,100 vph/lane). Therefore, we do not anticipate congested conditions at the lane drop under the specified traffic demands, and the CORSIM results appear unrealistic. These results indicate that the car-following and lane changing parameters need to be adjusted. The car-following model in the FRESIM freeway component model of CORSIM assumes that drivers desire to follow the car in front of them at a given value of the sensitivity factor between them. The sensitivity factor depends on the driver type. There are ten driver types in CORSIM (from 1=least aggressive to 10=most aggressive). The driver type is randomly assigned when each vehicle is generated. The default values (in seconds) of sensitivity factors are shown below: Driver Type: 1 2 3 4 5 6 7 8 9 10 Sensitivity Factor: 1.25 1.15 1.05 .95 .85 .75 .65 .55 .45 .35
Furthermore, the FRESIM car-following model uses a default minimum separation distance of 10 ft. Acceptable values are from 3 to 10 ft. Lower values of car following sensitivity factors
18
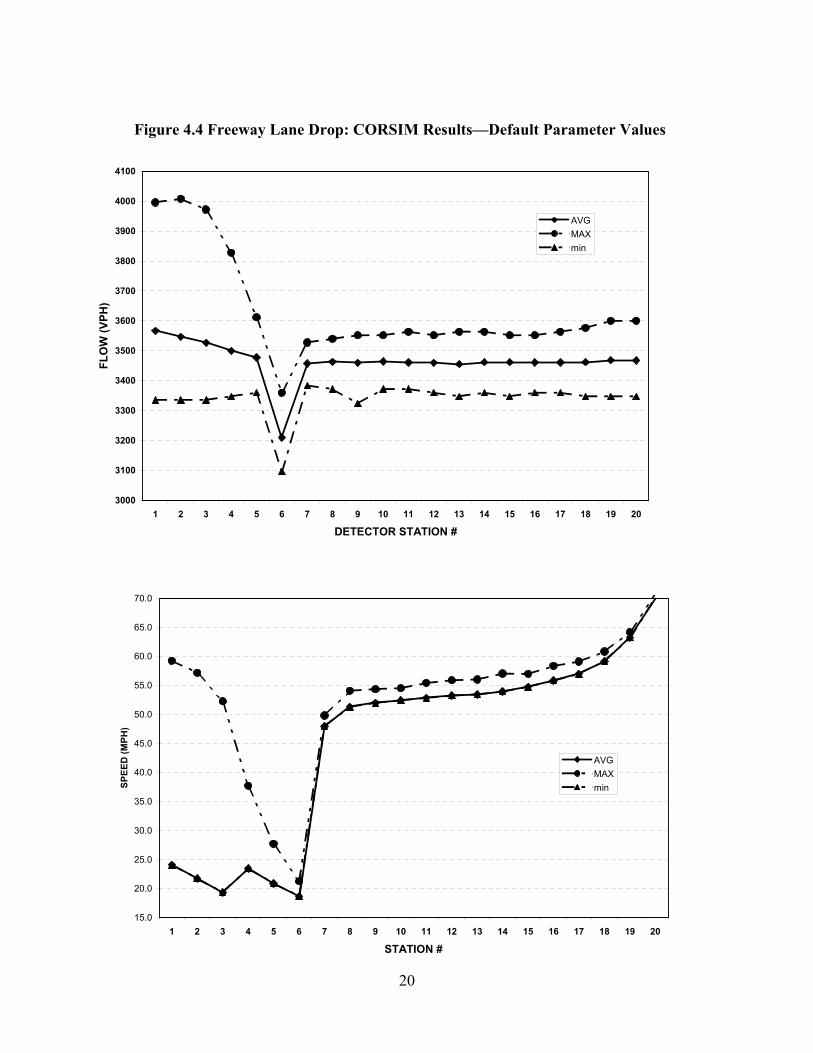
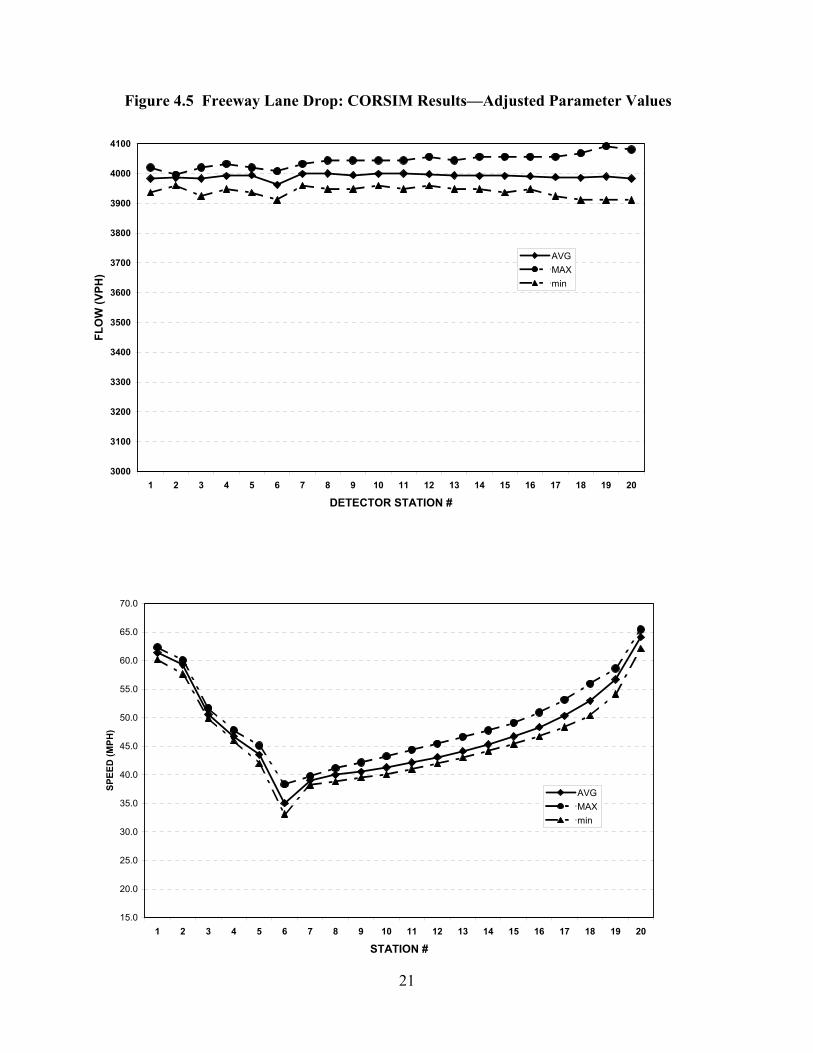
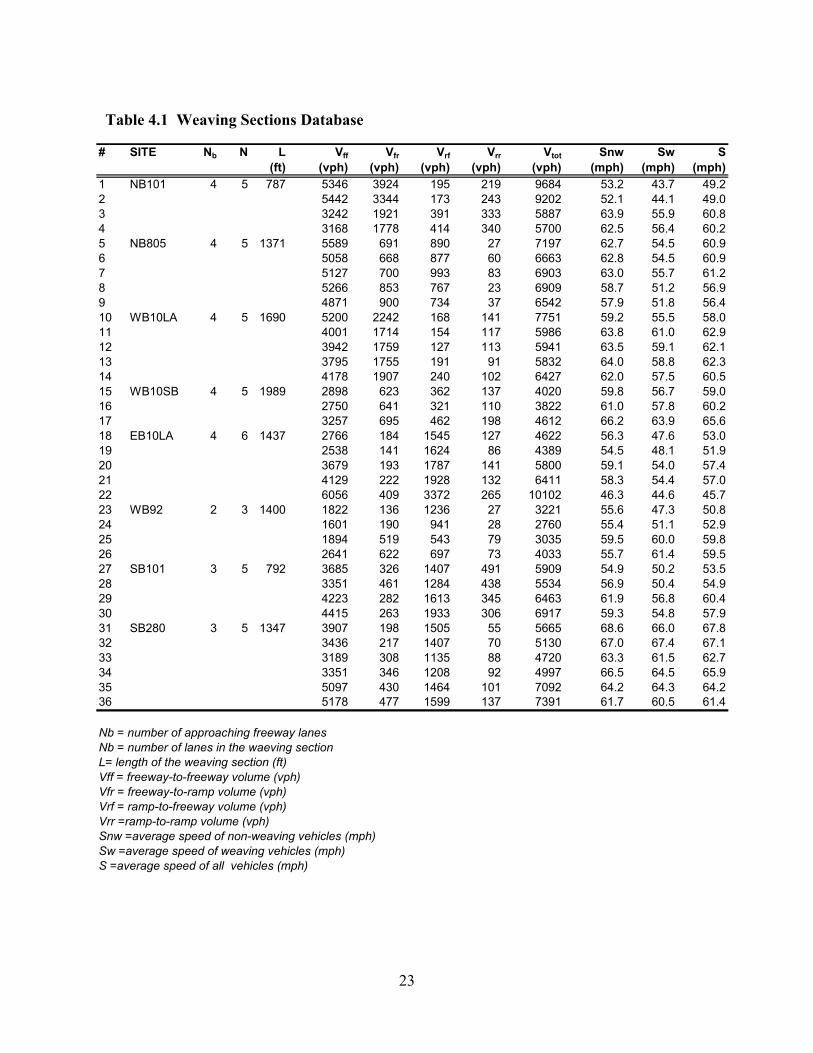
(and the separation distance) mean that vehicles are willing to accept shorter headways which in turn increases the freeway capacity. The values of car-following sensitivity were set as 80 percent of the default values, and the freeway section was simulated with the same inputs. The predicted values of flows and speeds are more reasonable (Figure 4.5). The hourly flow rates varied from 3953 to 4026 vph (less than 2 percent) over the one hour simulation period. The hourly flow rates varied from 3962 to 4000 vph (less than 2 percent) over the twenty detector stations. Also, the average speeds were higher. The speed values ranged from 47 to 49 mph over the simulation period, and from 35 to 65 mph over the length of the simulated freeway section. 4.3.2 Freeway On-Ramp Merging Simulation Experiment The second simulation experiment is to test the accuracy of the CORSIM model in simulating freeway merging areas. A two-mile three lane freeway section was coded with an on-ramp located 1 mile downstream from the beginning of the freeway section. The input traffic demand was 5,000 vph on the freeway, and 500 vph on the on-ramp. Twenty detector stations were coded at 0.1 mile intervals. The model outputs provided simulated detector measurements of speed, flow and occupancy across all freeway lanes at 5 minute intervals. The average flow rates varied from 3,953 to 4,026 upstream of the ramp merge, and from 5,470 to 5,494 vph downstream of the on-ramp, over the one hour simulation period. These results appear reasonable and in agreement with the hypothesis of no congestion in the simulated freeway section, because the input total demand of 5,500 vph is less than the capacity of the three lane freeway section (about 6,300 vph). The predicted average speeds at each detector station are shown in Figure 4.6, based one hour simulations with a) default values for car-following sensitivity, and b) revised car following sensitivity values per the first simulation experiment (Section 4.3.1). The predicted speeds with default values are low (less than 45 mph) in the vicinity of the merging area. The speeds improved under the revised model parameters. 4.3.3 Freeway Weaving Sections Simulation Experiment The third series of CORSIM model tests was simulation of freeway weaving sections. The operation of weaving sections is characterized by intense lane changing maneuvers and the complex vehicle interactions that often create bottlenecks along the freeway facilities. CORSIM was applied to simulate the operation of eight real-world weaving sites in California. Input data (geometrics, traffic demands) as well as performance measures (speeds of weaving and non-weaving vehicles) from each test site were collected from video recordings in a previous research project (Skabardonis, 1989). The final database shown in Table 4.1 consists of 36 data points, and represents a range of operating conditions at each test site. Figure 4.7A shows a comparison of measured and predicted speeds from all test sites using the default internal parameters in the CORSIM model. Each data point represents the average speed of all vehicles in the weaving section for one hour time period. Currently, it is not possible to obtain the simulated speeds separately for weaving and non-weaving vehicles. The results

19
indicate that CORSIM underpredicts the average speeds in most of the datasets by about 18 percent on the average. The value of the root mean square error (RMS) was 289.1. The CORSIM results depend on the values of several model parameters in the car-following and lane-changing algorithms. The results also depend on the placement of the off-ramp “warning sign” coded in the model. The simulated vehicles wishing to exit at the weaving section, start changing lanes at the location of the warning sign. The default value of the warning sign in the CORSIM model is 1500 ft upstream of the off-ramp. This distance may be too short for all vehicles to complete their required lane changes, especially for high freeway-to-ramp volumes. The simulation runs were repeated with the location of the warning sign specified as 3500 ft upstream of the off-ramp. Next, simulation runs were performed by changing the values of the following model parameters:
Car-following sensitivity: These values specify the minimum headway between vehicles per driver type. It is was discussed in Section 4.3.1, lower values result in higher capacity of the freeway section.
Time to complete the lane-changing maneuver: the default value in CORSIM is 30 tenths of a second. The model assumes that during this time interval, a vehicle occupies both lanes (original and target lane). Lower values of this parameter result in higher speeds.
% Yield value: this value represents the proportion of freeway through vehicles that move to the outer lanes to accommodate on-ramp merging vehicles in the weaving section. The default value is 20%. Increasing this value improves the simulated speeds in the weaving section.
Lane changing aggressiveness: The value of this parameter specifies the size of the minimum gap, as well as the maximum acceleration and deceleration drivers are willing to accept to complete their lane changing maneuver. It has numerical values ranging from 1 (most aggressive) to 6 (least aggressive).
Numerous simulation runs were performed using different values of the above parameters for each data set. The results were analyzed to determine the set of parameter values that produce the best match between predicted and observed speeds across all the test sites. Note that the selected values of the parameters are not necessarily the best one’s for each individual site. The objective was to determine parameter values that provide accurate speed estimates for a range of operating conditions, and can be used as typical values for the simulation of weaving sections in California. Figure 4.7B shows a comparison of measured and predicted speeds from all test sites using the best set of the parameters for car-following and lane changing in the CORSIM model. The results indicate that the CORSIM predicted average speeds are in close agreement with the field measurements. The average difference between observed and simulated speeds is about 1%, with a RMS value of 23.1. Most of the predicted speeds were within +5 mph to the measured values.
20
3000
3100
3200
3300
3400
3500
3600
3700
3800
3900
4000
4100
1 2 3 4 5 6 7 8 9 10 11 12 13 14 15 16 17 18 19 20
DETECTOR STATION #
FLO
W (V
PH)
AVGMAXmin
15.0
20.0
25.0
30.0
35.0
40.0
45.0
50.0
55.0
60.0
65.0
70.0
1 2 3 4 5 6 7 8 9 10 11 12 13 14 15 16 17 18 19 20
STATION #
SPEE
D (M
PH)
AVGMAXmin
Figure 4.4 Freeway Lane Drop: CORSIM Results—Default Parameter Values
21
3000
3100
3200
3300
3400
3500
3600
3700
3800
3900
4000
4100
1 2 3 4 5 6 7 8 9 10 11 12 13 14 15 16 17 18 19 20
DETECTOR STATION #
FLO
W (V
PH)
AVGMAXmin
15.0
20.0
25.0
30.0
35.0
40.0
45.0
50.0
55.0
60.0
65.0
70.0
1 2 3 4 5 6 7 8 9 10 11 12 13 14 15 16 17 18 19 20
STATION #
SPEE
D (M
PH)
AVGMAXmin
Figure 4.5 Freeway Lane Drop: CORSIM Results—Adjusted Parameter Values
22
40.0
45.0
50.0
55.0
60.0
65.0
70.0
1 2 3 4 5 6 7 8 9 10 11 12 13 14 15 16 17 18 19 20
STATION #
SPEE
D (M
PH)
AVGMAXmin
40.0
45.0
50.0
55.0
60.0
65.0
70.0
1 2 3 4 5 6 7 8 9 10 11 12 13 14 15 16 17 18 19 20
STATION #
SPEE
D (M
PH)
AVGMAXmin
Figure 4.6 Freeway On-Ramp Merge : CORSIM Results
B. Adjusted Parameters
A. Default Parameters
23
# SITE Nb N L Vff Vfr Vrf Vrr Vtot Snw Sw S(ft) (vph) (vph) (vph) (vph) (vph) (mph) (mph) (mph)
1 NB101 4 5 787 5346 3924 195 219 9684 53.2 43.7 49.22 5442 3344 173 243 9202 52.1 44.1 49.03 3242 1921 391 333 5887 63.9 55.9 60.84 3168 1778 414 340 5700 62.5 56.4 60.25 NB805 4 5 1371 5589 691 890 27 7197 62.7 54.5 60.96 5058 668 877 60 6663 62.8 54.5 60.97 5127 700 993 83 6903 63.0 55.7 61.28 5266 853 767 23 6909 58.7 51.2 56.99 4871 900 734 37 6542 57.9 51.8 56.410 WB10LA 4 5 1690 5200 2242 168 141 7751 59.2 55.5 58.011 4001 1714 154 117 5986 63.8 61.0 62.912 3942 1759 127 113 5941 63.5 59.1 62.113 3795 1755 191 91 5832 64.0 58.8 62.314 4178 1907 240 102 6427 62.0 57.5 60.515 WB10SB 4 5 1989 2898 623 362 137 4020 59.8 56.7 59.016 2750 641 321 110 3822 61.0 57.8 60.217 3257 695 462 198 4612 66.2 63.9 65.618 EB10LA 4 6 1437 2766 184 1545 127 4622 56.3 47.6 53.019 2538 141 1624 86 4389 54.5 48.1 51.920 3679 193 1787 141 5800 59.1 54.0 57.421 4129 222 1928 132 6411 58.3 54.4 57.022 6056 409 3372 265 10102 46.3 44.6 45.723 WB92 2 3 1400 1822 136 1236 27 3221 55.6 47.3 50.824 1601 190 941 28 2760 55.4 51.1 52.925 1894 519 543 79 3035 59.5 60.0 59.826 2641 622 697 73 4033 55.7 61.4 59.527 SB101 3 5 792 3685 326 1407 491 5909 54.9 50.2 53.528 3351 461 1284 438 5534 56.9 50.4 54.929 4223 282 1613 345 6463 61.9 56.8 60.430 4415 263 1933 306 6917 59.3 54.8 57.931 SB280 3 5 1347 3907 198 1505 55 5665 68.6 66.0 67.832 3436 217 1407 70 5130 67.0 67.4 67.133 3189 308 1135 88 4720 63.3 61.5 62.734 3351 346 1208 92 4997 66.5 64.5 65.935 5097 430 1464 101 7092 64.2 64.3 64.236 5178 477 1599 137 7391 61.7 60.5 61.4
Nb = number of approaching freeway lanesNb = number of lanes in the waeving sectionL= length of the weaving section (ft)Vff = freeway-to-freeway volume (vph)Vfr = freeway-to-ramp volume (vph)Vrf = ramp-to-freeway volume (vph)Vrr =ramp-to-ramp volume (vph)Snw =average speed of non-weaving vehicles (mph)Sw =average speed of weaving vehicles (mph)S =average speed of all vehicles (mph)
Table 4.1 Weaving Sections Database

24
25
30
35
40
45
50
55
60
65
25 30 35 40 45 50 55 60 65
MEASURED SPEED (mph)
CO
RSI
M P
RED
ICTE
D S
PEED
(mph
)
25
30
35
40
45
50
55
60
65
25 30 35 40 45 50 55 60 65
MEASURED SPEED (mph)
CO
RSI
M P
RED
ICTE
D S
PEED
(mph
)
Figure 4.7 Freeway Weaving Sections: CORSIM Results
A. Default Parameters
B. Adjusted Parameters
25
CHAPTER 5
INTEGRATION MODEL SIMULATIONS 5.1 Overview of the INTEGRATION Model INTEGRATION is a microscopic simulation and assignment model. It simulates combined freeway and arterial networks which experience time-varying congestion. The model assigns individual vehicles sequentially to a network that is already loaded with any previous departures that have not reached their destination. Up to five different driver/vehicle types are used to represent different routing behavior or various access privileges to real-time traffic conditions. INTEGRATION originally was designed as a mesoscopic model. Individual vehicles were simulated based on macroscopic speed-flow relationships. The latest version of the model is fully microscopic incorporating car-following and lane changing logic. The car-following algorithm is a kinematic model that calculates the individual vehicle speeds every deci-second based on the macroscopic parameters of free-flow speed, speed at capacity, capacity and jam density. Also, stop/yield sign control and unprotected left-turns at traffic signals are explicitly modeled through a gap acceptance logic. The field data required for the application of the model are the same as CORSIM. The major difference is that the traffic demands are specified in terms of O-D flows per time period, instead of entry volumes and turning fractions. Traffic control data include specifications of the control type (traffic signals/stop signs, ramp meters), and the control parameters (cycle length, phasing, green times and offsets). The network is coded into links and nodes. The data are coded in multiple ASCII files, each file corresponding to a specific data category (e.g., link data, control data, O-D data). The basic parameters/options for a model runs and the names of the input and output files are specified in a master file. There is no interactive preprocessor available for data entry. The data are coded using any text editor. INTEGRATION runs under the Windows operating system (DOS shell). The computer run times depend on the number of vehicles in the network, output options and features been simulated. The model requires a large amount of RAM computer memory to effectively simulate large networks. Model outputs include travel time for each vehicle type and for each O-D pair, number of stops, and networkwide values of fuel consumption and emissions. INTEGRATION provides on-screen animation of vehicle movements throughout the simulation run. The differences in the input coding schemes among the different models, does not permit the use of CORSIM input files to run the INTEGRATION model. The updated INTEGRATION input files from a PATH project at UC Davis were not made available to us. The only feasible option for testing INTEGRATION was to perform limited simulations on sample data sets, given the time and budget constraints of the study.
26
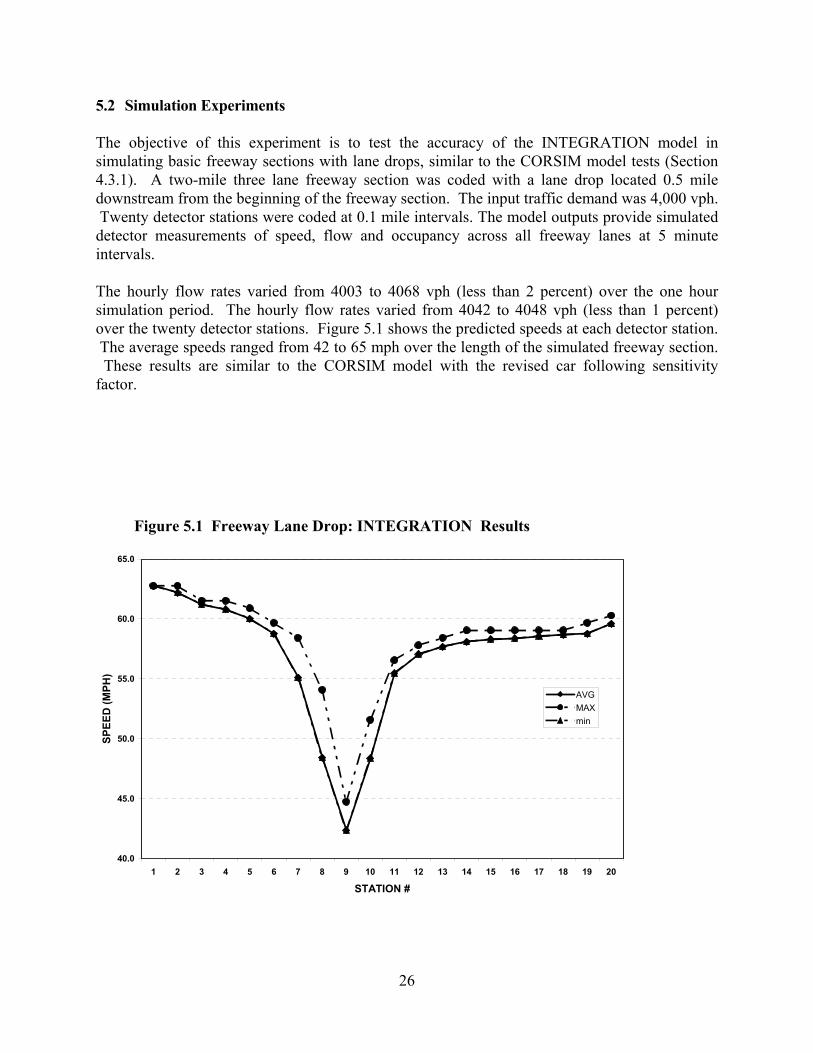
5.2 Simulation Experiments The objective of this experiment is to test the accuracy of the INTEGRATION model in simulating basic freeway sections with lane drops, similar to the CORSIM model tests (Section 4.3.1). A two-mile three lane freeway section was coded with a lane drop located 0.5 mile downstream from the beginning of the freeway section. The input traffic demand was 4,000 vph. Twenty detector stations were coded at 0.1 mile intervals. The model outputs provide simulated detector measurements of speed, flow and occupancy across all freeway lanes at 5 minute intervals. The hourly flow rates varied from 4003 to 4068 vph (less than 2 percent) over the one hour simulation period. The hourly flow rates varied from 4042 to 4048 vph (less than 1 percent) over the twenty detector stations. Figure 5.1 shows the predicted speeds at each detector station. The average speeds ranged from 42 to 65 mph over the length of the simulated freeway section. These results are similar to the CORSIM model with the revised car following sensitivity factor.
40.0
45.0
50.0
55.0
60.0
65.0
1 2 3 4 5 6 7 8 9 10 11 12 13 14 15 16 17 18 19 20
STATION #
SPEE
D (M
PH)
AVGMAXmin
Figure 5.1 Freeway Lane Drop: INTEGRATION Results
27
CHAPTER 6
CONCLUSIONS 6.1 Summary of the Study Findings The study created one of the largest freeway corridor network (part of the Smart Corridor) for the CORSIM microscopic simulation model. The coded network consists of about 10 miles of I-10 freeway (both directions) and a surface street network with 75 signalized intersections, most of them along three major parallel arterials. The coded network is available and can be used in research and deployment studies to evaluate alternative scenarios, provided that recent and accurate demand data are available. Lessons learned from this major effort include:
File conversions from related computer models (i.e., the CORFLO model) it is not straightforward. It should be expected that a significantly amount of manual recoding has to be undertaken to realistically simulate the study network.
Major limitations of the CORSIM model regarding coding freeway corridor networks
include a) the need to specify dummy interface nodes between freeway and surface street links, and b) the inability to directly code multi-destinational ramps, frontage roads and freeway-to-freeway connectors. Such limitations require special coding procedures that significantly increase the effort and cost to model the study area. The size limitations (maximum number of links and nodes that can be simulated) is another problem in modeling large networks.
Debugging and verification of the coded data is important but time consuming
undertaking. Users are required to view the network on the screen and compare with available information (e.g., maps and diagrams). The process would be greatly improved if the model would directly accept the data electronically (e.g., AutoCAD files) instead of manual coding.
Several simulation experiments were performed to assess how well the CORSIM and INTEGRATION models simulate freeway facilities, and to determine the best values of model parameters to accurate simulate freeway operations for California conditions. The major findings from the analysis of the simulation results are:
CORSIM with default values for the model parameters generally underpredicts the traffic performance for freeway lane drops, merging areas and weaving sections. The following parameters were found to significantly affect the CORSIM results: car–following sensitivity factor, lane changing aggressiveness factor and % of freeway through vehicles that yield to oncoming traffic.
The calibrated CORSIM model produced reasonable and consistent results for freeway lane drops and merging areas under undersaturated traffic conditions. Similar results were obtained from the limited experiments with the INTEGRATION simulation model.
28
The calibrated CORSIM model reasonably replicated observed traffic operations on all
eight real-world weaving test sites. The predicted average speeds were within +5 mph on most datasets. Good agreement between measured and predicted values was obtained for all the combinations of design characteristics and demand patterns.
6.2 Recommendations for Developing a Simulation TestBed Figure 6.1 shows the process for the practical application of simulation models. The various steps involved are described below with particular reference to the Santa Monica freeway corridor. 6.2.1 Data Collection/Processing Proper application of the simulation model(s) require a comprehensive set of input data, and traffic performance data for the comparison of field conditions and model predictions. Field data collection is expensive and time consuming. However, most of the required field data are available from recently performed traffic studies (e.g., traffic impact studies), or archived from surveillance systems. It is important to identify sources to obtain readily available data for the study area, and carefully design a data collection plan for missing data. The data collection plan should specify the a) the types of data to be collected, b) locations for the data collection, c) duration of the data collection (data samples required), d) the data collection methods, and e) the time periods of the day for data collection. The input data requirements for modeling the Santa Monica freeway corridor with the CORSIM and INTEGRATION models fall into three major categories: network (supply), demand and control. The following sections summarize the data needs/availability in each category based on the review of the existing databases and model applications.
Supply data: data on freeway and intersection geometrics are available in the form of maps, as built plans, intersection diagrams and aerial photos. The data were checked and updated for the portion of the corridor modeled in this study. These checks and updates need to be performed for the rest of the study corridor. Control data: ramp metering rates for all the metered ramps are available from the Caltrans District 7 TMC. Signal timing plans per time period for all the signalized intersections in the study area are available from the LADOT ATSAC system.

29
Figure 6.1 Process for the Practical Application of Simulation Models
30
Traffic demand data: freeway and arterial volumes are outdated and need to be collected from the Caltrans TMC and the LADOT ATSAC system. Turning movement counts need to be manually collected for each time period (am, midday and pm peak) at approximately 400 intersections. New O-D matrices need to be developed and calibrated using license plate survey data, and the turning movement counts. Freeway mainline and ramp volumes: volume and occupancy data (30 sec) can be obtained from the loop detectors, assuming that the surveillance and communications equipment are working properly. The PeMS system (Varaiya, et al, 2001) currently operational for the entire Caltrans District 7 freeway system since August of 2000, would provide the required data. Arterial volumes and intersection turning movements: arterial link volumes can be readily obtained from the ATSAC system. Turning movement counts need to be updated. The existing data consist of pm peak counts at approximately 100 intersections collected between 1988 and 1996. Origin-destination data: an O-D matrix has been prepared by the Southern California Association of Governments (SCAG) based on an O-D survey of 15,000 households in 1991. The data are available at the census tract level. The data may not be accurate for simulation (particularly with the INTEGRATION model) because travel patterns may have changed since 1991, and the sampling rate may not be sufficient to provide reliable estimates for a relatively small area, such as the Santa Monica Corridor.
The effort for developing a comprehensive database for modeling the Santa Monica corridor is estimated at approximately one staff year at a cost of about $115,000. This estimate assumes that turning movement counts will be collected for three time periods of the day (am , midday and pm peak), (with a large portion of the cost involving the conduct of license plate survey for O-D information). 6.2.2 Model Application The first step is to code the data into the model required input format. Users should design the network coding scheme (link and node designations) for consistency and expandability. Consistent link and node numbering facilitates the processing of the model output. Input coding is a tedious and time consuming activity especially for large networks and efforts should be directed toward automation of the process through a) converting from input files from other models, importing from existing databases (e.g., AutoCAD drawings, Geographic Information Systems--GIS), or using templates. Coding a network from scratch should be considered as the last option in the input coding process. A number of utilities exist for converting networks coded in planning models into traffic simulators, especially the INTEGRATION model. A GIS software has been developed by the City of Portland, Oregon to create input files for the INTEGRATION model. However, users should expect substantial effort in model coding even when they use other input files as the starting point.
31
It is also important to understand the coding requirements and limitations of the simulation model. Many “special” field conditions could be simulated reasonably well through creative input coding schemes. Examples include coding different vehicle classes to simulate unbalanced lane utilization by the traffic stream or turning restrictions at intersections. Following the input coding, the simulation model is executed to obtain the first simulation run. It should be expected that several preliminary model runs would be made to correct errors and warning generated by the model before getting a baseline simulation run for analysis. This was clearly demonstrated in the CORSIM model application. The analysis of the model output should pay particular attention to the following:
Input data verification: check all the input data to ensure that have been properly coded into the model. Using the models’ graphic displays and animation features verify that that the network topology and geometrics have been coded correctly, and the specified traffic control devices (signals, ramp meters) operate as intended. Often, small coding errors cause signals to “malfunction” in the simulation. For example, miscoding of phase flags and detectors in CORSIM could cause actuated signal phases not to serve certain movements. Adjust control and output options: simulation models offer several options in the amount and format of the output. The user should review the model printouts and select the specific outputs for calibration/validation and analysis of alternatives. Examples include generating detector data to produce density or speed contour maps, or aggregating link specific MOEs into segments (e.g., average speed of through traffic along an arterial). Test for reasonable results: first, check the simulated link volumes output by the model against the input data. For example, if the exiting volume from a link is lower than observed values, then the input volume, turning fractions or O-D flows may not have been coded correctly, or the signal timing (phase lengths) may be incorrect. If the data are correct then discrepancies are due to the differences in the model parameters to be adjusted in the calibration process. Other MOEs (speeds, delay and queue lengths) should also be checked to verify that the model is working as intended, and the results are consistent with the underlying model assumptions. Stochastic effects: CORSIM and most of the other microscopic models use random numbers to assign driver/vehicle characteristics (e.g., free flow speed, gap acceptance, vehicle length). Therefore, the model results would vary for different sequence of random numbers under the same input data. The stochastic variability depends on the network type and size, traffic conditions and control options been simulated, and the length of the simulation run. For example, the stochastic variability in the predicted average delay at a single intersection is much greater than the average travel time through a network of 30 signalized intersections. The stochastic variability could be assessed by either performing lengthy simulation runs and analyze intermediate results at user specified intervals, or performing multiple computer runs with different random number seeds to determine the mean value and confidence intervals for the predicted MOEs. Past experience with the CORSIM model indicates that for 30 minutes simulation runs, differences in the order of +3

32
percent for undersaturated networks are due to the stochastic variability of the model and not to the alternatives tested. Oversaturated traffic conditions in the network may create fairly large variability in the model predictions and require special procedures to achieve meaningful results. The time period of analysis and traffic demands should be specified in terms of multiple time intervals, with traffic demands below capacity in the first time interval. For example, simulation of the am peak hour (7-8 am) may require simulation of a two hour time period (6:30-8:30 am) with traffic demands specified in successive 15 to 30 minutes time-slices to accurately model the growth and decay of congestion.
6.2.3 Model Calibration/Validation Calibration is the process of adjusting the model parameters so the model results reasonably match observed traffic conditions. Validation consists of comparing the model predictions with field measurements and other information not used in the calibration to determine the model accuracy in replicating real-world conditions. Calibration and validation should be performed only if the input data to the model have been thoroughly checked and verified, and the model results appear reasonable. The calibration process requires that the user is familiar with a) the model principles, assumptions and limitations, and b) the operating conditions in the study network. Data requirements for calibration and validation primarily consist of field measurements on traffic performance (e.g., average travel times or speeds along the network links or routes, delay and queue lengths or cycle failures at traffic signals). Data may be also required to adjust model parameters (capacities, free-flow speeds, arrival patterns, saturation flows, and lost times). The performance data should be collected at the same time with the input data for the model application to ensure consistency between inputs (e.g., traffic counts) and outputs (e.g., travel time). Otherwise, it would be difficult to explain any discrepancies between simulated and observed performance measures; they may be due to model limitations, or may be to the differences in observed and simulated operating conditions due to seasonal variations, construction activities or other events. Users should also understand that in CORSIM capacity is a model output and not input. The capacity in microscopic models is determined based on the minimum headways drivers are willing to accept in car-following situations and the values of the critical gap for lane-changing, merging and crossing maneuvers. Given that these parameters are very difficult to observe in the field, the users have to adjust them systematically, run the model and compare the model predictions with observed performance measures. Alternatively, statistical procedures and other methods (genetic algorithms) may be used to determine the best parameter values. In real-world model applications with limited time and budget, the process of adjusting model parameters should first address the following questions:
• Does the model accurately predict the bottleneck location and the spatial and temporal extent of congestion?
• Does the model accurately predict the operation of critical intersections in the network? • Are the model travel time predictions along major routes (or segments) in agreement with
known traffic patterns?

33
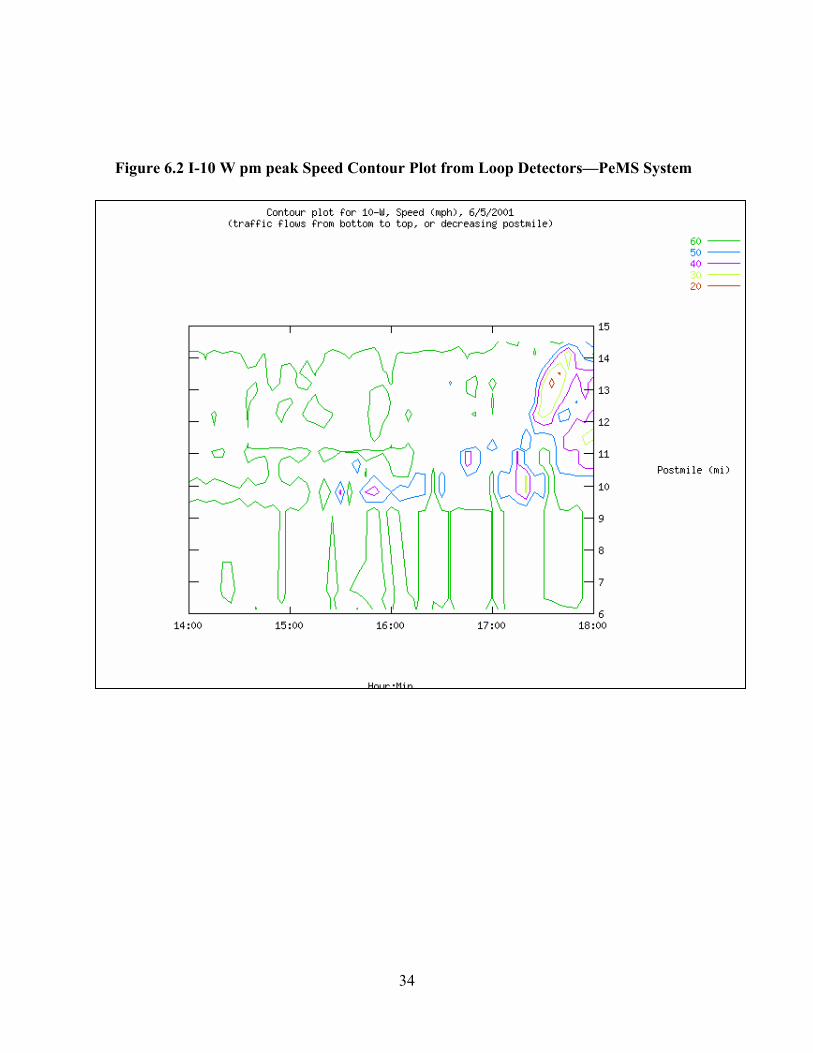
Data requirements for calibration include travel times on typical routes using instrumented vehicles for different time periods. This information is not currently available on the Smart corridor network expect of limited freeway floating car runs . Data on arterial travel times are outdated (collected in 18995 only for the pm peak period). However, estimates of intersection delay could be obtained from the ATSAC system from the arterial detector data. Speed (or density) contour plots from detector data are particularly useful in determining how accurately the simulation model replicates congestion patterns in freeways. Figure 6.2 shows a speed contour map for a westbound section of the I-10 freeway part of the Smart Corridor from the PeMS system. Discrepancies between observed and simulated congestion patterns may require changes of driver sensitivity factors (that control the minimum headways), distribution of driver aggressiveness and the mean values of critical gaps for lane changing and merging maneuvers. If contour plots are not available, then the values of the simulated volumes exiting the link (throughput) should be compared against field measurements. Differences between observed and predicted intersection operation may be due to incorrect values of saturation flows and lost times. These parameters should reflect driver behavior for the local conditions, and be consistent with the values used in other studies in the network. Often, differences in traffic performance are due to unequal lane utilization at the intersection approaches (e.g., a freeway on-ramp downstream of the intersection). In such situations, the link coding scheme should be revised. Discrepancies between observed and predicted queue lengths for permissive left turns are mostly because of lower (values) of mean critical gaps for turning maneuvers. Once the model correctly models the critical locations in the network and their congestion impacts, predicted travel times are generally in good agreement with observed data (differences are within +5-10 percent). Larger differences along a route (or in specific segments) are due to the mean or the distribution of free-flow speeds input to the model. The mean free-flow speed is the speed that the drivers wish to travel in the absence of other traffic and could be higher (or lower) than the posted speed limit. Also, the range of speeds in the default free-flow speed distribution often is too wide for commute traffic (e.g., the CORSIM defaults are 70 to 120 percent of the mean value). 6.2.4 Analysis of Alternatives The first step is to define the ATMIS scenarios to be investigated. Next, the time periods of analysis need to be defined. Alternatives may be assessed under both existing and future conditions, or they are assessed only for the future conditions to determine how well the impacts of traffic growth are mitigated. The design of experiment should also consider whether to model the proposed scenarios under “special” conditions (e.g., inclement weather, incidents, workzones). The input files for simulating the proposed alternatives are created by modifying the baseline calibrated datasets. Only, the changes required to implement each alternative should be coded and the model parameters should remain unchanged. Again, accurate data are needed for evaluating each alternative. Uncertainties in the input data (e.g., projected traffic demand) should be addressed through sensitivity analysis as discussed in the following section.
34
Figure 6.2 I-10 W pm peak Speed Contour Plot from Loop Detectors—PeMS System

35
The model predictions on the selected MOEs from the simulation of the alternative scenarios are compared to determine their impacts. The graphical displays and animation features in the simulation model greatly facilitate the understanding of the impacts of the proposed alternatives, and support the numerical analysis of the model predictions. The simulation results from the alternatives tested should be carefully analyzed and compared for: Individual links (e.g., critical network locations) Intersections (e.g., the critical intersection in the network) System components (e.g., arterial through traffic vs. cross-streets,) Total network Such analyses are important in order to quantify the impacts of the alternatives on each part of the system and identify trade-offs. For example, the coordination of isolated fully actuated traffic signals along an arterial is likely to significantly reduce the delay and stops for the arterial through traffic at the expense of the traffic on the cross-streets. Comparing the predicted MOEs under isolated and coordinated signal operation only for the total network would mask the true benefits and disbenefits of the proposed signal operations strategy. The analysis of the results should also carefully consider the following issues:
Model capabilities/assumptions: all simulation models are simplifications of real-world conditions, and there is not a single model available that can explicitly address all the possible scenarios. Therefore, the comparison of the results should consider the assumptions in simulating a particular scenario and the accuracy expected from the results. Stochastic variability: the evaluation of the differences in the MOEs among alternatives should consider the stochastic variability in the model results . Normally, a difference of +3 percent in the MOEs is a result of the models’ stochastic variability rather than the effect of the alternative’s tested. The analysis of baseline outputs should already have established estimates of the stochastic variability in the baseline model results and the process should be followed in the analysis of alternatives to determine if the changes in the MOEs are statistically significant. Oversaturated baseline conditions: if the baseline traffic conditions are oversaturated, project alternatives that result in undersaturated traffic conditions are likely to produce dramatic improvements in the MOEs that often seem questionable (e.g., 40 percent improvement in average speeds). Users should carefully check the simulation runs to verify that the model predictions are realistic, and ensure that existing oversaturated traffic conditions have been properly modeled. Sensitivity to projected inputs: sensitivity analyses should be performed particularly for assessing the impacts of future traffic growth and shifts in traffic patterns that have been derived from planning level analyses. Multiple simulation runs should be performed with a range of projected inputs to determine the sensitivity of the results to the projected inputs, and assist in the choice of the best project alternative.
36
REFERENCES 1. Al-Deek, H, et al, 1988, “Potential Benefits of In-Vehicle Information Systems in a Real Life
Freeway Corridor under Recurring and Incident-Induced Congestion,” PATH Research Report UCB-ITS-PRR-88-2.
2. Bacon, V., J. Windover, and A.D. May, 1995, “Investigating Intelligent Transportation
Systems Strategies on the Santa Monica Freeway Corridor,” PATH Research Report UCB-ITS-PRR-95-38.
3. Duncan G.I., 1995, "PARAMICS wide area Microscopic Simulation of ATT and Traffic
Management," 28th ISATA Conference, Stuttgart, Germany. 4. Federal Highway Administration, 1995, "CORSIM User's Manual, Version 1.0," ITS Research
Division, FHWA, US DOT, Washington, DC. 5. JHK Assoc., and Kaku Assoc, 1996, “Lessons Learned from the Trail of the CORFLO
Model,” Los Angeles. 6. Lieberman E., et al, 1996, "WATSim: Wide Area Traffic Simulation Model for Freeways and
Surface Streets," paper presented at the 75th TRB Annual Meeting, Washington, DC. 7. Lieu H., and A.J. Santiago, 1991, "CORFLO: An Integrated Traffic Simulation System for
Corridors," Traffic Management, Proceedings of the Engineering Foundation Conference, Palm Coast, Florida.
8. Skabardonis, A., A.D. May, and J. Dahlgren, 1998, “Modeling the Santa Monica Freeway
Corridor: A Feasibility Study,” PATH Research Report UCB-ITS-PRR-98-37. 9. Skabardonis, A., M. Cassidy, A.D. May and S. Cohen, 1989, “Application of Simulation to
Evaluate the Operation of Major Freeway Weaving Sections,” Transportation Research Record No. 1225, pp. 91-98.
10. Van Aerde M., 1985, "Modeling of Traffic Flows, Assignment and Queuing in Integrated
Freeway and Traffic Signal Networks,” PhD Dissertation, University of Waterloo. 11. Van Aerde M., et al, 1996, "INTEGRATION: An Overview of Traffic Simulation Features,"
paper presented at the 75th TRB Annual Meeting, Washington DC. 12. Van Aerde M., 1999, "INTEGRATION Release II.3 User's Guide," Transportation Systems
Research Group, Virginia Tech, Virginia. 13. Varaiya, P.P., et al, 2001, “Freeway Performance Measurement System (PeMS): Mining Loop
Detector Data,” paper presented at the 80th TRB Annual Meeting, Washington DC.
Paper No. 981275 P R E P R I N T
Duplication of this preprint for publication or sale is strictly prohibited without prior written permission of the Transportation Research Board.
Simulation Models For Freeway Corridors:
State-of-the-Art and Research Needs
Alexander Skabardonis
Adolf D. May
Institute of Transportation Studies University of California at Berkeley
Transportat ion Research Board 77th Annual Meeting January 11-15, 1998
Washington, D.C.
APPENDIX A

SIMULATION MODELS FOR FREEWAY CORRIDORS: STATE-OF-THE ART AND RESEARCH NEEDS by Alexander Skabardonis Institute of Transportation Studies University of California Berkeley, CA 94720-1720 Phone: (510) 642-9166 Fax: (510) 642-1246 e-mail: [email protected] Adolf D. May Institute of Transportation Studies University of California Berkeley, CA 94720-1720 Phone: (510) 642-9063 e-mail: [email protected] For presentation and publication 77th Annual Meeting Transportation Research Board January 1998 Washington, D.C. November 1997
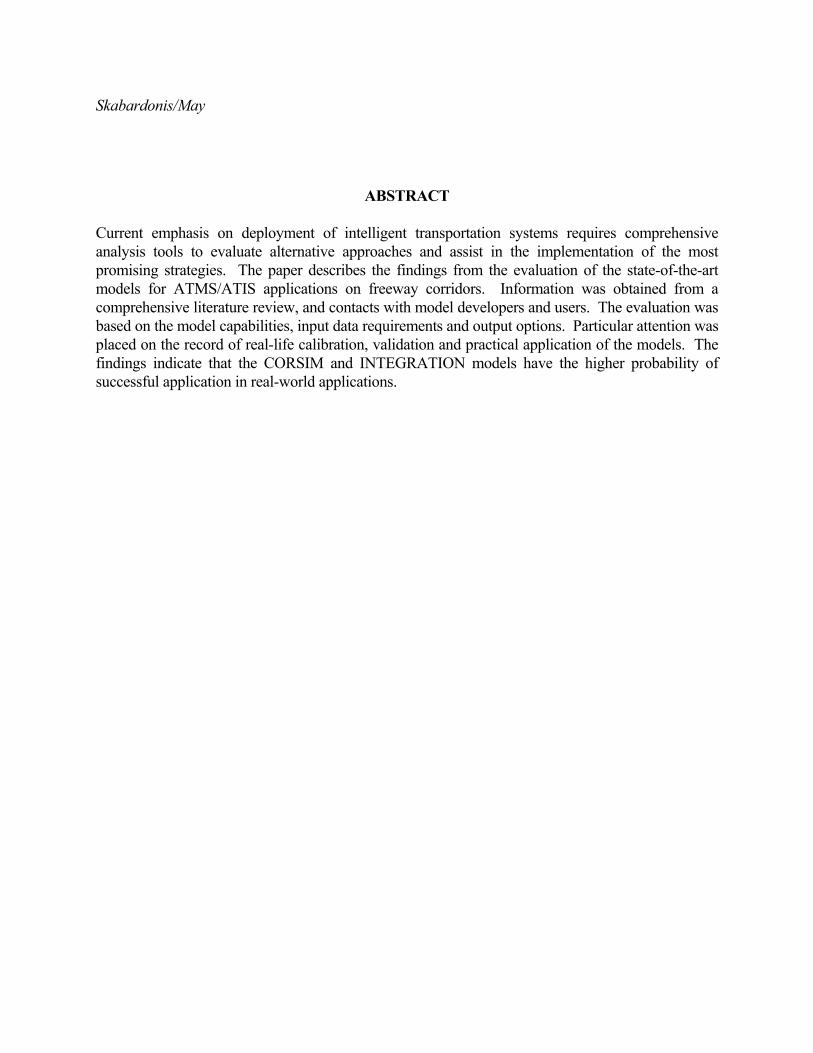
Skabardonis/May
ABSTRACT Current emphasis on deployment of intelligent transportation systems requires comprehensive analysis tools to evaluate alternative approaches and assist in the implementation of the most promising strategies. The paper describes the findings from the evaluation of the state-of-the-art models for ATMS/ATIS applications on freeway corridors. Information was obtained from a comprehensive literature review, and contacts with model developers and users. The evaluation was based on the model capabilities, input data requirements and output options. Particular attention was placed on the record of real-life calibration, validation and practical application of the models. The findings indicate that the CORSIM and INTEGRATION models have the higher probability of successful application in real-world applications.
Skabardonis/May
1
1. INTRODUCTION Advanced traffic management and traffic information systems (ATMIS) offer significant potential for reducing traffic congestion and systematically improving the operation of the existing transportation networks. ATMS include urban traffic control systems, freeway surveillance and incident management systems, ramp metering, and High Occupancy Vehicles (HOV) priority treatment. ATIS technologies are designed to provide the traveler with navigational information and routing advice based on real-time traffic data. The effects of these technologies on traffic performance must be carefully evaluated. Several field operational tests (FOTs) have been completed or are currently underway to measure the ATMIS benefits and costs in a real-world environment and are clearly of vital importance for system design and evaluation. However, such field trials are limited in terms of the number of scenarios than can tested and in terms of the range of conditions for which their performance can be examined. Traffic simulation models are particularly valuable in this respect as a complementary aid to system design for identifying key operation and performance issues, and for testing alternatives under a range of operating conditions. Previous experiences with simulation models in large real-life freeway corridors have been limited and produced mixed results. For the purposes of this paper, freeway corridors are defined as consisting of freeway sections of about 16 Km (10 mi) in length, and adjoining surface street networks with more than 150 signalized intersections. Major problems reported with the models' applications included: a) the accuracy of the models in representing traffic flow, b) lack of features pertinent to ATMIS applications (e.g., real-time control), c) the amount and type of required input data, d) effort and data required for calibration and validation, e) computer run times The objective of the study described in this paper was to provide recommendations and guidance whether the current state-of-the-art simulation models, and the input data that are commonly available, can support near-term successful ATMIS applications on freeway corridors. The study was sponsored by the California Department of Transportation (Caltrans) as part of the PATH program. Section 2 of the paper discusses key requirements for modeling ATMIS scenarios and discusses existing simulation modeling approaches. The next section describes the simulation models identified through literature search. Section 4 describes the process of and the findings from the evaluation of the selected models. The final section summarizes the study findings and recommendations along with suggestions for future work.
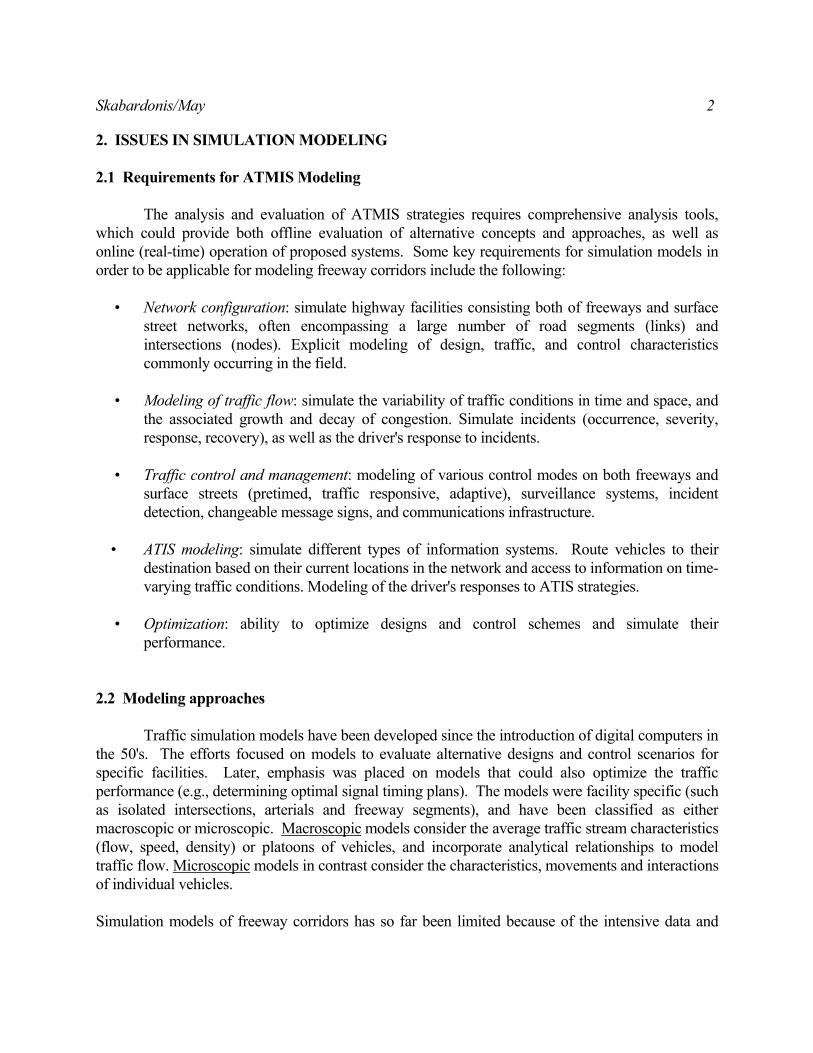
Skabardonis/May
2
2. ISSUES IN SIMULATION MODELING 2.1 Requirements for ATMIS Modeling The analysis and evaluation of ATMIS strategies requires comprehensive analysis tools, which could provide both offline evaluation of alternative concepts and approaches, as well as online (real-time) operation of proposed systems. Some key requirements for simulation models in order to be applicable for modeling freeway corridors include the following: • Network configuration: simulate highway facilities consisting both of freeways and surface
street networks, often encompassing a large number of road segments (links) and intersections (nodes). Explicit modeling of design, traffic, and control characteristics commonly occurring in the field.
• Modeling of traffic flow: simulate the variability of traffic conditions in time and space, and
the associated growth and decay of congestion. Simulate incidents (occurrence, severity, response, recovery), as well as the driver's response to incidents.
• Traffic control and management: modeling of various control modes on both freeways and
surface streets (pretimed, traffic responsive, adaptive), surveillance systems, incident detection, changeable message signs, and communications infrastructure.
• ATIS modeling: simulate different types of information systems. Route vehicles to their
destination based on their current locations in the network and access to information on time-varying traffic conditions. Modeling of the driver's responses to ATIS strategies.
• Optimization: ability to optimize designs and control schemes and simulate their
performance. 2.2 Modeling approaches Traffic simulation models have been developed since the introduction of digital computers in the 50's. The efforts focused on models to evaluate alternative designs and control scenarios for specific facilities. Later, emphasis was placed on models that could also optimize the traffic performance (e.g., determining optimal signal timing plans). The models were facility specific (such as isolated intersections, arterials and freeway segments), and have been classified as either macroscopic or microscopic. Macroscopic models consider the average traffic stream characteristics (flow, speed, density) or platoons of vehicles, and incorporate analytical relationships to model traffic flow. Microscopic models in contrast consider the characteristics, movements and interactions of individual vehicles. Simulation models of freeway corridors has so far been limited because of the intensive data and
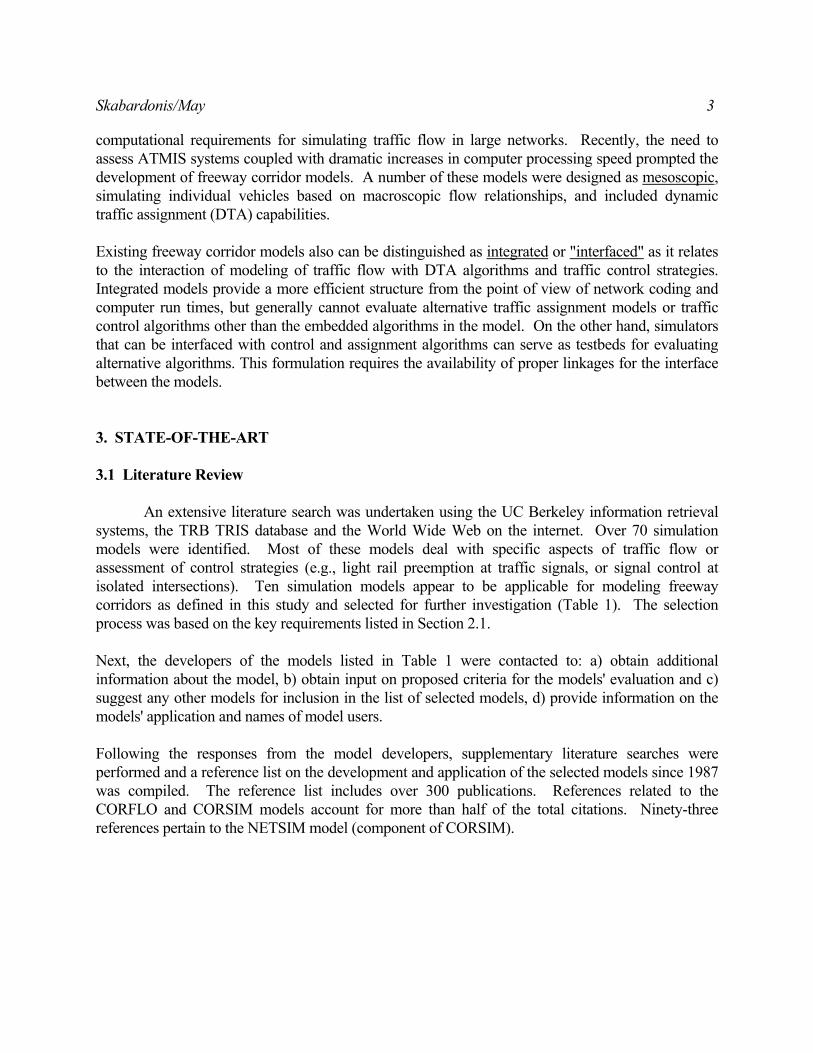
Skabardonis/May
3
computational requirements for simulating traffic flow in large networks. Recently, the need to assess ATMIS systems coupled with dramatic increases in computer processing speed prompted the development of freeway corridor models. A number of these models were designed as mesoscopic, simulating individual vehicles based on macroscopic flow relationships, and included dynamic traffic assignment (DTA) capabilities. Existing freeway corridor models also can be distinguished as integrated or "interfaced" as it relates to the interaction of modeling of traffic flow with DTA algorithms and traffic control strategies. Integrated models provide a more efficient structure from the point of view of network coding and computer run times, but generally cannot evaluate alternative traffic assignment models or traffic control algorithms other than the embedded algorithms in the model. On the other hand, simulators that can be interfaced with control and assignment algorithms can serve as testbeds for evaluating alternative algorithms. This formulation requires the availability of proper linkages for the interface between the models. 3. STATE-OF-THE-ART 3.1 Literature Review An extensive literature search was undertaken using the UC Berkeley information retrieval systems, the TRB TRIS database and the World Wide Web on the internet. Over 70 simulation models were identified. Most of these models deal with specific aspects of traffic flow or assessment of control strategies (e.g., light rail preemption at traffic signals, or signal control at isolated intersections). Ten simulation models appear to be applicable for modeling freeway corridors as defined in this study and selected for further investigation (Table 1). The selection process was based on the key requirements listed in Section 2.1. Next, the developers of the models listed in Table 1 were contacted to: a) obtain additional information about the model, b) obtain input on proposed criteria for the models' evaluation and c) suggest any other models for inclusion in the list of selected models, d) provide information on the models' application and names of model users. Following the responses from the model developers, supplementary literature searches were performed and a reference list on the development and application of the selected models since 1987 was compiled. The reference list includes over 300 publications. References related to the CORFLO and CORSIM models account for more than half of the total citations. Ninety-three references pertain to the NETSIM model (component of CORSIM).

Skabardonis/May
4
3.2 Description of the Selected Models The selected models are briefly described in the following paragraphs. Key references by model are provided in the reference section of the paper. An expanded description of the models and the reference list are included in the final report for the study. CONTRAM CONTRAM is a macroscopic simulation and assignment model developed at the British Transport Research Laboratory (TRL) to evaluate traffic management schemes for urban networks. The model considers queuing in the assignment and performs iterative multiple time-period assignment. Link travel times are updated based on macroscopic simulation of traffic flow. A number of extensions have been implemented in the basic CONTRAM model to simulate ATMIS strategies. RGCONTRAM from the University of Southampton was developed to evaluate in-vehicle route guidance systems. TRL's MOLA simulates variable message signs and incidents. A ramp metering algorithm is under testing in the Netherlands. Also, an interface with the TRANSYT model permits optimization of signal settings. The model is well documented and its standard version is commercially available. Model extensions and interfaces can be obtained by special arrangement with TRL. The applications of the model in the US are limited. It has been used by UC Irvine in the city of Anaheim only as an assignment tool, and by UC Berkeley in exploratory simulations of the Los Angeles Santa Monica freeway. Problems encountered were mostly on the accuracy of simulation on freeways. The CORFLO model The CORFLO model developed for the FHWA consists of the FREFLO model for freeways and the NETFLO1 and NETFLO2 models for surface streets. The interface of adjoining subnetworks is accomplished by defining interface nodes, which represent points at which vehicles leave one subnetwork and enter another. Associated with each subnetwork is a vehicle holding area where exiting vehicles are held until the next subnetwork can receive them. Traffic may be assigned to the different subnetworks using the TRAFFIC assignment model (a static equilibrium assignment algorithm.) FREFLO is a macroscopic model based on the conservation equation and a dynamic speed-density equation. The model can handle different vehicle classes (busses, carpools), HOV facilities, and incidents on the freeway, but it cannot model ramp operations. NETFLO1 is a microscopic event scanning simulator (a simplification of the NETSIM model). NETFLO2 models traffic using flow profiles similar to the TRANSYT model. Unlike TRANSYT, however, it can simulate signals with different cycle lengths and queue spillbacks. CORFLO has been designed to evaluate freeway and surface streets design and control
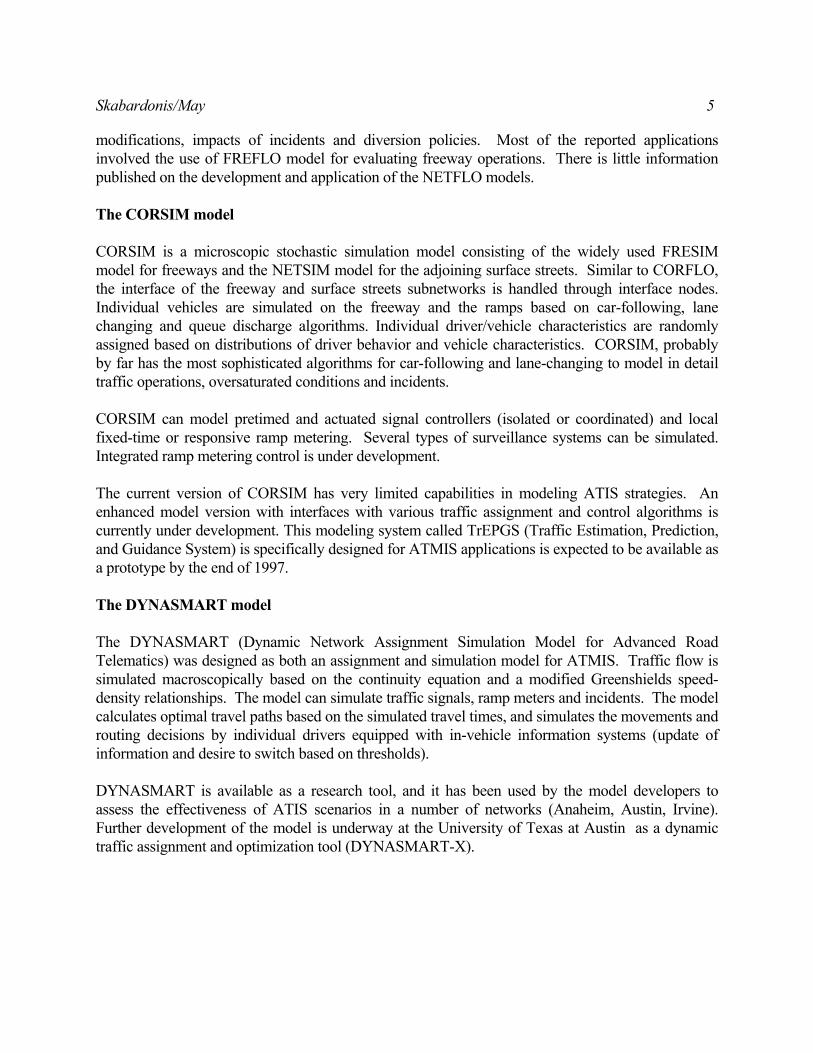
Skabardonis/May
5
modifications, impacts of incidents and diversion policies. Most of the reported applications involved the use of FREFLO model for evaluating freeway operations. There is little information published on the development and application of the NETFLO models. The CORSIM model CORSIM is a microscopic stochastic simulation model consisting of the widely used FRESIM model for freeways and the NETSIM model for the adjoining surface streets. Similar to CORFLO, the interface of the freeway and surface streets subnetworks is handled through interface nodes. Individual vehicles are simulated on the freeway and the ramps based on car-following, lane changing and queue discharge algorithms. Individual driver/vehicle characteristics are randomly assigned based on distributions of driver behavior and vehicle characteristics. CORSIM, probably by far has the most sophisticated algorithms for car-following and lane-changing to model in detail traffic operations, oversaturated conditions and incidents. CORSIM can model pretimed and actuated signal controllers (isolated or coordinated) and local fixed-time or responsive ramp metering. Several types of surveillance systems can be simulated. Integrated ramp metering control is under development. The current version of CORSIM has very limited capabilities in modeling ATIS strategies. An enhanced model version with interfaces with various traffic assignment and control algorithms is currently under development. This modeling system called TrEPGS (Traffic Estimation, Prediction, and Guidance System) is specifically designed for ATMIS applications is expected to be available as a prototype by the end of 1997. The DYNASMART model The DYNASMART (Dynamic Network Assignment Simulation Model for Advanced Road Telematics) was designed as both an assignment and simulation model for ATMIS. Traffic flow is simulated macroscopically based on the continuity equation and a modified Greenshields speed-density relationships. The model can simulate traffic signals, ramp meters and incidents. The model calculates optimal travel paths based on the simulated travel times, and simulates the movements and routing decisions by individual drivers equipped with in-vehicle information systems (update of information and desire to switch based on thresholds). DYNASMART is available as a research tool, and it has been used by the model developers to assess the effectiveness of ATIS scenarios in a number of networks (Anaheim, Austin, Irvine). Further development of the model is underway at the University of Texas at Austin as a dynamic traffic assignment and optimization tool (DYNASMART-X).

Skabardonis/May
6
The INTEGRATION model The INTEGRATION model was originally developed by M Van Aerde in 1985 and it has been under continuous development and refinement since then. The model simulates combined freeway and arterial networks which experience time-varying congestion. It assigns individual vehicles sequentially to a network that is already loaded with any previous departures that have not reached their destination. Up to five different driver/vehicle types are used to represent different routing behavior or various access privileges to real-time traffic conditions. INTEGRATION originally was designed as a mesoscopic model. Individual vehicles were simulated based on macroscopic speed-flow relationships. The latest version of the model is fully microscopic incorporating car-following and lane changing logic. The car-following algorithm is a kinematic model that calculates the individual vehicle speeds based on the macroscopic parameters of free-flow speed, speed at capacity, capacity and jam density. Calculations are carried out every deci-second. A gap acceptance logic was developed for modeling stop/yield sign control and unprotected left-turns at traffic signals. Several applications of the model have been reported, mostly by the model developers illustrating the model features and capabilities, including assessment of the effectiveness of route guidance systems, impacts of ramp metering and signal control strategies, and modeling of incidents. The METACOR/METANET model METANET is a macroscopic simulation model for freeways. METACOR is an extension of METANET to include modeling of parallel arterials. Both models were developed at the Technical University of Munich in cooperation with INRETS, the French Transport Research Laboratory. The simulation of traffic flow is based on the flow conservation equation and a dynamic speed-density relationship. METANET can model multi-origin, multi-destination freeway networks with arbitrary topology and geometric characteristics (merging, diverging, lane drops, on- and off-ramps). METANET/METACOR include control and dynamic traffic assignment modules to simulate ramp metering strategies and route information/guidance via changeable message signs. Because of their fast computer execution times can be used for real-time applications. METANET has been applied by various organizations in Europe as part of several EEC sponsored ATMIS research and demonstration projects. METACOR has been applied in a number of sites (Paris, Glasgow) only by the model developers.
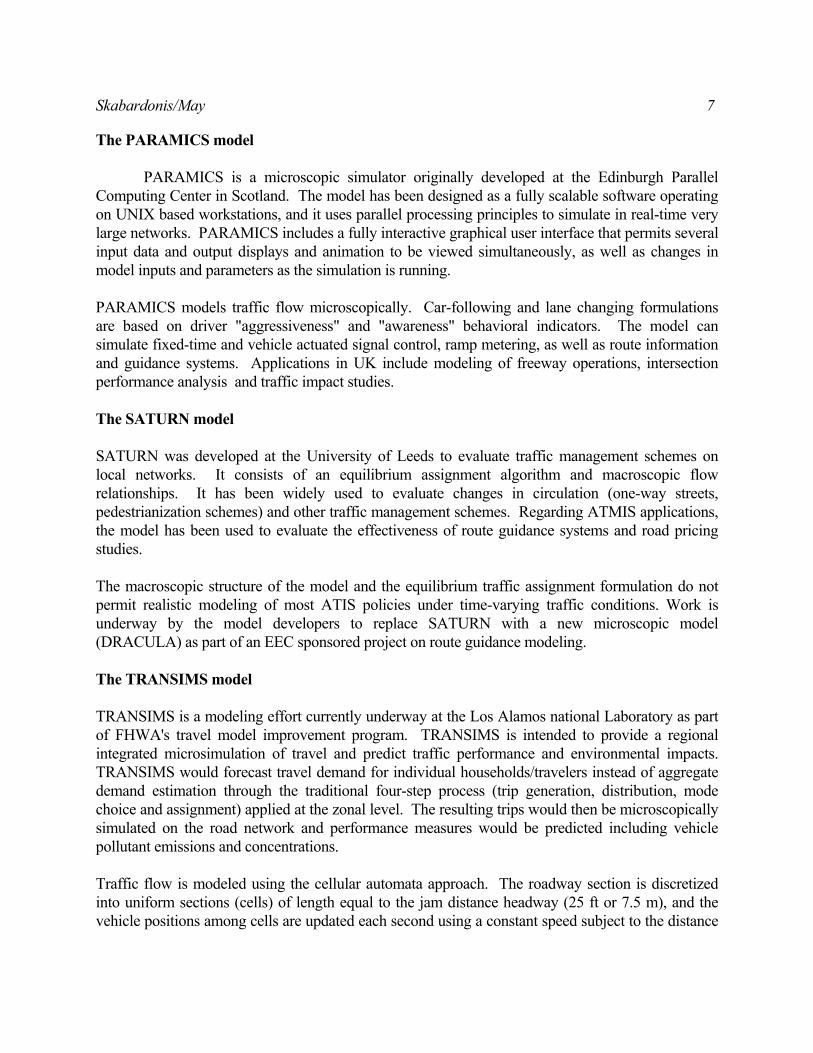
Skabardonis/May
7
The PARAMICS model PARAMICS is a microscopic simulator originally developed at the Edinburgh Parallel Computing Center in Scotland. The model has been designed as a fully scalable software operating on UNIX based workstations, and it uses parallel processing principles to simulate in real-time very large networks. PARAMICS includes a fully interactive graphical user interface that permits several input data and output displays and animation to be viewed simultaneously, as well as changes in model inputs and parameters as the simulation is running. PARAMICS models traffic flow microscopically. Car-following and lane changing formulations are based on driver "aggressiveness" and "awareness" behavioral indicators. The model can simulate fixed-time and vehicle actuated signal control, ramp metering, as well as route information and guidance systems. Applications in UK include modeling of freeway operations, intersection performance analysis and traffic impact studies. The SATURN model SATURN was developed at the University of Leeds to evaluate traffic management schemes on local networks. It consists of an equilibrium assignment algorithm and macroscopic flow relationships. It has been widely used to evaluate changes in circulation (one-way streets, pedestrianization schemes) and other traffic management schemes. Regarding ATMIS applications, the model has been used to evaluate the effectiveness of route guidance systems and road pricing studies. The macroscopic structure of the model and the equilibrium traffic assignment formulation do not permit realistic modeling of most ATIS policies under time-varying traffic conditions. Work is underway by the model developers to replace SATURN with a new microscopic model (DRACULA) as part of an EEC sponsored project on route guidance modeling. The TRANSIMS model TRANSIMS is a modeling effort currently underway at the Los Alamos national Laboratory as part of FHWA's travel model improvement program. TRANSIMS is intended to provide a regional integrated microsimulation of travel and predict traffic performance and environmental impacts. TRANSIMS would forecast travel demand for individual households/travelers instead of aggregate demand estimation through the traditional four-step process (trip generation, distribution, mode choice and assignment) applied at the zonal level. The resulting trips would then be microscopically simulated on the road network and performance measures would be predicted including vehicle pollutant emissions and concentrations. Traffic flow is modeled using the cellular automata approach. The roadway section is discretized into uniform sections (cells) of length equal to the jam distance headway (25 ft or 7.5 m), and the vehicle positions among cells are updated each second using a constant speed subject to the distance
Skabardonis/May
8
headway. This approach allows simulation of individual vehicles at a coarse level of detail over very large transportation networks with reasonable computer times. Comparisons with other traffic models indicate that this approach replicates traffic dynamics on a single lane reasonably well. Currently, TRANSIMS is still in a developmental stage and no applications have been reported. There is no field verification of its single lane traffic model and lane changing algorithms. Also, TRANSIMS does not support modeling of most of the ATMIS strategies. The WATSim model WATSim (Wide Area Traffic Simulation) is a microscopic model developed by KLD Associates. It is based on the TRAF-NETSIM simulation model, extended to simulate traffic operations on freeways and other roadways of any configuration. It incorporates an improved lane-changing and car-following logic to represent stochastic driver behavior, and freeway links with differing capacities associated with different grades, lane widths and horizontal curvature. The freeway model logic has been calibrated using the latest data for the 1994 Highway Capacity Manual and field data. WATSim can by interfaced with DTA algorithms to simulate ATIS systems. The model automatically creates Origin-Destination (O-D) tables from standard vehicle turn movements on intersections' approaches, and creates paths for traffic traveling between each O-D pair, consistent with observed traffic movements. WATSIM accommodates path assignments computed by a DTA model for different vehicle classes. The model produces link travel times and other statistics needed by a DTA model to compute minimum travel time paths for each O-D pair. Recent extensions to WATSim include simulation of light-rail preemption algorithms, toll plaza operations, and linkages with the TRANSYT-7F and PASSER-II signal optimization programs to optimize the signal settings along arterials and networks. 4. EVALUATION OF THE MODELS The evaluation of the selected models consisted of the following steps: First, a set of evaluation criteria were established. Next, the models were evaluated against the criteria and a short list of models was developed. The leading models were then evaluated in detail. This evaluation consisted of detailed review of the models' documentation, and information from model users. Recommendations were then formulated on the use of the models.

Skabardonis/May
9
4.1 Preliminary Evaluation Evaluation Criteria The following criteria were established to evaluate the selected models: 1. Model operational: the model software and documentation are available and can be supplied
to model users along with sample input and output files. The model documentation includes sufficient detail to permit understanding of the model principles, input data and coding requirements, and explanation of the model outputs.
2. Record of application: the model should have a record of application by users other than the
model developers, as well as a record of independently performed calibration/validation. 3. Network simulation capabilities: the model should represent the street network at a level of
detail for operational analysis, that is to explicitly model design characteristics commonly occurring in the field (e.g., merging and weaving areas, various intersection layouts) and produce estimates of traffic performance measures (MOEs) that can be used to determine traffic performance and Level of Service (LOS) as per the widely used 1994 Highway Capacity Manual.
4. Modeling of traffic flow: the model should simulate the variability in traffic demand in time
and space, and model the growth/interaction and decay of traffic queues, as well as capacity reductions due to incidents and bottlenecks.
5. Simulation of control strategies: the model should be able to simulate commonly used
control strategies for both freeways and arterial streets. These include signal coordination, fixed-time and actuated control, and fixed-time ramp metering. Such control strategies are commonly used in practice and for the purposes of this evaluation are not considered ATMIS strategies.
6. Simulation of ATMIS strategies: the model should handle proposed or being implemented
strategies including but not limited to real-time control on surface streets and freeways, surveillance systems, and traveller information systems (changeable message signs and route guidance systems.)
As it was discussed in Section 2 (Modeling requirements and approaches), the model may not internally simulate ATMIS scenarios but it may interface with control software and DTA algorithms. This modeling approach satisfies the requirements of the last criterion provided that appropriate linkages have been established to allow such interfaces. For example, the simulation model should be able to track individual vehicles and predict the origin-destination travel times for input to traffic assignment algorithms.

Skabardonis/May
10
Results Based on the study of the published materials identified in the literature search and information provided by the model developers, the following five models were found to satisfy the majority of the evaluation criteria listed above and selected for detailed evaluation: CORFLO, CORSIM, INTEGRATION, PARAMICS and WATSim. 4.2 Detailed Model Evaluation The detailed evaluation of the five leading models consisted of in depth review of the models' documentation with emphasis on the model features and capabilities, input data requirements, and output options. Next, model users (other than the model developers) were contacted to discuss their applications experiences. Input Data Requirements Table 2 lists the basic field data required for the application of the selected models on freeways and Table 3 for surface streets. The data are grouped into design (supply), demand and control. Supply data consist of the design characteristics for each link (length, number of lanes, type and length of turning lanes, grade, lane usage), free flow speed, saturation flow and lost time at traffic signals. Most of the these data are common to most of the models. Traffic demands for CORFLO, CORSIM and WATSim models are specified in terms of turning fractions at the network nodes per time period, and (optionally) origin-destination data if traffic assignment is executed at the start of the simulation. Traffic demands for the INTEGRATION and PARAMICS are specified in terms of O-D flows per time period. Traffic control data include specifications of the control type (traffic signals/stop signs, ramp meters) as well as type of traffic signal, phasing, phase length, offsets, detector type and location. The data requirements vary with the model features. For example, CORSIM and WATSim can model in detail actuated controller operations and require data on several control parameters. INTEGRATION on the other hand only models fixed-time control so inputs include cycle length, and green times. Additional data may be needed to calibrate the models and to investigate alternative scenarios. For example, incident characteristics (location, severity and duration), or surveillance system characteristics (location/type of detectors). Input Data Coding All the models require that the network is coded into links and nodes. Nodes represent
Skabardonis/May
11
intersections, and links one-way traffic streams. CORFLO, CORSIM and WATSim require the data to be coded in a single input file using "record (card) types" to distinguish between the various types of data. INTEGRATION and PARAMICS employ multiple data files, each file corresponding to a specific data category (e.g., link data), and use a master file to set the basic parameters for the model execution and specify the names of the various input/output files. All but the INTEGRATION model include pre-processors for interactive data entry/editing. These preprocessors (example, the ITRAF software for CORFLO/CORSIM) simplifies the creation and editing of input files through a graphical user interface and on-line help. Input data coding for INTEGRATION is accomplished using any standard text editor. The differences in the input coding schemes among the different models does not allow to use the same input files on different models, although most of the input data are the same. The exception is the CORFLO and CORSIM models that employ compatible data formats as part of the TRAF-modeling system. Also, the WATSim model may use data files created for the NETSIM (surface street component of CORSIM) with minor modifications. Model Outputs Outputs from the CORFLO model includes a fairly extensive set of performance measures (travel time, delay, speeds, fuel consumption and emissions). A graphics post-processor (GCOR) provides graphical displays with the model results and animation. CORSIM includes the most comprehensive outputs on traffic performance (travel time, delay, stops, queue lengths) plus environmental impacts for each movement, link, network section and the total network. Several graphical displays of results are provided including comparisons of MOEs from multiple computer runs, and animation of vehicle movements. Output from the INTEGRATION model includes travel time for each vehicle type and for each O-D pair, number of stops, and networkwide values of fuel consumption and emissions. The model outputs generally require considerable amount of post-processing through spreadsheets and other software. INTEGRATION provides on-screen animation of vehicle movements throughout the simulation run. PARAMICS outputs include travel times and other performance measures for each network link. The model includes the most comprehensive visual displays for viewing the results through multiple windows, and animation of vehicle movements. The WATSim model outputs are similar to CORSIM. Additional outputs include travel times for each O-D pair for each vehicle class. WATSim does not provide displays of the summary results, but it provides an interface to the Microsoft ACCESS database management program so the user can create reports and graphs from the outputs on link performance measures. Animation of vehicle movements is similar to the CORSIM model. Options are available for 3-D animation at varying
Skabardonis/May
12
levels of realism and background detail. Computational Aspects All the models with the exemption of PARAMICS run on PC based microcomputers. CORSIM is operational under the Windows 95/NT operating system. CORFLO, INTEGRATION and WATSim are currently operational under the DOS operating system (a Unix version is also available for INTEGRATION). PARAMICS runs on Unix based workstations. CORFLO as a macroscopic model has the fastest computer runs times. The computer run time of the rest microscopic models depends on the number of vehicles in the network, output options and control features been simulated. Computer execution times cannot be readily assessed from the literature because of the different computer systems and applications reported. Lessons From Applications Experiences Considerable importance was given in the model evaluation process to real-life applications experiences by non-model developers. It was felt that the risk in near-term future model applications would be less with model(s) which: had real-world applications with efforts devoted to calibration and validation; had more model applications by non-model developers, and more associated documented publications. Following the review of the published literature, a series of phone interviews were conducted with model users to obtain first hand information from the applications of the models. Interview questions focused on the description and assessment of the experiences from the selected model(s), verifying published data, identification of other model users, obtaining information on work that it is still unpublished, and recommendations and future plans on the model usage. Table 4 summarizes reported real-life applications of the selected models. Applications experiences between models varied significantly. Some models had limited real-life applications with calibration and validation, and other models were applied only in cooperation with model developers with no detailed documentation of the findings. Findings The findings of this evaluation process are summarized below on a model-by-model basis: INTEGRATION: It appears as the most comprehensive single model for ATMIS
applications. Several studies by non-developers have demonstrated most of the model features. Current model version overcomes several previous problems regarding the simulation of traffic flow. Problems encountered on its application on the Santa Monica freeway corridor.

Skabardonis/May
13
CORSIM:Based on the NETSIM model with several successful applications, and the
FRESIM freeway model with fairly good track record. Enhancements in user interface facilitate its practical application. Continuous support by FHWA and development of a number of control algorithms that can be readily interfaced with the simulation. Main limitation for current version the lack of features for ATIS modeling (extended version under development).
CORFLO: Macroscopic modeling allows for fast execution times and analysis of design
and control scenarios. Several applications on freeways. The results from the applications in the Santa Monica freeway corridor were questionable. Lack of capabilities for simulating most of ATMIS applications
PARAMICS: Innovative software design and features allow for comprehensive simulation
of large networks. Applications in Britain show promising results. However, there is a lack of applications in the US. The ongoing application and validation effort at UC Irvine would provide with further evidence of the capabilities of the model as a simulation tool.
WATSim: The model is based on the well tested NETSIM model with several features to
support ATMIS applications. However, there is a lack of application by non-model developers particularly on modeling freeways.
The findings from the evaluation indicate that CORSIM and INTEGRATION appear as the models with the higher probability of success in simulating real-life freeway corridors in the near-term. 5. CONCLUSIONS This paper identified, selected and evaluated existing simulation models for freeway corridors and their capabilities in assessing the effectiveness of current and soon to be available advanced traffic management and traveller information systems. Major emphasis was placed on the modeling approach, input data requirements and experiences from the practical application of the models in real-life situations by non-model developers. 5.1 Summary of the Study Findings There is a limited number of models that can be applied to freeway corridors. Ten candidate models were identified as potential simulation tools. Of these models only about one-half of them are operational, available to the user community, and have a record of practical application. None of the models is capable of explicitly simulating the impacts of several of the implemented and proposed ATMIS strategies (examples include real-time control, TMC operations and interactions of
Skabardonis/May
14
control and traveller information systems). The applications to-date of the leading simulation models on real-life corridors are very limited. Most of the reported applications have focused on predicting impacts of traveller information systems on small areas or synthetic networks. Such applications demonstrate the model features but do not provide any evidence on the usage of the model as a practical tool. Furthermore, the documentation of the models practical application is not of sufficient detail to understand problems encountered and suggestions for their resolution. Proper application of the simulation model(s) require a comprehensive set of input data, and traffic performance data for the comparison of field conditions and model predictions. However, in most practical situations the field data available (especially traffic demand) are incomplete, collected at different time periods, or non-existent (for example, O-D flows per time period). Also, data are needed for the calibration, but the documentation on most of the models does not provide clear guidelines on the sensitivity of model parameters and data requirements for calibration (e.g., jam density, driver aggressiveness factors). Major advancements have occurred in the user friendliness of the models by incorporating graphical user interfaces for interactive data entry, comprehensive output reports, graphical displays of the results, as well as animation of vehicle movements. However, most of the data input schemes are incompatible among the different models (with the exception of the TRAF modeling system), and generally there are no facilities for importing data from other software. Examples include AutoCAD highway facility drawings, UTCS signal plans and highway networks already coded for traditional planning models. Thus a significant amount of time has to be invested in coding the network for the simulation model. Of the leading models evaluated, the CORSIM and INTEGRATION models appear as the most suitable tools for near-term freeway corridor applications. Both models have continued development support with ongoing enhancements, and more applications by the user community. Rapid and frequent improvements have been made with these large-scale freeway corridor models in recent years and they are expected to continue into the future. Some models will be enhanced and tested rapidly and extensively while other models may receive little or no improvement in the near-future. Therefore, this model evaluation process will need to be repeated at frequent intervals in the future to be assured that the best candidate model(s) at a point in time are recognized. 5.2 Future Work As a result of this research study, a recommendation has been made and plans initiated with Caltrans for the application of the CORSIM and INTEGRATION models to a selected portion of the Santa Monica freeway corridor in Los Angeles for a single peak period. This real-life application will be undertaken by non-model developers, will include extensive calibration and validation efforts, and detailed results will be published.
Skabardonis/May
15
ACKNOWLEDGMENTS Preparation of this paper was funded by the California PATH Program (MOU-270). We appreciate the assistance and cooperation of Pat Conroy, Joe Palen and Larry Jellison of the Division of New Technology, Caltrans Headquarters. Hector Obezo, Jack Smith, Doug Murphy and Chiao Wei of the Los Angeles Caltrans District 7, and Brian Gallagher of the Los Angeles DOT provided valuable input to the study. Dr. Joy Dahlgren of the PATH Program assembled the information on the data availability on the Santa Monica Freeway corridor. We wish to thank the model developers, and researchers and practitioners for providing information to the various models throughout the study. The contents of this paper reflect the views of the authors who are responsible for the facts and the accuracy of the data presented herein. The contents do not necessarily reflect the official views of or policy of the California Department of Transportation. This paper does not constitute a standard, specification or regulation.
Skabardonis/May
16
REFERENCES CONTRAM model 1. Taylor, N.B., "CONTRAM 5: an Enhanced Traffic Assignment Model," TRRL Research
Report 249, Crowthorne, England, 1990. 2. Hounsell, N.B., et al, "Modeling the Dynamics of Route Guidance," 2nd Vehicle Navigation
and Information Systems Conference, Oslo, Norway, 1992. 3. Gardes, Y. et al, "Model Selection and Initial Application of CONTRAM model for Evaluating
In-Vehicle Information Systems," PATH Report UCB-ITS-PRR-91-11, Institute of Transportation Studies, University of California, Berkeley, 1991.
CORFLO model 4. Payne, H.J., "FREFLO: a Macroscopic Simulation Model of Freeway Traffic," Transportation
Research Record 722, 1979. 5. Lieu H., and A.J. Santiago, "CORFLO: An Integrated Traffic Simulation System for Corridors,"
Traffic Management, Proceedings of the Engineering Foundation Conference, Palm Coast, Florida, 1991.
6. McCoy, P., et al, "Development of Corridor Models for Evaluating Traffic Management
Strategies in the Omaha Metropolitan Area," Final Report, University of Nebraska, 1994. CORSIM model 7. Halati, A., et al, "CORSIM: Microscopic Traffic Simulation Model for Integrated Networks,"
paper presented at the 76th TRB Annual Meeting, Washington DC, January 1997. 8. FHWA "CORSIM User's Manual, Version 1.0," ITS Research Division, FHWA, US DOT,
1995. 9. Cragg, C.A, and M. Demetsky, "Simulation Analysis of Route Diversion Strategies for Freeway
Incident Management," Final Report, Virginia Transportation Research Council, 1995. DYNASMART model 10. Jayakrishnan, R., et al, "Freeway and Arterial Traffic Simulation Analytically Embedded in
Traffic Assignment," paper presented at the 76th TRB Annual Meeting, Washington, DC, January 1997.
11. Jayakrishnan, R., et al, "An Evaluation Tool for Advanced Traffic Information and
Management Systems in Urban Networks," Transportation Research C, Vol 2(3), 1994. 12. Mahmassani, H., et al, "Dynamic Traffic Assignment with Multiple User Classes for Real-Time

Skabardonis/May
17
ATMS/ATIS Applications," Advanced Traffic Management Conference, 1993. INTEGRATION model 13. Van Aerde M., et al,"INTEGRATION: An Overview of Traffic Simulation Features," paper
presented at the 75th TRB Annual Meeting, Washington DC, January 1996. 14. Van Aerde M., "INTEGRATION Release II: User's Guide," Transportation Systems Research
Group, Queens University, Kingston, Canada, 1995. 15. Bacon V., J. Windover, and A.D. May," Investigating Intelligent Transportation Systems
Strategies on the Santa Monica Freeway Corridor," PATH Report UCB-ITS-PRR-95-38, Institute of Transportation Studies, University of California, Berkeley, 1995.
METACOR/METANET model 16. Haj Salem, H., "METACOR : a Macroscopic Modelling Tool for Urban Corridor," World
Congress on Applications of Transport Telematics and Intelligent Vehicle-Highway Systems, Boston, 1994.
17. Messmer, A., "METANET, A Macroscopic Simulation Program for Motorway Networks,"
Traffic Engineering & Control, Vol. 31 (9) 1990. 18. Papageorgiou M, "Dynamic Modeling, Assignment, and Route Guidance in Traffic Networks,"
Transportation Research, Part B, 24B(6), 1990. PARAMICS model 19. Duncan, G., "Simulation at the Microscopic Level," Traffic Technology International,
Feb/March 1996. 20. Duncan G.I., "PARAMICS wide area Microscopic Simulation of ATT and Traffic
Management," 28th ISATA Conference, Stuttgart, Germany, 1995. SATURN model 21. Van Fliet, D., and al, "SATURN: A Modern Traffic Assignment Model," Traffic Engineering
and Control, Vol 23(12), 1982. 22. Van Fliet, D., and al "Fundamental Requirements for Route Guidance--Recent Developments to
SATURN," Institute for Transport Studies, University of Leeds, 1990. TRANSIMS model 23. Smith, L, et, al, "Overview of TRANSIMS: The TRansportation Analysis and SIMulation
System," Los Alamos National Laboratory, May 1995.

Skabardonis/May
18
24. Nagel, K., "Particle Hopping Models and Traffic Flow Theory," Physical Review E, Vol 53 (5), 1996.
WATSim model 25. Lieberman E., et al, "WATSim: Wide Area Traffic Simulation Model for Freeways and Surface
Streets," paper presented at the 75th TRB Annual Meeting, Washington, DC, January 1996. 26. Ivanovic, M., et al, "Assessing the Impacts of Signal Preemption and Coordination on LRT
Operations Using Simulation," paper presented at the 76th TRB Annual Meeting, Washington, DC, January 1997.
Skabardonis/May
19
LIST OF TABLES Table 1. Simulation Models for Freeway Corridors Table 2. Input Data Required for the Application of Selected Models: Freeways Table 3. Input Data Required for the Application of Selected Models: Surface Streets Table 4. Selected Freeway Simulation Models: Real-Life Application Experiences
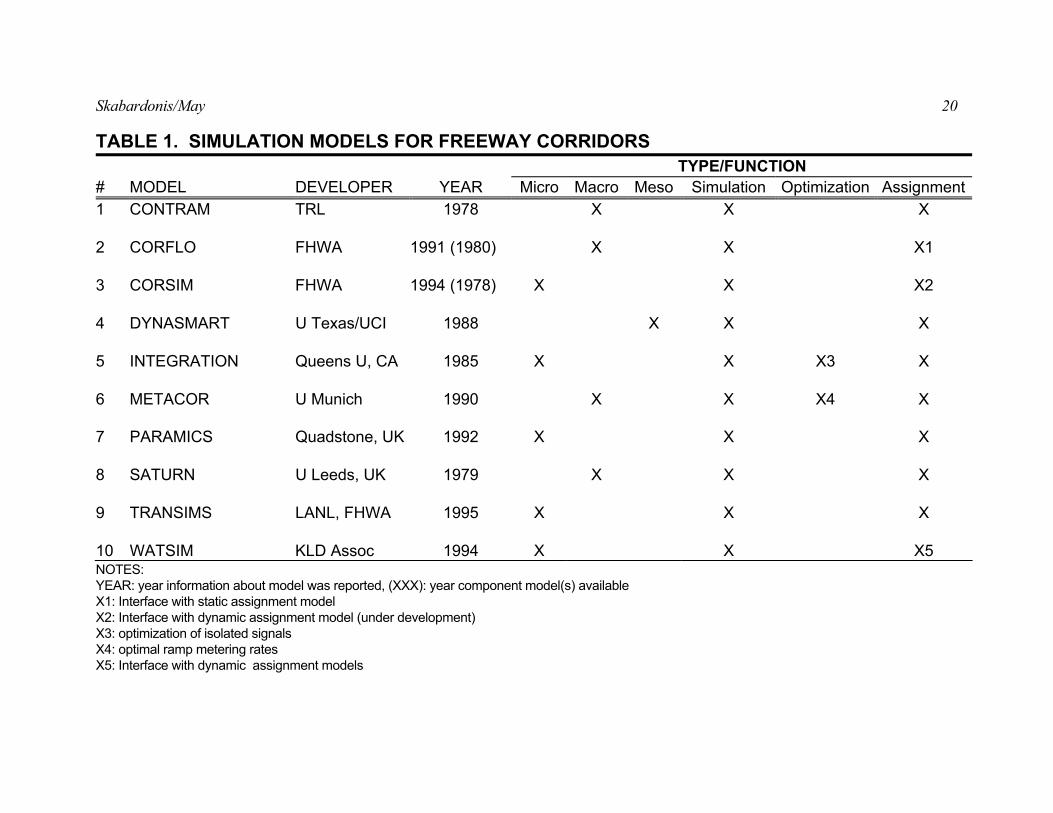
Skabardonis/May
20
TABLE 1. SIMULATION MODELS FOR FREEWAY CORRIDORS TYPE/FUNCTION # MODEL DEVELOPER YEAR Micro Macro Meso Simulation Optimization Assignment1 CONTRAM TRL 1978 X X X 2 CORFLO FHWA 1991 (1980) X X X1 3 CORSIM FHWA 1994 (1978) X X X2 4 DYNASMART U Texas/UCI 1988 X X X 5 INTEGRATION Queens U, CA 1985 X X X3 X 6 METACOR U Munich 1990 X X X4 X 7 PARAMICS Quadstone, UK 1992 X X X 8 SATURN U Leeds, UK 1979 X X X 9 TRANSIMS LANL, FHWA 1995 X X X 10 WATSIM KLD Assoc 1994 X X X5 NOTES: YEAR: year information about model was reported, (XXX): year component model(s) available X1: Interface with static assignment model X2: Interface with dynamic assignment model (under development) X3: optimization of isolated signals X4: optimal ramp metering rates X5: Interface with dynamic assignment models
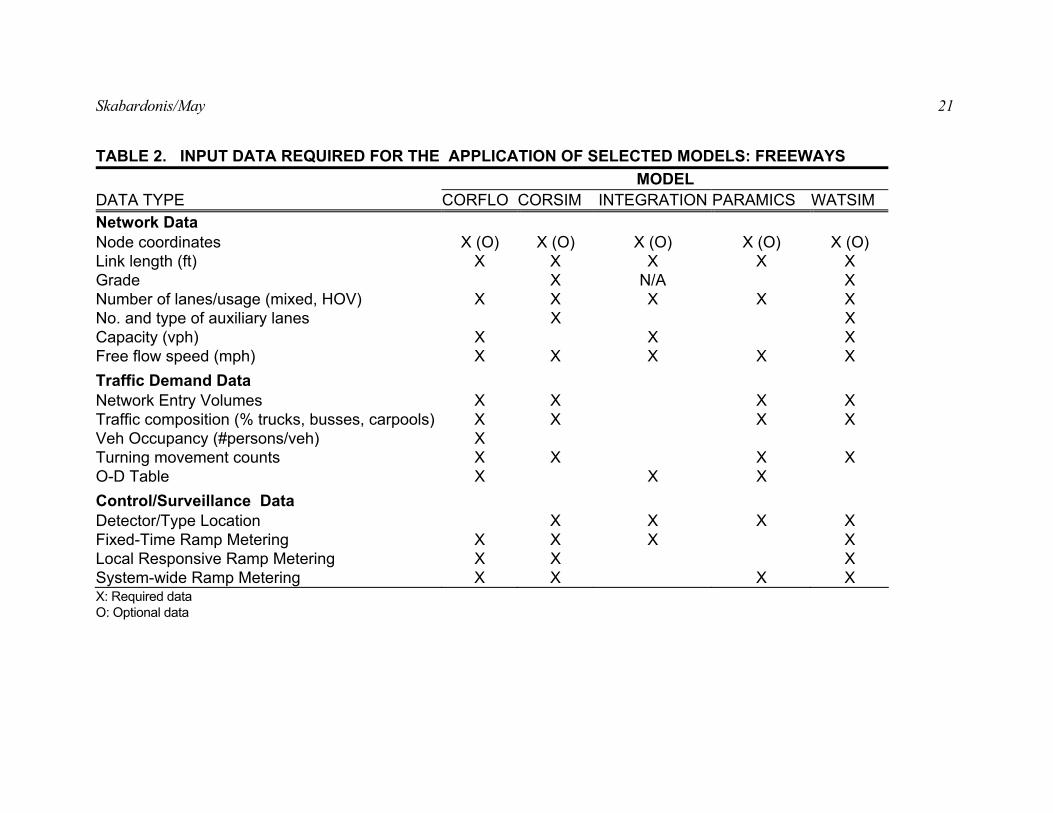
Skabardonis/May
21
TABLE 2. INPUT DATA REQUIRED FOR THE APPLICATION OF SELECTED MODELS: FREEWAYS
MODEL DATA TYPE CORFLO CORSIM INTEGRATION PARAMICS WATSIM Network Data Node coordinates X (O) X (O) X (O) X (O) X (O) Link length (ft) X X X X X Grade X N/A X Number of lanes/usage (mixed, HOV) X X X X X No. and type of auxiliary lanes X X Capacity (vph) X X X Free flow speed (mph) X X X X X Traffic Demand Data Network Entry Volumes X X X X Traffic composition (% trucks, busses, carpools) X X X X Veh Occupancy (#persons/veh) X Turning movement counts X X X X O-D Table X X X Control/Surveillance Data Detector/Type Location X X X X Fixed-Time Ramp Metering X X X X Local Responsive Ramp Metering X X X System-wide Ramp Metering X X X X X: Required data O: Optional data

Skabardonis/May
22
TABLE 3. INPUT DATA REQUIRED FOR THE APPLICATION OF SELECTED MODELS: SURFACE STREETS
MODEL DATA TYPE CORFLO CORSIM INTEGRATION PARAMICS WATSIM Network Data Node coordinates X (O) X (O) X (O) X (O) X (O) Link length (ft) X X X X X Number of lanes X X X X X Lane usage X X X X X No. and type pockets X X X Saturation flow (vphg/l) X X X X X Lost time (sec) X X X X X Capacity (vph) Free flow speed (mph) X X X X X Pedestrian activity X X X Traffic Demand Data Network Entry Volumes X X X X Traffic composition (% trucks, busses, carpools) X X X X Veh Occupancy (#persons/veh) X Turning movement counts X X X X O-D Table X X X Traffic Control Data Control device (signal, stop-sign) X X X X X Signal phasing X X X X Tming plan (cycle, splits, offsets) X X X X Detector type/location X X N/A X X Single-Ring Actuated Controllers X X N/A X Dual Ring Actuated Controllers (NEMA, 170) N/A X N/A X

Skabardonis/May
23
TABLE 4. SELECTED FREEWAY SIMULATION MODELS: REAL-LIFE APPLICATION EXPERIENCES STATE MODEL APPLICATION ORGANIZATION(S) YEAR
California CORFLO Smart Corridor JHK Assoc/ Kaku Assoc 1996 Los Angeles DOT
INTEGRATION 1.5 Smart Corridor UC Berkeley 1993
PARAMICS Orange County TestBed UC Irvine 1997 (ongoing)
WATSIM I-80/I-680/I-780 Korve Engng 1996 WATSIM San Francisco Embarcadero Network Korve Engng 1995
Nebraska CORFLO I-80: Congestion Management Strategies Univ Nebraska 1994
Ohio CORFLO (FREFLO) I-70 Columbus: Geometric improvements AEPCO Inc 1992
CORSIM (FRESIM) I-70 Columbus: Geometric improvements AEPCO Inc 1992
Texas CORFLO North Dallas Central Expressway: Incident Management TTI/Texas A&M University 1994 North Dallas Central Expressway: Transit Operations TTI/Texas A&M University 1995
Utah INTEGRATION 2.0 Salt Lake City Traffic Management Plan Transcore 1996 (ongoing)
Virginia CORSIM I-66: Route Diversion Strategies VTRC 1995
Washington CORFLO* I-405 Seattle Washington DOT 1992
*early mainframe model version

Skabardonis/May
1