Modeling Epileptic EEG Time Series by State Space Model and Kalman Filtering Algorithm
9
I.J. Intelligent Systems and Applications, 2014, 03, 26-34 Published Online February 2014 in MECS (http://www.mecs-press.org/) DOI: 10.5815/ijisa.2014.03.03 Copyright © 2014 MECS I.J. Intelligent Systems and Applications, 2014, 03, 26-34 Modeling Epileptic EEG Time Series by State Space Model and Kalman Filtering Algorithm Atefeh Goshvarpour 1 , Ateke Goshvarpour 2* , Mousa Shamsi 3 1,2 Computational Neuroscience Laboratory, Department of Biomedical Engineering, Faculty of Electrical Engineering, Sahand University of Technology, Tabriz, Iran 3 Department of Biomedical Engineering, Faculty of Electrical Engineering, Sahand University of Technology, Tabriz, Iran 2* E-mail: [email protected] Abstract— The human brain is one of the most complex physiological systems. Therefore, electroencephalogram (EEG) signal modeling is important to achieve a better understanding of the physical mechanisms generating these signals. The aim of this study is to investigate the application of Kalman filter and the state space model for estimation of electroencephalogram signals in a specific pathological state. For this purpose, two types of EEG signals (normal and partial epilepsy) were analyzed. The estimation performance of the proposed method on EEG signals is evaluated using the root mean square (RMS) measurement. The result of the present study shows that this model is appropriate for the analysis of EEG recordings. In fact, this model is capable of predicting changes in EEG time series with phenomena such as epileptic spikes and seizures. Index Terms— Electroencephalogram, Epilepsy, Kalman Filter, Modeling, State Space I. Introduction The electroencephalogram (EEG) measures the electrical activity of the brain by applying electrodes on the head surface which was firstly introduced by Berger [1]. It is a non-invasive technique and there has been an explosion of popular and scientific interest in measuring and analyzing it in many fields related to neuroscience (physiology, psychology, neurology, psychiatry, etc.) [2]. With regard to the diagnosis and localization of pathological processes involved in epilepsy, the recordings of brain activity by means of EEG have become widely important. One of the most disabling aspects of epilepsy is the sudden, unforeseen way in which epileptic seizures strike. Apart from the risk of serious injury, there is often a severe feeling of helplessness that has a strong impact on the everyday life of a patient [3]. The word ‘epilepsy’ is derived from the Greek word epilambanein, which means ‘to seize or attack’. It is now known, however, that seizures are the result of a sudden, usually brief, excessive electrical discharge in a group of brain cells (neurons) and different parts of the brain can be the site of such discharges. Transient symptoms can occur, such as loss of awareness or consciousness and disturbances of movement, sensation (including vision, hearing, and taste), mood, or mental function. EEG signal modeling is important to achieve a better understanding of the physical mechanisms generating these signals and to identify the causes of changes in EEG signals [4]. Modeling can also be used for predicting the future neurological outcome and for data compression. In addition, simulations based on the models of EEG signals can be used to demonstrate the effectiveness of a certain quantitative analysis method or EEG feature extraction. In order to improve the estimation of noisy physiological signals, different methods have been employed. Some of these methods consist of machine learning technique [5], averaging [6] and Kalman filtering [7, 8]. Machine learning techniques can detect artifacts efficiently but in this method large amount of data is required. Averaging methods can reduce the noise levels, but it smooths the signal fluctuations. Compared to these techniques, Kalman filter (KF) methods can estimate the trends of biological signals [9]. The properties of KF along with the simplicity of the derived equations make it valuable in the analysis of signals. In another study [10] an off-line Kalman filter approach to remove Transcranial Magnetic Stimulation (TMS) induced artifacts from EEG recordings is proposed. Lenz et al. [7] made use of a modified unscented Kalman filter and a corresponding unscented smoother for the estimation of the underlying neural activity of the brain. Purdon et al. [11] have developed a state space approach for multimodal integration of simultaneous EEG and fMRI. Li et al. [8] evaluated a new robust tracking algorithm for estimating blood pressure and heart rate (HR) based upon a Kalman Filter with an update sequence modified by the KF innovation sequence and the value of the Signal Quality Index (SQI). In the study of Mneimneh et al. [12] an adaptive Kalman filter is proposed for the real time removal of baseline wandering using a polynomial
-
Upload
independent -
Category
Documents
-
view
5 -
download
0
Transcript of Modeling Epileptic EEG Time Series by State Space Model and Kalman Filtering Algorithm

I.J. Intelligent Systems and Applications, 2014, 03, 26-34 Published Online February 2014 in MECS (http://www.mecs-press.org/)
DOI: 10.5815/ijisa.2014.03.03
Copyright © 2014 MECS I.J. Intelligent Systems and Applications, 2014, 03, 26-34
Modeling Epileptic EEG Time Series by State
Space Model and Kalman Filtering Algorithm
Atefeh Goshvarpour1, Ateke Goshvarpour
2*, Mousa Shamsi
3
1,2 Computational Neuroscience Laboratory, Department of Biomedical Engineering, Faculty of Electrical Engineering,
Sahand University of Technology, Tabriz, Iran 3 Department of Biomedical Engineering, Faculty of Electrical Engineering, Sahand University of Technology, Tabriz,
Iran 2*E-mail: [email protected]
Abstract— The human brain is one of the most complex
physiological systems. Therefore, electroencephalogram
(EEG) signal modeling is important to achieve a better
understanding of the physical mechanisms generating
these signals. The aim of this study is to investigate the
application of Kalman filter and the state space model
for estimation of electroencephalogram signals in a
specific pathological state. For this purpose, two types
of EEG signals (normal and partial epilepsy) were
analyzed. The estimation performance of the proposed
method on EEG signals is evaluated using the root
mean square (RMS) measurement. The result of the
present study shows that this model is appropriate for
the analysis of EEG recordings. In fact, this model is
capable of predicting changes in EEG time series with
phenomena such as epileptic spikes and seizures.
Index Terms— Electroencephalogram, Epilepsy,
Kalman Filter, Modeling, State Space
I. Introduction
The electroencephalogram (EEG) measures the
electrical activity of the brain by applying electrodes on
the head surface which was firstly introduced by Berger
[1]. It is a non-invasive technique and there has been an
explosion of popular and scientific interest in measuring
and analyzing it in many fields related to neuroscience
(physiology, psychology, neurology, psychiatry, etc.)
[2].
With regard to the diagnosis and localization of
pathological processes involved in epilepsy, the
recordings of brain activity by means of EEG have
become widely important.
One of the most disabling aspects of epilepsy is the
sudden, unforeseen way in which epileptic seizures
strike. Apart from the risk of serious injury, there is
often a severe feeling of helplessness that has a strong
impact on the everyday life of a patient [3]. The word
‘epilepsy’ is derived from the Greek word epilambanein,
which means ‘to seize or attack’. It is now known,
however, that seizures are the result of a sudden, usually
brief, excessive electrical discharge in a group of brain
cells (neurons) and different parts of the brain can be
the site of such discharges. Transient symptoms can
occur, such as loss of awareness or consciousness and
disturbances of movement, sensation (including vision,
hearing, and taste), mood, or mental function.
EEG signal modeling is important to achieve a better
understanding of the physical mechanisms generating
these signals and to identify the causes of changes in
EEG signals [4]. Modeling can also be used for
predicting the future neurological outcome and for data
compression. In addition, simulations based on the
models of EEG signals can be used to demonstrate the
effectiveness of a certain quantitative analysis method
or EEG feature extraction.
In order to improve the estimation of noisy
physiological signals, different methods have been
employed. Some of these methods consist of machine
learning technique [5], averaging [6] and Kalman
filtering [7, 8]. Machine learning techniques can detect
artifacts efficiently but in this method large amount of
data is required. Averaging methods can reduce the
noise levels, but it smooths the signal fluctuations.
Compared to these techniques, Kalman filter (KF)
methods can estimate the trends of biological signals [9].
The properties of KF along with the simplicity of the
derived equations make it valuable in the analysis of
signals. In another study [10] an off-line Kalman filter
approach to remove Transcranial Magnetic Stimulation
(TMS) induced artifacts from EEG recordings is
proposed. Lenz et al. [7] made use of a modified
unscented Kalman filter and a corresponding unscented
smoother for the estimation of the underlying neural
activity of the brain. Purdon et al. [11] have developed a
state space approach for multimodal integration of
simultaneous EEG and fMRI. Li et al. [8] evaluated a
new robust tracking algorithm for estimating blood
pressure and heart rate (HR) based upon a Kalman
Filter with an update sequence modified by the KF
innovation sequence and the value of the Signal Quality
Index (SQI). In the study of Mneimneh et al. [12] an
adaptive Kalman filter is proposed for the real time
removal of baseline wandering using a polynomial

Modeling Epileptic EEG Time Series by State Space Model and Kalman Filtering Algorithm 27
Copyright © 2014 MECS I.J. Intelligent Systems and Applications, 2014, 03, 26-34
approximation independent of the signal characteristics.
Bohlin [13], Mathieu [14], Dusquesnoy [15],
Blechschmid [16] and Jansen et al. [17,18] have already
applied Kalman filtering to an AR model for analyzing
EEG signals.
Despite these works and the theoretical advantages
(optimal filter, non-stationary spectral analysis),
Kalman filtering was not very much used for EEG
analysis and modeling in a specific neurological and
pathological disorders. It can be assumed that the
unsolved problem of selecting the model order and the
unstable estimation algorithms were reasons for this.
From the multiplicity of concepts and methods for
time-series analysis that have been applied to neuro-
scientific time-series, this study focused on predictive
modeling, i.e., finding a predictor for future time-series
values, based on present and past values. More
precisely, we will discuss a particular class of predictive
modeling that is attracting considerable attention due to
its wide applicability: the state-space model [4, 19-22]
and Kalman filter. In this study, a state space model is
used to distinguish between the underlying brain states
and the EEG measurements in epileptic patients. In
addition, we make use of a Kalman filter for the
estimation of the fundamental neural activity.
The paper is structured as follows. In the next section,
the signals and methods (state space model and Kalman
filtering) used in this study are briefly described. Then,
the results of analysis on data sets are presented. Finally,
some results of EEG data are discussed.
II. Methods
2.1 Data Selection
Five sets (denoted A–E) each containing 100 single
channel EEG segments of 23.6-sec duration, were
collected by Andrzejak et al. [23, 24]. These segments
were selected and cut out from continuous multichannel
EEG recordings after visual inspection for artifacts, e.g.,
due to muscle activity or eye movements.
Sets A and B consisted of segments taken from
surface EEG recordings that were carried out on healthy
volunteers using a standardized electrode placement.
Volunteers were relaxed in a conscious state with eyes
open (A) and eyes closed (B), respectively. Sets C, D,
and E originated from the EEG archive of pre-surgical
diagnosis [23, 24].
Segments in set D were recorded from within the
epileptogenic zone, and those in set C from the
hippocampal formation of the opposite hemisphere of
the brain. While sets C and D contained only activity
measured during seizure free intervals, set E only
contained seizure activity. Here segments were selected
from all recording sites exhibiting ictal activity.
All EEG signals were recorded with the same 128-
channel amplifier system, using an average common
reference [omitting electrodes containing pathological
activity (C, D, and E) or strong eye movement artifacts
(A and B)]. After 12 bit analog-to-digital conversion,
the data were written continuously onto the disk of a
data acquisition computer system at a sampling rate of
173.61 Hz. Band-pass filter settings were 0.53–40 Hz
(12 dB/oct) [23, 24].
In this study, 40 EEG signals from sets A and E were
used in order to model EEG behaviors in normal and
seizure states. These two types of EEG signals are
shown in Fig. 1.
Fig. 1: Electroencephalographic signals. (Top) Healthy volunteer with open eyes. (Bottom) Epileptic patients during seizure activity

28 Modeling Epileptic EEG Time Series by State Space Model and Kalman Filtering Algorithm
Copyright © 2014 MECS I.J. Intelligent Systems and Applications, 2014, 03, 26-34
2.2 Spectral Estimation
The goal of spectral estimation is to describe the
distribution (over frequency) of the power contained in
a signal, based on a finite set of data. Estimation of
power spectra is useful in a variety of applications,
including the detection of signals buried in wideband
noise.
In general terms, one way of estimating the PSD of a
process is to simply find the discrete-time Fourier
transform of the samples of the process (usually done
on a grid with an FFT) and take the magnitude squared
of the result (MATLAB version 7.0 with Signal
Processing Toolbox). This estimate is called the
Periodogram. The Periodogram estimate of the PSD of
a length-L signal xL[n] is
Lf
fXfP
s
Lxx
2)(
)(ˆ (1)
Where
1
0
/2][)(
L
n
fjfnLL
senxfX
(2)
The actual computation of XL(f) can be performed
only at a finite number of frequency points, N, and
usually employs the FFT. In practice, most
implementations of the Periodogram method compute
the N-point PSD estimate
2[ ]ˆ [ ] ,
, 0,1, , 1
L k
xx k
s
sk
X fP f
f L
kff k N
N
(3)
Where
1
0
/2][][
N
n
NjknLkL enxfX
(4)
It is wise to choose N > L so that N is the next power
of two larger than L. To evaluate XL[fk], we simply pad
xL[n] with zeros to length N. If L > N, we must wrap
xL[n] modulo-N prior to computing XL[fk].
2.3 State Space Model
A state space representation is a mathematical model
of a physical system as a set of input, output and state
variables related by first-order differential equations. To
abstract from the number of inputs, outputs and states,
the variables are expressed as vectors. Additionally, if
the dynamical system is linear and time invariant, the
differential and algebraic equations may be written in
matrix form. The state space representation (also known
as the "time-domain approach") provides a convenient
and compact way to model and analyze systems with
multiple inputs and outputs.
The most general state-space representation of a
linear system with p inputs, q outputs and n state
variables is written in the following form:
( ) ( ) ( ) ( ) ( )
( ) ( ) ( ) ( ) ( )
x t A t x t B t u t
y t C t x t D t u t
(5)
where x(.) is the state vector, x(t)n, y(.) is the
output vector, y(t)q, u(.) is the input or control
vector, u(t)p, A(.) is the state or system matrix,
dim[A(.)] = n×n, B(.) is the input matrix, dim[B(.)] =
n×p, C(.) is the output matrix, dim[C(.)] = q×n, D(.) is
the feed through (or feed forward) matrix (in cases
where the system model does not have a direct feed
through, D(.) is the zero matrix), dim[D(.)] = q×p, and
)(:)( txdt
dtx
2.4 Kalman Filtering
The properties of KF along with the simplicity of the
derived equations make it valuable in the analysis of
biological signals. The Kalman Filter is an estimator
with interesting properties like optimality in the
Minimum Mean Square Error (MMSE).
The aim of the Kalman filter is to estimate the state
vector xk. A process of estimation which keeps pace
with the data by generating an estimate of the current
state vector xk with each new observation zk is
described as filtering. The retrospective enhancement of
a state estimate using data which has arisen
subsequently is described as smoothing. The estimation
of a future state vector is described as a prediction.
The Kalman filter is an optimal state estimation
method for a stochastic signal [25,26] that estimates the
state of a discrete time controlled process, x, with
measurement data z, where x and z are governed by the
linear stochastic difference equations
11 kkkk wBuAxx (6)
kkk vHxz (7)
The random variables w and v are independent, white,
and possess normal probability distributions, p(w) ∼
N(0, Q) and p(v) ∼ N(0, R). The matrices A, B, H are
the coefficient state transition matrices, Q is the state
noise covariance, R is the measurement noise
covariance and u is an optional control input to the state
x.
The KF algorithm is given by the following equations:
kkk BuxAx
1ˆˆ (8)

Modeling Epileptic EEG Time Series by State Space Model and Kalman Filtering Algorithm 29
Copyright © 2014 MECS I.J. Intelligent Systems and Applications, 2014, 03, 26-34
QAAPP Tkk
1 (9)
1)( RHHPHPK Tk
Tkk (10)
)ˆ(ˆˆ kkkkk xHzKxx (11)
kkk PHKIP )( (12)
where kx̂ and kx̂ are a priori and a posteriori state
estimate before and after a given measurement zk,
kP and Pk are the error covariance of a priori and a
posteriori estimate, kkk xHzr ˆ is the measurement
innovation (or residual) and Kk is the gain required to
minimize the a posteriori error covariance, Pk.
The Kalman filter algorithm is presented in Fig. 2.
Fig. 2: Kalman Filter Algorithm [27]
In Fig. 2, the part in the dashed box is a Kalman filter
algorithm. This structure receives only one input
(measurement, Zk) and returns one output (estimate,
kx̂ ). Internal process is done through a four-step
computation as discussed above.
30 Modeling Epileptic EEG Time Series by State Space Model and Kalman Filtering Algorithm
Copyright © 2014 MECS I.J. Intelligent Systems and Applications, 2014, 03, 26-34
The general idea of the Kalman filter is to propose a
model for the observations, in most cases linear, where
some parameters must be estimated. To be able to apply
the Kalman Filter or the Kalman Smoother the model
for the observations must be written in a state – space
form. A state – space model is represented by two
equations. One equation describes the evolution of the
parameters, and second equation describes the relation
of the parameters with the observations.
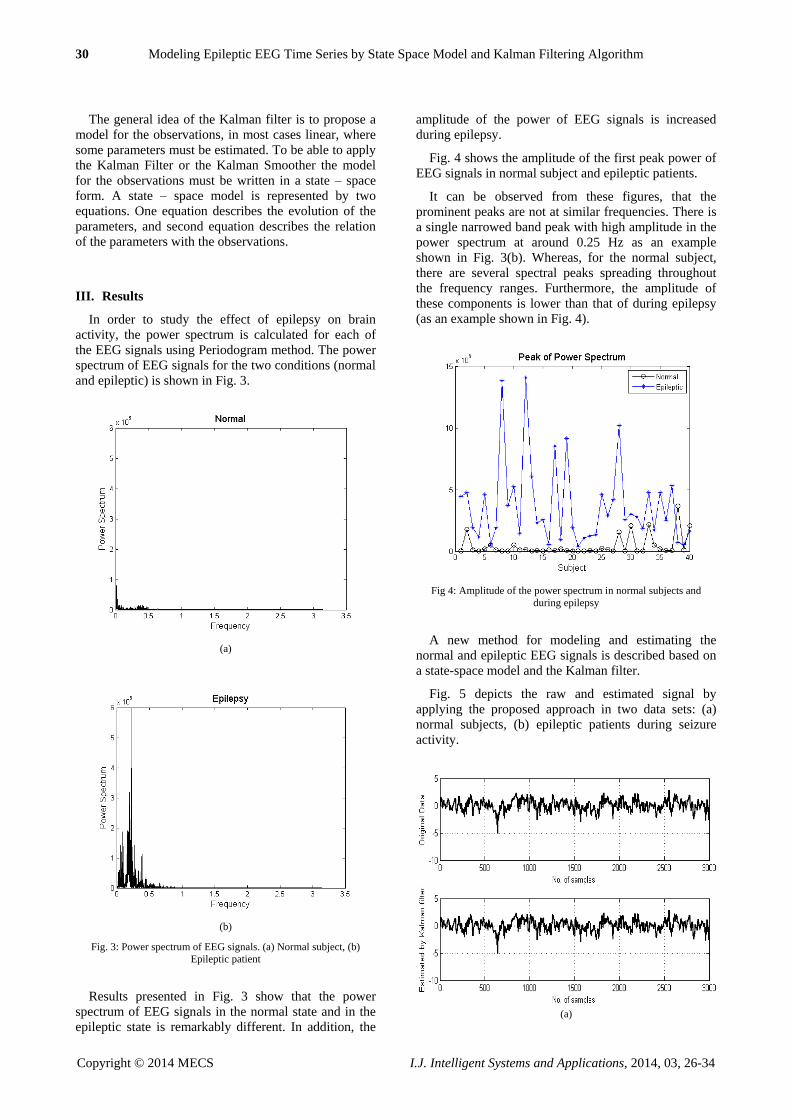
III. Results
In order to study the effect of epilepsy on brain
activity, the power spectrum is calculated for each of
the EEG signals using Periodogram method. The power
spectrum of EEG signals for the two conditions (normal
and epileptic) is shown in Fig. 3.
(a)
(b)
Fig. 3: Power spectrum of EEG signals. (a) Normal subject, (b)
Epileptic patient
Results presented in Fig. 3 show that the power
spectrum of EEG signals in the normal state and in the
epileptic state is remarkably different. In addition, the
amplitude of the power of EEG signals is increased
during epilepsy.
Fig. 4 shows the amplitude of the first peak power of
EEG signals in normal subject and epileptic patients.
It can be observed from these figures, that the
prominent peaks are not at similar frequencies. There is
a single narrowed band peak with high amplitude in the
power spectrum at around 0.25 Hz as an example
shown in Fig. 3(b). Whereas, for the normal subject,
there are several spectral peaks spreading throughout
the frequency ranges. Furthermore, the amplitude of
these components is lower than that of during epilepsy
(as an example shown in Fig. 4).
Fig 4: Amplitude of the power spectrum in normal subjects and
during epilepsy
A new method for modeling and estimating the
normal and epileptic EEG signals is described based on
a state-space model and the Kalman filter.
Fig. 5 depicts the raw and estimated signal by
applying the proposed approach in two data sets: (a)
normal subjects, (b) epileptic patients during seizure
activity.
(a)

Modeling Epileptic EEG Time Series by State Space Model and Kalman Filtering Algorithm 31
Copyright © 2014 MECS I.J. Intelligent Systems and Applications, 2014, 03, 26-34
(b)
Fig. 5: The original EEG signal (top panel) and the estimated signal
using proposed method (bottom panel). (a) Healthy volunteer, (b)
Epileptic patients during seizure activity
The estimation performance of the proposed method
on EEG signals is evaluated using the root mean square
(RMS) measurement. The RMS is a good criterion to
compute the quality of estimation algorithm that has
been implemented. With RMS measure, the difference
between the original EEG signal and the estimated
signal can be compared. The results of this evaluation
for healthy volunteer and epileptic patients during
seizure activity are summarized in Fig. 6(a) and Fig.
6(b), respectively.
(a)
(b)
Fig. 6: Estimated error (RMS) between original and estimated data for
40 subjects: (a) healthy subjects, (b) epileptic patients during seizure
activity
According to the values of the RMS (Fig. 6(a) and
Fig. 6(b)), it is obvious that by applying this method,
EEG signals could be estimated accurately. The mean
estimation error for this method on healthy individuals
and epileptic patients are about 0.0169±0.0013 and
2.98×10⁻⁶±2.58×10⁻⁶, respectively.
IV. Discussion
The variations of EEG signals can be separated into
different components by use of spectral analysis. The
frequency domain analysis of EEG signals reveals that
the pattern of the power spectrum is remarkably
different during epilepsy than that of the normal subject.
In addition, the power of EEG signals is increased
during epilepsy. There is a single narrowed band peak
with high amplitude in the power at around 0.25 Hz as
an example shown in Fig. 3(b), but for the normal, there
are several spectral peaks spreading throughout the
frequency ranges. Furthermore, the amplitude of these
components is lower than that of during epilepsy (as an
example shown in Fig. 4).
The application of Kalman filters and the state space
model for estimation of pathological EEG signals is
new to the best of our knowledge.
In this paper, it is assumed that EEG time series are
vectors valued with random process and have slow
dynamic variabilities during the specific time. In
addition, past realizations have some information which
is relevant to future realizations and these changes can
be modeled with a state-space model. It has shown that
the Kalman filter is considerably robust and it has a low
sensitivity to suboptimal parameter setting. Generally
speaking, this feature of the Kalman filter is very
important in a clinical environment, since the optimal
setting is impossible to determine. The Kalman filter is
more than just a filter since it holds the potential to
incorporate more information about the EEG generating
process in the model, maintaining the dynamics in the
signal and producing accurate estimates.
In the normal stage, the cortex is more active and
more neurons are available for processing [28]; whereas,
in epileptic stage, the cortex becomes inactive and EEG
signals become less random. The neurons in the
cerebral hemispheres during the seizure misfire and
create abnormal electrical activity. Therefore, the
number of neurons available for processing the
information reduces during the seizures. In other words,
the variability of epileptic activity was less as compared
to that of non-epileptic activity [29, 30]. It was
supported by the reduced dimensionality of epileptic
seizures as compared to non-epileptic EEG signals. This
concept finds support in the observations that neuronal
hyper-synchrony underlies seizures: a phenomenon
during which the number of independent variables
required to describe the system was smaller [31].

32 Modeling Epileptic EEG Time Series by State Space Model and Kalman Filtering Algorithm
Copyright © 2014 MECS I.J. Intelligent Systems and Applications, 2014, 03, 26-34
Morbidi et al. [10] show that by applying Kalman
filter the effect of the magnetic artifacts on the EEG
recordings has been strongly reduced, while preserving
the integrity of EEG signals around TMS impulses. The
result of Mneimneh et al. [12] shows that the Kalman
filter approach was successful in the online estimation
and removal of the baseline wandering for real-patient
and a simulated test signal.
In this study, a state space model is used to
distinguish between the underlying brain states and the
EEG measurements in epileptic patients. In addition, we
make use of a Kalman filter for the estimation of the
fundamental neural activity.
The performance of the presented approach is
evaluated using the root mean square (RMS)
measurement to produce a reliable estimation of real
EEG signals. The RMS is a good criterion to compute
the quality of estimation algorithm that has been
implemented. According to the values of the RMS (Fig.
6(a) and Fig. 6(b)), it is obvious that by applying this
method, EEG signals could be estimated accurately.
Therefore, this model is appropriate for the analysis of
EEG recordings. In fact, this model is capable of
predicting changes in EEG time series with phenomena
such as epileptic spikes and seizures.
The results presented here might be of some use in
addressing the issue of stochastic dynamics versus
chaos in the nervous system. In recent years, there has
been a tendency to view the EEG as the output of a low
dimensional dynamic system with chaotic behavior
[32,33]. An extreme point of view even banishes
stochastic effects as an explanation for the EEG signals.
The availability of parametric nonlinear models may be
of assistance in assessing the role of stochastic effects in
the EEG as well as to characterize the multiple
dynamical attractors of the nervous system, some of
which may or not be chaotic [34,35]. Further works can
be considered the nonlinear behavior of brain activity in
the modeling of EEG signals.
V. Conclusion
The results of this study showed that applying the
state space model and Kalman filter could be useful to
estimate EEG signals. In addition, this algorithm can be
applied to other non-stationary biological systems, too.
EEG time series are usually recorded from a set of
electrodes covering the whole scalp. The method which
has been proposed in this paper could be applied
independently to each channel of the data, but it would
be desirable to have a modeling approach capable of
building a single common model from all available
channels simultaneously; thereby also the spatial
information contained in the positions of electrodes
could be incorporated. The generalization of the method
to this case will be the subject of future work.
References
[1] Berger H. (1929) Über das
Elektroenzephalogramm des Menschen, Arch.
Psychiat. Nervenkr. 87:527-570.
[2] Niedermeyer E. Lopes da Silva F.H. (1999)
Electroencephalography - basic prinicples, clinical
Applications and related fields. Urban &
Schwarzenberg, 4th edition.
[3] Mormann, F. Kreuz, T. Rieke, C. Andrzejak R.G.
Kraskov, A. David, P. Elger, C.E. Lehnertz, K. On
the predictability of epileptic seizures. Clinical
Neurophysiology 116 (2005) 569–587.
[4] Astrom, K.J.: Maximum likelihood and prediction
error methods. Automatica 16, 551–574 (1980)
[5] Tsien CL, Kohans IS, Mclntosh N. Building ICU
artifact detection models with more data in less
time. Proc AMIA Symp 2001:706–10. [PubMed:
11825277]
[6] Jakob S, Korhonen I, Ruokonen E, Virtanen T,
Kogan A, Takala J. Detection of artifacts in
monitored trends in intensive care. Comput
Methods Programs Biomed 2000;63:203–9.
[PubMed: 11064143]
[7] Michael Lenz, M. Musso, M. Linke, Y. Tuscher, O.
Timmer, J. Weiller, C. Schelter, B. Joint
EEG/fMRI state space model for the detection of
directed interactions in human brains—a
simulation study. Physiol. Meas. 32 (2011) 1725–
1736
[8] Li, Q. Mark, R.G. Clifford, G.D. Artificial arterial
blood pressure artifact models and an evaluation of
a robust blood pressure and heart rate estimator.
BioMedical Engineering OnLine 2009, 8:13.
[9] Li, Q. Mark, R.G. Clifford, G.D. Robust heart rate
estimation from multiple asynchronous noisy
sources using signal quality indices and a Kalman
filter. Physiol Meas. 2008 January; 29(1): 15–32.
[10] Morbidi, F. Garulli, A. Prattichizzo, D. Rizzo, C.
Rossi, S. Application of Kalman filter to remove
TMS-induced artifacts from EEG recordings. IEEE
Transactions on control system technology (2007)
[11] Purdon, P.L. Lamus, C. Hamalainen, M.S. Brown,
E.N. A State Space Approach to Multimodal
Integration of Simultaneously Recorded EEG and
fMRI. IEEE, 2010. 5454–5457.
[12] Mneimneh, M.A. Yaz, E.E. Johnson, M.T.
Povinelli, R.J. An Adaptive Kalman Filter for
Removing Baseline Wandering in ECG Signals.
Computers in Cardiology 2006; 33:253−256.
[13] Bohlin T. (1972) A method of analyzing EEG-
signals with changing spectra. Digest of the 3rd
International Conference on Medical Physics,
Including Medical Engineering. Chalmers Univ.
Technol, Gothenburg, Sweden; 1972; xvi+317 pp.

Modeling Epileptic EEG Time Series by State Space Model and Kalman Filtering Algorithm 33
Copyright © 2014 MECS I.J. Intelligent Systems and Applications, 2014, 03, 26-34
p.21-6.
[14] Mathieu M. (1976) Anayse de
l'electroencéphalogramme par prédiction linéartre.
These, Université Pierre et Marie Curie, Paris.
[15] Duquesnoy A.J. (1976) Segmentation of EEG's by
means of Kalman filtering. Progress Report No.
PR5, pp.87-92, Institute of Medical Physics TNO,
Utrecht.
[16] Blechschmid H. (1982) Die mathematische EEG-
Auswertung mit einem schnellen online fähigen
Kalman-Filter. PhD-Thesis, University of
Technology Graz, Austria.
[17] Jansen B.H., Hasman A., Lenten R., Visser S.L.
(1979) Usefulness of autoregressive models to
classify EEG-segments. Biomedizinische Technik.
24(9): 216-23.
[18] Jansen B.H., Bourne J.R., Ward J.W. (1981)
Autoregressive estimation of short segment spectra
for computerized EEG analysis. IEEE Trans.
Biomedical Engineering. 28(9).
[19] Akaike, H., Nakagawa, T.: Statistical Analysis and
Control of Dynamic Systems. Kluwer, Dordrecht
(1988)
[20] Durbin, J., Koopman, S.J.: Time Series Analysis
by State Space Methods. Oxford University Press,
Oxford, New York (2001)
[21] Kailath, T.: Linear Systems. Information and
System Sciences Series. Prentice-Hall, Englewood
Cliffs (1980)
[22] Kalman, R.E.: A new approach to linear filtering
and prediction problems. J. Basic Engin. 82, 35–45
(1960)
[23] EEG time series are available at www.meb.uni-
bonn.de/epileptologie/science/physik/ eegdata.html
[24] Ralph K.L., Andrzejak G., Mormann F., Rieke C.,
David P., Elger C.E. (2001). Indications of
nonlinear deterministic and finite-dimensional
structures in time series of brain electrical activity:
Dependence on recording region and brain state.
Physical Review E, 64, 061907-1-061907-8
[25] Brown RG. (1983) Introduction to Random Signal
Analysis and Kalman Filtering. New York: Wiley.
[26] Welch, G.; Bishop, G. Technical Report. Dept.
Comp. Sci., University of North Carolina; Chapel
Hill: 2004. An introduction to the Kalman filter; p.
TR95-041.
[27] Chapter 5. Introduction to Kalman filter, 47-52
[28] Acharya RU, Oliver Faust, Kannathal N, TjiLeng
Chua, Swamy Laxminarayan. Nonlinear analysis
of EEG signals at different sleep stages. Comput
Methods Programs Biomed 2005;80(1):37–45.
[29] Lehnertz K, Elger CE. Can epileptic seizures be
predicted? Evidence from nonlinear time series
analyses of brain electrical activity. Phys Rev Lett
1998;80:5019–23.
[30] Martinerie J, Adam C, Le van Quyen M, Baulac M,
Renault B, Varela FJ. Can epileptic crisis be
anticipated? Nat Med 1998;4:1173–6.
[31] Lehnertz K, Elger CE. Spatio-temporal dynamics
of the primary epileptogenic area in temporal lobe
epilepsy characterized by neuronal complexity loss.
Electroencephalogr Clin Neurophysiol
1995;95:108–17.
[32] Goshvarpour A., Goshvarpour A., Rahati S.,
Saadatian V., Morvarid M. "Phase space in EEG
signals of women referred to meditation clinic",
Journal of Biomedical Science and Engineering,
4(6), 479-482, 2011.
[33] Elbert, T., Ray, W.J., Kowalik, A.J., Skinner, J.E.,
Graf, K.E., Birbaumer, N. (1994) Deterministic
chaos in excitable cell assemblies. Physiol Rev
74:1-47.
[34] Goshvarpour, A., Goshvarpour, A., Rahati, S.,
Saadatian, V. (2012) Bispectrum Estimation of
Electroencephalogram Signals during Meditation.
The Iranian Journal of Psychiatry and Behavioral
Sciences (IJPBS)
[35] Valdes, P.A., Jimenez, J.C., Riera, J., Biscay, R.,
Ozaki, T. (1999). Nonlinear EEG analysis based
on a neural mass model. Biol. Cybern. 81, 415-424.
Authors’ Profiles
Atefeh Goshvarpour: Obtained a Masters in
Biomedical Engineering from Islamic Azad University,
Mashhad Branch, Iran in 2010. Her thesis research
focused on analyzing biomedical signals during
meditation. She is a PhD student at Sahand University
of Technology, Tabriz, Iran. Her research interests
include biomedical signal processing, mathematical
modeling, nonlinear analysis and neural networks.
Ateke Goshvarpour: Obtained a Masters in
Biomedical Engineering from Islamic Azad University,
Mashhad Branch, Iran in 2010. Her thesis research
focused on analyzing biomedical signals during
meditation. She is a PhD student at Sahand University
of Technology, Tabriz, Iran. Her research interests
include biomedical signal processing, mathematical
modeling, nonlinear analysis and neural networks.
Mousa Shamsi was born in Tabriz, Iran, in 1972. He
received his B.Sc. degree in Electrical Engineering
(major: electronic) from Tabriz University, in 1995. In
1996, he joined the University of Tehran, Tehran, Iran.
He received his M.Sc. degree in Electrical Engineering

34 Modeling Epileptic EEG Time Series by State Space Model and Kalman Filtering Algorithm
Copyright © 2014 MECS I.J. Intelligent Systems and Applications, 2014, 03, 26-34
(major: Biomedical Engineering) from this university in
1999. From 1999 to 2002, he taught as a lecturer at the
Sahand University of Technology, Tabriz, Iran. From
2002 to 2008, he was a PhD student at the University of
Tehran in Bioelectrical Engineering. In 2006, he was
granted with the Iranian government scholarship as a
visiting researcher at the Ryukyus University, Okinawa,
Japan. From December 2006 to May 2008, he was a
visiting researcher at this University. Since 2008, he has
been a faculty member at Sahand university of
technology in Tabriz, Iran, From summer 2013, he is an
Associate professor at the Faculty of Electrical
Engineering, Sahand University of Technology, Tabriz,
Iran.