Modeling and simulation of hollow fine fiber modules with radial dispersion—a parametric...
12
ELSEVIER Desalination 110 (1997) 239-250 DESALINATION Modeling and simulation of hollow fine fiber modules with radial dispersion a parametric sensitivity study I.S. A1-Mutaz*, M.A. Soliman, A.E.S. A1-Zahrani Chemical Engineering Department, College of Engineering, King Saud University, PO Box 800, Riyadh 11421, Saudi Arabia Fax: +966 (1) 468-2858; E-mail: F45KOl l.KSUEDU.SA Received 10 July 1996; accepted 13 May 1997 Abstract It has been confirmed experimentally that the flow of salty water in hollow fine fiber modules is partially mixed in the radial direction. In this paper the effect of partial mixing as well as membrane physical properties, module dimensions and external operating conditions are studied numerically to determine the parameters that need to be optimized in reverse osmosis modules. Keywords." Reverse osmosis; Hollow fine fiber; Simulation; Radial dispersion I. Introduction Dandavati et al. [1] in 1975 presented a model to calculate productivity and product concen- tration Cp for a hollow fiber reverse osmosis (RO) system. They made the following assumptions for this model [ 1 ]: 1. Plug flow of the shell side concentration in the radial direction 2. Negligible concentration polarization 3. Small radial pressure drop in the shell 4. Small solute transport compared with solvent transport *Corresponding author. Soltanieh and Gill [2] suggested a complete mixing model of the hollow fiber system to account for the observation that 1/R (R is overall rejection = 1-CJCf) is linear with Sm/F p (Sm is the effective surface area of membrane, Fp is the product flow rate), and they conf'umed that experimentally at all applicable levels of the feed concentrations, pressures, and flow rates. They used two radial flow hollow fiber modules of different lengths and showed experimentally that the linear relationship between 1/R and Sm/F p exists at those levels. In 1988 Gill et al. [3] presented a study to determine experimentally the global fluid 0011-9164/97/$17.00 Copyright © 1997 Elsevier Science B.V. All rights reserved. PH S0011-9164(97)00102-1
Transcript of Modeling and simulation of hollow fine fiber modules with radial dispersion—a parametric...

ELSEVIER Desalination 110 (1997) 239-250
DESALINATION
Modeling and simulation of hollow fine fiber modules with radial dispersion a parametric sensitivity study
I.S. A1-Mutaz*, M.A. Soliman, A.E.S. A1-Zahrani Chemical Engineering Department, College of Engineering, King Saud University,
PO Box 800, Riyadh 11421, Saudi Arabia Fax: +966 (1) 468-2858; E-mail: F45KOl l.KSUEDU.SA
Received 10 July 1996; accepted 13 May 1997
Abstract
It has been confirmed experimentally that the flow of salty water in hollow fine fiber modules is partially mixed in the radial direction. In this paper the effect of partial mixing as well as membrane physical properties, module dimensions and external operating conditions are studied numerically to determine the parameters that need to be optimized in reverse osmosis modules.
Keywords." Reverse osmosis; Hollow fine fiber; Simulation; Radial dispersion
I. In troduct ion
Dandavati et al. [1] in 1975 presented a model to calculate productivity and product concen- tration Cp for a hollow fiber reverse osmosis (RO) system. They made the following assumptions for this model [ 1 ]:
1. Plug flow of the shell side concentration in the radial direction
2. Negligible concentration polarization 3. Small radial pressure drop in the shell 4. Small solute transport compared with
solvent transport
*Corresponding author.
Soltanieh and Gill [2] suggested a complete mixing model of the hollow fiber system to account for the observation that 1/R (R is overall rejection = 1-CJCf) is linear with Sm/F p (S m is the effective surface area of membrane, Fp is the product flow rate), and they conf'umed that experimentally at all applicable levels of the feed concentrations, pressures, and flow rates. They used two radial flow hollow fiber modules of different lengths and showed experimentally that the linear relationship between 1/R and Sm/F p exists at those levels.
In 1988 Gill et al. [3] presented a study to determine experimentally the global fluid
0011-9164/97/$17.00 Copyright © 1997 Elsevier Science B.V. All rights reserved. PH S0011-9164(97)00102-1
240 1.s. Al-Mutaz et al. / Desalination 110 (1997) 239-250
dynamic characteristics of hollow fiber RO modules, and to address the question of which mixing model (plug flow or complete mixing) adequately represents the pattern of flow through the system. They concluded that back-mixing exists in the modules as evidenced by effluent tracer concentration distributions.
Since most of the previous analysis was based on the work of Dandavati et al. [1], which assumes plug flow in the radial direction, we give special emphasis in this work on the effect of the mixing on the steady-state behavior of hollow fiber membranes.
The partial differential equations representing the material and momentum balances inside a hollow fine fiber RO model [4] are discretized by the method of orthogonal collocation.
2. Results
The effect of the permeability of the membrane (A), the length of the membrane (/), the feed pressure (Pf), diffusion constant (K), the feed velocity (Vf),_Peclet number (Pc), the radius of central feeder ( r i ) , and inside and outside radii of fibers (ri/ro) o n the operating conditions such as pressure drop [pressure inside the fiber (P3) in the axial and radial directions], velocities change [the shell side velocity (Vw) , the average wall permeation velocity (V1) in the axial and radial directions) and concentrations change [the shell side concentration (C0, the average concentration inside the fibers (C3) and the concentration inside the fiber (C3) in the axial and radial directions] in the shell and inside fibers. When one of the variables is changed, the other variables are held constant at the following values:
A = 5.5 × 10⁻¹² cm2 s/g
1 = 75.9 cm pf =414.17psia K = 1.82 × 10 -6 cm/s vf =0.51 cm/s Pe = 5.0 (dimensionless) r i = 1.27 cm
r i = 21 x 10 -4 cm r o = 42 × 10 -4 c m
The values of the variable, the changes of which are being studied, are shown in the figures and tables.
All output variables such as C 1, V1, Pl, C3, Vw, P3, C3 and V w are dimensionless variables. It is to be noted that in calculating Vw, the values of the standard case are used (A, pf).
2.1. Effect o f permeability o f membrane (A) on the variables inside the membrane
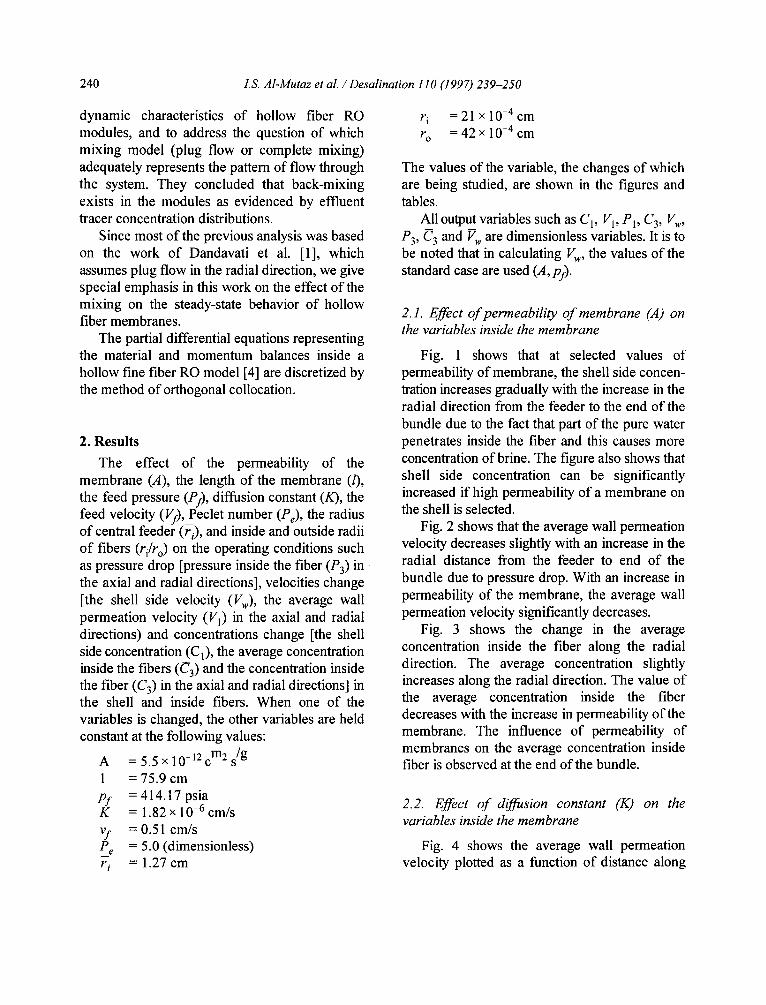
Fig. 1 shows that at selected values of permeability of membrane, the shell side concen- tration increases gradually with the increase in the radial direction from the feeder to the end of the bundle due to the fact that part of the pure water penetrates inside the fiber and this causes more concentration of brine. The figure also shows that shell side concentration can be significantly increased if high permeability of a membrane on the shell is selected.
Fig. 2 shows that the average wall permeation velocity decreases slightly with an increase in the radial distance from the feeder to end of the bundle due to pressure drop. With an increase in permeability of the membrane, the average wall permeation velocity significantly decreases.
Fig. 3 shows the change in the average concentration inside the fiber along the radial direction. The average concentration slightly increases along the radial direction. The value of the average concentration inside the fiber decreases with the increase in permeability of the membrane. The influence of permeability of membranes on the average concentration inside fiber is observed at the end of the bundle.
2.2. Effect o f diffusion constant (K) on the variables inside the membrane
Fig. 4 shows the average wall permeation velocity plotted as a function of distance along
kS. AI-Mutaz et al. / Desalination 110 (1997) 239-250 241
2.0 ' 0.6 -1+_ . .~_ Fig. 2
1 8 0.5
t; ! ~",=, 0.4 ,.._,,___ 1
I 0.3
1.0 02 0.0 02. 0.4 0.6 0.8 1.0 0.0 02 0.4 0.6 0.8 1.0
Radia l D i r e c t i o n
0.07
0.06
0.05
C'~ 0.04
0.03
0.02
Fig. 3.
0.01 , , , ' ,
0.0 02 0.4 0.6 0.8 Radial Direction
.0
the radial direction. This figure presents three curves obtained for three selected values of diffusion constant. Diffusion constant has very little influence on permeation velocity values along the radial direction, but in general the values of velocity decrease gradually from 0.175 at the feeder to a value of 0.35 at the end of the bundle along the radial direction.
Fig. 5 shows the concentration inside the fiber plotted against the distance along the radial direction for three selected values of the diffusion constant. Concentration increases slightly from a value of 0.016 at the feeder to a value of 0.02 at end of the bundle for the lowest value of the diffusion constant selected. The values of concen- tration increase with increased diffusion constant values along the radial direction.
Radia l D i r e c t i o n
Figs. 1-3. Plots of C l, V w and C 3 at different values of A. I-1, A=0.5*5.5E - 12 cm 2 s/g; ~1,, A=l.0*5.5E- 12 cm 2 s/g; II, A=2.0*5.5E - 12 cm 2 s/g.
2.3. Effect o f length o f membrane (l) on the variables inside the membrane
Fig. 6 shows that at a given value of length of the membrane, the values of the shell side concentration increase gradually in the radial direction from the feeder to end of the bundle. This is due to the fact that part of the pure water penetrates inside the fiber and this causes more concentration of brine. The effect of length of the membrane as seen in the same figure indicates that the shorter membrane gives higher values of concentration. The influence of length of the membrane on the shell side concentration decreases with increase in the length.
Fig. 7 shows that there is a small increase in the average concentration inside the fiber along the radial direction from feeder towards the end of the bundle at a given length of the membrane. These values of concentration increase when longer membranes are chosen.
Fig. 8 shows that for the same membrane there is only a small variation of average wall permeation velocity along the radial direction, especially for longer membranes. The figure also shows that the effect of length of the membrane is more significant than the effect of distances in the radial direction itself and that shorter

242 I.S. Al-Mutaz et al. / Desalination 110 (1997) 239-250
0 5 0
0.45
0.40
0.35 0.0 • ' ' ' ' "o' " "o'o 07' 0.4 6
Radial Direction
.0
0.10
0.08
0.06
0.04
0.02
0.00 0.0 " 0'2
| i ' ' I
0.4 0.6 0.8 1.0
Radial D i r e c t i o n
Figs. 4, 5. Plots of Vw and C 3 at different values of K. D, K=0.5*l.82E-6 cm/s; 0, K=l.82E-6 cm/s; m, K=2.1*l.82E-6 cm/s.
,,1 t Fg6 F g ,
Cl 1.4 ~ 0.IY5 ost 1.2
0.03 .
oo2 k 1.0 , , , , ,
0.0 0 2 0.4 0.6 0.8 1.0 0.0 0 2 0.4 0.6 0.8 1.0
Radia l D i r e c t i o n Radial D i r e c t i o n
0.7 Fig. 8.
0.6
0.5
v'v o.4
0.3.
0.,2 I I ! • |
0.0 02 0.4 0.6 0.8 .0
Radia l D i r e c t i o n
Figs. 6-8. Plots ofCl, C 3 and V w at different values of L. D, L=40 cm; O, L=75 cm; II, L=150 cm.
membranes give higher values of velocity. The change in the average wall permeation velocity values is more significant for these shorter membranes.
2.4. Effect o f central feeder radius (r~) on the variables inside membrane
Fig. 9 shows the variation of shell side concentration in the radial direction for three different values of radius of central feeder. As seen, the concentration increases in the radial

1.S. ,41-Mutaz et al. / Desalination 110 (1997) 239-250 243
2.5
2.0
1.5
1.0
C1
0.0 02 0.4 0.6 0.8 1.0 Rad ia l D i r e c t i o n
PI
1.04
1.0~'
1.02'
1.01 0.0
l • _ Fig. 10. j
"---._ I q I " ' I ' " I " ' I ' " [
02 0.4 0.6 0.8 ! .O Radial Direc t ion
0.5 0.12 J Fig. 12. 0.,o / " I
o , 0.08
V v o.o6 0.3
0.04
0.2 0.02 0.0 0.2 0.4 0.6 0.8 1.0 0.t3 02 0.4 0.6 0 8 1.0
Radial Direction Radial Direction
Figs. 9-12. Plots of C1, P1, Vw and C 3 at different values of~ i. I--1, ~i = 0.5"1.27 cm; 41,, ~i = 1.27 cm; I , ~i = 2"1.27 cm.
direction towards end of the bundle for all values of radius of central feeder, but it has a significant influence on the concentration values. The shell concentration increases with increase of central feeder radius.
Fig. 10 represents the variation of shell side pressure in the radial direction for three different values of the radius of the central feeder. It is seen that at the feeder the pressure values is constant at 1.037 for all values of the radius of the central feeder. When the position changes from the feeder to end of the bundle in the radial direction, values of pressure decrease with an increase in the radius for the same position in the radial direction. There is a small variation or decrease in the pressure values towards end of the
bundle for the lowest value of radius, but this variation increases with an increase in the radius.
Fig. 11 shows that the average wall permea- tion velocity decreases along the radial direction for all three values of the radius of the central feeder. The value of velocity is equal to 0.47 at the feeder for all values of radius and decreases with the increase in the radius for the same position along the radial direction towards end of the bundle. The variation in the value of velocity is slight for the lowest value of radius, but this variation increases with the increase in radius.
Fig. 12 shows the average concentration inside the fiber plotted along the radial direction for three different values of radius of central feeder. As seen from this figure, concentration increases
244 LS. Al-Mutaz et aL / Desalination t i0 (1997) 239-250
1.6
1.5'
1.4-
CI 1.3 -
1.2
1,1
0.0
!
O? 0.4 0.6 0.8 1.0 Radial Di rec t ion
P I
!.0~ ~ ~ ~ - ~
1.02
1.01
1.00
0.99
0 .98
0.0
Fig. 14. ~ ' ~ ' ~ ~
02 0.4 06 08 10
Radia l D i r e c t i o n
t 33
Fig. 15.
0 . | 0 .
0.05. ~ ,
0.00 ........ • . - , • • ~ • . , . . 0.0 0.2
V ~
0.7-
0.4 0.6 018" ' 1.0 0 .1 - t~ ' ! - ' , ~ ' . ~ ',' • , • • i • ' - iii
Radial Direc t ion 0.0 02 0.4 0.6 0.8 1.0 Radial D i r e c t i o n
0,6 ~r
oz~ 0.4-
0.3
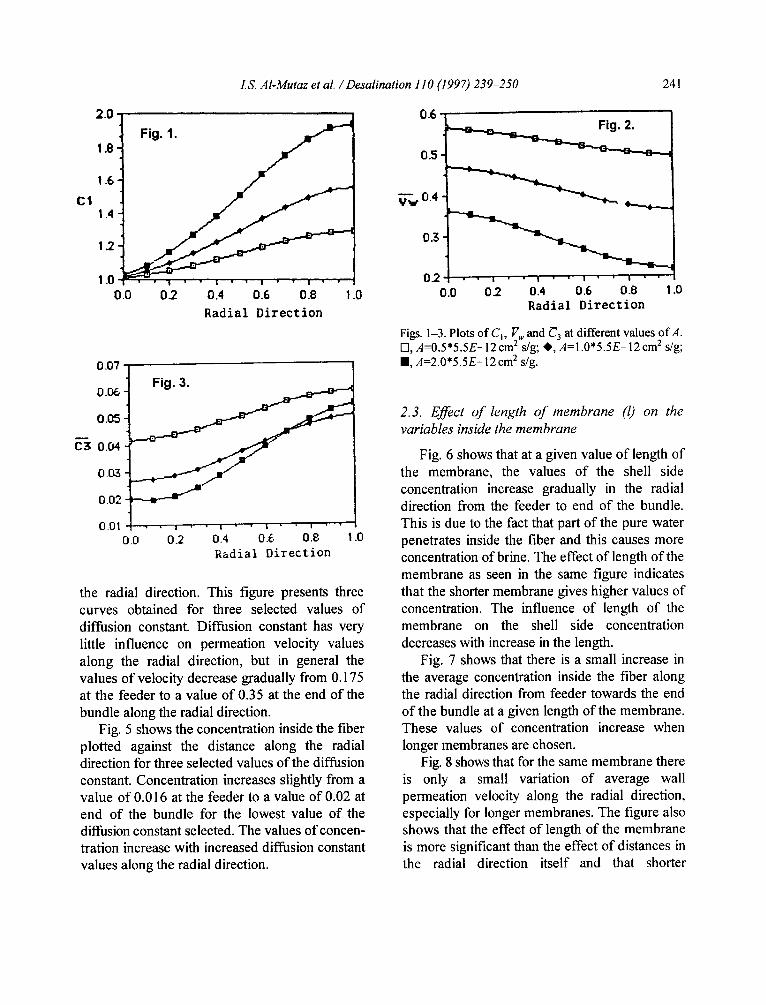
Figs. 13-16. Plots ofC~, PI, Vw and C 3 at different values of r t. 0, r i = 0.5"21E-4 cm; ro=0.5*42E-4 cm; ~, r~ = 21E-4 crn; r o = 42E-4 cm; Ill, r i = 2"21E-4; r o = 2"42E-4 cm.
with increase in the distance form the feeder along the radial direction for all values of radius. Further concentration values increase with an increase in the radius at the same distance along the radial direction. The influence of the radius on the concentration values is very little for the two lowest values of radius, but is very high for the third value of radius, The influence of radius is insignificant at the feeder but becomes significant towards the end of the bundle.
2.5. Effect o f inside and outside radii o f fiber (rffr o) on the variables o f the &side membrane
Fig, 13 shows the variation of shell side
concentration in the radial direction for three different values of the inside/outside ratio of fibers, The curves indicate that the concentration value increases with an increase in distance in the radial direction from the feeder to end of the bundle. The change in the values of the i/o radii have a negligible influence for the two lowest values, but this influence increases considerably for the higher value of i/o radii towards the end of the bundle.
Fig, 14 shows that the shell side pressure plotted against the position in the radial direction for three different values of inside and outside radii of fibers. There is a noticeable decrease in pressure from the feeder to the end of the bundle

I.S. Al-Mutaz et al. / Desalination 110 (1997) 239-250 245
in the radial direction for the lowest value of i/o radii. The values of pressure increase with an increase in i/o radii except at the feed position. The variation of pressure in the radial direction is small for the higher values i/o radii.
Fig. 15 shows the average concentration inside the fiber plotted along the radial direction for three different values of inside and outside radii of fiber. There is a small increase in concentration values along the radial direction towards end of the bundle for the lowest value of i/o radii, but this variation becomes insignificant for the highest value of i/o radii. From the three curves, it is seen that concentration decreases with increase in i/o radii.
Fig. 16 shows that there is an insignificant decrease in the average wall permeation velocity along the radial direction for all values of i/o radii which have a great influence on the value of velocity since it increases with an increase in i/o radii as seen from the curves.
2.6. Effect o f feed pressure (Pf ) on the variables of the inside membrane
Fig. 17 shows that there is gradual variation in the value of the shell side concentration in the radial direction. These values of concentration start from zero at the feeder in the radial direction for all values of pressures selected, and they increase to maximum at the end of the bundle. For the values of feed pressure selected, it is seen in the figure that the pressure has a large influence on the values of concentration in the radial direction. It is also indicated that the values of concentration have a marked increase in the radial direction when the pressure selected increases.
Fig. 18 shows that the values of wall permeation velocity decrease slightly along the radial direction from the feeder to the end of the bundle for the lowest value of feed pressure. Pressure has a great influence on velocity values along the radial direction since the velocity varies gradually with a small increase in pressure.
Fig. 19 shows that the concentration inside the fiber increases along the radial direction from the feeder to the end of the bundle for the two small values of feed pressure selected. The values of concentration along the radial direction are higher for the smallest value of pressure selected. As observed from the same figure, for the three larger values of pressure selected the curves take different shapes. The concentration value starts to decrease first to a minimum value at r= 0.1 and then increases to a maximum at the end of the bundle where r= 1.0. The three plotted curves appear to cross each other at r=0.5; then the values of concentration increase more rapidly to a maximum when pressure increases.
2.7. Effect of feed velocity (Vf ) on the variables inside membrane
Fig. 20 shows the values of shell side pressure at different points in the radial direction plotted for three selected values of feed velocity. As seen in the figure, the variation of the values of pressure in the radial direction is dependent on the values of feed velocity. There is a decrease in the values of pressure in the radial direction. The shell pressure increases with an increase in velocity. At the highest value of velocity there is a marked decrease in the value of pressure along the radial direction.
Fig. 21 shows that the shell side velocity decreases gradually in the radial direction from feeder to the end of the bundle for the three selected values of feed velocity. However, the decrease is very small.
Fig. 22 shows that the shell side concentration increases slightly in the radial direction for the two highest selected values of feed velocity. For the smallest value of feed velocity there is a large increase in the value of concentration from 1.0 at the feeder to 3.5 at the end of the bundle.
Fig. 23 shows the variation of the values of average concentration inside the fiber when plotted at different points along the radial

246 LS. Al-Mutaz et aL / Desalination 110 (1997) 239-250
Cl 2
Fig. 17.
0.0 0.2 0.4 0.6 0.8 1 .O
R a d i a l D i r e c t i o n
1.5
1.0
0.5
0.0
Fig. 18.
0.0 0,2 0.4 0.6 0.8 Radial Direction
.0
0.07
0,136
0.05
C ~ 0.04
0.03
0,02
0.01 0,0
Fig. 19.
• i • i i 1
0.2 0.4 0.6 0.$ 1,0
Radial Direction
direction from the feeder to end of the bundle. Each of the three curves is taken for a selected value of feed velocity. As seen, there is a very small variation in concentration along the axial direction for the two higher values of velocity. For the lowest value of velocity the case is different, since concentration decreases at the beginning (from 0.075 at the feeder to 0.025 at the distance of 0.1 in the radial direction) and then remains constant (between the distance of 0.1 to 0.2), followed by a big increase towards the end of the bundle (till it reaches 0.425 at end of the bundle).
Fig. 24 shows the variation of the curves of the average wall permeation velocity taken at different points along the radial direction for three different values of feed velocity. It is seen
Figs. 17-19. Plots of C1, V w and C 3 at different values of Pf. El, Pf= 214.7 psi; ~I,, Pf= 414.7 psi; II, Pf= 614.7 psi; <>, Pf= 814.7 psi; =,, Pf= 1014.7 psi.
from the figure that there is a very small variation in the permeation velocity values along the radii direction since they decrease from the feeder to the end of the bundle for the two highest values of feed velocity. There is a very small increase in permeation velocity values except at the feeder where it is constant at 0.47 for these two values of feed velocity. For the lowest values of feed velocity the value of permeation velocity at the feeder is the same as that as for the other two values of feed velocity, but it decreases gradually to a value of 0.1 at the end of the bundle.
2.8. Effect of Peclet number (Pc) on the variables inside membrane
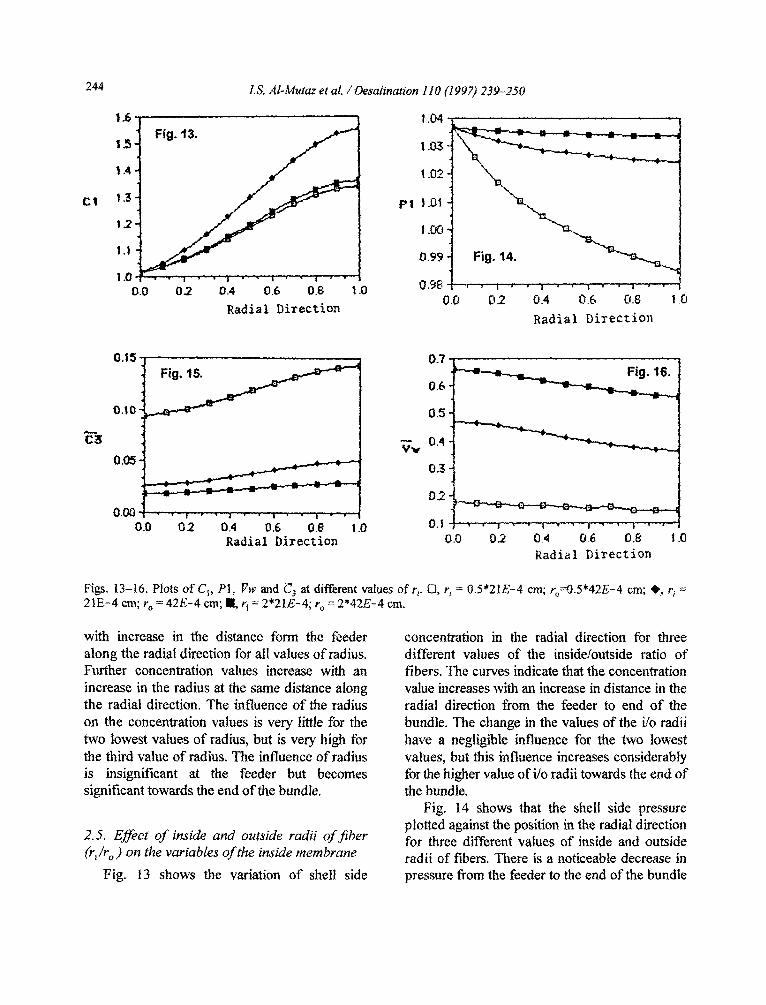
Fig. 25 represents the shell side concentration in the radial direction for seven different values of Peclet numbers. As seen from the figure, the values of concentration increase from feeder to the end of the bundle in the radial direction for all Peclet numbers. At the lowest value of Pe, 0.0 I, the increase in concentration (1.58 at the feeder to 1.59 at the end of the bundle) is insignificant. At the second lowest value of Pe (0.1), the value of

I.S. Al-Mutaz et al. / Desalination 110 (1997) 239-250 247
1.04
12
1.0 --11, Fig" 21. 1.03 1 \
Pl O.6 ~
1.02 V 1 0.4
o.2 t .01
0.0 0 . 2 0 . 4 0 . 6 0 . 8 1 .0 0 . 0 • , • , • , ,
Radia l D i r e c t i o n 0.0 0~2 0.4 0.6 0.8
Radial Direction
.0
3
C1
2
1
0.0
Fig. 22. 777 02 0.4 0.6 0.8 .0
Rad ia l D i r e c t i o n
0.5
m
C 3
Fig. 23. 0.4
0.3
0 2
0.1
0 . 0 • ~ 1 . i i
0.0 O~ 0.4 06. 0.8 Radial Direction
.0
Figs. 20-24. Plots ofPl, V l, C l, C 3 and V w at different values of Vf. [q, Vi= 0.10; i , Vf= 0.51; II, Vf = 1.00.
0.5
0.4
0.3
~ r 0.2
0.1
0.0 • I
0.0 0.2
Fig. 24 I I ' I
0.4 0.6 0.8
Radial D i r e c t i o n
.0
concentration increase slightly (1.2 at the feeder to 1.45 at end of the bundle). For the other higher values of Peclet numbers, there is a significant increase in concentration values (1.0 at the feeder to 1.5 at end of the bundle).
Fig. 26 shows the values of the average wall permeation velocity along the radial direction. Each of the seven curves in this figure represents the values of velocity of a selected value of the Peclet number. It is seen that the value and the variation of velocity along the radial direction are dependent on the value of Peclet number. For the lowest two values of Peclet number (0.01 and
248 I.S. Al-Mutaz et al. / Desalination 110 (1997) 239-250
1.6 o . 4 8 - - , - • ~ Fig. 26.
1.5- 0.46 t - ~ ~
I C !
I 1 .I 0 . 3 6 ~
1.0 . . . . . . . . i • • 0.34 0 . 0 0 . 2 0 . 4 0 . 6 0 . 8 .0 0 . 0 0 . 2 0.4 0.6 0.8 1.0
Radial D i rec t ion kadia l D i rec t ion
0.06,
0.05
o o3
0.02 t 0.0
Fig. 27.
• ~ " ~ ' 0 ' 6 . ' ' 0.2 0.4 0.6: Radial D i rec t ion
.o
0.1), the values of velocity are low (0.37) at the feeder and then decrease slightly towards end of the bundle to reach 0.35. For the third value of Peclet number 1.0, the value of velocity jumped to 0.44 at the feeder and varied significantly to decrease to 0.39 at the end of the bundle. For the three highest values of Peclet numbers, the values of velocity along the radial direction are higher (0.46) at the feeder, then remain constant from feeder to a point equal 0.2 in the radial direction and then decrease to 0.39 at the end of the bundle. From this, it is clear that the values of Peclet numbers have little influence on the velocity in the higher range, since the three curves coincide.
Fig. 27 shows the concentration inside the fiber plotted against the distance along the radial direction for seven selected values of Peclet
Figs. 25-27. Plots of C], 17 w and C 3 at different values of Pc" t~, Pe = 0.01; * , Pe = 0 .10 ; m , Pe = 1 .00; <>, Pe = 10 .0 ;
m, Pe = 20 .0 ; IS], Pe = 50 .0 ; A , Pe = 100 .
numbers. The values of concentration decrease with increase in the values of Peclet numbers in general. The variation of concentration along the radial direction increases with an increase in Peclet numbers. For the two lowest values of Peclet numbers (0.01 and 0.1), the concentration has an insignificant increase from the feeder to the end of the bundle, and the concentration values decrease slightly with an increase in the values of the Peclet numbers. For the third Peclet number (1.0), the concentration values show a large decrease when compared to the previous values, especially at the feeder where the concentration value is equal (0.032), increasing gradually to 0.047 at the end of the bundle. For the four higher Peclet numbers, there is no influence on concentration since the four curves coincide. However, as compared to the previous values, concentration values are lower, especially at the feeder where they are equal (0.027), and remain constant till the point equal to .2 along the radial direction and then increases to reach 0.05 at the end of the bundle. At the feeder the Peclet number has a very small influence on the values of concentration for all seven selected values.

I.S. Al-Mutaz et al. / Desalination 110 (1997) 239-250 249
3. Discussion
The increase in membrane permeability A is generally desirable in spite of the large increase in the pressure drop in the membrane.
The increase in the diffusion constant K mainly increases the salt concentration in the product and thus is undesirable. The increase in membrane length causes a large increase in the pressure drop inside the fiber leading to less water permeation and higher salt concentration in the product. The membrane length should be as small as possible. The effect o f the increase or decrease o f the values of ri, r o is very important. An increase in their values causes an increase in the permeate velocity and reduces the product concentration. It seems that the values r i =2.1 x 10 -4 c m and r o = 4 2 x 1 0 -4 c m which are used in industry are close to optimum. An increase or a decrease in these values reduces productivity.
The increase o f feed pressure is always advantageous and is limited by the ability of the membrane to stand high pressure. It is interesting to note that the variation o f the average salt concentration, C 3, inside the membrane reverses its decrease trend with the increase o f the pressure at high pressure and large radial direction due to the interaction between increased concentration o f the shell side brine and increased pressure whereby the increased concentration has more effect in this case. The decrease of velocity causes the increase in the product salt concentration due to a higher residence time but increases the productivity. Thus there is optimum velocity.
The Peclet number increase is advantageous due to lower product salt concentration. The Peclet number increases with the increase o f the
inlet velocity.
4. Conclusions
In summary, the following parameters need to be optimized: membrane length, shell radius, inside and outside diameter o f membrane fibers
and feed velocity. The central feeder radius does not have much effect except for the small effect o f reducing or increasing the number of membranes. The outer shell radius is a very important parameter as it increases the productivity but at the same time increases the salt concentration. Therefore, an optimum outer shell radius should be determined.
5. Symbols
A - - permeability of membrane, cm 2 s/g cf - - feed concentration, g solute/g solvent c 1 - - shell side concentration, g solute/
g solvent C 1 - -d imens ion l e s s shell side concentration
= cl/c I c 3 - - fiber side concentration, g solute/
g solvent C 3 - -d imens ion l e s s fiber side concentration
= C3/¢ f C 3 - -d imens ion l e s s fiber side concentration
averaged over the fiber length D - - diffusivity, cm2/s K - - diffusion constant, cm/s l - - active length o f fiber, cm Pl - - shellside pressure, g/cm s 2 pf - - feed pressure, g/cm s 2 P1 - - dimensionless shell side pressure - -p l /
(Pf-Patm) Pf - - dimensionless fed pressure =p/
(Pf-Patm) P3 - - fiber side pressure, g/cm s 2 P3 - - dimensionless fiber side pressure Pe - - Peclet number = vfri/D r - - dimensionless coordinate defined as [r =
(R- 1 )/(Ro- 1)1 r i - - inside fiber radius, cm r o - - outside fiber radius, cm r- i - - central feeder radius, cm r- o - - fiber bundle radius, cm R - - dimensionless radial coordinate = r/Ti R o - - d i m e n s i o n l e s s fiber bundle radius =
ro/r i

250 I.S. Al-Mutaz et al. / Desalination 110 (1997) 239-250
vl Vl V1
~w Vw
v W
radial feed velocity, cm/s shellside velocity, cm/s
- - d i m e n s i o n l e s s shellside velocity = vl/v:
- - wall permeation velocity, cm/s dimensionless wall permeation velocity = vw/vw*
- - w a l l permeation velocity, on the average length, cm/s wall permeation velocity for pure water, cm/s = -A ( p f - Patm)
References
[1] M.S. Dandavati, M.R. Doshi and W.N. Gill, Chem. Eng. Sci., 30 (1975) 877.
[2] M. Soltanieh and W.N. Gill, Desalination, 49 (1984) 57.
[3] W.M. Gill, M.R. Matsumoto, A.L. Gill and Y. Lee, Desalination, 68 0988) 11.
[4] A.E.S. A1-Zahrani, M.A. Soliman and I.S. Al- Mutaz, Desalination, 75 0989) 15.