Modeling and Experimentation of Thickness Mode E/M Impedance and Rayleigh Wave Propagation for...
9
1 Copyright © 2014 by ASME ASME 2014 Conference on Smart Materials, Adaptive Structures and Intelligent Systems SMASIS2014 Sept 8-10, 2014, Newport, Rhode Island, USA DRAFT SMASIS2014-7571 MODELING AND EXPERIMENTATION OF THICKNESS MODE E/M IMPEDANCE AND RAYLEIGH WAVE PROPAGATION FOR PIEZOELECTRIC WAFER ACTIVE SENSORS ON THICK PLATES Tuncay Kamas Mechanical Engineering University of South Carolina Columbia, SC, USA Victor Giurgiutiu Mechanical Engineering University of South Carolina Columbia, SC, USA Bin Lin Mechanical Engineering University of South Carolina Columbia, SC, USA ABSTRACT This paper discusses theoretical and experimental analyses of the standing harmonic waves through the electro-mechanical impedance spectroscopy (EMIS) and guided surface acoustic waves (SAW) through the guided wave propagation (GWP) analyses. Both EMIS and GWP analyses have been carried out by utilizing piezoelectric wafer active sensors (PWAS) for in situ structural inspection. PWAS has recently been extensively employed in many applications such as nuclear-structural as well as aero-structural health monitoring and non-destructive evaluations (NDE). EMIS method is utilized for high frequency local modal sensing to determine the dynamic characteristics of PWAS bonded on nuclear-structural component for in-situ ultrasonics. Rayleigh waves a.k.a., SAW, were generated in relatively thick isotropic elastic plates. Rayleigh waves have the property of propagating close to the plate surface, with rapid attenuation with depth. The polarization of Rayleigh waves lies in a plane perpendicular to the surface so that the effective penetration depth is less than a wavelength. Rayleigh waves are a high frequency approximation of the first symmetric (S 0 ) and anti-symmetric (A 0 ) Lamb wave modes. As the frequency becomes very high the S 0 and the A 0 wave speeds coalesce, and both have the same value. This value is exactly the Rayleigh wave speed and becomes constant along the frequency. In the first part of the study, simplified theoretical constrained PWAS-EMIS model is briefly discussed in relatively high frequency range (in MHz order of magnitude) in terms of thickness mode. Analytical predictive thickness mode impedance simulations of PWAS bonded on plate-like host structures are presented in corresponding with the experiments. For the experimental analyses, PWAS transducers are affixed on isotropic elastic plates such as aluminum plate in relatively high thickness and on a rail I-beam. The extent of the agreement between the experimental and analytical EMIS analyses of PWAS in thickness mode is presented. The study is followed with GWP tests through the pitch-catch method. Rayleigh wave signal packets which are generated in the relatively thick plate and a rail I-beam in high frequency region are assessed along with the experimental thickness mode PWAS-EMIS results. The tuning curve of Rayleigh wave is determined to show the tuning effect of the structure thickness on producing a dominant Rayleigh wave mode. The significant usage of the tuned Rayleigh wave mode is essentially discussed for the applications in the in-situ inspection of relatively thick structures such as nuclear power plant structures. The paper ends with summary, conclusions and suggestions for future work.
Transcript of Modeling and Experimentation of Thickness Mode E/M Impedance and Rayleigh Wave Propagation for...
1 Copyright © 2014 by ASME
ASME 2014 Conference on Smart Materials, Adaptive Structures and Intelligent Systems
SMASIS2014
Sept 8-10, 2014, Newport, Rhode Island, USA
DRAFT
SMASIS2014-7571
MODELING AND EXPERIMENTATION OF THICKNESS MODE E/M IMPEDANCE
AND RAYLEIGH WAVE PROPAGATION FOR PIEZOELECTRIC WAFER ACTIVE
SENSORS ON THICK PLATES
Tuncay Kamas Mechanical Engineering
University of South Carolina Columbia, SC, USA
Victor Giurgiutiu Mechanical Engineering
University of South Carolina Columbia, SC, USA
Bin Lin Mechanical Engineering
University of South Carolina Columbia, SC, USA
ABSTRACT
This paper discusses theoretical and experimental analyses of
the standing harmonic waves through the electro-mechanical
impedance spectroscopy (EMIS) and guided surface acoustic
waves (SAW) through the guided wave propagation (GWP)
analyses. Both EMIS and GWP analyses have been carried out
by utilizing piezoelectric wafer active sensors (PWAS) for in
situ structural inspection. PWAS has recently been extensively
employed in many applications such as nuclear-structural as
well as aero-structural health monitoring and non-destructive
evaluations (NDE). EMIS method is utilized for high frequency
local modal sensing to determine the dynamic characteristics of
PWAS bonded on nuclear-structural component for in-situ
ultrasonics. Rayleigh waves a.k.a., SAW, were generated in
relatively thick isotropic elastic plates. Rayleigh waves have the
property of propagating close to the plate surface, with rapid
attenuation with depth. The polarization of Rayleigh waves lies
in a plane perpendicular to the surface so that the effective
penetration depth is less than a wavelength. Rayleigh waves are
a high frequency approximation of the first symmetric (S0) and
anti-symmetric (A0) Lamb wave modes. As the frequency
becomes very high the S0 and the A0 wave speeds coalesce, and
both have the same value. This value is exactly the Rayleigh
wave speed and becomes constant along the frequency.
In the first part of the study, simplified theoretical
constrained PWAS-EMIS model is briefly discussed in
relatively high frequency range (in MHz order of magnitude)
in terms of thickness mode. Analytical predictive thickness
mode impedance simulations of PWAS bonded on plate-like
host structures are presented in corresponding with the
experiments. For the experimental analyses, PWAS transducers
are affixed on isotropic elastic plates such as aluminum plate
in relatively high thickness and on a rail I-beam. The extent of
the agreement between the experimental and analytical EMIS
analyses of PWAS in thickness mode is presented. The study is
followed with GWP tests through the pitch-catch method.
Rayleigh wave signal packets which are generated in the
relatively thick plate and a rail I-beam in high frequency
region are assessed along with the experimental thickness
mode PWAS-EMIS results. The tuning curve of Rayleigh wave
is determined to show the tuning effect of the structure
thickness on producing a dominant Rayleigh wave mode. The
significant usage of the tuned Rayleigh wave mode is
essentially discussed for the applications in the in-situ
inspection of relatively thick structures such as nuclear power
plant structures. The paper ends with summary, conclusions
and suggestions for future work.
2 Copyright © 2014 by ASME
INTRODUCTION Piezoelectric wafer active sensor (PWAS) (1) is light-
weighted, inexpensive, unobtrusive, minimally intrusive sensor
requiring low-power. PWAS is made of piezoelectric ceramic
with electric field polarization, 3E , across the electrodes
deposited on both surfaces. It has recently been extensively
employed in many applications for structural health monitoring
(SHM) and non-destructive evaluations (NDE) (2,3) through
guided wave generation and transduction.
Electro-mechanical impedance spectroscopy (EMIS)
method has been utilized to determine the local dynamic
characteristics of PWAS bonded on a host structure for in-situ
ultrasonics (4) such as in the work presented by Sun and Liang
(5, 6). They utilized the EMIS method for high frequency local
modal sensing. The thickness (out-of-plane) mode theory has
been developed for piezoelectric crystal and ceramic resonators.
Tiersten (7)
presented a pioneering work to develop the
analytical solution for the thickness vibration of an anisotropic
piezoelectric plate. He used the resonator theory with traction-
free 0T boundary conditions at surfaces of a plate. The
analytical in-plane impedance for piezoelectric ceramic
transducers such as PWAS has been developed by Zagrai and
Giurgiutiu (4, 8). One and two dimensional in-plane E/M
impedance models for free PWAS and constrained PWAS were
derived to model the dynamics of PWAS and substrate structure
in terms of EMIS. They assumed the constant electric field, 3E ,
to derive the in-plane EMIS. However, the analytical study for
thickness mode of PWAS-EMIS has not been fully performed
yet. The present work aims to extend the EMIS model of a
constrained PWAS at high frequencies (up to 15MHz). Kamas
et-al (9) adopted the constant electric displacement assumption
used in the literature (10, 11) and solved the piezoelectric
constitutive equations for the thickness mode. Thickness mode
EMIS of free PWAS was derived employing axial wave mode
dominating in thickness mode and validated using results from
coupled field finite element analysis (CF-FEA) and
experimental analysis.
Rayleigh wave that resembles to axial wave mode is an
elastic wave that propagates close to free surface with as low
penetration into the medium as of the order of its wavelength.
Rayleigh wave in an isotropic elastic medium are in many cases
an appropriate tool for ultrasonic inspection by utilizing the
useful property of Rayleigh waves, the propagation speed is
independent of frequency (12). Rayleigh wave, the high
frequency guided wave mode in isotropic plates, was
interpreted as the convergence of the first anti-symmetric A0
and symmetric S0 Lamb wave modes by (13). It can be seen in
dispersion curves of Lamb wave modes that for large
frequency-thickness products, the wave speeds of A0 and S0
Lamb wave modes coalesce at the wave speed of a Rayleigh
wave. In the literature, the Rayleigh wave a.k.a surface acoustic
wave or surface guided wave has been utilized for in-situ
monitoring of many types of defects in a medium. (13, 14 and
15) used Rayleigh waves for detection of fatigue crack growth
and corrosion through wall thickness with theoretical
predictions for the thickness loss.
In the current study, one dimensional analytical thickness
mode E/M impedance model for PWAS constrained on a host
structure is presented. The analytical PWAS-EMIS results in
relatively high frequency range are analyzed for clarity of the
trend and easy predictability of the experimental impedance
spectra and decent agreement between experimental and
analytical E/M impedance spectra by relating the dominant
Rayleigh wave mode in high frequency band. Therefore, one
can obtain more clear impedance spectra in the Rayleigh wave
region since Rayleigh wave is a non-dispersive i.e. wave speed
is independent from frequency alike axial waves. Thickness of
the substrate is also significant parameter to adjust the
thickness mode resonance frequency band where Rayleigh
wave mode shows up by using the proof-mass concept of the
fact that proof-masses shift system resonance towards optimal
frequency point. In a recent study, proof-mass PWAS (PM-
PWAS) resonator is introduced (16) and analytical and
numerical simulations are presented for different thickness of
proof-masses bonded on PWAS resonators to study the
phenomenon of increasing proof-mass height shifts the local
system resonance downward.
The current paper also discusses Rayleigh wave tuning
curves calculated analytically in terms of strain and measured
experimentally in terms of output voltage and the ratio
between output to input voltage. The tuning curve of Rayleigh
wave is determined to show the tuning effect of the structure
thickness on producing a dominant Rayleigh wave mode. The
significant usage of the tuned Rayleigh wave mode is
essentially discussed for the applications in the in-situ
inspection of relatively thick structures such as nuclear power
plant walls.
THEORY
Constrained PWAS-EMIS
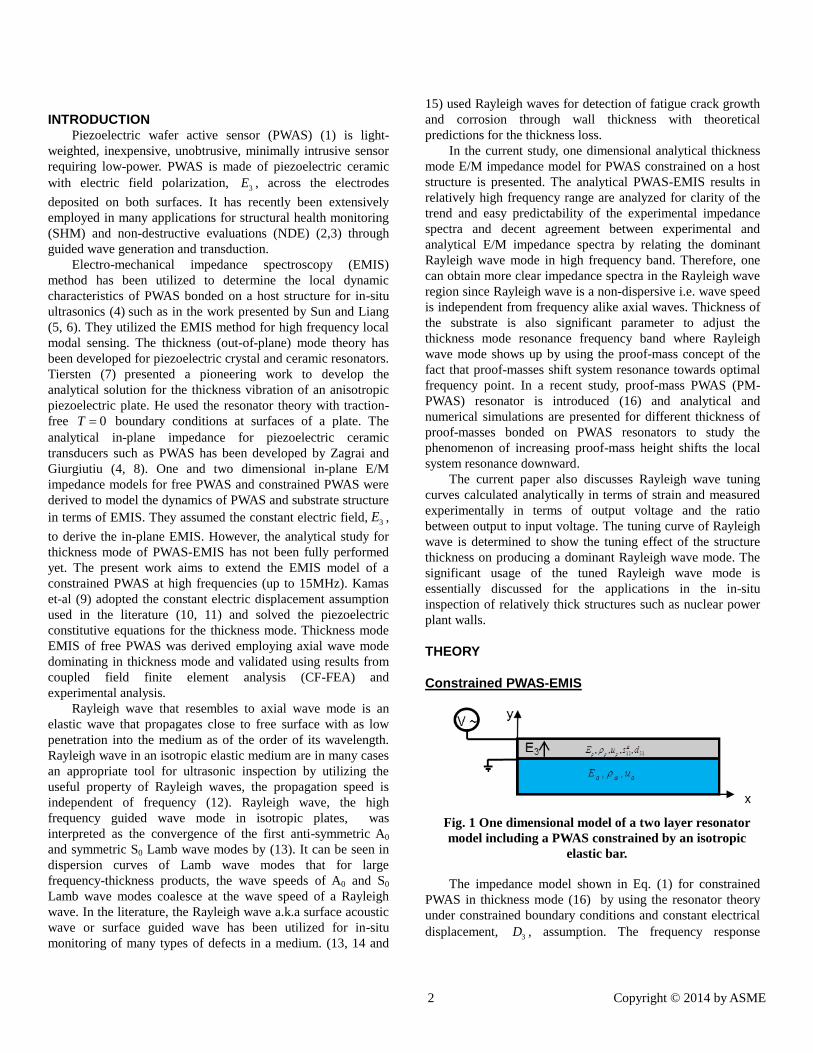
The impedance model shown in Eq. (1) for constrained
PWAS in thickness mode (16) by using the resonator theory
under constrained boundary conditions and constant electrical
displacement, 3D , assumption. The frequency response
Fig. 1 One dimensional model of a two layer resonator
model including a PWAS constrained by an isotropic
elastic bar.

3 Copyright © 2014 by ASME
function (FRF) is solved through the normal mode expansion
(NME) method and inverse of the FRF gives the dynamic
structural stiffness ( )strk that is substituted into the thickness
mode EMIS equation for constrained PWAS by the stiffness
ratio, ( ) ( ) /str PWASr k k where 33 /D
PWASk Ac t and A is
the PWAS surface area, 33
Dc the stiffness, and t the thickness.
2
33
0
1 11
cott t
VZ
I i C r
(1)
where the E/M impedance is the ratio of V the voltage to I the
current, and in terms of the angular frequency, 0C the
capacitance, 33 the E/M coupling coefficient in thickness
mode, and 0.5 /t t c , /c E is the phase velocity of
axial wave, E is the elastic modulus, is the mass density of
the host material in which the standing axial wave oscillates,
Rayleigh Wave Tuning Curve In this subsection, by assuming 1-D medium, a solution for
the tuning curve of Rayleigh wave which resembles to axial
wave generated by PWAS ideally bonded on a substrate
structure is conducted. The strain as a function of distance on
which the axial wave travels is obtained by
0( )
0sini x t
ax i ae
(2)
for harmonic excitation (17) where /du dx the strain that is
spatial derivative of the displacement in 1-D medium,
31 3ˆ
a d E is the induced strain that is a product of 31d the in-
plane induced strain coefficient and 3E the amplitude of the
induced electrical field between PWAS electrodes,
2 2
0 / c , and /c E the phase velocity of axial
wave.
Rayleigh wave speed is calculated by
2 1
0.87 1.12
1
S
R S
Ec
c c
(3)
and the time of flight (ToF) is calculated by
R
DToF
c (4)
where D is the distance between the transducer and the
receiver PWAS bonded on the specimens.
EXPERIMENTAL SETUP
Constrained PWAS-EMIS Measurement
The E/M impedance SHM method is direct and
convenient to implement, the only required equipment being
an electrical impedance analyzer. A HP 4194A impedance
analyzer as shown in Fig. 2 was used for the experimental
analysis.
The impedance analyzer reads the E/M impedance of
PWAS itself as well as the in-situ E/M impedance of PWAS
attached to a specimen. It is applied by scanning a
predetermined frequency range in high frequency band (up to
15MHz) and recording the complex impedance spectrum. A
LabView data acquisition program was used to control the
impedance analyzer and sweep the frequency range in steps
that was predefined and to attain the data in a format that
assists to data analysis. During the visualization of the
frequency sweep, the real part of the E/M impedance,
Re Z , follows up and down variation as the structural
impedance goes through the peaks and valleys of the structural
resonances and anti-resonances.
Fig. 3 Schema of thickness mode sensing method (17)
In Fig. 3, PWAS serves as a resonator by both actuating
the substrate structure and local modal sensing the standing
harmonic waves oscillating in in-plane and out-of-plane
(thickness) mode.
Fig. 2 HP 4194A Impedance Phase-Gain Analyzer.

4 Copyright © 2014 by ASME
Guided Wave Propagation with Pitch-Catch Method In this experimental setup, PWAS transducers serve as
high-bandwidth strain sensors for active sensing of far-field.
Transmitter PWAS bonded on a substrate structure excites the
structure by induced voltage in tone-burst sine wave form with
three-counts through the function generator. Then, receiver
PWAS senses the wave signals traveling in certain modes along
the structure and the received signals as output voltage are read
by the oscilloscope in time domain and recorded for post-
processing the data.
Fig. 5 Schema of pitch-catch sensing method (17)
In the both EMIS and GWP experimental setup, pristine
aluminum and steel specimens are used. The first specimen can
be seen in Fig. 6. PWAS transducers are bonded on the short
edges and clay is applied on both long edges to avoid
reflections and obtain more clear signals.
A steel rail beam which is adequate wave guidance is also
used for GWP test as another specimen. 7mm x 7mm x 0.2mm
PWAS transducers are bonded on both specimens.
Autotuning GUI (Fig. 8) -developed in LAMSS using
LabView software- is utilized to control the function generator
and automatically sweep the predefined frequency band and
record the data for each frequency step in an excel file then
eventually post-process the data to generate the tuning curve
for certain wave packets in the received signals.
Fig. 4 Tektronix digital phosphor oscilloscope, HP
function generator, HSA 4014 power amplifier
Fig. 6 A pristine aluminum specimen with clay on edges;
¼” thick, 4” width, 3’ length high strength 2024 aluminum
plate
Fig. 8 Autotuning2011 Graphical user interface (GUI),
Laboratory for Active Materials and Smart Structures
(LAMSS)
Fig. 7 A pristine steel rail I-beam ½” thick
5 Copyright © 2014 by ASME
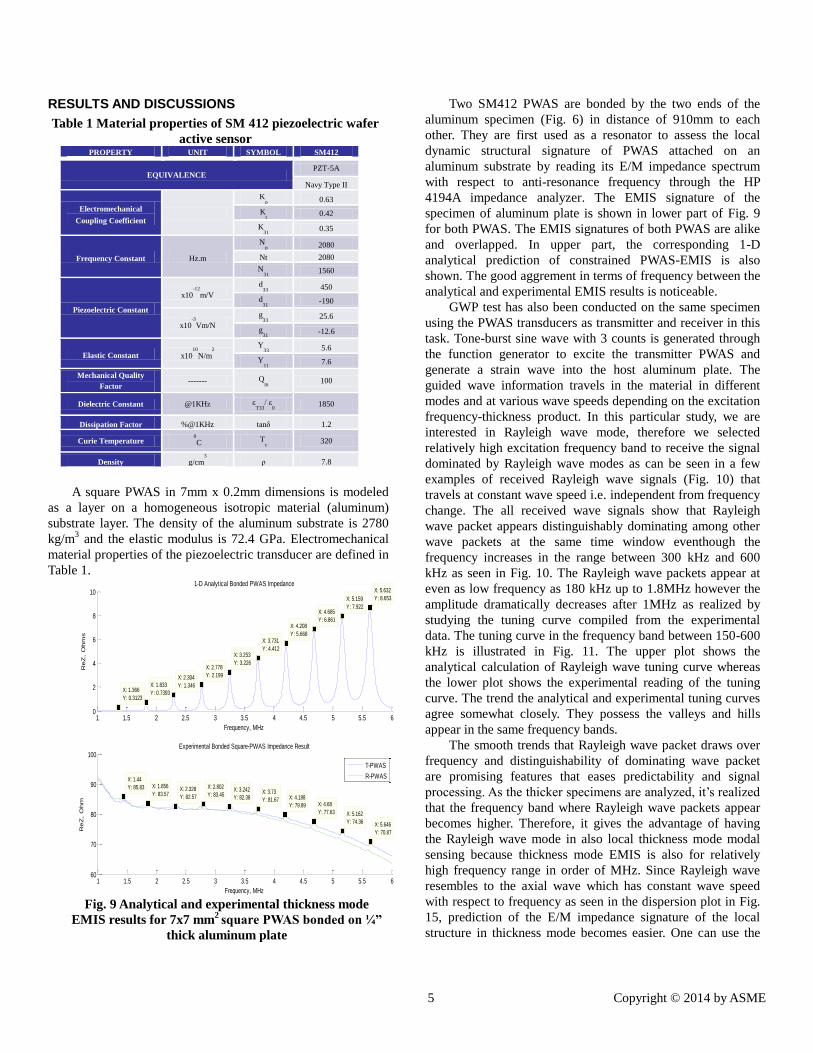
RESULTS AND DISCUSSIONS
PROPERTY UNIT SYMBOL SM412
EQUIVALENCE PZT-5A
Navy Type II
Electromechanical
Coupling Coefficient
Kp 0.63
Kt 0.42
K31
0.35
Frequency Constant Hz.m
Np 2080
Nt 2080
N31
1560
Piezoelectric Constant
x10-12
m/V
d33
450
d31
-190
x10-3
Vm/N
g33
25.6
g31
-12.6
Elastic Constant x1010
N/m2
Y33
5.6
Y11
7.6
Mechanical Quality
Factor ------- Q
m 100
Dielectric Constant @1KHz εT33
/ ε0 1850
Dissipation Factor %@1KHz tanδ 1.2
Curie Temperature 0
C Tc 320
Density g/cm3
ρ 7.8
A square PWAS in 7mm x 0.2mm dimensions is modeled
as a layer on a homogeneous isotropic material (aluminum)
substrate layer. The density of the aluminum substrate is 2780
kg/m3 and the elastic modulus is 72.4 GPa. Electromechanical
material properties of the piezoelectric transducer are defined in
Table 1.
Two SM412 PWAS are bonded by the two ends of the
aluminum specimen (Fig. 6) in distance of 910mm to each
other. They are first used as a resonator to assess the local
dynamic structural signature of PWAS attached on an
aluminum substrate by reading its E/M impedance spectrum
with respect to anti-resonance frequency through the HP
4194A impedance analyzer. The EMIS signature of the
specimen of aluminum plate is shown in lower part of Fig. 9
for both PWAS. The EMIS signatures of both PWAS are alike
and overlapped. In upper part, the corresponding 1-D
analytical prediction of constrained PWAS-EMIS is also
shown. The good aggrement in terms of frequency between the
analytical and experimental EMIS results is noticeable.
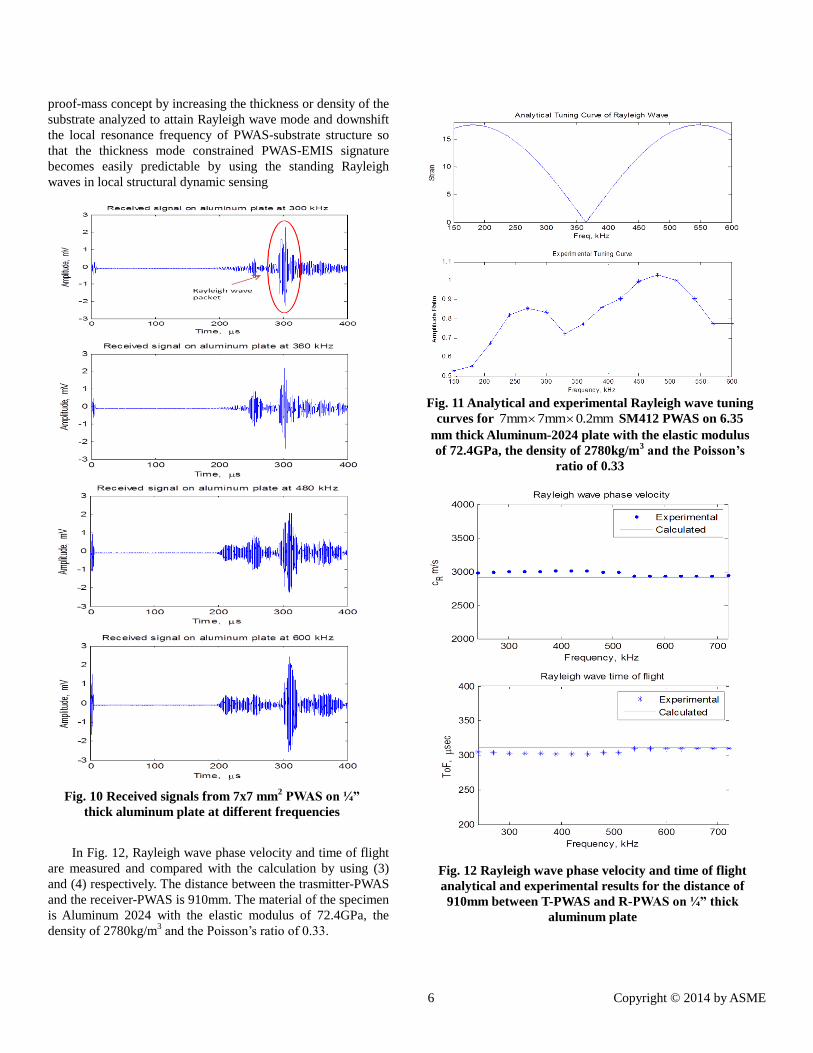
GWP test has also been conducted on the same specimen
using the PWAS transducers as transmitter and receiver in this
task. Tone-burst sine wave with 3 counts is generated through
the function generator to excite the transmitter PWAS and
generate a strain wave into the host aluminum plate. The
guided wave information travels in the material in different
modes and at various wave speeds depending on the excitation
frequency-thickness product. In this particular study, we are
interested in Rayleigh wave mode, therefore we selected
relatively high excitation frequency band to receive the signal
dominated by Rayleigh wave modes as can be seen in a few
examples of received Rayleigh wave signals (Fig. 10) that
travels at constant wave speed i.e. independent from frequency
change. The all received wave signals show that Rayleigh
wave packet appears distinguishably dominating among other
wave packets at the same time window eventhough the
frequency increases in the range between 300 kHz and 600
kHz as seen in Fig. 10. The Rayleigh wave packets appear at
even as low frequency as 180 kHz up to 1.8MHz however the
amplitude dramatically decreases after 1MHz as realized by
studying the tuning curve compiled from the experimental
data. The tuning curve in the frequency band between 150-600
kHz is illustrated in Fig. 11. The upper plot shows the
analytical calculation of Rayleigh wave tuning curve whereas
the lower plot shows the experimental reading of the tuning
curve. The trend the analytical and experimental tuning curves
agree somewhat closely. They possess the valleys and hills
appear in the same frequency bands.
The smooth trends that Rayleigh wave packet draws over
frequency and distinguishability of dominating wave packet
are promising features that eases predictability and signal
processing. As the thicker specimens are analyzed, it’s realized
that the frequency band where Rayleigh wave packets appear
becomes higher. Therefore, it gives the advantage of having
the Rayleigh wave mode in also local thickness mode modal
sensing because thickness mode EMIS is also for relatively
high frequency range in order of MHz. Since Rayleigh wave
resembles to the axial wave which has constant wave speed
with respect to frequency as seen in the dispersion plot in Fig.
15, prediction of the E/M impedance signature of the local
structure in thickness mode becomes easier. One can use the
1 1.5 2 2.5 3 3.5 4 4.5 5 5.5 60
2
4
6
8
10 X: 5.632
Y: 8.653
1-D Analytical Bonded PWAS Impedance
Frequency, MHz
X: 1.366
Y: 0.3123
X: 1.833
Y: 0.7393
X: 2.304
Y: 1.346
X: 2.778
Y: 2.199
X: 3.253
Y: 3.226
X: 3.731
Y: 4.412
X: 4.208
Y: 5.668
X: 4.685
Y: 6.861
X: 5.159
Y: 7.922
ReZ
, O
hm
s
1 1.5 2 2.5 3 3.5 4 4.5 5 5.5 660
70
80
90
100
X: 1.44
Y: 85.83
Frequency, MHz
ReZ
, O
hm
X: 1.856
Y: 83.57X: 2.328
Y: 82.57
X: 2.802
Y: 83.45
Experimental Bonded Square-PWAS Impedance Result
X: 3.242
Y: 82.38X: 3.73
Y: 81.67 X: 4.188
Y: 79.89 X: 4.68
Y: 77.63 X: 5.162
Y: 74.36 X: 5.646
Y: 70.87
T-PWAS
R-PWAS
Fig. 9 Analytical and experimental thickness mode
EMIS results for 7x7 mm2 square PWAS bonded on ¼”
thick aluminum plate
Table 1 Material properties of SM 412 piezoelectric wafer
active sensor
6 Copyright © 2014 by ASME
proof-mass concept by increasing the thickness or density of the
substrate analyzed to attain Rayleigh wave mode and downshift
the local resonance frequency of PWAS-substrate structure so
that the thickness mode constrained PWAS-EMIS signature
becomes easily predictable by using the standing Rayleigh
waves in local structural dynamic sensing
In Fig. 12, Rayleigh wave phase velocity and time of flight
are measured and compared with the calculation by using (3)
and (4) respectively. The distance between the trasmitter-PWAS
and the receiver-PWAS is 910mm. The material of the specimen
is Aluminum 2024 with the elastic modulus of 72.4GPa, the
density of 2780kg/m3 and the Poisson’s ratio of 0.33.
Fig. 11 Analytical and experimental Rayleigh wave tuning
curves for 7mm 7mm 0.2mm SM412 PWAS on 6.35
mm thick Aluminum-2024 plate with the elastic modulus
of 72.4GPa, the density of 2780kg/m3 and the Poisson’s
ratio of 0.33
Fig. 12 Rayleigh wave phase velocity and time of flight
analytical and experimental results for the distance of
910mm between T-PWAS and R-PWAS on ¼” thick
aluminum plate
Fig. 10 Received signals from 7x7 mm2 PWAS on ¼”
thick aluminum plate at different frequencies
7 Copyright © 2014 by ASME
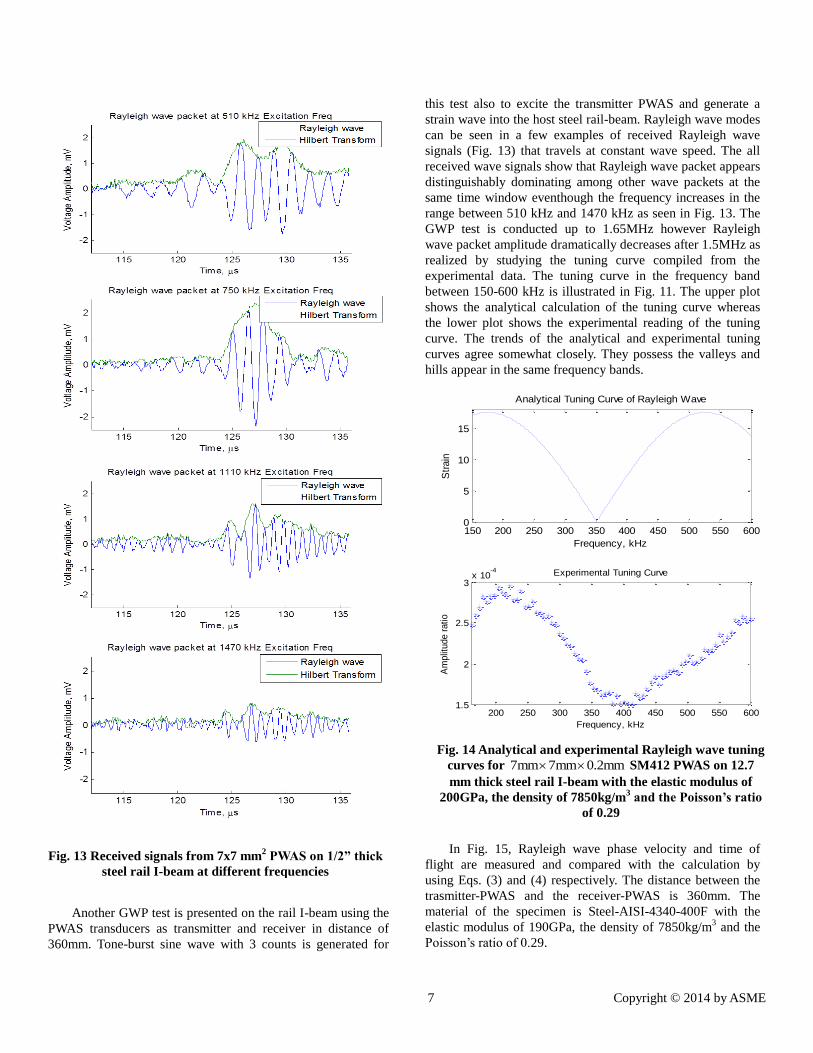
Another GWP test is presented on the rail I-beam using the
PWAS transducers as transmitter and receiver in distance of
360mm. Tone-burst sine wave with 3 counts is generated for
this test also to excite the transmitter PWAS and generate a
strain wave into the host steel rail-beam. Rayleigh wave modes
can be seen in a few examples of received Rayleigh wave
signals (Fig. 13) that travels at constant wave speed. The all
received wave signals show that Rayleigh wave packet appears
distinguishably dominating among other wave packets at the
same time window eventhough the frequency increases in the
range between 510 kHz and 1470 kHz as seen in Fig. 13. The
GWP test is conducted up to 1.65MHz however Rayleigh
wave packet amplitude dramatically decreases after 1.5MHz as
realized by studying the tuning curve compiled from the
experimental data. The tuning curve in the frequency band
between 150-600 kHz is illustrated in Fig. 11. The upper plot
shows the analytical calculation of the tuning curve whereas
the lower plot shows the experimental reading of the tuning
curve. The trends of the analytical and experimental tuning
curves agree somewhat closely. They possess the valleys and
hills appear in the same frequency bands.
150 200 250 300 350 400 450 500 550 6000
5
10
15
Analytical Tuning Curve of Rayleigh Wave
Frequency, kHz
Str
ain
200 250 300 350 400 450 500 550 6001.5
2
2.5
3x 10
-4 Experimental Tuning Curve
Frequency, kHz
Am
plit
ude r
atio
In Fig. 15, Rayleigh wave phase velocity and time of
flight are measured and compared with the calculation by
using Eqs. (3) and (4) respectively. The distance between the
trasmitter-PWAS and the receiver-PWAS is 360mm. The
material of the specimen is Steel-AISI-4340-400F with the
elastic modulus of 190GPa, the density of 7850kg/m3 and the
Poisson’s ratio of 0.29.
Fig. 13 Received signals from 7x7 mm2 PWAS on 1/2” thick
steel rail I-beam at different frequencies
Fig. 14 Analytical and experimental Rayleigh wave tuning
curves for 7mm 7mm 0.2mm SM412 PWAS on 12.7
mm thick steel rail I-beam with the elastic modulus of
200GPa, the density of 7850kg/m3 and the Poisson’s ratio
of 0.29

8 Copyright © 2014 by ASME
SUMMARY AND CONCLUSIONS Electro-mechanical impedance spectroscopy (EMIS)
method has been utilized to determine the local dynamic
characteristics of PWAS bonded on a host structure for in-situ
ultrasonics. Thickness mode EMIS of constrained PWAS was
analytically simulated and validated using results from
experimental analysis of aluminum specimen.
GWP test has also been conducted on two isotropic elastic
specimens such as aluminum and steel by using two SM412
PWAS transducers on each substrate material as transmitter
and receiver. In this particular study, we are interested in
Rayleigh wave mode, therefore we selected relatively high
excitation frequency band to receive the signal dominated by
Rayleigh wave modes. Rayleigh wave is elastic wave that
propagates close to free surface with as low penetration into
the medium as of the order of its wavelength. Rayleigh wave in
an isotropic elastic medium are in many cases an appropriate
tool for ultrasonic inspection by utilizing the useful property of
Rayleigh waves, the propagation speed is independent of
frequency
Rayleigh wave trend over frequency and distinguishability
of dominating wave packet are promising features that eases
predictability and signal processing. The thicker and heavier
specimens are analyzed, the higher frequency band where
Rayleigh wave packets appear is observed. Therefore, it gives
the advantage of having the Rayleigh wave mode as a standing
wave in also local thickness mode modal sensing because
thickness mode EMIS is also for relatively high frequency
range in order of MHz. Since the dominating Rayleigh wave
resembles to the axial wave which has constant wave speed
with respect to frequency as seen in the dispersion plot in Fig.
15, prediction of the E/M impedance signature of the local
structure in thickness mode becomes easier. As seen in the
dispersion curves for PWAS ideally bonded on steel substrate,
other wave modes such as first symmetric (S0) and anti-
symmetric (A0) Lamb wave modes do not interfere as much as
Rayleigh wave mode as also obvious in the received signals
(Fig. 10 and Fig. 13) in certain frequency band;
One can use the proof-mass concept by increasing the
thickness or density of the substrate analyzed to attain
Rayleigh wave mode and downshift the local resonance
frequency of PWAS-substrate structure so that the thickness
mode constrained PWAS-EMIS signature becomes easily
predictable by using the standing Rayleigh waves in local
structural dynamic sensing
Fig. 15 Dispersion curve that shows Lamb wave mode
phase velocities and Rayleigh wave phase velocity at
2839 m/s
Fig. 16 Rayleigh wave phase velocity and time of flight
analytical and experimental results for the distance of
910mm between T-PWAS and R-PWAS on 12.7 mm
thick steel rail I-beam

9 Copyright © 2014 by ASME
ACKNOWLEDGMENTS Support from National Science Foundation Grant # CMS-
0925466; Office of Naval Research #N00014-11-1-0271, Dr.
Ignacio Perez, Program Manager; are thankfully acknowledged.
REFERENCES
[1] Giurgiutiu, V., Bao, J., and Zhao, W., 2001, “Active
Sensor Wave Propagation Health Monitoring of Beam
and Plate Structures,” Proc of SPIE’s 8th International
Symposium on Smart Structures and Materials,
Newport Beach, CA.
[2] Giurgiutiu, V., and Zagrai, A., 2000, “Damage
Detection in Simulated Aging-Aircraft Panels Using
The Electro-Mechanical Impedance Technique,”
Adaptive Structures and Material Systems Symposium,
ASME Winter Annual Meeting, Orlando, FL, pp. 1–10.
[3] Giurgiutiu, V., Zagrai, a., and Jing Bao, J., 2002,
“Piezoelectric Wafer Embedded Active Sensors for
Aging Aircraft Structural Health Monitoring,”
Structural Health Monitoring, 1(1), pp. 41–61.
[4] Zagrai, A. N., and Giurgiutiu, V., 2001, “Electro-
Mechanical Impedance Method for Damage
Identification in Circular Plates,” 40.
[5] Liang, C., Sun, F. P., and Rogers, C. a., 1994, “Coupled
Electro-Mechanical Analysis of Adaptive Material
Systems -- Determination of the Actuator Power
Consumption and System Energy Transfer,” Journal of
Intelligent Material Systems and Structures, 5(1), pp.
12–20.
[6] Sun, F. P., Liang, C., and Rogers, C. A., 1994,
“Structural modal analysis using collocated
piezoelectric actuator/sensors: an electromechanical
approach,” Proc. SPIE 2190, Smart Structures and
Materials 1994: Smart Structures and Intelligent
Systems, 238, Orlando, FL.
[7] Tiersten, H. F., 1963, “Thickness Vibrations of
Piezoelectric Plates,” J. Acoustic Society of America,
35(1), pp. 53–58.
[8] Zagrai, A., and Giurgiutiu, V., 2001, “Electro-
Mechanical Impedance Method for Crack Detection in
Thin Plates,” Journal of Intelligent Material Systems
and Structures, 12(October 2001).
[9] Kamas, T., Lin, B., and Giurgiutiu, V., 2013,
“Analytical modeling of PWAS in-plane and out-of-
plane electromechanical impedance spectroscopy
(EMIS),” SPIE Smart Structure and Materials +
Nondestructive Evaluation and Health Monitoring
2013, Sensors and Smart Structures Technologies for
Civil, Mechanical, and Aerospace Systems, J.P.
Lynch, C.-B. Yun, and K.-W. Wang, eds., p. 869227.
[10] Meeker, T. R., 1972, “Thickness mode piezoelectric
transducers,” Ultrasonics, 10(1), pp. 26–36.
[11] IEEE Ultrasonics, 1987, “IEEE Standard on
Piezoelectricity.”
[12] Cook, D. A., and Berthelot, Y. H., 2001, “Detection of
small surface-breaking fatigue cracks in steel using
scattering of Rayleigh waves,” 34, pp. 483–492.
[13] Chew, D., and Fromme, P., 2014, “Monitoring of
corrosion damage using high-frequency guided
ultrasonic waves,” 9064, p. 90642F.
[14] Fromme, P., 2013, “Noncontact measurement of
guided ultrasonic wave scattering for fatigue crack
characterization,” 8692, p. 86921N.
[15] Masserey, B., and Fromme, P., 2014, “Noncontact
monitoring of fatigue crack growth using high
frequency guided waves,” 9061, p. 90611D.
[16] Kamas, T., Lin, B., and Giurgiutiu, V., 2014,
“Modeling and Experimentation of Proof-Mass
Piezoelectric Wafer Active Sensor Thickness Mode
E/M Impedance Spectroscopy,” AIAA Region II
Student Conference, Memphis, TN, pp. 1–12.
[17] Giurgiutiu, V., 2008, Structural Health Monitoring
with Piezoelectric Wafer Active Sensors, Columbia,
SC, USA.