Mobile Soundings for the Verification of the Origins of Rotation in Tornadoes Experiment 2 (VORTEX2)
25
1 Mobile Soundings for the Verification of the Origins of Rotation in Tornadoes Experiment 2 (VORTEX2) Morris Weisman, George Bryan (Co-Dropsonde PIs) National Center for Atmospheric Research Matt Parker (MGAUS PI) Dept. of Marine, Earth, and Atmospheric Sciences, North Carolina State University Chris Davis, David Dowell, Chris Snyder, Jenny Sun National Center for Atmospheric Research Jeff Trapp Dept. of Earth and Atmospheric Sciences, Purdue University Lance Bosart Dept. of Earth and Atmospheric Sciences, The University at Albany/SUNY David Stensrud NOAA National Severe Storms Laboratory 14 September 2007
Transcript of Mobile Soundings for the Verification of the Origins of Rotation in Tornadoes Experiment 2 (VORTEX2)

1
Mobile Soundings for the Verification of the Origins of Rotation in Tornadoes Experiment 2 (VORTEX2)
Morris Weisman, George Bryan (Co-Dropsonde PIs) National Center for Atmospheric Research
Matt Parker (MGAUS PI)
Dept. of Marine, Earth, and Atmospheric Sciences, North Carolina State University
Chris Davis, David Dowell, Chris Snyder, Jenny Sun National Center for Atmospheric Research
Jeff Trapp
Dept. of Earth and Atmospheric Sciences, Purdue University
Lance Bosart Dept. of Earth and Atmospheric Sciences, The University at Albany/SUNY
David Stensrud
NOAA National Severe Storms Laboratory
14 September 2007

2
1. Summary The Verification of the Origins of Rotation in Tornadoes Experiment (VORTEX2) is a multi-agency field program to investigate tornadic storms and their environments, and is proposed to take place in the United States Great Plains during the months of April-June, 2009-2010. The present proposal addresses the needs for mobile soundings to enhance the observational capabilities for VORTEX2, especially regarding the scientific foci addressing the relationships between supercell storms and their environments and numerical weather prediction. Mobile soundings, specifically the Mobile GPS Advanced Upper Air System (MGAUS) and the GPS Dropsonde system, will be used to enhance the observations of the pre- and during-storm mesoscale environments of tornadic storms, with emphasis on documenting both the larger scale forcing features that may be critical to storm initiation and the smaller scale environmental heterogeneities (e.g., pre-existing boundaries) that may be important for tornadogenesis. Dropsondes represent the best technology available for targeting different geographical regions from day-to day, and obtaining the required horizontal and vertical resolution of observations throughout the troposphere to meet the VORTEX2 scientific objectives. The MGAUS can provide observations in specific storm-relative locations that are required to document features such as pre-existing boundaries in the near-environment of storm updrafts, and can provide coverage where a dropsonde aircraft would be prohibited due to ongoing weather hazards. Mobile sounding information will be used along with other field observations (from mobile, ground-based, C- and X-band Doppler radars; mobile and deployable surface sensors; unmanned aircraft systems; etc.) and standard operational observations to initialize cloud and mesoscale models using a variety of assimilation techniques, to enhance analyses and diagnostic studies of mesoscale processes, and to better establish the predictability of tornadic and other severe convective events up to 18 h in advance. Post-storm dropsondes will also be used to document the feedbacks of such storms on the larger-scale environment. Although VORTEX2 is being proposed for both the 2009 and 2010 seasons, dropsondes are being requested to support only the 2009 field campaign, in order to limit total experiment costs. Two MGAUS units are being requested for both 2009 and 2010. 2. Background VORTEX2 is a multi-agency field program to investigate tornadic storms and their environments, to take place in the United States Great Plains during the months of April-June, 2009-2010. It will be conducted as a two-phase experiment. A “tethered” phase (“phase A”), utilizing an adaptable observing network tethered to fixed observing facilities in Oklahoma (Fig. 2.1.a), will occur 1 April – 10 May each year, focusing on storm-environment interactions, storm-storm interactions. A “fully mobile” phase (“phase B”) will take place 11 May – 25 June each year over a broad region of the central United States (Fig. 2.1.b), focusing on tornadogenesis and tornado wind fields. Briefly, the four foci of VORTEX2 are: Relationships between supercell storms and their environments. Interactions among storms that are/are not favorable for tornadogenesis; effects of environmental heterogeneity on supercells and tornadogenesis; feedbacks of supercells upon their environments. Storm-scale and regional-scale numerical weather prediction (NWP). Analysis and prediction of supercells, mesocyclones, and tornadoes; assessment of parameterization errors for storm-scale models and data assimilation methods for the storm scale; optimal use of observations; analysis and prediction of the pre-storm mesoscale environment. Tornadogenesis. Role of downdrafts in tornadogenesis; sensitivity of tornadogenesis to microphysical and thermodynamic characteristics; role of vorticity maxima along gust fronts in tornadogenesis and/or maintenance; modes for the development of significant tornadoes in supercells.

3
Near-ground wind field in tornadoes. Range of observed tornado characteristics, such as vertical, radial, and swirling velocity profiles, asymmetries, multiple vortices, and angular momentum budgets; relationships between damage and wind speed, acceleration, and duration. These scientific foci address national research priorities in multiple ways. First, VORTEX2 research will contribute to basic understanding of convective storms, particularly interactions between cloud dynamical and microphysical processes. Second, VORTEX2 datasets will become a research testbed for regional-scale and storm-scale prediction experiments. It is generally believed that numerical weather prediction must play a prominent role in the National Weather Service (NWS) initiative to increase severe weather and tornado warning lead time. Unprecedented multi-sensor and multi-scale observations will be available for model initialization and forecast verification, enabling one to determine the optimal mix of observations, adaptive observing strategies, data-assimilation methods, and forecast models needed for successful storm-scale numerical weather prediction in future operational systems. In order to support VORTEX2 objectives, a host of mobile observing systems are being proposed (Table 2.1), including seven mobile, ground-based Doppler radars (C-band, X-band, and W-band radars, some of which will have dual-polarization and “rapid scan” capabilities); mobile soundings; a mobile mesonet; unmanned aircraft systems (UAS); and stick net (an array of surface sensors on tripods). The operational observing network, which includes WSR-88Ds (one or more of which could have polarimetric upgrades by the start of VORTEX2), rawinsondes, profilers, and surface sensors, will provide supporting environmental and storm-scale data. In addition, the tethered phase of VORTEX2 will utilize an extensive fixed observing network in Oklahoma: the National Weather Radar Testbed Phased Array Radar (NWRT-PAR), a prototype dual-polarization WSR-88D (KOUN), the Center for Collaborative Adaptive Sensing of the Atmosphere (CASA) radar network, the Kessler Farm Field Laboratory, the Oklahoma Mesonet, and ARS Micronets. Mobile soundings are essential to the success of VORTEX2, particularly for the foci on mesoscale environmental variability, regional- and storm-scale data assimilation and numerical weather prediction, storm-environment feedbacks, and tornadogenesis. The motivation for mobile soundings is provided in more detail in the following subsections. Science focus Required observing systems Phase Relationships between supercells and their environments
Fixed observing systems (including NWRT-PAR and S-band radars), C-band and X-band mobile radars (at least two of which have dual polarization and one of which has “rapid scan” capability), mobile soundings, mobile mesonet, stick net, UAS
A (tethered)
Storm-scale NWP Fixed observing systems (including NWRT-PAR and S-band radars), C-band and X-band mobile radars (at least two of which have dual polarization and one of which has “rapid scan” capability), mobile soundings, mobile mesonet, stick net, UAS
A (tethered)
Tornadogenesis C-band and X-band mobile radars, mobile mesonet, stick net, mobile soundings, UAS, photogrammetry
B (fully mobile)
Near-ground wind field in tornadoes
X-band and W-band mobile radars, tornado in situ sensors, photogrammetry, damage surveys
B (fully mobile)
Table 2.1. Core instruments proposed for VORTEX2. Other instruments, not included in this table, could be available, depending on the success of individual proposals.

4
Figure 2.1. Proposed domains for the (a) tethered (1 April – 10 May, 2009 and 2010) and (b) fully mobile (11 May – 25 June, 2009 and 2010) phases of VORTEX2. A. Mesoscale environmental variability Previous studies have identified significant environmental variability on multiple scales in the environments of convective storms (Maddox et al. 1980; Marwitz and Burgess 1994; Brooks et al. 1994, 1996; Weckwerth et al. 1996; Markowski et al. 1998a; Rasmussen et al. 2000; Markowski and Richardson 2004). These studies make it clear that the environment of a convective storm cannot be represented by a single sounding and highlight difficulties in relating observed storm behavior to predictions based on numerical parameter-space studies, which typically employ idealized, homogeneous environments (Brooks et al. 1994; Weisman et al. 1998; Richardson 1999; Richardson et al. 2007). The 2 June 1995 case during VORTEX1 (Fig. 2.2; Rasmussen et al. 1994, 2000; Gilmore and Wicker 2002) demonstrates clearly the potential impact of such mesoscale variability on supercell formation and subsequent tornadogenesis. This case featured numerous convective storms on both sides of a remnant outflow boundary that had been produced by convection many hours earlier. Among approximately 20 long-lived storms, the only storms that produced tornadoes were those that passed from the warm side of the boundary to the cool side and those that developed and remained on the cool side. Available evidence indicates that maxima in both CAPE and vertical wind shear were present near the boundary, on the cool side.

5
Greater awareness since VORTEX1 of the role that preexisting boundaries can play in convective storm evolution has led multiple investigators (e.g., Markowski et al. 1998c; Atkins et al. 1999; Houston and Wilhelmson 2002a,b) to examine this topic in a modeling framework. Unfortunately, limited observational evidence is available to guide these idealized modeling studies. Although low-level boundaries in supercell environments are often detectable by the surface observation network, the vertical characteristics of these boundaries have been poorly documented. In many cases, storms actually weaken rather than strengthen after crossing boundaries, suggesting that the evolution of storms that cross boundaries could be quite sensitive to both the characteristics of the boundary and the convective storm state when it reaches the boundary. Thus, VORTEX2 aims to determine which types of boundaries (in terms of their thermodynamic and kinematic characteristics) are most apt to lead to storm enhancement during a storm-boundary interaction. Currently, very little is known about how the thermodynamic and kinematic characteristics of outflow boundaries evolve in regions far removed from the progenitor convective precipitation, and how these thermodynamic and kinematic modifications influence interactions between the outflow boundary and subsequent storms hours later.
Figure 2.2. Echo centroid tracks for five 1-h periods on 2 June 1995, depicted with the various line types shown in the legend. Thick lines represent outflow boundary positions according to the symbols in the legend, and apply to the start of the 1-h periods. Circled numbers indicate tornado reports. From Rasmussen et al. (2000). Direct observations of thermodynamic and kinematic profiles in the mesoscale environment of supercells, obtained with a combination of ground-based sondes and dropsondes, are needed during VORTEX2. Low-level boundaries in the target area will be observed as convective storms approach and then interact with them. Observations are needed of the spatial and temporal variations in stability and vertical wind shear associated with these boundaries. In addition, the existence of unstable air just above low-level stable layers can only be detected reliably with sondes. Other modes of environmental variability are also of interest during VORTEX2. For example, Markowski et al. (1998b) documented strong surface temperature gradients (up to 5°C over ~20 km) in daytime supercells
6
near the edges of anvil shading. They hypothesized that in some cases, these baroclinic zones could be significant sources of low-level horizontal vorticity, which could enhance storm rotation when it interacts with the updraft. Since targeted soundings have not been available in these regions, it is unclear whether these anvil-shade baroclinic zones are deep enough to enhance horizontal vorticity over a deep enough layer near the surface enough to affect storm evolution significantly. Targeted soundings are also needed to document variability in environmental parameters in low-level supercell inflow (Barnes 1978; Bonesteele and Lin 1978; Brooks et al. 1993; Marwitz and Burgess 1994; Markowski et al. 1998a). Low-level inflow wind speeds within 5-10 km of supercell updrafts can be over 20 m s-1 greater than in the more distant environment. It has been proposed that low-level vertical shear available to the updraft is enhanced (through horizontal stretching of horizontal vorticity) in the accelerating storm inflow. An improved understanding of the relationship between tornadic storms and their mesoscale environments afforded by special field observations is also crucial to the study of how the frequency of extreme events might change as a result of climate change. How tornado activity would change in future climates influenced by increased greenhouse gas concentrations and sulfate aerosols is unclear. As stated in the Third Assessment Report (TAR) 2001 of the Intergovernmental Panel on Climate Change (IPCC), little guidance concerning this phenomenon (as well as lightning and hail) can be offered by atmosphere-ocean global climate model (AOGCM) projections, owing to their coarse gridpoint spacing relative to the scale of individual thunderstorms (IPCC 2001). Hence, we are limited at this point to making physical arguments based on the characterization of the large-scale environment provided by AOGCMs (and by regional climate models; see Trapp et al. 2007), necessarily disregarding any feedback of the tornadic storms to the larger scale. The validity of predictions of the future frequency and intensity of tornadic thunderstorms is limited by the neglect of this feedback as well as our current ability (or relative inability) to unambiguously link tornado occurrence and intensity to particular environmental parameters. To determine the relationship between the future climate and tornado frequency, spatial distribution, and intensity distribution, it is essential that we improve our understanding of how the large-scale environment is related to tornado formation. B. Regional and storm-scale analysis and numerical weather prediction Explicit predictions of convective storms with numerical models that assimilate high-resolution, multi-sensor observations are recognized as essential for improving warnings of hazardous weather associated with supercells (tornadoes, other damaging winds, hail, lightning, and floods) and improving quantitative precipitation forecasts in general (Fritsch et al. 1998; Droegemeier et al. 2000; Dabbert et al. 2000; U.S. Dept. of Commerce 1999). Various real-time experiments during the last decade have demonstrated that explicit prediction of convective storms (Lilly 1990; Droegemeier 1990; Droegemeier 1997) has now become computationally feasible (e.g., Droegemeier et al. 1996; Xue et al. 1996; Xue and Martin 2006ab; Wicker et al. 1997; Sun and Crook 2001; Crook and Sun 2002; Done et al. 2004; Weisman et al. 2007). From 2003-2007, daily real-time explicit convective forecasts employing 4-km (3-km in 2007) horizontal grid spacing were produced out to 36 h over the central U.S. during the spring and summer by the National Center for Atmospheric Research (NCAR). In 2005, the Center for Analysis and Prediction of Storms (CAPS) produced a daily convective storm forecast covering much of the continental U.S. with a 2-km horizontal grid spacing. In 2007, a 10-member ensemble of 36-h forecasts at 4-km horizontal grid spacing was produced by CAPS. These realtime high resolution convective forecasts have formed the core of several recent NSSL-SPC Spring Programs, whereby forecasters and researchers from around the country have evaluated the applications of such high resolution guidance for operational severe storm forecasting (e.g., Weiss et al. 2004, 2007; Kain et al. 2005, 2006, 2007). These recent regional-scale forecast exercises have demonstrated that increasing horizontal grid resolutions into the convectively-explicit regime (e.g., 2-4 km), thereby avoiding uncertainties inherent with convective parameterization schemes currently used in coarser-resolution operational models, leads to significant improvements in convective forecast guidance out to 36 h. Such forecasts often realistically represent the

7
structure and evolution of mesoscale convective phenomena, such as supercells, squall lines, bow echoes, and mesoscale convective vortices (e.g., Weisman et al. 2007). On the other hand, significant errors in timing and location of significant convective events are also frequently encountered. An example of such a forecast is presented in Fig. 2.3 from 5 May 2007, the day of the devastating Greensburg, KS tornado. A 3 km WRF-ARW simulation successfully forecast an intense, isolated supercell storm over central Kansas between 21 UTC and 01 UTC, nearly 24 h in advance, but was off in timing and location by 3 h and 150 km, respectively.
Fig. 2.3. a) 24 h WRF-ARW reflectivity forecast, using a 3 km horizontal grid resolution, valid 00 UTC on 5 May 2007. b) Observed composite NOWRAD radar reflectivity, valid 03 UTC 5 May 2007. Numerous issues could contribute to these forecast errors, including errors in parameterization schemes, coarse resolution, poor representation of features critical for convective initiation, etc. However, sensitivity studies considering resolution, model physics (e.g., PBL and microphysics), and initial conditions (e.g., initializing with the RUC versus NAM), have yet to be able to explain many of these forecast errors. In a similar attempt to improve forecasts of a severe derecho-producing convective system, Gallus et al. (2005) suggest, “It thus appears that useful forecasts of systems such as this one may require a much better observation network than now exists, or better methods of including additional information from radar and satellites.” A recent simulation study of the 3 May 1999 Oklahoma tornado outbreak by Roebber et al. (2002) suggests that 24-h forecast errors of order several hundred km and/or several hours (similar to the more significant forecast errors noted in the real-time experiments) can indeed be related to resolvable-scale observational errors in the initial upstream conditions. Figure 2.4 provides an example of the type of upstream features that can have a significant impact on convective forecasts later in the day. In this case, from June 10, 2003 during BAMEX, a series of small scale waves (labeled A and B in Fig. 2.4) were propagating eastward along the subtropical jet stream. Of particular interest, wave A was not accurately represented in the initial analyses for either the operational NAM or an experimental WRF-ARW forecast, at either 00 UTC or 12 UTC. This wave subsequently initiated a large

8
MCS with an associated MCV later that evening over central Oklahoma (not shown). Neither the NAM or WRF-ARW forecasts were able to capture this significant MCS. Higher resolution upstream soundings on this day may have been critical for properly representing this feature in the initial analyses and improving the subsequent convective forecasts.
Fig. 2.4. (a) 300 hPa geopotential height (dam; solid contours), absolute vorticity (10-5 s-1; shaded warm colors), and wind (knots; standard barbs), and coupling index (shaded cool colors < 5 K) at 1200 UTC 10 June 2003. Data source: 1.0 degree GFS final analyses. (b) GOES-12 water vapor imagery at 1200 UTC 10 June 2003. Data source: BAMEX field catalog. Letters A, B, denote subtropical jet disturbances. Indeed, one of the greatest challenges facing mesoscale and cloud-scale weather prediction is analysis uncertainty. While large-scale analysis uncertainty can be estimated by calculating the differences between global analyses from operational modeling centers, mesoscale analysis uncertainty is much harder to define, owing largely to a lack of data with sufficient spatial and temporal resolution to define mesoscale atmospheric features accurately. The observational strategy proposed in Section 3 would provide an unprecedented data set for use in data assimilation to capture mesoscale features upstream from the VORTEX2 area of forecast interest. Comparisons with operational analyses would allow us to determine better the analysis uncertainty on the mesoscale, which can then be used to guide ensemble initial condition perturbation strategies and in predictability studies. The observations required must be sufficiently dense (typical spacing ~175 km) to sample short-wave troughs and ridges, low-level jets, dry intrusions, potential vorticity streamers, and other mesoscale phenomena. Operational full-tropospheric kinematic and thermodynamic measurements are too sparse to resolve many of these features thought to be critical for convective forecasting (e.g., Fig. 3.1). Although satellite-derived profiles are a promising mesoscale data source, these profiles do not yet have the vertical resolution thought to be necessary for convective forecasting. Therefore, an observational strategy involving in situ measurements (upsondes and dropsondes) is proposed (Section 3). If dense sounding coverage were available in VORTEX2, traditional analyses of these observations would be used to identify mesoscale precursors that may be key to improved convective forecasts, perhaps up to 18 h in advance. Traditional analysis of special VORTEX2 soundings would aid in real-time forecasting during the project and would be a major research focus after the field phase.

9
The upsonde and dropsonde data will be used in a host of realtime and post-field phase analysis and prediction studies, including investigators from the University of Oklahoma (particularly CAPS), the National Severe Storms Laboratory, and the National Center for Atmospheric Research. Explicit 0-36 hr Weather Research and Forecasting (WRF) model forecasts of convective storms (deterministic and ensemble forecasts), initialized from operational analyses at 0Z and employing horizontal grid spacings of 3 km or less, will be provided in the early morning for guidance in project planning. A second daily high-resolution forecast, initialized at 12Z, will provide up-to-date guidance during the late morning and afternoon. VORTEX2 also includes an emphasis on real-time mesoscale analysis and forecasting. An hourly mesoscale (grid spacing ~30 km) WRF ensemble analysis will be produced through ensemble Kalman filter (EnKF) assimilation of environmental data (soundings, standard surface observations, Oklahoma Mesonet observations, aircraft observations, profiler data, etc.) into the ensemble. Special soundings (dropsondes and/or upsondes) obtained by VORTEX2 would also be assimilated into the WRF ensemble. At regular intervals, short-term (0-12 hr) ensemble forecasts will be produced. The hourly mesoscale analyses and forecasts will provide guidance during the experiment by identifying local regions that have enhanced environmental conditions (e.g., strong 0-1 km vertical shear of the horizontal wind, high convective available potential energy) favorable for tornadic storms. Post-field phase NWP research efforts will generally fall into two categories, based on forecast lead time and scale. Regional-scale efforts will address the explicit prediction of regions of convection and convective systems out to as long as 18 h. This effort will emphasize the use of mesoscale assimilation techniques, and will especially depend on upstream regional dropsonde and upsonde data along with surface mesonets to enhance the operational data stream. Storm-scale efforts will emphasize the explicit prediction of single convective storms, including severe weather production (e.g., tornadoes), out to several hours in advance. In addition to relying on accurate mesoscale analyses and forecasts, the storm-scale effort will rely on high-resolution Doppler measurements as well as other high-resolution storm-scale observations obtained in the field. For regional-scale analysis and forecast purposes, dropsondes will be deployed between 12 and 17 UTC in a gridded fashion with a roughly 175 km spacing over a 1000 km2 region upstream of the region anticipated for significant convection later in the day. For storm-scale analysis and forecast purposes, dropsondes and upsondes would be launched over regional targeted areas when supercells are occurring or are imminent, in conjunction and collaboration with other intensive VORTEX2 storm-scale observational efforts. In post-experiment studies, we will examine the observations for mesoscale precursors in the free troposphere that affect the timing and location of convection, and compare prediction experiments that do and do not assimilate the dropsonde and upsonde observations The mesoscale density of wind and thermodynamic conditions being proposed herein has never been available for such research or application purpose. For instance, recent field studies, such as BAMEX (Davis et al., 2004) and IHOP (Weckwerth et al. 2004) used dropsondes and upsondes to sample the environment and structure of convective systems such as bow echoes and mesoscale convective vortices (MCVs), or specific features such as the dry line, respectively, but did not obtain the regional coverage, especially upstream of anticipated convection, as proposed here. A similar density of observations was indeed proposed in association with the Storm-Central phase of the National Storm (Stormscale Operational and Research Meteorology) Program in 1984 (Zipser et al., 1984), but was never deployed. Such a dataset would contribute immensely to ongoing convective storm predictability research. C. Storm-environment feedbacks Supercell thunderstorm and tornado formation has traditionally been treated as the result of a one-way, non-scale interacting process. Specifically, supercells are regarded as products of a larger-scale environment, and
10
are presumed to form only when certain combinations of environmental conditions exist (Trapp et al. 2004). On the other hand, very little is known about the extent to which supercellular convection modifies the environment, and also how this may then feed back down to the storm scale. Clearly, this has possible implications that range from storm-scale predictability to global climate modeling. We do know that intense deep moist convection (DMC) acts to reduce convective instability locally. Limited observations presented by Fritsch et al. (1976) demonstrate the near complete removal of CAPE by a squall line within about one hour of the arrival of the squall line at the sounding site. Schlesinger (1990) and Schlesinger (1994) showed, using idealized simulations, that a supercell can cause an upper-tropospheric warming, a lower-tropospheric cooling, and an overall moistening throughout. This simulated supercell also reduced appreciably the mean south-north tropospheric shear. Such “downgradient” momentum transport has also been shown in simulated storms by Lilly and Jewett (1990), and in observations of tropical squall lines (see LeMone and Moncrief 1993 and references therein), although “counter-gradient” transport has also been observed. A final example of a DMC feedback is given by Wang (2003). He also used idealized simulations to demonstrate that supercellular convection is effective at transporting water vapor (and presumably other trace chemical species) into the stratosphere. Once in the lower stratosphere, water vapor may be expected to play significant roles in the atmospheric radiation budget and atmospheric chemistry exchanges. More generally, past research has shown that the bulk upscale effects of deep moist convection (DMC) in baroclinic cyclones noticeably impact the downstream synoptic-scale and immediate mesoscale environment. Examples of the influence of DMC on the synoptic-scale and mesoscale environment in cyclonic storms include: 1) downstream ridging in the upper troposphere associated with diabatically driven outflow from DMC (e.g., Gulf of Mexico and the southeastern US during the 12-14 March 1993 Superstorm; Dickinson et al. 1997), 2) DMC-assisted vorticity generation along occluded fronts in rapidly intensifying oceanic cyclones and resulting vorticity accumulation near the cyclone centers (e.g., 4-5 January 1989 during ERICA; Shapiro et al. 1999), 3) enhanced differential cyclonic vorticity advection ahead of weak upstream troughs resulting from DMC-generated enhanced downstream ridging and jet development with landfalling and recurving tropical cyclones (e.g., Hurricanes David 1979 and Floyd 1999; Bosart and Lackman 1995; Atallah et al. 2007), 4) vorticity accumulation and amalgamation in vortical hot (DMC) towers during incipient tropical cyclogenesis (e.g., Hurricane Dolly 1996; Reasor et al. 2005), and 5) mesoscale ridging in the upper troposphere ahead of DMC associated with mesoscale convective vortices (e.g., 11-12 June 2003 during BAMEX; Galarneau and Bosart 2007). In a perhaps a more extreme example of the effect of mesoscale convection, Stensrud (1996) revealed that a persistent, 2.5-day series of MCSs was capable of significantly modifying the synoptic-scale circulation. Short-lived, nonsupercellular convection is unlikely to have such a substantial effect on the large-scale atmosphere. Supercells are more persistent than ordinary DMC, and also tend to have stronger and larger vertical drafts (both up and down) than ordinary DMC. Hence, even an isolated supercell might have measurable consequences on the environment far beyond that of ordinary DMC storms. Toward this end, we propose during VORTEX2 to obtain mobile soundings ahead of and in the wake of these storms; additional observations of ordinary (nonsupercell) thunderstorms would help us isolate the unique effects of supercells. VORTEX2 will allow us the unique opportunity to combine this rich environmental information with detailed analysis of individual storms, especially gained via multiple mobile Doppler radar data. 3. Deployment Strategies The proposed complementary use of both dropsondes and upsondes is based on their specific capabilities and limitations. Dropsondes have the flexibility to sample broad mesoscale and sub-synoptic scale regions of

11
interest with sufficient spatial and time coverage to best meet VORTEX2 objectives related to mesoscale variability and regional-scale NWP. The MGAUS units complement that capability with their greater ability to release soundings in close proximity to severe convective storms, where aircraft are generally not able to fly (due to electrification, extreme turbulence, etc.). The MGAUS units will ensure that we obtain soundings in the desired positions with respect to low-level boundaries, cold pools, anvil shadows, etc. The ability of the MGAUS vehicles to position themselves in close proximity to one another across a boundary, and to synchronize their sonde releases, will provide excellent contemporaneous depictions of the airmasses, and hence the horizontal gradients in buoyancy which are associated with baroclinic generation of horizontal vorticity. The successful complementary use of upsondes and dropsondes during BAMEX (e.g., Davis et al., 2004; Davis and Trier, 2007; Trier and Davis, 2007; Storm et al., 2007) demonstrates the value and feasibility of this observational strategy. We request two MGAUS units for the entirety of VORTEX2. As shown in Figures 3.2-3.4, the MGAUS units will be supplemented by two mobile upsonde units from the National Severe Storms Laboratory (NSSL). The Gulfsteam V (GV) would be a suitable platform for deploying dropsondes during VORTEX2. However, if the GV is unavailable, so support for an alternative aircraft with similar capabilities is being requested. Funding for the dropsondes would be requested from the NSF deployment pool. Since two major deployments of the dropsonde aircraft, separated by 8-12 h, will be required for some VORTEX2 IOPs, a double crew will likely be needed to support dropsonde operations. Each year of VORTEX2 (2009 and 2010) includes a tethered phase (1 April – 10 May) and a fully mobile phase (11 May – 25 June). The requested mobile sounding facilities to support VORTEX2 are as follows: 2009 April 1 to June 25 2 MGAUS units April 8 to June 8 GPS Dropsonde system 2010 April 1 to June 25 2 MGAUS units Although VORTEX2 is being proposed for both the 2009 and 2010 seasons, dropsondes are only being requested for a 2 month portion of the 2009 field campaign, in order to limit total experiment costs. Based on climatological considerations and the episodic nature of severe weather outbreaks, an 8-9 week deployment is considered the minimum for acquiring sufficient cases to meet the scientific objectives. If 2009 is found not to be feasible for dropsonde deployment, then 2010 could be considered as an alternative. The nominal daily schedule for mobile sounding data collection is as follows:
• Early morning (~12 UTC): Preconvective dropsonde deployment (D-R) to establish upstream conditions for anticipated later convection. This deployment supports the regional 6-18 h forecast and predictability component of VORTEX2.
• Afternoon (~18-00 UTC): Pre-convective upsonde deployment (U-N or U-S preconvective boundary sampling) to sample pre-storm mesoscale environment in region specified for later intensive observations. This deployment will support real-time operational nowcasting during the field phase, and also supports the shorter-term (0-6 h) storm-scale predictability component of VORTEX2.
• Late afternoon/evening (~21-03 UTC): Storm-time dropsonde (D-S) and upsonde (U-N or U-S)
deployments to sample the mesoscale environment of storms targeted for intensive observations. These deployments support the environmental variability, storm-scale prediction, and tornadogenesis components of VORTEX2.
• Evening (~01-04 UTC): Mature-storm dropsonde (D-F) deployment to sample the mesoscale
environment surrounding the storms. This deployment supports the storm-environment feedbacks component of VORTEX2.

12
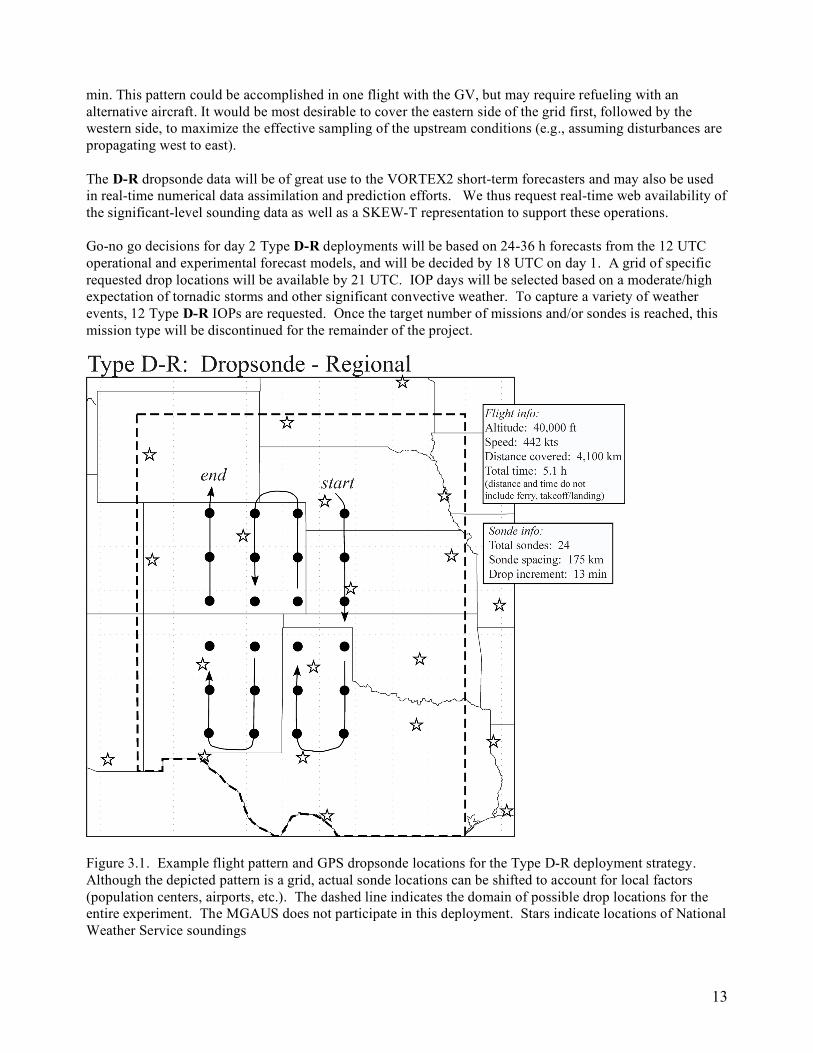
Dropsonde deployment strategies will be the same for both the fixed and mobile phases of VORTEX2. For the fixed phase, MGAUS units will be stationed in Norman, OK and will proceed to target areas on a daily basis. For the mobile phase, MGAUS units must be available to travel to the target area along with the other mobile ground units in advance of the anticipated deployment and be prepared to spend several days on the road. The early morning dropsonde deployment (D-R) will occur for all days for which a significant convection is anticipated. The later upsonde/dropsonde deployments will proceed only if intensive storm-scale observations are to be taken (e.g., tornadic storms are anticipated), as decided by the VORTEX2 field coordinator (FC). Dedicated upsonde and dropsonde coordinators will guide the various deployment efforts from an operations center in Norman (likely at the National Weather Center), and coordinate with the FC, who will be situated in the field with the mobile crews. The various deployment strategies are described in detail below. A. Dropsondes Type D-R (regional) The goal of deployment (D-R) is to establish upstream conditions for anticipated later convection. Observations will be taken between 12 and 16 UTC to enhance the standard NWS operational 12 UTC analysis. This deployment supports the regional 6-18 h forecast and predictability component of VORTEX2. The Type D-R strategy (Fig. 3.1) involves dropping sondes in roughly a 6 by 4 grid (24 total drops), with drop locations approximately 175 km apart. A 175-km grid spacing for dropsondes will nominally be able to resolve features with a scale of 500 km or greater, which is much finer than is allowed by the existing observational NWS sounding network over the region of interest (e.g., Fig. 3.1). Such a density of full tropospheric observations has never been available for such purposes, and will be able to document the suspected role of poorly observed and/or initialized sub-synoptic features on subsequent severe convective outbreaks. The full domain of interest for this deployment is depicted on Fig. 3.1, and primarily includes Wyoming, Colorado, New Mexico, Texas, along with Nebraska, Kansas and Oklahoma. A sub-domain of roughly 1000 by 700 km will be chosen for each IOP depending on the meteorological scenario (mean flow direction and speed, moisture source, etc.) as well as specific features of interest (e.g., low-level jet, regions of enhanced upper tropospheric PV, etc.). Given a mean propagation speed for a sub-synoptic feature of 10-15 m s-1, observations would be needed 400 to 600 km upstream of the anticipated region of convective initiation for a 12-h forecast. Thus, features as far west as western Colorado and New Mexico and south-central Texas could significantly impact weather later in the day. Although a complete grid of data would be most preferable, adjustments can be made for predetermined no-drop zones based on population, military, or domestic flight-path constraints without significantly compromising the value of the dataset. We will work with EOL personnel over the next few months to identify the key no-drop zones ahead of time to ease with project planning and feasibility assessments. Also, drop sites will be chosen so as to not overlap with existing NWS sites to maximize the value-added of the deployment strategy. A flight altitude of 12 km (40000 ft) would be requested for all drops to allow for the sampling of deep-layer shear, stability, and moisture, as well as to characterize upper/mid tropospheric features that may be important for subsequent convective initiation. Given a 1000 x 600 km grid and an aircraft speed of 442 kts, the proposed distance covered would be about 4100 km, and would take approximately 5.1 h to complete (plus approximately 2 hours for takeoff, ferry, and landing). The requested drop increment would be about 13
13
min. This pattern could be accomplished in one flight with the GV, but may require refueling with an alternative aircraft. It would be most desirable to cover the eastern side of the grid first, followed by the western side, to maximize the effective sampling of the upstream conditions (e.g., assuming disturbances are propagating west to east). The D-R dropsonde data will be of great use to the VORTEX2 short-term forecasters and may also be used in real-time numerical data assimilation and prediction efforts. We thus request real-time web availability of the significant-level sounding data as well as a SKEW-T representation to support these operations. Go-no go decisions for day 2 Type D-R deployments will be based on 24-36 h forecasts from the 12 UTC operational and experimental forecast models, and will be decided by 18 UTC on day 1. A grid of specific requested drop locations will be available by 21 UTC. IOP days will be selected based on a moderate/high expectation of tornadic storms and other significant convective weather. To capture a variety of weather events, 12 Type D-R IOPs are requested. Once the target number of missions and/or sondes is reached, this mission type will be discontinued for the remainder of the project.
Figure 3.1. Example flight pattern and GPS dropsonde locations for the Type D-R deployment strategy. Although the depicted pattern is a grid, actual sonde locations can be shifted to account for local factors (population centers, airports, etc.). The dashed line indicates the domain of possible drop locations for the entire experiment. The MGAUS does not participate in this deployment. Stars indicate locations of National Weather Service soundings

14
Type D-S (storm scale) The complex mesoscale environments of supercell storms (pre-existing low-level boundaries, multiple interacting storms, etc.) are of interest for the Type D-S strategy (Fig. 3.2). Flight level would be approximately 8 km (25,000 ft) AGL, which would allow for determination of low/mid tropospheric stability, shear, and moisture. Based on operational limitation, e.g., the speed of the aircraft (~225 m s-1) and the practical time interval between launches (~6 min), the nominal spacing between drops would be 80 km. However, a finer horizontal resolution would be desirable at times for short legs in the vicinity specific features, such as surface boundaries, if technically feasible (recognizing the limitation of a maximum 4 sondes in the air at a time). Drops will be made well outside the active storm regions. However, drops beneath the downshear anvil, far from the updraft and heavy precipitation region, are of interest, for the purpose of observing any horizontal gradients in low/mid-level stability associated with anvil shading and precipitation. The possibility of a Type D-S deployment the following day will be available by 18 UTC. On the day of the anticipated observational period, updates will be available by 18 UTC. However, the final go-no go decision might not be made until late afternoon, once an intensive IOP has been declared for the mobile ground units. Since the specific location for deployment D-S may not be available until near-storm time, this could complicate planning for specific drop locations. The dropsonde coordinator will have to work closely with Field Project Services personnel to facilitate this deployment strategy, following the successful strategy applied during BAMEX. One pass of the example dropsonde deployment shown in Fig. 3.2 would require 12 sondes and about 3.5 flight hours (allowing 2 hours for takeoff, ferry, and landing). On days when a concurrent D-F deployment is not planned (see below), a second pass may be requested, requiring an additional 1 h flight time and dropping up to an additional 10 sondes. Type D-F (storm-environment feedbacks) The goal of the Type D-F deployment is to sample the mesoscale environment surrounding storms during their later stages, to support the storm-environment feedbacks component of VORTEX2. This deployment would occur immediately following a D-S deployment for select number of the IOPs (10). The Type D-F strategy (Fig. 3.3) requires the dropsonde aircraft to fly near the tropopause level. The aircraft would ascend to 12 km (40000 ft) AGL, and cover a total distance of about 800 km at this altitude in about 1 h (assuming a speed of 440 kts). A total of approximately 10 sondes would be dropped at a nominal spacing of 80 km and drop increment of 6 min. It would be desirable to make drops within the downstream anvil regions, which may be electrically active. For such legs, the aircraft could descend to 25000 ft, which would nominally be below cloud level. Since the Type D-F deployment will be executed immediately following a Type D-S deployment, it should require only about 1.0 additional flight hours per mission.

15
Figure 3.2. Example dropsonde and MGAUS deployment for the Type D-S and U-S strategy, which focuses on storm-scale observations and pre-existing low-level boundaries (if present). Actual sonde drop locations will take into account local factors (population centers, airports, etc.). The MGAUS locations are indicated by the letter “M” (right panel). Also shown are locations for the NOAA mobile, ground-based sounding systems (“N”).

16
Figure 3.3. Example dropsonde and MGAUS deployment for the Type D-F and U-S strategy, which focuses on storm-environment feedbacks. The dropsonde aircraft flies at a higher level than for Type D-S, in order to obtain profiles through the entire depth of the troposphere. Actual sonde drop locations will take into account local factors (population centers, airports, etc.). During this phase of dropsonde operations, the EOL and NOAA sounding systems continue the U-S deployment (Fig. 3.2). Total number of dropsondes and flight hours required We are requesting 12 IOPs for the D-R deployment, which represents a subset of the 16 intensive IOPs anticipated for VORTEX2 (to save in overall expense). Assuming 24 dropsondes per deployment, this would require 288 dropsondes. At 7.1 hours per mission, a total of 86 flight hours is requested for the 12 IOPs We are requesting 16 IOPs for the D-S deployment, to directly support all of the anticipated VORTEX2 intensive observational periods. Assuming 12 dropsondes per deployment, this would require approximately 192 dropsondes. For 6 of the D-S deployments, a second pass may be taken, at 10 drops per pass, for an additional total of 60 sondes. At 3.5 h per mission (4.5 h if a second pass is taken) the total flight hours needed for these 16 IOPs would be approximately 62 h. Finally, we are requesting 10 IOPs for the D-F deployments. Assuming 10 dropsondes per deployment, this would require approximately 100 dropsondes. At 1.0 h additional flight hours per deployment (on the heels of a D-S mission), the total additional flight hours needed are 10 h.

17
Total Dropsonde Request: (Type D-R, D-S, and D-F deployments) Flight Hours: 158 Dropsondes: 640
B. Upsondes (MGAUS) The MGAUS units will be deployed on every day that the VORTEX-2 field leaders make a “go” decision, and during the fully mobile phase will overnight and travel to target areas along with the rest of the mobile ground-based teams. The MGAUS units will be used for pre-initiation environmental sampling missions at regular intervals, as well as close-in observations of mesoscale features that may be critical to subsequent storm evolution, as described below. An upsonde coordinator will direct the timing and location of upsonde launches as well as maintain coordination with dropsonde launches, through communication with the dropsonde coordinator. Communication between the upsonde coordinator and the MGAUS teams will be via on-board VHF radio and via the Verizon cellular telephone network, and via internet chat. A minimum 12 h rest period will be allocated to the MGAUS personnel between missions. Each MGAUS team will consist of one EOL MGAUS technical specialist, to guide the upsonde launches, and one storm observing expert from the severe storms community, to ensure that the MGAUS unit is properly positioned for the designated mission type (as directed by the upsonde coordinator) and that the unit is safely located with respect to the storm. Funding for the two MGAUS vehicles, two EOL experts, and the sondes (with expendables) is requested from the NSF deployment pool. Funding for the partnered storm observing experts to work with the EOL and NSSL upsonde teams, will be requested by PI Parker through a separate science proposal. Type U-N (Pre-convective and near-storm environmental soundings) On deployment days, once the ground-based teams have arrived at the day’s target area, it will be of interest to sample the local pre-convective environment. Thus, one of the MGAUS units will launch soundings at roughly 2 hour intervals from its location. The purpose of these soundings is to give a fuller characterization of the mesoscale environment at times and sites that fall between the routine operational rawinsonde observations. The soundings will be used both for real time refinement of the day’s forecast, and for retrospective research. Whereas the Type D-R dropsonde missions will consist of nearly contemporaneous soundings from the early morning (around 1200 UTC), we plan to perform three pre-initiation soundings, nominally at 1800, 2000, and 2200 UTC, within the local airmass in which convection is expected. On days when a dropsonde aircraft is not being used, environmental near-storm sampling may continue into the storm phase. The two MGAUS units, and the two NSSL units, will “leapfrog” with one another (Fig. 3.4). The first pair of vehicles will simultaneously release soundings, and then will proceed to relocate downstream and prepare for their next launch. The progression will repeat so long as the other surface teams are making coordinated measurements. These measurements will be essential for PIs who wish to perform idealized or real data simulations, perform thermodynamic retrievals from radar data, or construct sounding-based climatologies for the VORTEX2 cases. This close-in depiction of the storm-scale environment will complement the broader scale view provided by the dropsondes, painting a coordinated multi-scale picture of how the storm and its environment interact with one another.

18
Figure 3.4. Example MGAUS locations for the Type U-N deployment strategy, which focuses on obtaining near-storm environmental soundings. MGAUS (“M”) and NOAA sounding (“N”) locations are shown. The pair of MGAUS units will alternately release soundings while “leapfrogging” one another (as will the pair of NOAA units). The dropsonde system does not participate in this deployment. Type U-S (storm scale) As reviewed above, a major priority of the field campaign is to fully characterize the baroclinity associated with mesoscale boundaries, either preexisting or produced by supercells, as well as the potential buoyancy of low-level parcels on the cool sides of those boundaries. We will collect such soundings on tethered phase IOP days, as shown in Figure 3.2. The storm’s evaporatively cooled forward flank boundary is of interest, as is the boundary associated with differential radiative fluxes along the anvil’s shadow edge, along with other significant mesoscale features that may be identified. These measurements will be made in close promixity to the active supercell storm that has been targeted for coordinated measurements. This is in contrast to the pre-existing mesoscale boundaries that may exist well ahead of a mature storm; such pre-existing boundaries would be sampled at the beginning or end of a flight leg by the dropsonde aircraft (Figure 3.2), owing to its greater range. These observations will continue as long as other intensive storm scale observations are continuing, as decided by the FC. However, upsonde operations will cease at/near sundown due to safety concerns related to the close proximity to the severe storms. U-S upsonde deployments will be occurring concurrently with either D-S or D-F dropsonde deployments. Estimated number of sondes required The MGAUS teams will be on-station alongside the other surface-based teams every deployment day. As noted above, on every deployment day we plan to release three pre-initiation soundings per vehicle, as part of the Type U-N mission. These would be full tropospheric soundings. Not every deployment day will result in the collection of coordinated storm-scale datasets. But, as described above, on intensive observing days we will collect additional soundings as a part of either Type U-S or continuing Type U-N missions. Regardless of which mission type is in progress, we expect to launch soundings as frequently as is possible during the IOPs. As the chief priority is a depiction of the depth and intensity of lower tropospheric boundaries during this phase, a nominal sonde cutoff height of ~8000 m AGL

19
would be requested. For an upsonde ascent rate of roughly 4 ms-1, a 30 minute flight time will be required for each sonde. Assuming that another 30-45 minutes are needed for the vehicles to properly reposition themselves with respect to the storm, and allowing 15 minutes to prepare and release the next sounding (Bill Brown, personal communication, 8/23/2007), we estimate that the MGAUS facilities can release one upsonde every 60-90 minutes. Assuming an average of 4h 30min sampling time during the IOPs, we expect to launch roughly 4 sondes per vehicle during each intensive observing period, or an estimated average of 8 sondes for the MGAUS pair per IOP. Similar numbers of soundings will be performed using the NSSL units, but they are not included as a part of this facilities request. Based on climatological studies and our experiences from VORTEX-94/95, we expect observing teams to be deployed on roughly 30% of all days. Among deployment days, roughly 60% will likely result in intensive IOPs. The above assumptions yield the following estimates for each individual year for VORTEX2: 86 days per year (tethered plus mobile)…. 26 deployments…… 16 intensive observing days On every deployment day we plan to release three pre-initiation soundings, resulting in a total of roughly 78 environmental soundings. On intensive observing days, we plan to release up to eight additional upsondes, resulting in a total of roughly 206 combined soundings per year. Allowing for a failure rate of 10%, or 21 sondes (not an unreasonable rate, based on VORTEX-94/95 and BAMEX), we therefore request a total of 227 upsondes for each year of VORTEX2, or a total of 454 sondes for the full two year period. How these are distributed between the two seasons may be somewhat dependent upon how active the large scale pattern is in 2009 versus 2010. Total Upsonde Request: (2 years) 2 MGAUS vehicles 2 EOL team leaders
454 upsondes (227 per year) 4. Field Project Support Support is requested for Field Project Services, to coordinate aircraft operations, to work with the dropsonde PI, to develop the field catalog, and also for overall data management. The detailed support needs have been included in the Facility Request document. 5. Current List of Related Proposals Utilizing Mobile Soundings The following mini-proposals (“one pagers”) were submitted to the National Science Foundation (NSF) with the VORTEX2 Scientific Program Overview (SPO). Full proposals will be submitted to the NSF and other agencies in September 2007. 1) VORTEX2 Mesoscale and Storm-Scale Numerical Weather Prediction PIs: David Dowell, Morris Weisman, Chris Davis, Chris Snyder, Jenny Sun, and David Stensrud 2) Mesoscale Environments of Supercells in VORTEX2 PIs: George Bryan and Morris Weisman 3) The Upscale Effects of Supercell Thunderstorms: Links to Tornadogenesis, Prediction and Global Climate PIs: Robert J. Trapp and Charles A. Doswell, III

20
4) Storm-Boundary and Storm-Environmental Interactions during VORTEX2 PIs: Lance F. Bosart 5) Adiabatic Lapse Rates and Tornadogenesis in VORTEX2 PIs: Matthew D. Parker 6) The observed impact of preexisting boundaries on supercells and tornadoes PIs: Adam L. Houston and Brian M. Argrow 7) Observational Study of Tornadogenesis and Characterization of Environmental Inhomogeneity PIs: Yvette Richardson, Paul Markowski, and Joshua Wurma

21
References Atkins, N. T., M. L. Weisman, and L. J. Wicker, 1999: The influence of preexisting boundaries on supercell evolution. Mon. Wea. Rev., 127, 2910--2927. Atallah, E., L. F. Bosart, and A. R. Aiyyer, 2007: Precipitation Distribution Associated with Landfalling Tropical Cyclones over the Eastern United States. Mon. Wea. Rev., 135, 2185-2206. Barnes, S. L., 1978: Oklahoma thunderstorms on 29--30 April 1970. Part I: Morphology of a tornadic storm. Mon. Wea. Rev., 106, 673--684. Bonesteele, R. G., and Y. J. Lin, 1978: A study of updraft-downdraft interaction based on perturbation pressure and single-Doppler radar data. Mon. Wea. Rev., 105, 62--68. Bosart, L.F. and G. M. Lackmann, 1995: Postlandfall Tropical Cyclone Reintensification in a Weakly Baroclinic Environment: A Case Study of Hurricane David (September 1979). Mon. Wea. Rev., 123, 3268-3291. Brooks, H. E., C. A. Doswell III, and R. P. Davies-Jones, 1993: Environmental helicity and the maintenance and evolution of low-level mesocyclones. The Tornado: Its Structure, Dynamics, Prediction, and Hazards, Geophys.~Monogr., No. 79, Amer. Geophys. Union, 97--104. Brooks, H. E., C. A. Doswell III, and J. Cooper, 1994: On the environments of tornadic and nontornadic mesocyclones. Wea. Forecasting, 9, 606--618. Brooks, H. E., M. T. Carr, and J. E. Ruthford, 1996: Preliminary analysis of soundings from VORTEX-95. Preprints, Conf. on Severe Local Storms, San Francisco, CA, Amer. Meteor. Soc., 133--136. Crook, N. A., and J. Sun, 2002: Assimilating radar, surface, and profiler data for the Sydney 2000 Forecast Demonstration Project. J. Atmos. Oceanic Technol., 19, 888--898. Dabbert, W. F., and Coauthors, 2000: Forecast issues in the urban zone: Report of the 10th Prospectus Development Team of the U.S. Weather Research Program. Bull. Amer. Meteor. Soc., 81, 2047--2064. Davis, C., et al., 2004: The bow echo and MCV experiment (BAMEX): Observations and opportunities. Bul. Amer. Meteor. Soc., 85, 1075-1093. Davis, C. A., and S. B. Trier, 2007: Mesoscale Convective Vortices Observed During BAMEX, Part I: Kinematic and Thermodynamic Structure. Mon.Wea. Rev., 135, 2029–2049. Dickinson, M.J., L. F. Bosart, W. E. Bracken, G. J. Hakim, D. M. Schultz, M. A. Bedrick, and K. R. Tyle, 1997: The March 1993 Superstorm Cyclogenesis: Incipient Phase Synoptic- and Convective-Scale Flow Interaction and Model Performance. Mon. Wea. Rev., 125, 3041-3072. Done, J., C. A. Davis, and M. Weisman, 2004: The next generation of NWP: Explicit forecasts of convection using the Weather Research and Forecasting (WRF) model. Atmos. Sci. Let., 5, 110--117. Droegemeier, K.K., 1990: Toward a science of storm scale prediction. Preprints, 16th Conf. on Severe Local Storms. Amer. Meteor. Soc., Kananaskis Park, Alberta, Canada, 256-262.

22
Droegemeier, K.K., 1997: The numerical prediction of thunderstorms: Challenges, potential benefits and results from real-time operational tests. WMO Bull, 46, 324-336. Droegemeier, K. K., and Coauthors, 1996: Realtime numerical prediction of storm-scale weather during VORTEX ’95: Goals and methodology. Preprints, 18th Conf.~on Severe Local Storms, San Francisco, CA, Amer. Meteor. Soc., 6--10. Droegemeier, K. K., and Coauthors, 2000: Hydrological aspects of weather prediction and flood warnings: Report of the Ninth Prospectus Development Team of the U.S. Weather Research Program. Bull. Amer. Meteor. Soc., 81, 2665--2680. Fritsch, J. M., and Coauthors, 1998: Quantitative precipitation forecasting: Report of the Eighth Prospectus Development Team, U.S. Weather Research Program. Bull. Amer. Meteor. Soc., 79, 285--299. Fritsch, J. M., C. F. Chappell, and L. R. Hoxit, 1976: The use of large scale budgets for convective parameterization. Mon. Wea. Rev., 104, 1408-1418. Galarneau, T., Jr and L. F. Bosart, 2007: The long-lived MCV of 10-13 June 2003: A possible example of an incipient tropical disturbance over land? 12th Conference on Mesoscale Processes, American Meteorological Society, 6-9 August 2007, Waterville Valley, NH. Gallus, W.A. Jr., J. Correia Jr., I. Jankov, 2005: The 4 June 1999 derecho event: A particularly difficult challenge for numerical weather prediction. Wea. Forecasting, 20, 705-728. Gilmore, M. S., and L. J. Wicker, 2002: Influences of the local environment on supercell cloud-to-ground lightning, radar characteristics, and severe weather on 2 June 1995. Mon. Wea. Rev., 130, 2349--2372. Houston, A. L., and R. B. Wilhelmson, 2002: Numerical simulation of storm boundary anchoring in a high-CAPE, low-shear environment: Implications for the modulation of convective mode. Preprints, 21st Conf.~on Severe Local Storms, San Antonio, TX, Amer. Meteor. Soc., 345--348. Houston, A. L., and R. B. Wilhelmson, 2002b: The role of the preexisting boundary on tornadogenesis in the 27 May 1997 central Texas event. Preprints, 21st Conf.~on Severe Local Storms, San Antonio, TX, Amer. Meteor. Soc., 469--472. Kain, J. S., S. J. Weiss, M. E. Baldwin, G. W. Carbin, D. A. Bright, J. J. Levit, and J. A. Hart, 2005: Evaluating high-resolution configurations of the WRF model that are used to forecast severe convective weather: The 2005 SPC/NSSL Spring Program. Preprints, 21st Conference on Weather Analysis and Forecasting/17th Conference on Numerical Weather Prediction, Washington, D. C., Amer. Meteor. Soc., CD-ROM, 2A.5. Kain, J.S., S.J. Weiss, J.J. Levit, M.E. Baldwin, and D.R. Bright, 2006: Examination of convective allowing configurations of the WRF model for the prediction of severe convective weather: The SPC/NSSL spring program 2004. Wea. Forecasting, 21, 167-181. Kain, J.S., S.J. Weiss, D.R. Bright, M.E. Baldwin, J.J. Levit, G.W. Carbin, C.S. Schwartz, M. Weisman, K.K. Droegemeier, D. Weber, and K.W. Thomas, 2007: Some practical considerations for the first generation of operational convection allowing NWP: How much resolution is enough? Preprints, 22nd Conf. on Weather analysis and Forecasting/18th Conf. on Numerical Weather Prediction, Park City, Utah, Amer. Meteor. Soc., CD-ROM 3B.5.

23
Lilly, D. K., 1990: Numerical prediction of thunderstorms---has its time come? Quart. J. Roy. Meteor. Soc., 116, 779--798. Maddox, R. A., L. R. Hoxit, and C. F. Chappell, 1980: A study of tornadic thunderstorm interactions with thermal boundaries. Mon. Wea. Rev., 108, 322--348. Markowski, P. M., and Y. P. Richardson, 2004: Multiple-Doppler radar observations of vertical wind profile heterogeneity in convective boundary layers. Preprints, 22nd Conf. on Severe Local Storms, Hyannis, MA, Amer. Meteor. Soc. Markowski, P. M., J. M. Straka, E. N. Rasmussen, and D. O. Blanchard, 1998a: Variability of storm-relative helicity during VORTEX. Mon. Wea. Rev., 126, 2959--2971. Markowski, P. M., E. N. Rasmussen, J. M. Straka, and D. C. Dowell, 1998b: Observations of low-level baroclinity generated by anvil shadows. Mon. Wea. Rev., 126, 2942--2958. Markowski, P. M., E. N. Rasmussen, and J. M. Straka, 1998c: The occurrence of tornadoes in supercells interacting with boundaries during VORTEX-95. Wea. Forecasting, 13, 852--859. Marwitz, J., and D. W. Burgess, 1994: The observed inflow structure of a thunderstorm with a mesocyclone. Mon. Wea. Rev., 122, 393--396. Rasmussen, E. N., J. M. Straka, R. P. Davies-Jones, C. A. Doswell, F. H. Carr, M. D. Eilts, and D. R. MacGorman, 1994: Verification of the Origins of Rotation in Tornadoes Experiment: VORTEX. Bull. Amer. Meteor. Soc., 75, 995--1006. Rasmussen, E. N., S. Richardson, J. M. Straka, P. M. Markowski, and D. O. Blanchard, 2000: The association of significant tornadoes with a baroclinic boundary on 2 June 1995. Mon. Wea. Rev., 128, 174--191. Reasor, P.D., M. T. Montgomery, and L. F. Bosart, 2005: Mesoscale Observations of the Genesis of Hurricane Dolly (1996). J. Atmo. Sci., 62, 3151-3171. Richardson, Y. P., 1999: The influence of horizontal variations in vertical shear and low-level moisture on numerically simulated convective storms. Ph.D. Dissertation, Department of Meteorology, University of Oklahoma-Norman, 236 pp. Richardson, Y. P., K. K. Droegemeier, and R. P. Davies-Jones, 2007: The influence of horizontal environmental variability on numerically-simulated convective storms. Part I: Variations in vertical shear. Mon. Wea. Rev., 135, in press. Roebber, P.J., D.M. Schultz, and R. Romero, 2002: Synoptic regulation of the 3 May 1999 tornado outbreak. Wea. Forecasting, 17, 399-429. Shapiro, M. A., and Collaborators, 1999: A Planetary-scale to Mesoscale Perspective of the Life Cycles of Extratropical Cyclones: The Bridge Between Theory and Observations. In The Life Cycles of Extratropical Cyclones, edited by M. A. Shapiro and S. Gronas, American Meteorological Society , 139-186. Schlesinger, R. E. 1990: Feedback of deep moist convection to its near environment as diagnosed from three-dimensional numerical model output. Results from an early experiment. J. Atmos. Sci., 47, 139-1416.
Schlesinger, R. E. 1994: Heat, moisture, and momentum budgets of isolated deep midlatitude and tropical

24
convective clouds as diagnosed from three-dimensional model output. Part I: Control experiments. J. Atmos. Sci., 51, 3649–3673. Storm, Brandon A., M. D. Parker, and D. P. Jorgensen, 2007: A Convective Line with Leading Stratiform Precipitation from BAMEX. Mon. Wea. Rev., 135, 1769–1785. Sun, J., and N. A. Crook, 2001: Real-time low-level wind and temperature analysis using single WSR-88D data. Wea. Forecasting, 16, 117--132. Stensrud, D. J., 1996: Effects of persistent, midlatitude mesoscale regions of convection on the large-scale environment during the warm season. J. Atmos. Sci., 53, 3503-3527. Trapp, R. J., C. A. Doswell III, and M. Huber, 2004: Do supercell thunderstorms play a role in the equilibration of the large-scale atmosphere? Preprints, 22nd Conf. on Severe Local Storms, Hyannis, MA, Amer. Meteor. Soc. Trapp, R. J., N. S. Diffenbaugh, H. E. Brooks, M. E. Baldwin, E. D. Robinson, and J. S. Pal, 2007: Changes in severe thunderstorm frequency during the 21st century due to anthropogenically enhanced global radiative forcing. Proceedings of the National Academy of Sciences, in revision Trier, S. B., and C. A. Davis, 2007: Mesoscale Convective Vortices Observed During BAMEX, Part II: Influences on Secondary Deep Convection. Mon.Wea. Rev., 135, 2051-2075. U.S. Dept. of Commerce, 1999: Vision 2005: National Weather Service strategic plan for weather, water, and climate services 2000--2005. Available at http://www.noaa.gov. Wang, P. K., 2002: Moisture plumes above thunderstorm anvils and their contributions to cross-tropospheric transport of water vapor in midlatitudes. J. Geophys. Research, 108, 4194. Weckwerth, T. M., J. W. Wilson, and R. M. Wakimoto, 1996: Thermodynamic variability within the convective boundary layer due to horizontal convective rolls. Mon. Wea. Rev., 124, 769--784. Weckwerth, T.M., D.B. Parsons, S.E. Koch, J.A. Moore, M.A. LeMone, B.B. Demoz, C. Flamant, B. Geerts, J. Wang and W.F. Feltz, 2004: An overview of the International H2O Project (IHOP_2002) and some preliminary highlights. Bull. Amer. Meteor. Soc., 85, 253-277. Weisman, M. L., C. Davis, W. Wang, K. Manning, and J. Klemp, 2007: Experiences with 0--36 h explicit convective forecasts with the WRF-ARW model. Wea. Forecasting, conditionally accepted. Weisman, M. L., M. S. Gilmore, and L. J. Wicker, 1998: The impact of convective storms on their local environment: What is a proximity sounding? Preprints, 19th Conf. on Severe Local Storms, Minneapolis, MN, Amer. Meteor. Soc., 238--241. Weiss, S.J., J.S. Kain, J.J. Levit,M.E. Baldwin, and D.R. Bright, 2004: Examination of several different versions of the Weather Research and Forecasting (WRF) model for the prediction of severe convective weather: The SPC/NSSL Spring Program 2004. 22nd Conf. On Severe Local Storms. Weiss, S.J., J.S. Kain, D.R. Bright, J.J. Levit, G.W. Carbin, M.E. Pyle, Z.I. Janjic, B.S. Ferrier, J.Du, M.L. Weisman and M. Xue, 2007: The NOAA Hazardous Weather Testbed: Collaborative testing of ensemble and convection-allowing WRF models and subsequent transfer to operations at the Storm Prediction Center. Preprints, 22nd Conf. on Weather analysis and Forecasting/18th Conf. on Numerical Weather Prediction, Park City, Utah, Amer. Meteor. Soc., CD-ROM 6B.4.

25
Wicker, L. J., M. P. Kay, and M. P. Foster, 1997: STORMTIPE-95: Results from a convective storm forecast experiment. Wea. Forecasting, 12, 388--398. Xue, M., and Coauthors, 1996: Real time prediction of storm-scale weather during VORTEX-95. Part II: Operation summary and example cases. Preprints, 18th Conf. on Severe Local Storms, San Francisco, CA, Amer. Meteor. Soc., 178--182. Xue, M. and W.J. Martin, 2006a: A high resolution modeling study of the 24 May 2002 dryline case during IHOP. Part I: Numerical simulation and general evolution of the dryline and convection. Mon. Wea. Rev., 134, 149-171. Xue, M. and W.J. Martin, 2006b: A high resolution modeling study of the 24 May 2002 dryline case during IHOP. Part II: Horizontal convective rolls and convective initiation. Mon. Wea. Rev., 134, 172-191. Zipser, E.J., et al., 1984: The National Storm Program: Storm-Central Phase, Preliminary Program Design. National Center for Atmospheric Research, Boulder, CO., 147 pp.