Misure, stime e perplessità per la valutazione delle performance della giustizia in Italia e in...
33
Misure, s)me e perplessità per la valutazione delle performance della gius)zia in Italia e in Europa Marco Velicogna [email protected]
Transcript of Misure, stime e perplessità per la valutazione delle performance della giustizia in Italia e in...

Misure, s)me e perplessita per la valutazione delle performance della gius)zia in Italia e in
Europa
Marco Velicogna [email protected]


Aree di ricerca:
– Governance degli appara) giudiziari e ruoli processuali
– Qualita e valutazione dei sistemi giudiziari
– Organizzazione, funzionamento e innovazione tecnologica dell’amministrazione della gius)zia

Collaborazioni con Organismi internazionali: European Commission on the Efficiency of Jus?ce of the Council of Europe (CEPEJ-‐CoE e.g. esper) scien)fici, rappor) tecnici, collaborazione sullo sviluppo di strumen) di indagine ed approcci alla valutazione dei Sistemi Giudiziari Europei)
United Na?ons Office on Drugs and Crime (UNODC e.g. Resource Guide on Strengthening Judicial Integrity and Capacity )
Organiza?on for Security and Co-‐opera?on in Europe (OSCE)
World Bank (e.g. Community of Prac)ce in the World Bank Jus)ce Peer-‐Assisted Learning Networkn-‐ JUST-‐PAL)
Assistenza tecnica e.g. – Workload and Professional Status of Magistrates (Ministry of
Jus)ce of Bulgaria, with the contribu)on of the Council of Europe and the collabora)on of the High Judicial Council of Bulgaria
– Support to the Jordanian authori7es in improving the quality and efficiency of the Jordanian jus7ce system (within the joint European Union & Council of Europe programme: Strengthening democra)c reform in the southern Neighbourhood)
– …

Proge[ Europei
Vari proge[ internazionali a[vi,
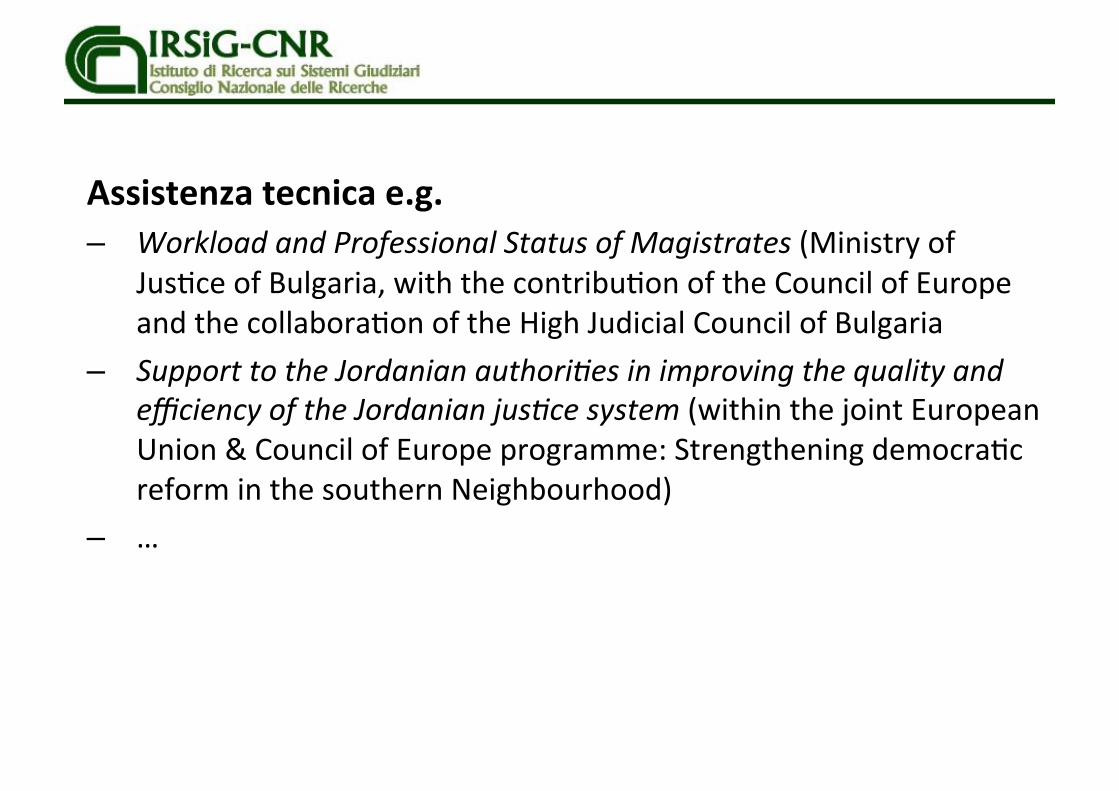
tra cui e-‐CODEX (e-‐Jus)ce Communica)on via Online Data EXchange )
6
e-‐CODEX
7
e-‐Jus)ce Communica)on via Online Data EXchange (e-‐CODEX)
Participants Austria, Belgium, Czech Republic, Estonia, France, Germany, Greece, Hungary, Ireland, Italy, Lithuania, Malta, The Netherlands, Norway, Poland, Portugal, Romania, Spain, Turkey, United Kingdom, CCBE, CNUE, CNR
Duration 65 Months (2010-2016)
Budget €24 million (co-funded by the European Commission)
Programme ICT Policy Support Programme under the Competitiveness and Innovation Framework Programme (CIP)

e-‐CODEX
8
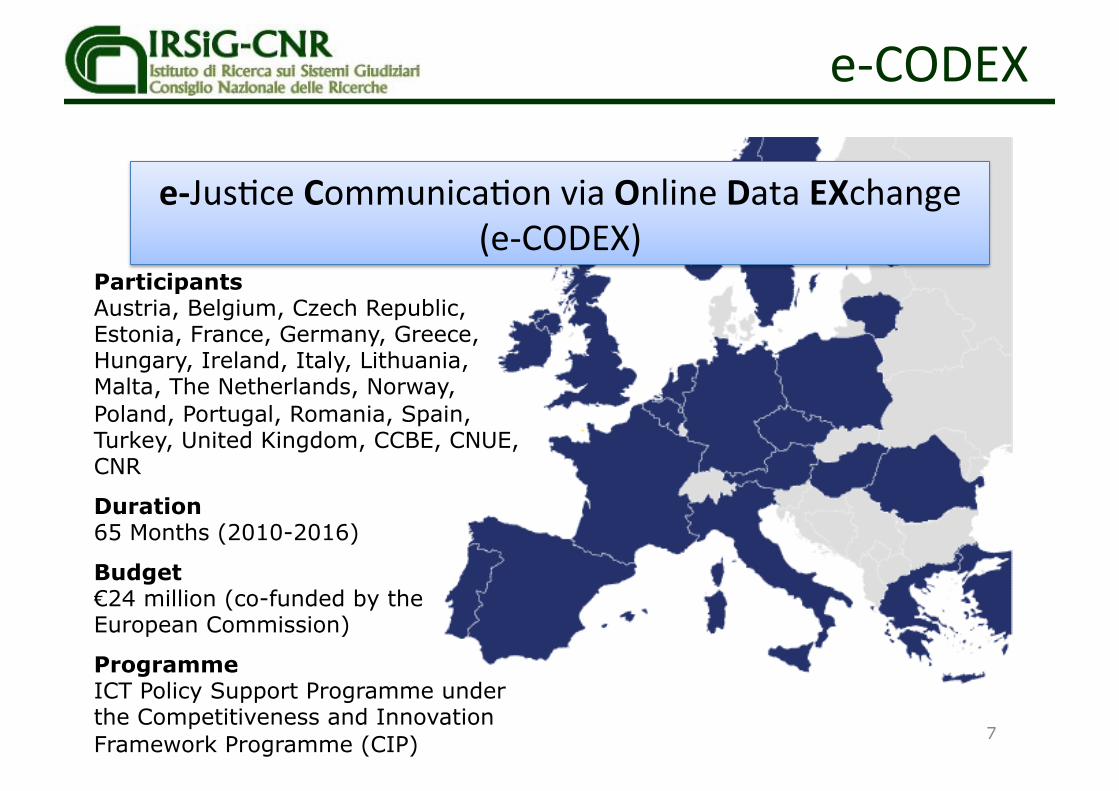
Costruire un’infrastru^ura per la comunicazione transfrontaliera in ambito giudiziario (da) e documen))
e-‐CODEX Pilots
9
Civil Jus?ce: • European Payment Order • Small Claims • Business Registers
Criminal Jus?ce -‐ Secure Cross-‐Border Exchange of Sensi)ve Judicial Data: • Mutual Legal Assistance • European Arrest Warrant • Financial Penal)es applied to
traffic offences • Framework Decision 909 on
Exchange of Prisoners

Focus: Misure, s)me e perplessita per la
valutazione delle performance della gius)zia in Italia e in Europa

The rise of numbers
Negli ul)mi anni si è potuto assistere alla crescita in numero e rilevanza di gruppi, commissioni, organizzazioni di esper? giuridici, giudici e accademici…
finalizza) allo scambio di idee e prassi, alla formazione, alla produzione di raccomandazioni, opinioni ma anche alla raccolta di da? e best prac?ces concernen) differen) se^ori del diri^o o del funzionamento dei sistemi giudiziari…
Che si sono cos)tui) sia a livello nazionale che transnazionale, nel quadro di organizzazioni quali il Consiglio d’Europa, dell’Unione Europea, etc.
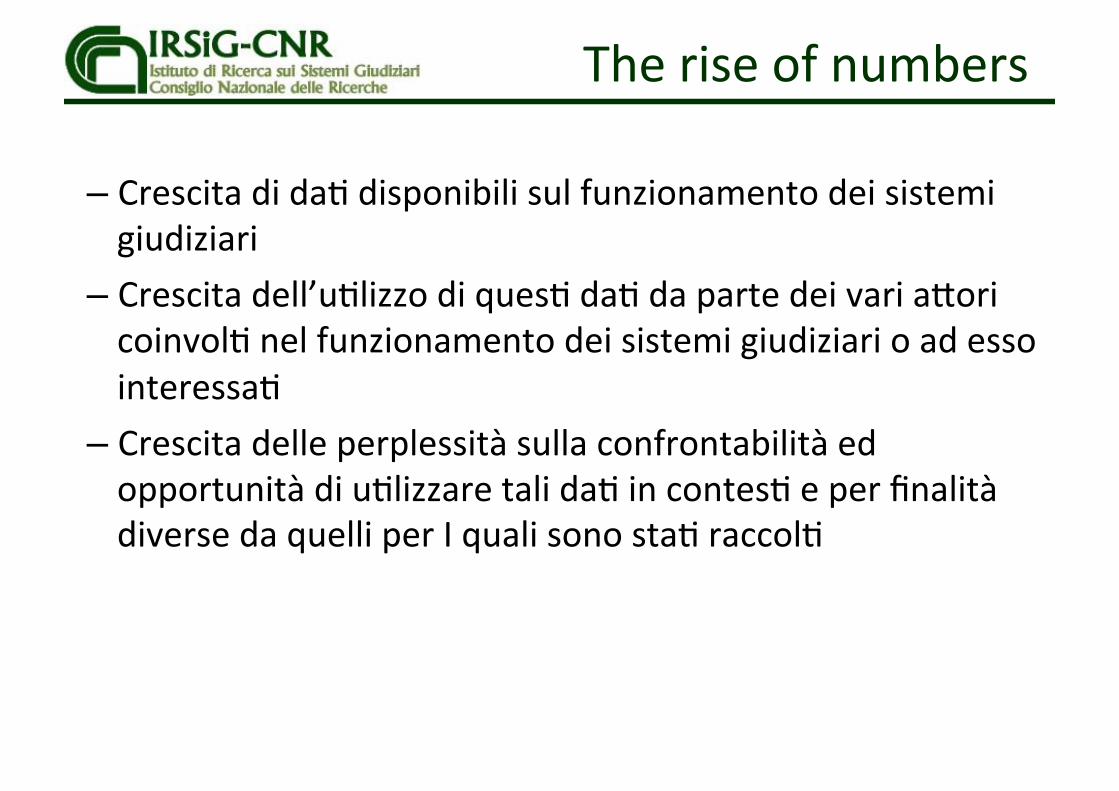
The rise of numbers
– Crescita di da) disponibili sul funzionamento dei sistemi giudiziari
– Crescita dell’u)lizzo di ques) da) da parte dei vari a^ori coinvol) nel funzionamento dei sistemi giudiziari o ad esso interessa)
– Crescita delle perplessità sulla confrontabilità ed opportunità di u)lizzare tali da) in contes) e per finalità diverse da quelli per I quali sono sta) raccol)
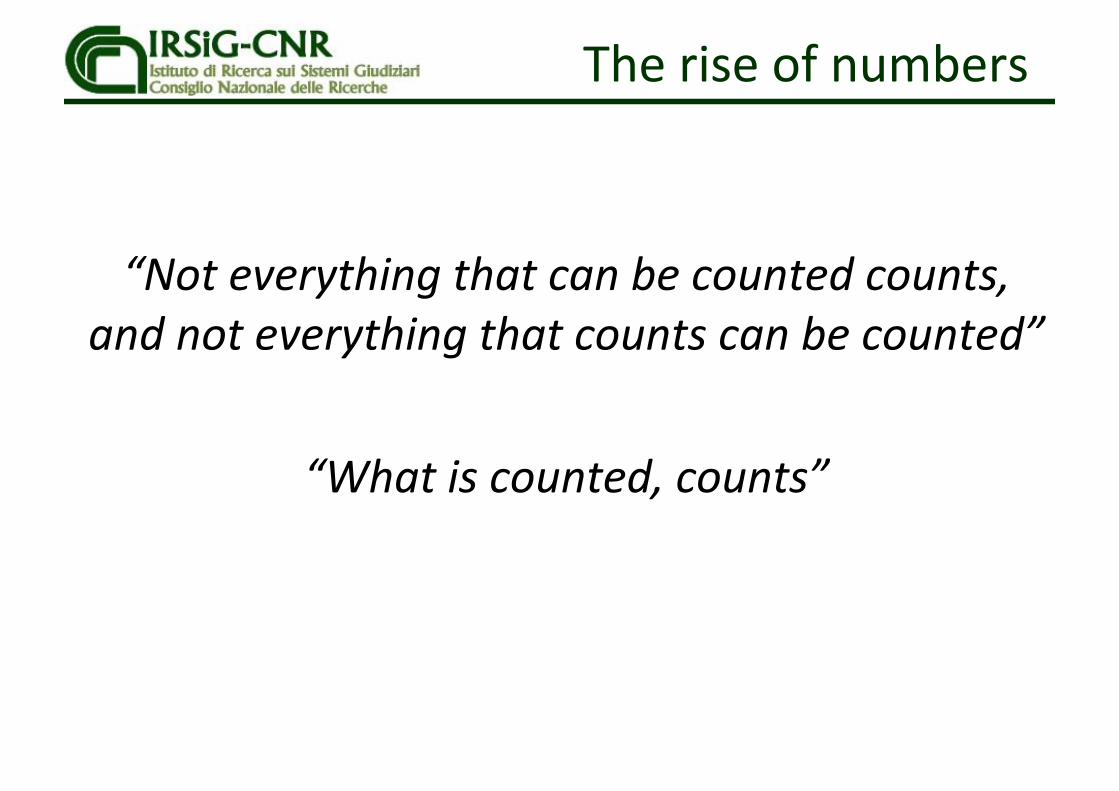
The rise of numbers
“Not everything that can be counted counts,
and not everything that counts can be counted”
“What is counted, counts”

Some defini)ons
• Incoming cases: It is the number of new cases filed during the year of reference that needs to be dealt with by the court.
• Resolved cases: It is the number of cases that have been dealt with by the court during the year of reference.
• Pending cases on 1 Jan.: It is the number of cases that have to be dealt with by the court at the beginning of the considered year (1 January).
• Pending cases on 31 Dec.: It is the number of cases that s)ll have to be dealt with by the court at the end of the considered year (31 December).
• Backlog: number of cases that exceed the “allowed dura)on” /the number or percentage of cases not decided within an established )meframe
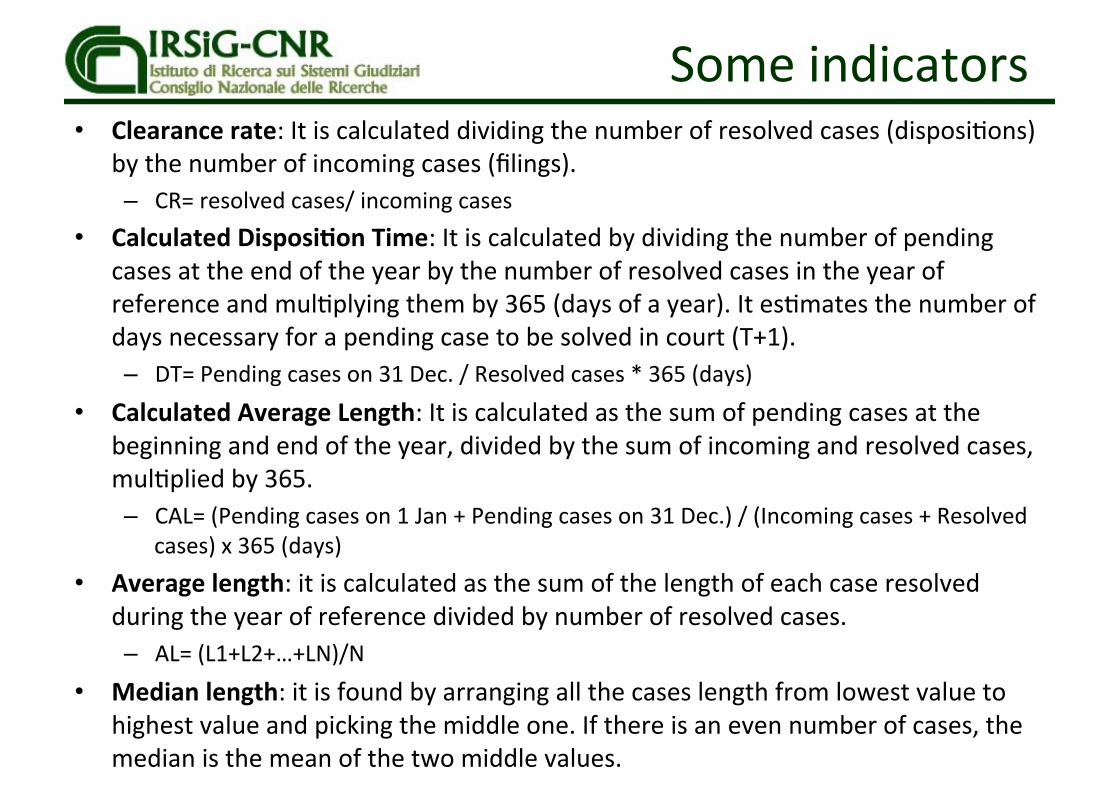
Some indicators • Clearance rate: It is calculated dividing the number of resolved cases (disposi)ons)
by the number of incoming cases (filings). – CR= resolved cases/ incoming cases
• Calculated Disposi?on Time: It is calculated by dividing the number of pending cases at the end of the year by the number of resolved cases in the year of reference and mul)plying them by 365 (days of a year). It es)mates the number of days necessary for a pending case to be solved in court (T+1). – DT= Pending cases on 31 Dec. / Resolved cases * 365 (days)
• Calculated Average Length: It is calculated as the sum of pending cases at the beginning and end of the year, divided by the sum of incoming and resolved cases, mul)plied by 365. – CAL= (Pending cases on 1 Jan + Pending cases on 31 Dec.) / (Incoming cases + Resolved
cases) x 365 (days) • Average length: it is calculated as the sum of the length of each case resolved
during the year of reference divided by number of resolved cases. – AL= (L1+L2+…+LN)/N
• Median length: it is found by arranging all the cases length from lowest value to highest value and picking the middle one. If there is an even number of cases, the median is the mean of the two middle values.
la CEPEJ? Commissione per l’efficienza della gius)zia del Consiglio
d’Europa
16

49 sistemi giudiziari
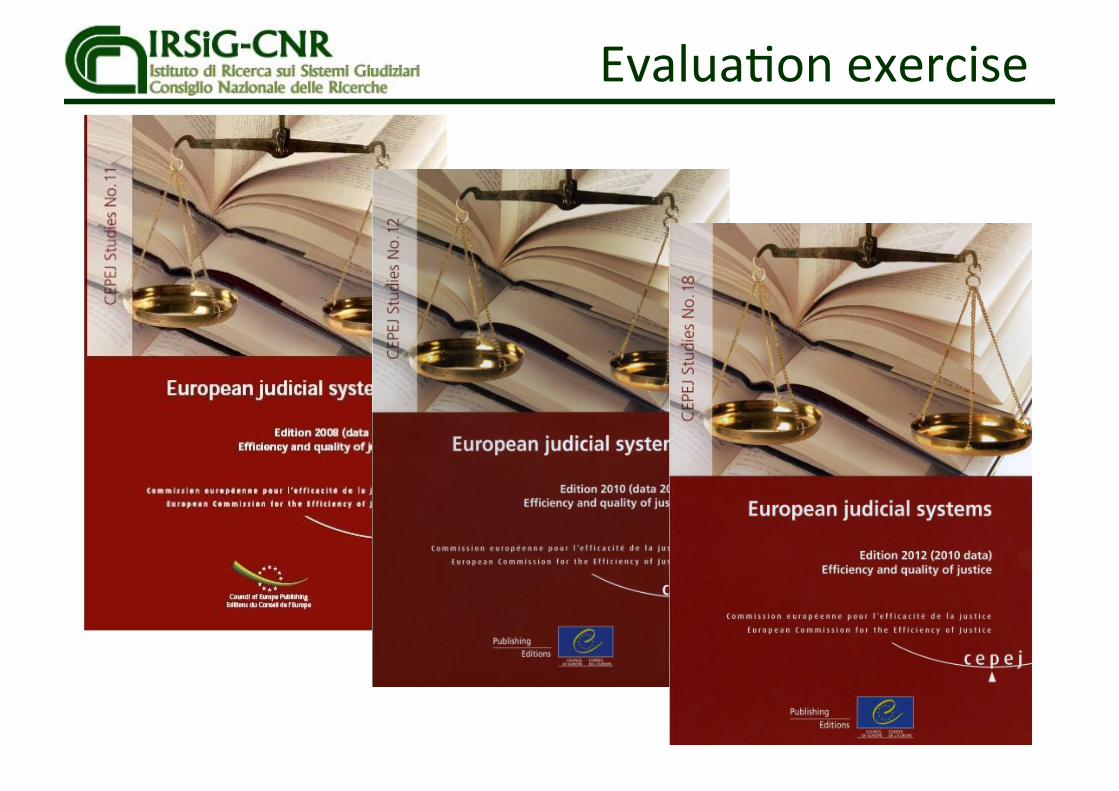
Evalua)on exercise

Evalua)on exercise

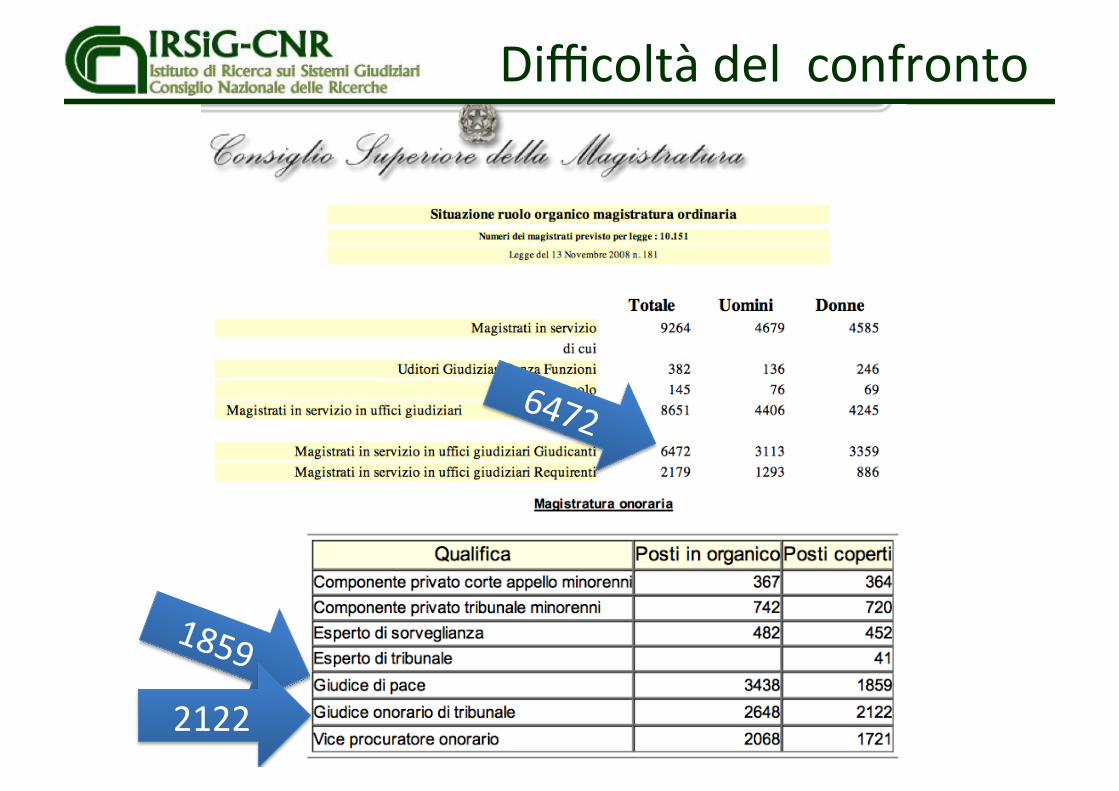
Difficoltà del confronto
121
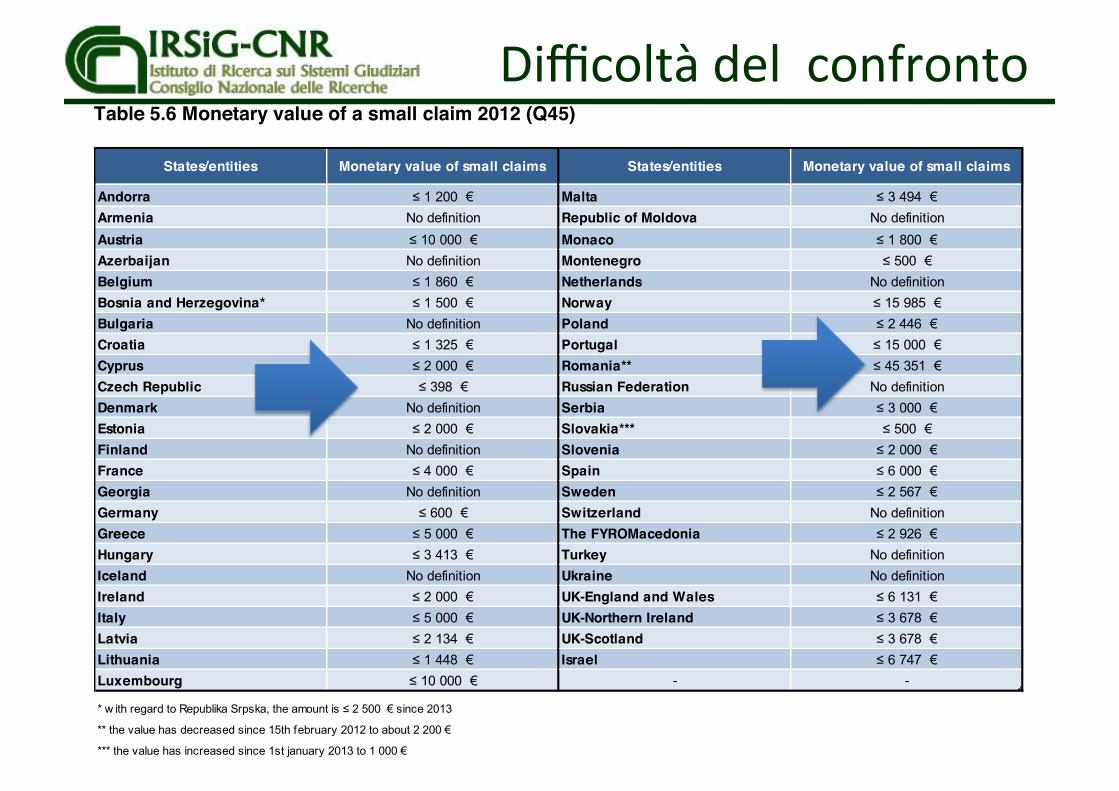
Denmark: with a few exceptions, all cases (small claims, employment dismissals, robberies) are brought before the district courts. Greece: 155 peace courts have jurisdiction over disputes for an amount which does not exceed 5 000 €, in accordance with the Law No. 3994/2011 entitled "Rationalization and improvement in the allocation of justice in civil courts and other provisions ". Italy: since the implementation of the 2013 reform concerning the judicial organisation in districts, the figures are: about 200 for the recovery of small claims, 135 employment dismissals and 135 robberies. Netherlands: disputes involving small claims and employment dismissals are dealt with by the sub-district courts (sector kanton). Russian Federation: data is not available for commercial courts (the figures provided above do not reflect the real situation). Turkey: there are more specialized courts for the recovery of small claims since 1 October 2011. The significant decrease in the number of courts for employment dismissals comes from the new definition of dismissal. Small claims The European average and European median are 1,2 and 1,1 courts per 100.000 inhabitants, respectively. The largest number of first instance courts competent for debt collection of small claims per inhabitant (over 3 courts per 100.000 inhabitants) can be observed in Spain (3,79) – having in mind the specific definition of courts in this country: one judge = one court. A low number (less than 0,5 courts per 100.000 inhabitants) can be noted in France (0,47), Malta (0,47), Denmark (0,43), UK-England and Wales (0,31) Netherlands (0,30) and Portugal (0,01). However, this indicator can only be interpreted along with comparable states, and is very sensitive to the definition of a small claim. Indeed, there is a large difference between states or entities with respect to the financial amount of the dispute. The lowest value is observed in Czech Republic (≤ 398€), the highest in Romania (≤ 45 351 €). These differences may partly be due to the specific economic situation of the countries, the civil procedural rules that are applied, and the level of specialisation of courts in this area. Table 5.6 Monetary value of a small claim 2012 (Q45)
Comments:
States/entities Monetary value of small claims States/entities Monetary value of small claims
Andorra ≤ 1 200 € Malta ≤ 3 494 €Armenia No definition Republic of Moldova No definitionAustria ≤ 10 000 € Monaco ≤ 1 800 €Azerbaijan No definition Montenegro ≤ 500 €Belgium ≤ 1 860 € Netherlands No definitionBosnia and Herzegovina* ≤ 1 500 € Norway ≤ 15 985 €Bulgaria No definition Poland ≤ 2 446 €Croatia ≤ 1 325 € Portugal ≤ 15 000 €Cyprus ≤ 2 000 € Romania** ≤ 45 351 €Czech Republic ≤ 398 € Russian Federation No definitionDenmark No definition Serbia ≤ 3 000 €Estonia ≤ 2 000 € Slovakia*** ≤ 500 €Finland No definition Slovenia ≤ 2 000 €France ≤ 4 000 € Spain ≤ 6 000 €Georgia No definition Sweden ≤ 2 567 €Germany ≤ 600 € Switzerland No definitionGreece ≤ 5 000 € The FYROMacedonia ≤ 2 926 €Hungary ≤ 3 413 € Turkey No definitionIceland No definition Ukraine No definitionIreland ≤ 2 000 € UK-England and Wales ≤ 6 131 €Italy ≤ 5 000 € UK-Northern Ireland ≤ 3 678 €Latvia ≤ 2 134 € UK-Scotland ≤ 3 678 €Lithuania ≤ 1 448 € Israel ≤ 6 747 €Luxembourg ≤ 10 000 € - -
* w ith regard to Republika Srpska, the amount is ≤ 2 500 € since 2013
** the value has decreased since 15th february 2012 to about 2 200 €
*** the value has increased since 1st january 2013 to 1 000 €
Table 5.6 Monetary value of a small claim in 2012 (Q45)
15/0
9/20
14
Difficoltà del confronto
18
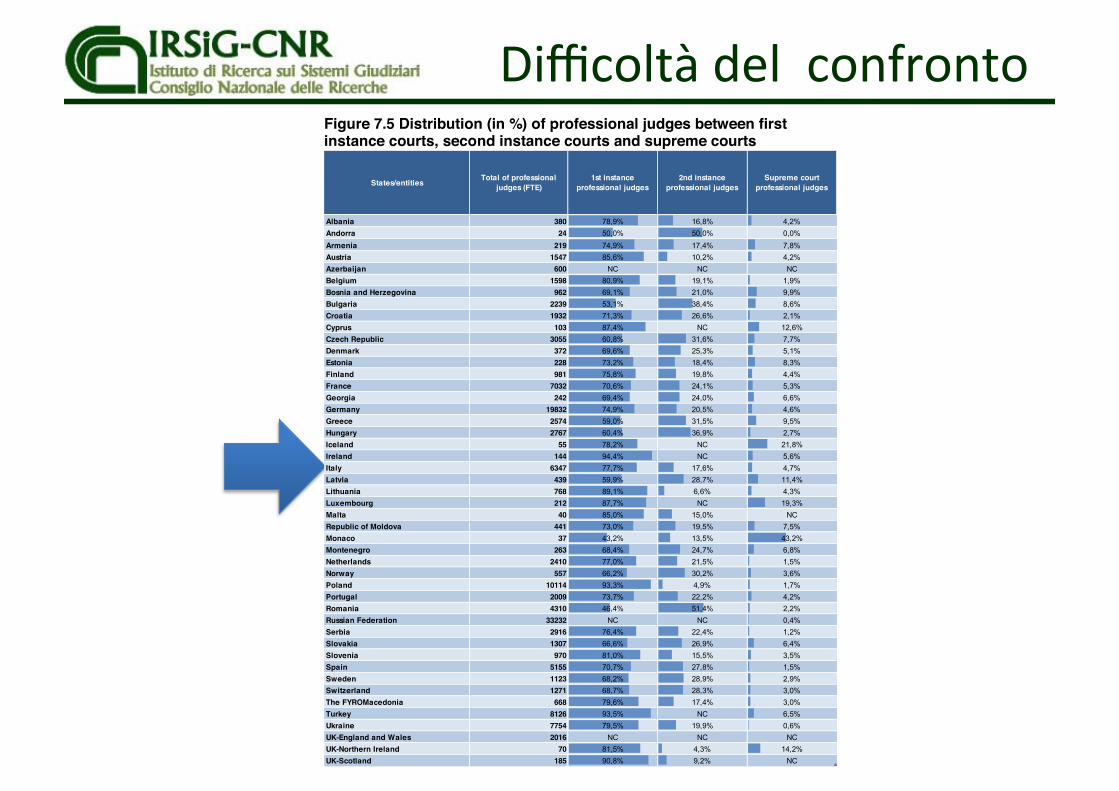
both their significant level of professionalization and the important place conferred to non-professional judges. Figure 7.5 Distribution (in %) of professional judges between first instance courts, second instance courts and supreme courts
States/entities Total of professional judges (FTE)
1st instance professional judges
2nd instance professional judges
Supreme court professional judges
Albania 380 78,9% 16,8% 4,2%Andorra 24 50,0% 50,0% 0,0%
Armenia 219 74,9% 17,4% 7,8%Austria 1547 85,6% 10,2% 4,2%Azerbaijan 600 NC NC NCBelgium 1598 80,9% 19,1% 1,9%Bosnia and Herzegovina 962 69,1% 21,0% 9,9%Bulgaria 2239 53,1% 38,4% 8,6%Croatia 1932 71,3% 26,6% 2,1%Cyprus 103 87,4% NC 12,6%Czech Republic 3055 60,8% 31,6% 7,7%Denmark 372 69,6% 25,3% 5,1%Estonia 228 73,2% 18,4% 8,3%Finland 981 75,8% 19,8% 4,4%France 7032 70,6% 24,1% 5,3%Georgia 242 69,4% 24,0% 6,6%Germany 19832 74,9% 20,5% 4,6%Greece 2574 59,0% 31,5% 9,5%Hungary 2767 60,4% 36,9% 2,7%Iceland 55 78,2% NC 21,8%Ireland 144 94,4% NC 5,6%Italy 6347 77,7% 17,6% 4,7%Latvia 439 59,9% 28,7% 11,4%Lithuania 768 89,1% 6,6% 4,3%Luxembourg 212 87,7% NC 19,3%Malta 40 85,0% 15,0% NCRepublic of Moldova 441 73,0% 19,5% 7,5%Monaco 37 43,2% 13,5% 43,2%Montenegro 263 68,4% 24,7% 6,8%Netherlands 2410 77,0% 21,5% 1,5%Norway 557 66,2% 30,2% 3,6%Poland 10114 93,3% 4,9% 1,7%Portugal 2009 73,7% 22,2% 4,2%Romania 4310 46,4% 51,4% 2,2%Russian Federation 33232 NC NC 0,4%Serbia 2916 76,4% 22,4% 1,2%Slovakia 1307 66,6% 26,9% 6,4%Slovenia 970 81,0% 15,5% 3,5%Spain 5155 70,7% 27,8% 1,5%Sweden 1123 68,2% 28,9% 2,9%Switzerland 1271 68,7% 28,3% 3,0%The FYROMacedonia 668 79,6% 17,4% 3,0%Turkey 8126 93,5% NC 6,5%Ukraine 7754 79,5% 19,9% 0,6%UK-England and Wales 2016 NC NC NCUK-Northern Ireland 70 81,5% 4,3% 14,2%UK-Scotland 185 90,8% 9,2% NC
Average 2971 73,5% 22,8% 6,7%Median 981 74,3% 21,5% 4,6%Minimum 24 43,2% 4,3% 0,0%Maximum 33232 94,4% 51,4% 43,2%
Israel 651 70,5% 27,2% 2,3%
Figure 7.5 Distribution (in %) of professional judges between first instance courts, second instance courts and supreme courts (Q46)
09/0
9/20
14
Difficoltà del confronto
18
both their significant level of professionalization and the important place conferred to non-professional judges. Figure 7.5 Distribution (in %) of professional judges between first instance courts, second instance courts and supreme courts
States/entities Total of professional judges (FTE)
1st instance professional judges
2nd instance professional judges
Supreme court professional judges
Albania 380 78,9% 16,8% 4,2%Andorra 24 50,0% 50,0% 0,0%
Armenia 219 74,9% 17,4% 7,8%Austria 1547 85,6% 10,2% 4,2%Azerbaijan 600 NC NC NCBelgium 1598 80,9% 19,1% 1,9%Bosnia and Herzegovina 962 69,1% 21,0% 9,9%Bulgaria 2239 53,1% 38,4% 8,6%Croatia 1932 71,3% 26,6% 2,1%Cyprus 103 87,4% NC 12,6%Czech Republic 3055 60,8% 31,6% 7,7%Denmark 372 69,6% 25,3% 5,1%Estonia 228 73,2% 18,4% 8,3%Finland 981 75,8% 19,8% 4,4%France 7032 70,6% 24,1% 5,3%Georgia 242 69,4% 24,0% 6,6%Germany 19832 74,9% 20,5% 4,6%Greece 2574 59,0% 31,5% 9,5%Hungary 2767 60,4% 36,9% 2,7%Iceland 55 78,2% NC 21,8%Ireland 144 94,4% NC 5,6%Italy 6347 77,7% 17,6% 4,7%Latvia 439 59,9% 28,7% 11,4%Lithuania 768 89,1% 6,6% 4,3%Luxembourg 212 87,7% NC 19,3%Malta 40 85,0% 15,0% NCRepublic of Moldova 441 73,0% 19,5% 7,5%Monaco 37 43,2% 13,5% 43,2%Montenegro 263 68,4% 24,7% 6,8%Netherlands 2410 77,0% 21,5% 1,5%Norway 557 66,2% 30,2% 3,6%Poland 10114 93,3% 4,9% 1,7%Portugal 2009 73,7% 22,2% 4,2%Romania 4310 46,4% 51,4% 2,2%Russian Federation 33232 NC NC 0,4%Serbia 2916 76,4% 22,4% 1,2%Slovakia 1307 66,6% 26,9% 6,4%Slovenia 970 81,0% 15,5% 3,5%Spain 5155 70,7% 27,8% 1,5%Sweden 1123 68,2% 28,9% 2,9%Switzerland 1271 68,7% 28,3% 3,0%The FYROMacedonia 668 79,6% 17,4% 3,0%Turkey 8126 93,5% NC 6,5%Ukraine 7754 79,5% 19,9% 0,6%UK-England and Wales 2016 NC NC NCUK-Northern Ireland 70 81,5% 4,3% 14,2%UK-Scotland 185 90,8% 9,2% NC
Average 2971 73,5% 22,8% 6,7%Median 981 74,3% 21,5% 4,6%Minimum 24 43,2% 4,3% 0,0%Maximum 33232 94,4% 51,4% 43,2%
Israel 651 70,5% 27,2% 2,3%
Figure 7.5 Distribution (in %) of professional judges between first instance courts, second instance courts and supreme courts (Q46)
09/0
9/20
14
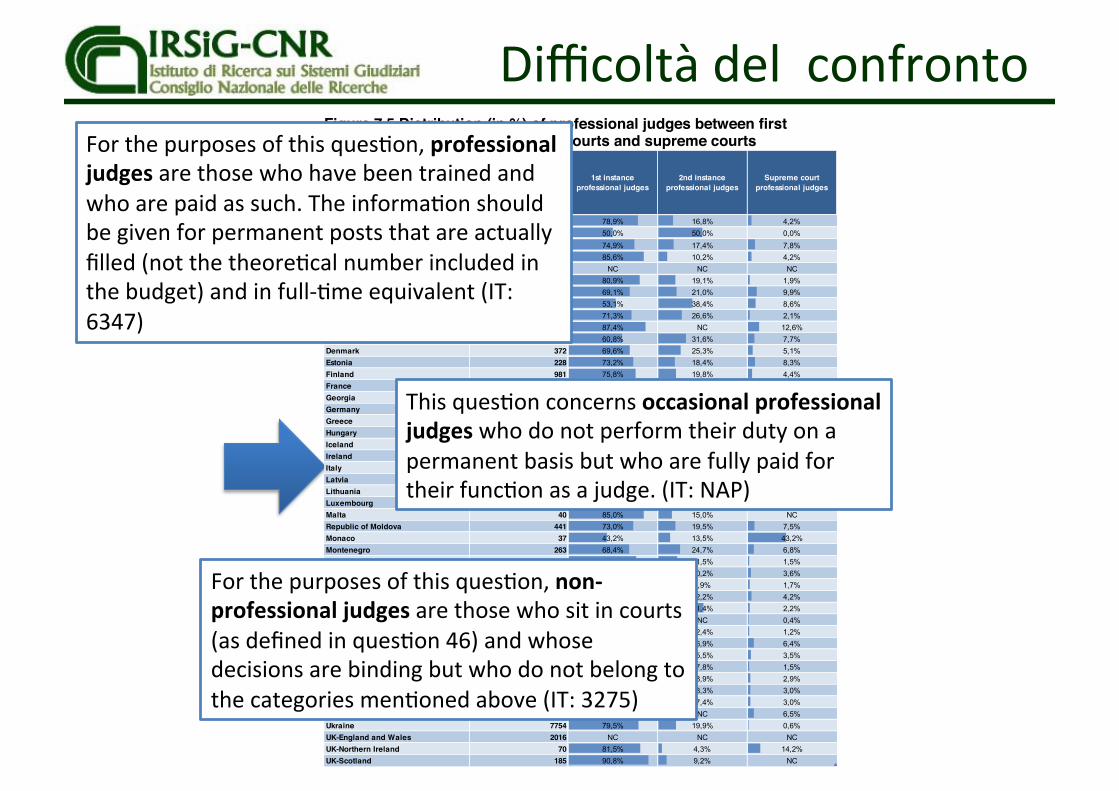
For the purposes of this ques)on, professional judges are those who have been trained and who are paid as such. The informa)on should be given for permanent posts that are actually filled (not the theore)cal number included in the budget) and in full-‐)me equivalent (IT: 6347)
This ques)on concerns occasional professional judges who do not perform their duty on a permanent basis but who are fully paid for their func)on as a judge. (IT: NAP)
For the purposes of this ques)on, non-‐professional judges are those who sit in courts (as defined in ques)on 46) and whose decisions are binding but who do not belong to the categories men)oned above (IT: 3275)
Difficoltà del confronto
2122
Difficoltà del confronto

Difficoltà del confronto
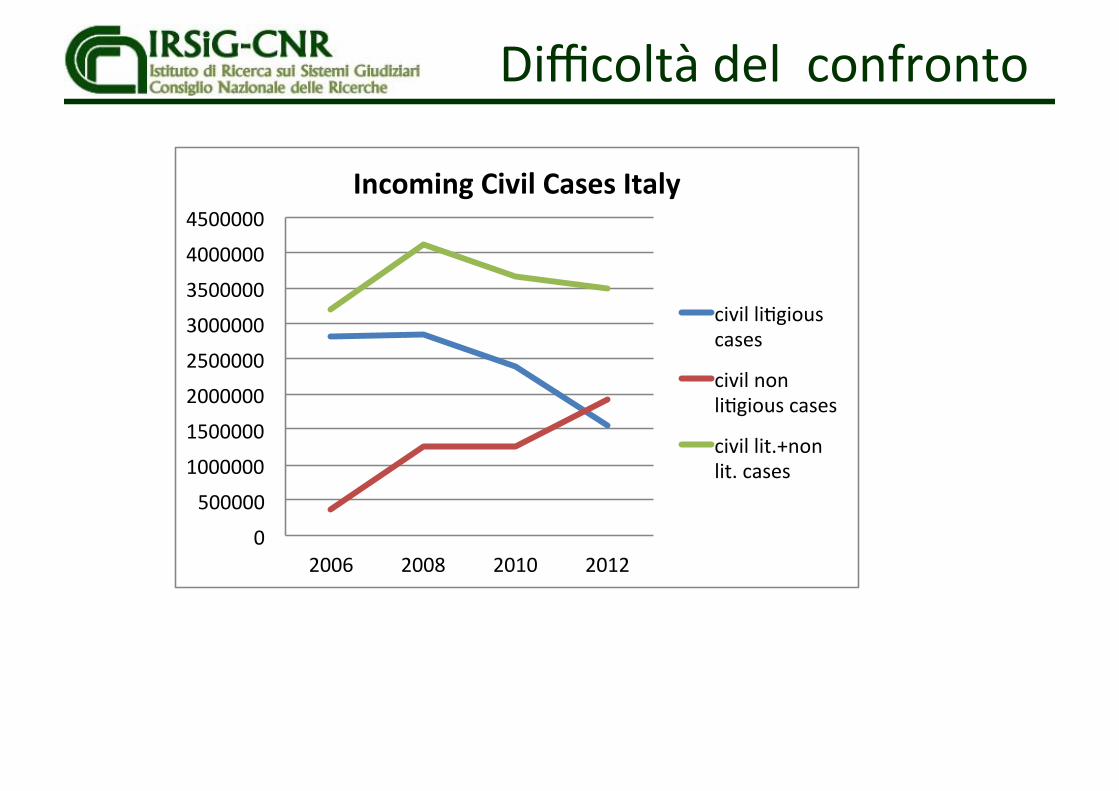
Italy: in order to be^er comply with given defini)ons a slightly different classifica)on of civil cases has been used. The result is an improved classifica)on and a be^er split between li)gious and non-‐li)gious cases. On the other hand the comparison between data of 2010 and 2012 might lead to misinterpreta)on when looking at li)gious and non-‐li)gious cases individually.
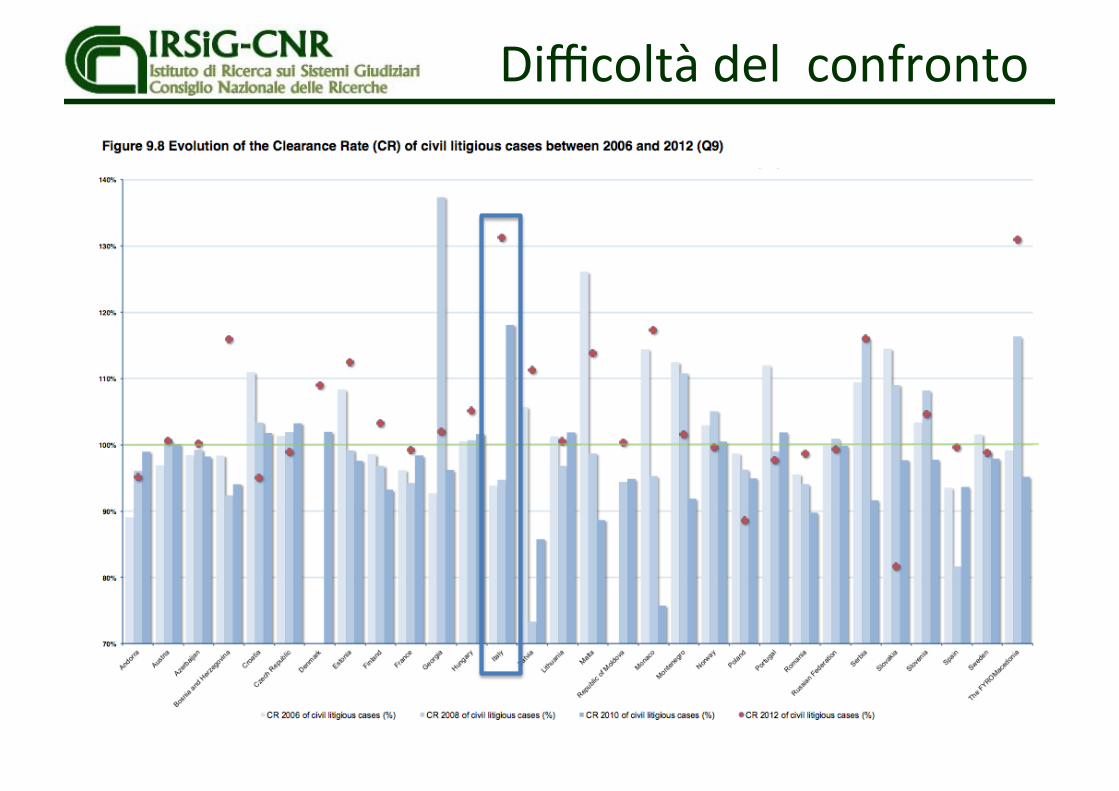
Major improvements in the Clearance Rate can be observed in par)cular in Italy, which can be explained rather by a decrease in the number of incoming cases (introduc)on of new court taxes that li)gants are required to pay to ini)ate par)cular types of proceedings) than an increase in the number of solved cases.
Difficoltà del confronto
0"
500000"
1000000"
1500000"
2000000"
2500000"
3000000"
3500000"
4000000"
4500000"
2006" 2008" 2010" 2012"
Incoming(Civil(Cases(Italy(
civil"li.gious"cases"
civil"non"li.gious"cases"
civil"lit.+non"lit."cases"

Difficoltà del confronto
“the comparison of quan)ta)ve figures from different countries revealing varied geographical, economic and legal situa)ons is a delicate job. It should be approached with great cau?on by the experts wri)ng the report and by the readers consul)ng it and, above all, by those who are interpre?ng and analysing the informa?on it contains”. Cepej 2012
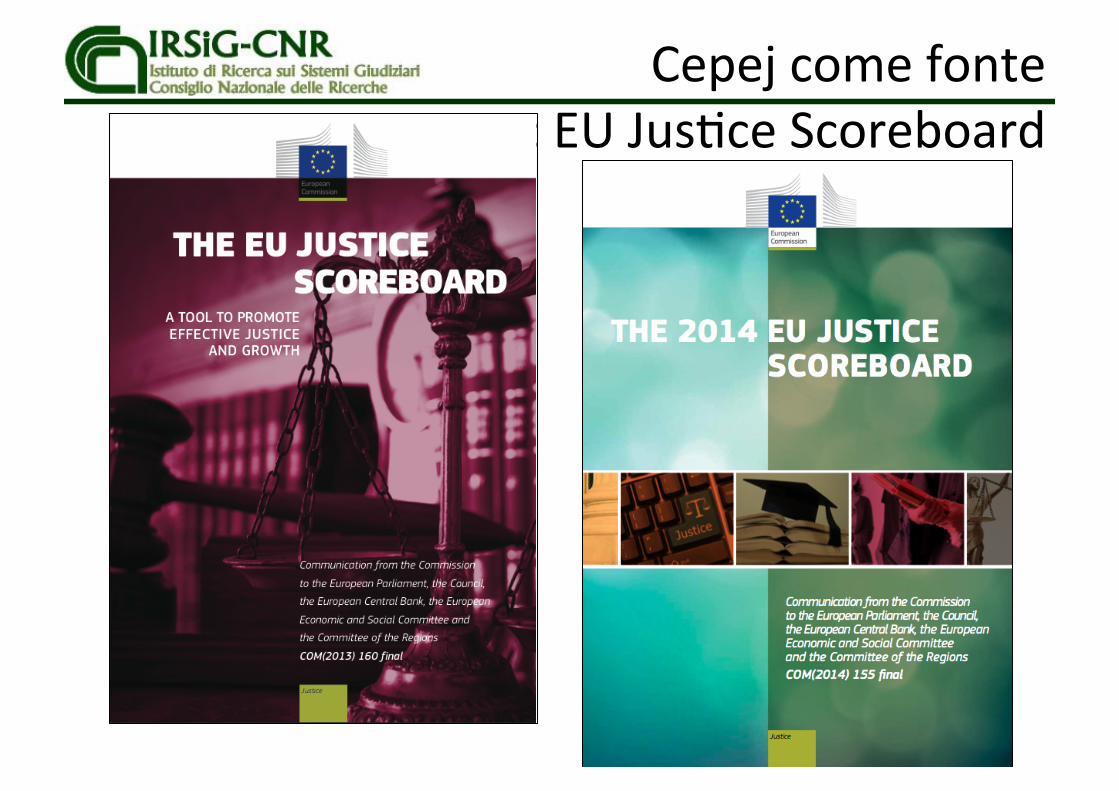
Cepej come fonte e.g.: EU Jus)ce Scoreboard
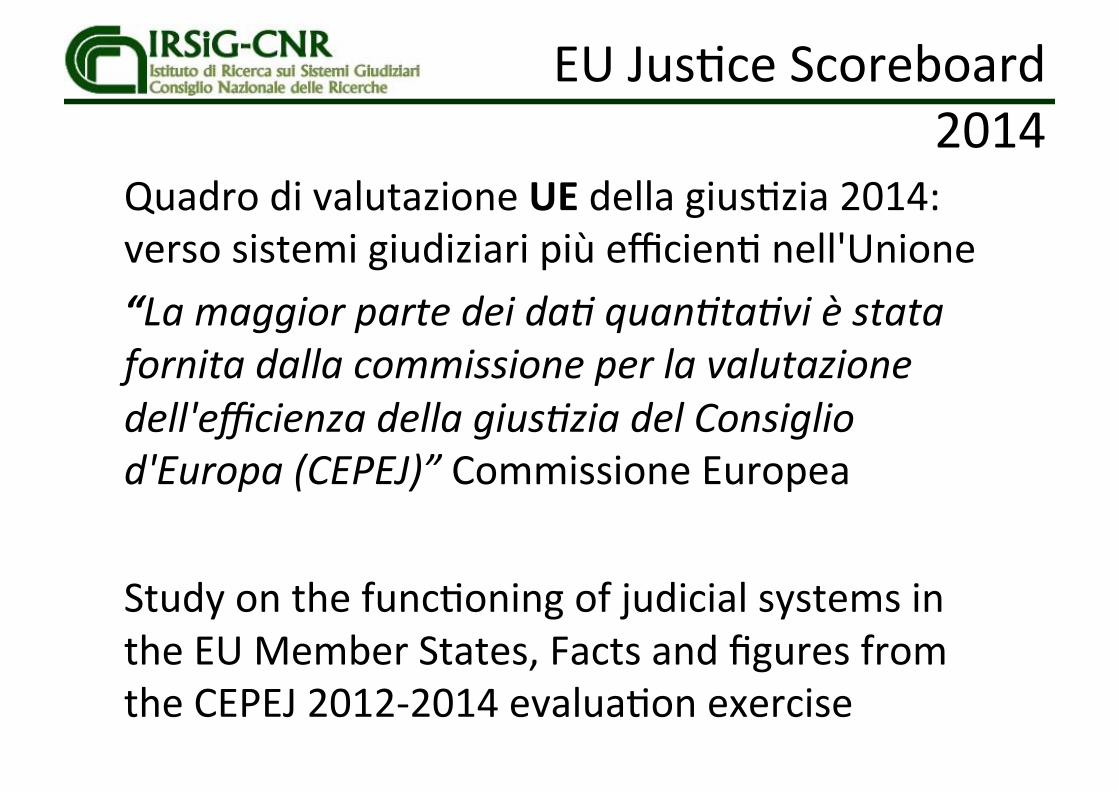
EU Jus)ce Scoreboard 2014
Quadro di valutazione UE della gius)zia 2014: verso sistemi giudiziari più efficien) nell'Unione “La maggior parte dei da7 quan7ta7vi è stata fornita dalla commissione per la valutazione dell'efficienza della gius7zia del Consiglio d'Europa (CEPEJ)” Commissione Europea Study on the func)oning of judicial systems in the EU Member States, Facts and figures from the CEPEJ 2012-‐2014 evalua)on exercise

EU Jus)ce Scoreboard 2014
The 2014 EU Justice Scoreboard 22
4.2.5 Resources
*Figure 24 indicates the annual approved budget allocated to the functioning of all courts, whatever the source and level of this budget (na-tional or regional). It does not take into account Prosecution Services (except in BE, DE, EL, ES (for 2010), FR, LU and AT) or legal aid (except in BE, ES (for 2010) and AT).39
This additional indicator on resources draws upon Eurostat’s data on government expenditure. It presents the budget actually spent, which complements the existing indicator on allocated budget for courts. The comparison is made between 2010, 2011 and 2012.
*Whereas Figure 24 indicates the annual approved budget allocated to the functioning of all courts, whatever the source and level of this budget (national or regional), Figure 25 presents general government total (actual) expenditure on courts (National Accounts Data, Classification of the Functions of Government, group 03.3). Figure 25 also includes probation systems and legal aid. 40
39 In Figure 24, the significant decrease for ES reflects the fact that data from the Autonomous Communities and from the Council for the Judiciary have not been included in 2012 data.
40 The following values are provisional: BG, EL and HU for all years, SE for 2012.
Figure 24
Budget for courts (in EUR per inhabitant)* source: CEPEJ study
Figure 25
General Government total expenditure on “law courts”* (in EUR per inhabitant) source: Eurostat

The 2014 EU Justice Scoreboard 24
Figure 28
Number of lawyers* (per 100.000 inhabitants) source: CEPEJ study
*A lawyer is a person qualified and authorised according to national law to plead and act on behalf of his or her clients, to engage in the practice of law, to appear before the courts or advise and represent his or her clients in legal matters (Recommendation Rec (2000)21 of the Committee of Ministers of the Council of Europe on the freedom of exercise of the profession of lawyer).
CONCLUSIONS on the quality of justice systems
• Monitoring and evaluation of court activities already exist in most Member States. Only a few countries have no evaluation systems in place. User surveys are conducted among court users or legal professionals in more than half of the Member States.
• Alternative dispute resolutions methods are available in nearly all Member States. Updated data on the use of such methods are not available.
• The availability of information and communication technology (ICT) tools for courts increased. They are largely available for the administration and management of courts and to a lesser extent for electronic com-munications between courts and parties. Electronic processing of small claims, undisputed debt recovery and electronic submission of claims is not possible in a significant number of Member States.
• In nearly a third of Member States the participation rate of judges in continuous training activities on EU law is above 50%. For half of the Member States the participation of judges in EU law training represents less than 20%.
• Training of judges and legal practitioners and ICT tools are crucial for the e!ective functioning of a European area of justice based on mutual trust. The findings of the Scoreboard confirm that training and ICT should be key components of the future EU Justice policy and will help to con-solidate what has been achieved during the past 15 years in this area.
EU Jus)ce Scoreboard 2014
References
• CEPEJ report evalua)ng European judicial systems -‐ 2014 edi)on (2012 data) -‐ CEPEJ Studies No. 20 • CEPEJ report evalua)ng European judicial systems -‐ 2014 edi)on (2012 data) -‐ CEPEJ Studies No. 20 • CEPEJ report evalua)ng European judicial systems -‐ Edi)on 2010 (2008 data) -‐ CEPEJ Studies No. 12 • CEPEJ report evalua)ng European judicial systems -‐ Edi)on 2008 (2006 data) -‐ CEPEJ Studies No. 11 • Velicogna, M. Study on Council of Europe Member States Appeal and Supreme Courts’ Lengths of Proceedings
Edi7on 2012 (2006-‐2010 data), CEPEJ Studies No. 17, Council of Europe, 2013, pp. 1-‐124 • Velicogna, M. Study on Council of Europe Member States Appeal and Supreme Courts’ Lengths of Proceedings,
CEPEJ Studies No. 17, Council of Europe, 2011, pp. 1-‐241 • Dubois E., Schurrer C., Velicogna M. (alphabe)cal order), The func7oning of judicial systems and the situa7on of
the economy in the European Union Member States, Strasbourg, 15 January 2013, Cepej-‐CoE Report prepared for the European Commission (Directorate General JUSTICE), pp.1-‐754
• EU Commission (2014), The 2014 EU Jus)ce scoreboard, COM(2014) 155 final • EU Commission (2013), The EU Jus)ce scoreboard, COM(2013) 160 final • Velicogna, M. The EU Jus7ce Scoreboard and the challenge of inves7ga7ng the func7oning of EU jus)ce systems
and their impact on the economy of the Member States, XXVII Convegno annuale della Società Italiana di Scienza Poli)ca (SISP), 12 -‐14 September 2013 Firenze, Italy
• Mohr, R., & Con)ni, F. (2014). Conflicts and Commonali)es in Judicial Evalua)on. Oña7 Socio-‐legal Series, 4(5). • F. Con)ni, R. Mohr and M. Velicogna, Individuals, organisa7ons and judicial evalua7on, Evalua)ng Judicial
Performance workshop, 9-‐10 May 2013 Oña), Spain. • Velicogna, M. (2014). Coming to Terms with Complexity Overload in Transborder e-‐Jus)ce: The e-‐CODEX Pla{orm.
In Con)ni, F. Lanzara, G.F. (eds.) The Circula7on of Agency in E-‐Jus7ce (pp. 309-‐330). Springer Netherlands. • Velicogna, M. et al., D7.4 Architectural Hands on Material, e-‐CODEX Deliverable, November 2014. • Con)ni, F., Mohr, R., Velicogna, M., Formula over Func7on? From Algorithms to Values in Judicial Evalua7on. Oña)
Socio-‐legal Series [online], 4 (5), 2014. • Ng, G.Y., Velicogna, M., Dallara, C. Monitoring and Evalua7on of Court System: A Compara7ve Study, CEPEJ Studies
No. 6, Council of Europe, 2008, pp. 1-‐59 • Velicogna, M., Use of Informa7on and Communica7on Technologies (ICT) in European Judicial Systems, CEPEJ
Studies No. 7, Council of Europe, 2008, pp. 1-‐64.