
Variable host-pathogen compatibility in Mycobacterium tuberculosis
Upload
independentCategory
view
1download
0
Mining large-scale response networksreveals ‘topmost activities’ inMycobacterium tuberculosis infectionAwanti Sambarey1, Karyala Prashanthi2 & Nagasuma Chandra2
1Molecular Biophysics Unit, Indian Institute of Science, Bangalore -560012, India, 2Department of Biochemistry, Indian Institute ofScience, Bangalore -560012, India.
Mycobacterium tuberculosis owes its high pathogenic potential to its ability to evade host immuneresponses and thrive inside the macrophage. The outcome of infection is largely determined by the cellularresponse comprising a multitude of molecular events. The complexity and inter-relatedness in the processesmakes it essential to adopt systems approaches to study them. In this work, we construct a comprehensivenetwork of infection-related processes in a human macrophage comprising 1888 proteins and 14,016interactions. We then compute response networks based on available gene expression profilescorresponding to states of health, disease and drug treatment. We use a novel formulation for miningresponse networks that has led to identifying highest activities in the cell. Highest activity paths providemechanistic insights into pathogenesis and response to treatment. The approach used here serves as ageneric framework for mining dynamic changes in genome-scale protein interaction networks.
M ycobacterium tuberculosis (M.tb) kills about 1.5 million people every year and has often been proclaimedas one of the most efficient pathogens known to man1. M.tb has developed strategies not merely to evadehost immune responses but in fact to reside and thrive inside host macrophages. The interactions
between the host and pathogen are indeed known to be multi-faceted, involving many feed-back, feed-forward,inhibitory and activatory control structures2. The dynamics of interactions between the host and pathogen form acomplex web and determine the outcome of an infection. A systems approach is thus essential to comprehend thesignificance of the multiple events that occur simultaneously, including moves and counter-moves of host andpathogen. The study of host-pathogen interactions has been an area of interest for many pathogens and has beenstudied through a variety of approaches3–7.
Several studies of the host transcriptome in response to M.tb and other infectious agents are increasingly beingreported in literature in recent years8–12. Gene expression studies provide lists of differentially expressed genes(DEGs) in a particular condition, but will not provide answers to why or how such an output results. In order tofurther our understanding and gain mechanistic insights into the causes and consequences of such differentialregulation, a systems approach is essential. In a nutshell, the interactions and influences among the variousmolecular components in a system ought to be captured using a suitable method of abstraction and analysed as awhole13.
Interaction networks are useful in this regard, and help understand the various connections that exist in a cell.Network modelling has been extensively used in the analysis of biological systems, where the system is mapped onto graphical structures and is a well established field in its own right14,15. Networks based on experimentally knownprotein-protein interactions (PPIs) and theoretically predicted interactions are available for several organismsincluding different human cell types16,17. These networks can provide an overview of the topological architecturein a cell. However, a drawback of this approach is that networks are static snapshots at a given instant of time andthey do not readily capture the dynamics that occur in the cell, and hence cannot by themselves explain cellularresponses to perturbations such as infections.
The insufficiencies of both approaches can be overcome by integrating genome-wide gene expression profilesinto genome scale molecular networks and constructing a specific network for each cellular condition18. Aprotein-protein interaction network by itself is analogous to a street map of a city, while the expression data isanalogous to having the types and the numbers of active vehicles in the city at a given time point. The two types ofdata are clearly complementary to each other and provide different perspectives of essentially the same system. If
OPEN
SUBJECT AREAS:SYSTEMS ANALYSIS
DYNAMIC NETWORKS
CELLULAR SIGNALLINGNETWORKS
Received10 April 2013
Accepted10 July 2013
Published29 July 2013
Correspondence andrequests for materials
should be addressed toN.C. (nchandra@
biochem.iisc.ernet.in)
SCIENTIFIC REPORTS | 3 : 2302 | DOI: 10.1038/srep02302 1

integrated together by superimposing gene expression or proteo-mic data onto topological networks, the insights they can providewill be significantly greater than what either of them can provideindividually.
Here, we seek to model the flow of information in response totuberculosis (TB) infection. Relating to the same analogy, the object-ive of this work would be comparable to looking for ‘highest vehicu-lar activities’ in a city’s roads upon a particular trigger. We applygraph theoretical methods to reconstruct weighted directed networksby integrating ‘omics’ data from tuberculosis patients available inliterature with a curated large scale model and identify ‘highest activ-ity’ paths in the cell.
ResultsWe first reconstructed an elaborate model of the macrophage uponexposure to M.tb to capture important functional processes and theirinterconnections including pathogen uptake, consequent signallingand activation of the appropriate immune response. Macrophagesare constituents of peripheral blood mononuclear cells (PBMCs),which also include dendritic cells and lymphocytes. This constructedgeneric model of the macrophage is largely applicable to PBMCs aswell. Gene expression data from clinical TB patient samples was thentaken from literature to construct specific response networks.Dynamic changes occurring upon infection and over the course oftreatment with drugs were captured and compared with appropriatehealthy controls to identify routes or paths with highest activities inthese conditions.
A general extensive molecular systems model of the macrophage.Contact of M.tb with the host occurs in the lungs, and alveolarmacrophages along with neutrophils and lung dendritic cells (DCs)are the first host cells to interact with M.tb. They secrete severalcytokines, chemokines and produce antibacterial peptides uponinfection. These initial innate immune responders subsequentlygovern the activation of T cells, components of the adaptiveimmune response. Under the influence of the cytokine IL12 andchemokines CCL19 and CCL21, M.tb infected DCs migrate to lungdraining lymph nodes and drive the differentiation of naive T cells tothe Th1 phenotype19. After approximately two weeks of initialinfection, antigen-specific Th1 cells migrate back to the lungs underchemokine influence and mount a protective response by producingIFN-c20, resulting in macrophage activation leading to augmentedcytokine and chemokine production, release of reactive oxygenintermediates (ROIs) and reactive nitrogen intermediates (RNIs), aswell as other effector molecules21–23. The T cell dependent responsecomprises CD41 and CD81 T cells which recognise antigenicpeptides on MHC class II and MHC class I molecules respectively,as well as CD1 restricted T cells that recognise glycolipids present inmycobacterial cell walls. cd T cells, an independent lymphocytepopulation, are CD31 T cells which recognise antigens indepen-dently of specific presentation molecules. Along with DCs, cd Tcells participate in the early immune response to M.tb and producepro-inflammatory cytokines such as IFN-c and TNF-a24. Thus, thecomponents of the innate immune system are key elements ininitiating and influencing the ensuing adaptive response thatmediates protective immunity against M.tb infection25.
We constructed a network model of the processes triggered in themacrophage in response to tubercular infection, based on an extens-ive literature survey. The model captures responses in the macro-phage, commencing with phagocytosis involving the uptake of M.tbor mycobacterial components mediated by different surface recep-tors on the macrophage for both opsonised and non-opsonised bac-teria. Some of the receptors include complement receptors (for e.g.CR1, CR3), mannose receptors (MR), type A scavenger receptors(e.g. SR-A1, SR-A2) and surfactant-protein A (SP-A)26. The immuneresponse put forward by the phagocyte is dictated by the receptor
involved in M.tb uptake. Uptake of M.tb by CR1 has been shown toprovide a better chance for pathogen survival than by CR3 or CR427.Mycobacterial uptake in the presence of surfactant-protein A orthrough mannose receptors renders the bacteria better poised torepress reactive nitrogen intermediates and reactive oxygen speciesrespectively, both of which are major methods of mycobacterialelimination by the macrophage27. The nature of interactions of thereceptors with M.tb is thus complex and dynamic, not only beingresponsible for uptake but also for triggering or inhibiting cellularsignalling networks that mediate processes of bacterial elimination.The molecular details of these processes are derived from severalexperiments that typically use non phagocytic cells transfected withthe receptors of interest28,29. In the real scenario, however, the uptakeby phagocytes and the downstream events depends upon a numberof aspects including ratios of receptor abundances available on thephagocyte cell surface, and their relative strengths to recognisepathogenic molecules, thus making it important to study the systemas a whole.
Different signalling mechanisms such as calcium and phosphoi-nositide signalling are activated upon binding of M.tb to the macro-phage, which regulate cytoskeleton rearrangement as well as vesiculartrafficking resulting in the formation of the phagosome30,31. The pha-gosome then acquires the early and late endosome markers, followedby fusion with the lysosome to form the phagolysosome32. Fusionwith the lysosome leads to bacterial death, and subsequent process-ing and presentation of antigens through the MHC presentationpathway23.The antigens presented are recognised by T cell receptors,co-stimulatory molecules (CD80/CD86) and adhesion molecules(intracellular adhesion molecule ICAM-1)23. T cell activation is cent-ral to the protective immunity to M.tb infection, and cytokines playan important role in driving T cell differentiation33. Interleukin-12(IL-12) stimulates the formation of Th1 cells whereas interleukin-4(IL-4) triggers the formation of Th2 cells34,35. These Th cells releasecytokines having varying effects: the Th1 related cytokines (for e.g.IFN-c, TNF-a, IL-2) are pro-inflammatory cytokines (PICs), whileTh2 related cytokines (for e.g. IL-4, IL-5, IL-10, IL-13) are generallyanti-inflammatory in nature (anti-inflammatory cytokines orAICs)33–35. Acute cytokine responses ensue upon M.tb infection ofmacrophages, triggered through phagocytic and non-phagocyticinteractions and M.tb components. As the immune response devel-ops over time, the cytokine and chemokine profiles show variation,and their activity may be beneficial or detrimental depending on theirrelative times of production36. Cytokines and chemokines may actsynergistically or antagonistically. Generally, Th1 related cytokinesmediate protective response to M.tb, while Th2 responses regulateand inhibit Th1 responses. Th2 related cytokines can also inhibit theproduction of chemokines produced by the macrophages37,38.Chemokines are major signalling molecules responsible for the pro-gress of inflammation, regulating lymphocyte infiltration and stimu-lating trans-endothelial migration of T lymphocytes39. The interplaybetween PICs, AICs, chemokines and regulatory cytokines is thussignificant in governing the outcome of disease.
Many mycobacterial components trigger or inhibit the host res-ponse towards elimination of M.tb, enabling bacterial survival.Mycobacterial cell wall components Lipoarabinomannan (LAM),Mannosylated LAMs (ManLAM), Phosphatidylinositol Mannoside(PIM) and Trehalose 6,69-dimycolate (TDM) are the major modu-lators of phagosome maturation and other signalling pathways40–42.ManLAM prevents fusion of mycobacterial phagosome with the lateendosome and lysosome by inhibiting the Calmodulin-Ca21 phos-photidol-inositol-3 kinase43. PIM promotes the interaction andfusion of mycobacterial phagosome with early endosome, so as todeliver nutrients to mycobacterial phagosome and maintain the non-acidic pH44. TDM also inhibits phospholipid vesicle fusion45.ManLAM activates host p38MAPK and PPAR signalling pathwaysthat activate prostaglandin E2 (PGE2), bringing about inhibition of
www.nature.com/scientificreports
SCIENTIFIC REPORTS | 3 : 2302 | DOI: 10.1038/srep02302 2
Th1 response, ROI, NF-kB, and activation of Th2 response leading tothe formation of alternatively activated macrophages46. LAM acti-vates TLR2/1 and brings about the expression of PICs via the tran-scription factor NF-kB42. LAM is also known to activate ERK1/2MAPK pathway thereby leading to activation of ROI and RNI42.TLR activated NF-kB mediates synthesis of WNT5A which interactswith FZD5, regulating the microbial-induced IL-12 production in aparacrine manner, thereby activating T cells that are primed specif-ically for IFN-gamma release47,48. M.tb also regulates host antigenpresentation49.
The immune response to M.tb is complex and involves varioushost and bacterial factors, as well as multiple signalling pathways andheavy cross-talk between them. While the model presented heredescribes the general processes triggered in response to M.tb infec-tion, it is still an oversimplified depiction of the components andtheir complex interactions in the macrophage. Nevertheless, themodel captures the essence of biological processes important forhost-pathogen interactions and presents a framework to study itfrom a systems perspective. The model is amenable to expansionand inclusion of transcriptomic data as it becomes available.
Figure 1 (a) provides a schematic representation of the modelcomprising the biological processes or modules triggered in responseto M.tb infection as described, and these host-pathogen interactionscollectively dictate the consequences of infection. The model consti-tutes 1888 proteins from 32 modules that capture the different cel-lular signalling processes described above. The distribution ofproteins in the 32 modules is shown in Figure 1 (b). We then deriveda network of interactions of these proteins based on experimentalevidence from literature and several protein-protein interactiondatabases. Directionality was assigned to the edges wherever applic-able based on known experimental information. The final curatednetwork comprises 1888 nodes (proteins) and 14016 edges (protein-protein interactions). Of these, 11,283 edges were assigned direction,while the remaining 2733 interactions were kept as bidirectional(The final list of interactions along with information of their sourcesand direction are given in the supplementary table S1).
Topological network analysis indicated that the network wasscale-free, allowing the identification of highly connected ‘hub’nodes50. The edge-betweenness, an important measure of centralityfor edges in the network was computed and considered for furtheranalysis (Network properties are given in Supplementary table S3).
Response networks indicate differential enrichment of modules.Recent genome-wide transcriptional studies have contributed to ourcurrent understanding of tuberculosis-specific responses in the host.To this end, a study by Berry et al. (2010)8 reported significantdifferences in gene expression values of several genes across diffe-rent conditions of disease and treatment. The authors identified asignature of 86 differentially expressed genes unique to tuberculosisinfection. More importantly, a clustering analysis of the profiles wasable to group healthy samples separately from the disease samples,while also illustrating that the expression profile of the 12 monthdrug treated samples was closer to that of healthy controls than activedisease. It is thus clear that the observed gene expression changes arespecific and characteristic of the condition. Microarray analysishowever, is insufficient in providing explanations for the cause orconsequence of differential expression in the identified gene set.
To overcome this limitation, gene expression changes reported byBerry et al. (2010) for 6 different conditions were integrated into thedirected network to generate response networks. These were con-structed first by incorporating gene expression levels for each con-dition as node weights, followed by computation of edge weights as afunction of both the node weight of connected nodes and the cor-responding edge betweenness. We define six weighted response net-works, each incorporating gene expression data from (a) monocytesfrom healthy controls (HC_M), (b) monocytes from pulmonary
tuberculosis patients (PTB_M) (c) whole blood from healthy con-trols (HC_B) and whole blood from tuberculosis patients monitoredthrough drug treatment over (d) 0 months (PTB_0), (e) 2 months(PTB_2) and (f) 12 months (PTB_12).
Advances in microarray technology and standardisation proce-dures have made it feasible to compare signal intensities across con-ditions of similar samples for a given platform and chip51. Hence forthis study, the normalised signal intensity for each gene, togetherwith its comparative fold change were considered as opposed to foldchange alone, in order to capture relative expression levels of differ-ent genes in a given condition, as well as their extent of changebetween conditions. Constitutively expressed genes that do not varysignificantly in different conditions are also automatically capturedwith this scheme. The edge weight is thus representative of bothexpression values and network topology. In our scoring scheme, alow edge weight corresponds to high expression levels of both nodescontributing to the edge, as well as high edge centrality, therebyindicating a higher functional importance of the edge. (Node andedge weights for the response networks have been provided in sup-plementary tables S2 and S1 respectively.)
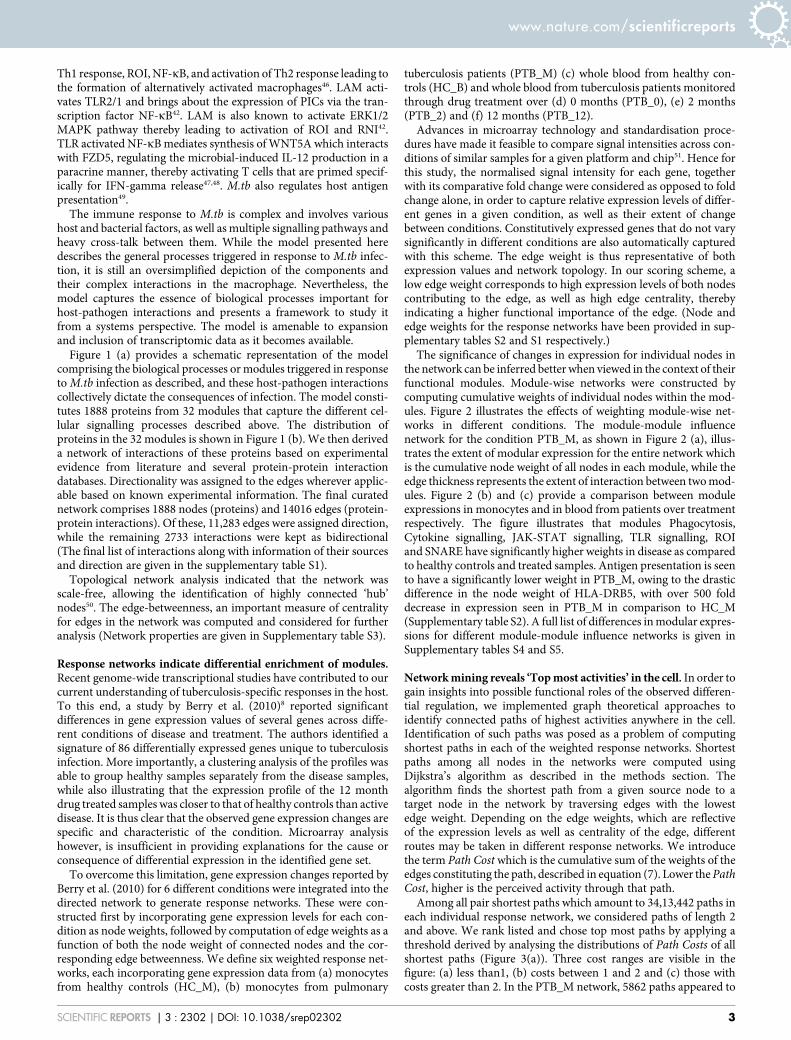
The significance of changes in expression for individual nodes inthe network can be inferred better when viewed in the context of theirfunctional modules. Module-wise networks were constructed bycomputing cumulative weights of individual nodes within the mod-ules. Figure 2 illustrates the effects of weighting module-wise net-works in different conditions. The module-module influencenetwork for the condition PTB_M, as shown in Figure 2 (a), illus-trates the extent of modular expression for the entire network whichis the cumulative node weight of all nodes in each module, while theedge thickness represents the extent of interaction between two mod-ules. Figure 2 (b) and (c) provide a comparison between moduleexpressions in monocytes and in blood from patients over treatmentrespectively. The figure illustrates that modules Phagocytosis,Cytokine signalling, JAK-STAT signalling, TLR signalling, ROIand SNARE have significantly higher weights in disease as comparedto healthy controls and treated samples. Antigen presentation is seento have a significantly lower weight in PTB_M, owing to the drasticdifference in the node weight of HLA-DRB5, with over 500 folddecrease in expression seen in PTB_M in comparison to HC_M(Supplementary table S2). A full list of differences in modular expres-sions for different module-module influence networks is given inSupplementary tables S4 and S5.
Network mining reveals ‘Top most activities’ in the cell. In order togain insights into possible functional roles of the observed differen-tial regulation, we implemented graph theoretical approaches toidentify connected paths of highest activities anywhere in the cell.Identification of such paths was posed as a problem of computingshortest paths in each of the weighted response networks. Shortestpaths among all nodes in the networks were computed usingDijkstra’s algorithm as described in the methods section. Thealgorithm finds the shortest path from a given source node to atarget node in the network by traversing edges with the lowestedge weight. Depending on the edge weights, which are reflectiveof the expression levels as well as centrality of the edge, differentroutes may be taken in different response networks. We introducethe term Path Cost which is the cumulative sum of the weights of theedges constituting the path, described in equation (7). Lower the PathCost, higher is the perceived activity through that path.
Among all pair shortest paths which amount to 34,13,442 paths ineach individual response network, we considered paths of length 2and above. We rank listed and chose top most paths by applying athreshold derived by analysing the distributions of Path Costs of allshortest paths (Figure 3(a)). Three cost ranges are visible in thefigure: (a) less than1, (b) costs between 1 and 2 and (c) those withcosts greater than 2. In the PTB_M network, 5862 paths appeared to
www.nature.com/scientificreports
SCIENTIFIC REPORTS | 3 : 2302 | DOI: 10.1038/srep02302 3

be of least cost (,1), amounting to 0.17% of all shortest paths in thenetwork, and are tagged as highest activity paths hereafter. Thosewith Path Costs between 1 and 2 made up a further 0.87% and reflectreasonably high activity paths, while those .2 are considered to berelatively lower activity paths. Thus, the thresholds were chosenbased on the observed distribution but are still to an extent arbitrary,erring on the side of caution so as to ensure that the selected paths areof highest activity, while possibly allowing some high activity paths
but with higher Path Costs to be missed out. High activity paths for allconditions are provided in Supplementary tables S6–S11.
Module representations in the highest activity paths. In order toobserve module-wise activities in the highest activity paths, percen-tage distribution of nodes belonging to different modules in pathsbelow a cost of 1 was calculated. Figure 4 shows the percentagerepresentation of modules in all paths below 1 for different
Figure 1 | Modelling the macrophage response in tuberculosis. (a) A molecular map describing responses triggered in the macrophage upon M.tb
infection. A single macrophage is reflected in green, and elicits both intracellular (outlined in green) and extracellular (outlined in purple) responses upon
encountering either complete mycobacteria or mycobacterial lipids and other components (highlighted in orange). Red arrows represent inhibitory
influences, while black arrows indicate activation. (b) Distribution of 1888 proteins in 32 biological modules participating in the cellular response
described in (a). Here, the module Cytokine shows highest representation of proteins while VEGF signalling has the least representation, in terms of
number of proteins involved in that process.
www.nature.com/scientificreports
SCIENTIFIC REPORTS | 3 : 2302 | DOI: 10.1038/srep02302 4
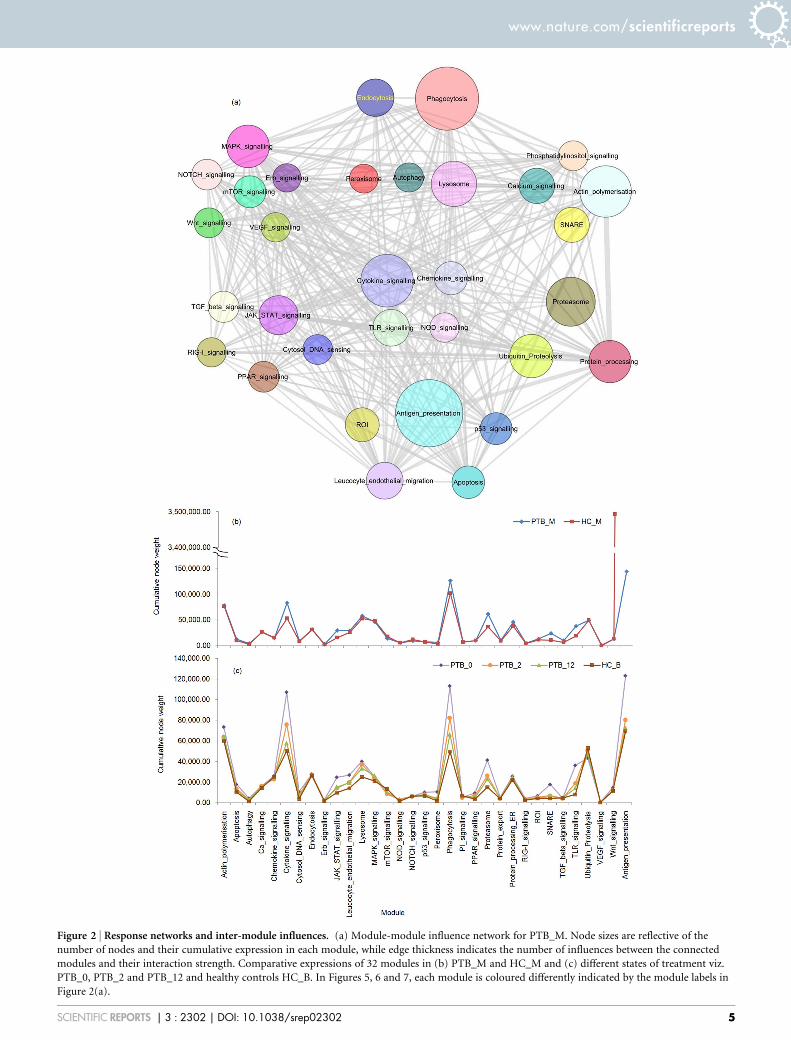
Figure 2 | Response networks and inter-module influences. (a) Module-module influence network for PTB_M. Node sizes are reflective of the
number of nodes and their cumulative expression in each module, while edge thickness indicates the number of influences between the connected
modules and their interaction strength. Comparative expressions of 32 modules in (b) PTB_M and HC_M and (c) different states of treatment viz.
PTB_0, PTB_2 and PTB_12 and healthy controls HC_B. In Figures 5, 6 and 7, each module is coloured differently indicated by the module labels in
Figure 2(a).
www.nature.com/scientificreports
SCIENTIFIC REPORTS | 3 : 2302 | DOI: 10.1038/srep02302 5
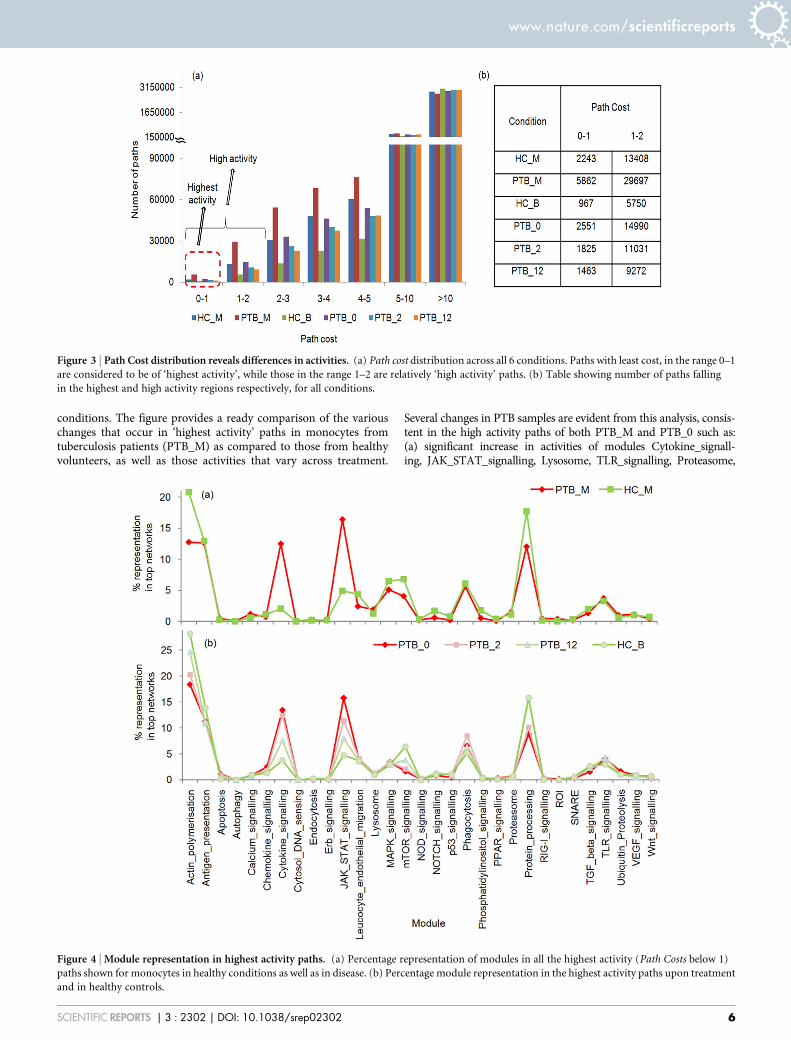
conditions. The figure provides a ready comparison of the variouschanges that occur in ‘highest activity’ paths in monocytes fromtuberculosis patients (PTB_M) as compared to those from healthyvolunteers, as well as those activities that vary across treatment.
Several changes in PTB samples are evident from this analysis, consis-tent in the high activity paths of both PTB_M and PTB_0 such as:(a) significant increase in activities of modules Cytokine_signall-ing, JAK_STAT_signalling, Lysosome, TLR_signalling, Proteasome,
Figure 3 | Path Cost distribution reveals differences in activities. (a) Path cost distribution across all 6 conditions. Paths with least cost, in the range 0–1
are considered to be of ‘highest activity’, while those in the range 1–2 are relatively ‘high activity’ paths. (b) Table showing number of paths falling
in the highest and high activity regions respectively, for all conditions.
Figure 4 | Module representation in highest activity paths. (a) Percentage representation of modules in all the highest activity (Path Costs below 1)
paths shown for monocytes in healthy conditions as well as in disease. (b) Percentage module representation in the highest activity paths upon treatment
and in healthy controls.
www.nature.com/scientificreports
SCIENTIFIC REPORTS | 3 : 2302 | DOI: 10.1038/srep02302 6

Ubiquitin_Proteolysis, RIG-I_signalling, VEGF_signalling, Cytosol_DNA_sensing and Apoptosis (b) consistent decrease in Actin_polymerisation, Antigen_presentation, Erb_signalling, MAPK_sig-nalling, mTOR_signalling, SNARE, p53_signalling and Protein_pro-cessing. In PTB_M alone, we see an increased representation of themodules Endocytosis, Calcium_signalling, ROI and Autophagy ascompared to their healthy counterparts, while in PTB_0 we see ahigher representation of Chemokine_signalling, NOD_signallingand PPAR_signalling, with their activities decreasing over treatment.PPAR signalling has been shown to be exploited by M.tb to enablesurvival and lead to active disease46. Some modules such asWnt_signalling do not show much variation in disease and healthyconditions. Module representations in the top paths thus substantiallyconcur with known response profiles. Several modules are seen torevert their activities upon treatment , similar to the activities seenin HC_B top paths, such as JAK_STAT signalling, Cytokine signalling,mTOR signalling and Actin polymerisation (Figure 4b), indicative of adisease specific response which highlights the most regulatedbiological modules in tuberculosis infection.
Comparison of these module activities with their node weights inFigure 2(b) indicates that high module expression alone does notnecessarily correlate with increased modular activity in the top paths,as can be seen in the resulting decrease in SNARE activity in thePTB_M and PTB_0 top paths, despite having a higher modular nodeweight in both, highlighting the importance of a network perspectivein interpreting large-scale expression data.
Broadly, all of these observations from the response networks areconsistent with knowledge from literature based on a vast number ofindividual experimental studies25 and can thus be rationalised.Module-wise analysis provides an overview of the processes occur-ring within the cell while the actual paths provide insights into whichspecific molecular events could be occurring.
Top paths themselves form connected networks. A network wasconstructed using only the highest activity paths for PTB_M. 325nodes and 501 edges from 5862 paths were seen to comprise thePTB_M high activity network, shown in Figure 5(a) while 268nodes and 381 edges from 2243 paths constituted the highestactivity network in HC_M (Figure 5(b)). A small fraction of thepaths (23.1%) remain common to both PTB_M and HC_Mhighest activity networks, and a sub-network of paths uniquelypresent in the PTB_M top network was constructed, representingpaths that are specifically activated in PTB_M. Figure 5(c) shows thesub-network of highest activity paths unique to PTB_M, constituting208 nodes and 286 edges.
It is intriguing to observe that the highest activity paths form wellconnected networks by themselves. It must be noted that only 11% ofnodes from the complete network are involved in the uniquely activenetwork for PTB_M. Yet they remain well connected, implying asmooth flow of information through these paths. The connectednessprovides a basis to understand the purpose (or consequence) of up-regulation of a given node and how the perceived increase in activityis transmitted to its neighbouring nodes forming a highly active path.The PTB_M top path network is denser than the HC_M top pathnetwork, indicating an increased upsurge in activity in disease, andleads to the identification of participating nodes in these active paths.It is also readily apparent from these networks that the overall extentof activity is significantly higher in PTB than in a healthy state.
Fold change in gene expression is insufficient to convey extent ofparticipation in a path. On comparison of the HC_M and PTB_Mhighest activity networks, 97 nodes were seen to be unique to thePTB_M highest activity network, while 40 nodes were unique to theHC_M top network. Interestingly, 228 nodes were seen to becommonly occurring in both PTB_M and HC_M top networks.Nodes occurring uniquely in the PTB_M top network showed arange of variation in gene expression as compared to their healthy
counterparts. Of the 97 unique nodes, 62 nodes were up-regulated(Fold change . 2) in PTB_M with high signal intensities, while theremaining 35 nodes did not show significant variation in geneexpression between HC_M and PTB_M. Since the node weightshave been derived by considering normalised signal intensities inaddition to fold change values, they are able to reflect approximateabundances of individual proteins. We must of course note that geneexpression values cannot directly be translated into proteinconcentrations, but for lack of any more comprehensive quanti-tative data for studies of this scale at present, we assume that theseexpression values are reflective of protein activity in the cells.
Upon a thorough examination, it becomes apparent that the foldchange values do not by themselves reflect extent of functionmediated by that node. While the appearance of highly up-regulatednodes in the top-activity networks can be justified, the top networksof both HC_M and PTB_M see nodes that are constitutivelyexpressed in these conditions. In fact, 228 nodes are common to boththese networks, which may seem surprising at first and would havebeen missed out completely by considering only the fold changevalues. However, it becomes clear that these nodes, many of thembeing constitutively expressed genes, form high activity bridgesbetween up-regulated nodes forming top scoring paths. Thus, con-sidering DEGs alone would not be sufficient to get a network per-spective of activities in a cell (the complete list of nodes in the topnetworks for PTB_M and HC_M, along with their weights is given inSupplementary tables S12–S14).
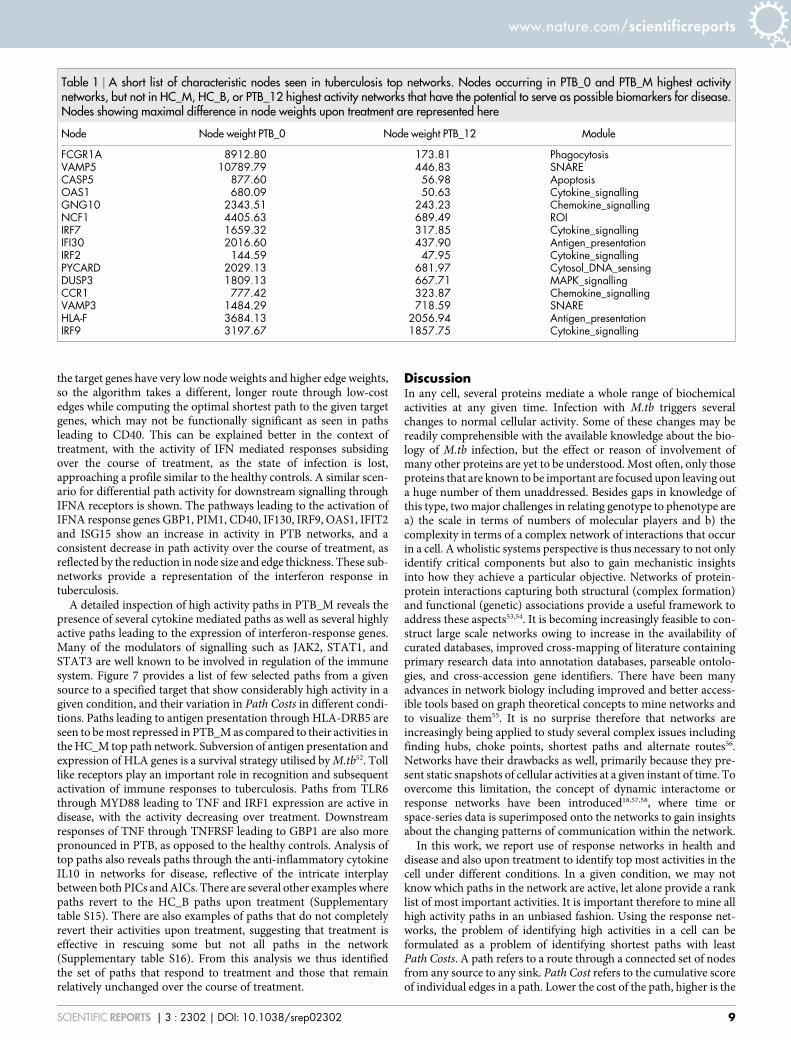
Nodes occurring consistently in tuberculosis networks. In order toidentify nodes appearing consistently in networks for disease, weinspected the top-path networks over treatment. Two conditionswere considered – a) Nodes that occur in the PTB_0 top pathnetwork and also occur uniquely in the PTB_M highest activitynetwork, but not in the HC_M, HC_B or PTB_12 highest activitynetworks. b) Of the nodes shortlisted in a), those that show maximaldifference in their node weights in between PTB_0 and PTB_12 wereidentified, suggesting that these nodes respond to treatment. Byconsidering the top path network for both PTB_M and PTB_0, weextracted those nodes in the host that are significant, consistent andspecific contributors to the host’s tuberculosis response. Table 1provides a list of these nodes showing significant differences innode weights upon treatment, along with the correspondingmodule that the node belongs to. Thus, a testable hypothesis isobtained from this study in the form of a shortlist to be exploredas possible markers of active tuberculosis.
Network re-rerouting upon treatment- ‘Part Reversal’ to non-infected state. One benefit of analyzing response networks in theform of active modules is that it enables monitoring the modularactivity upon treatment. Networks corresponding to response totreatment at 0, 2 and 12 months are constructed by incorporatingappropriate node weights obtained from gene expression profiles ofthe clinical samples as reported by Berry et al. (2010). Significantdifferences are indeed seen in the path activity profiles in treatmentrelated response networks PTB_0, PTB_2 and PTB_12. Overall, weobserve that module profiles and paths that occur in the PTB_12networks are more similar to those in healthy controls (HC_B)(Figure 4(b)). Many paths that were seen to emerge in PTB_0 dueto low Path Costs have reversed back to high costs upon treatment,especially with PTB_12.
Some examples of nodes in such paths along with their immediateneighbourhoods in different conditions are illustrated as sub-net-works in Figure 6. Figure 6 shows an example sub-network for theactivation of IFN-c target genes PIM1, CD40 and GBP1 by IFN-creceptors (1 and 2). IFNc-R2 appears to be more active than IFNc-R1in both PTB_M and PTB_0 and activates the target genes through theJAK-STAT signalling pathway. However, in the correspondinghealthy controls, as there is no infection the IFN-c receptors and
www.nature.com/scientificreports
SCIENTIFIC REPORTS | 3 : 2302 | DOI: 10.1038/srep02302 7
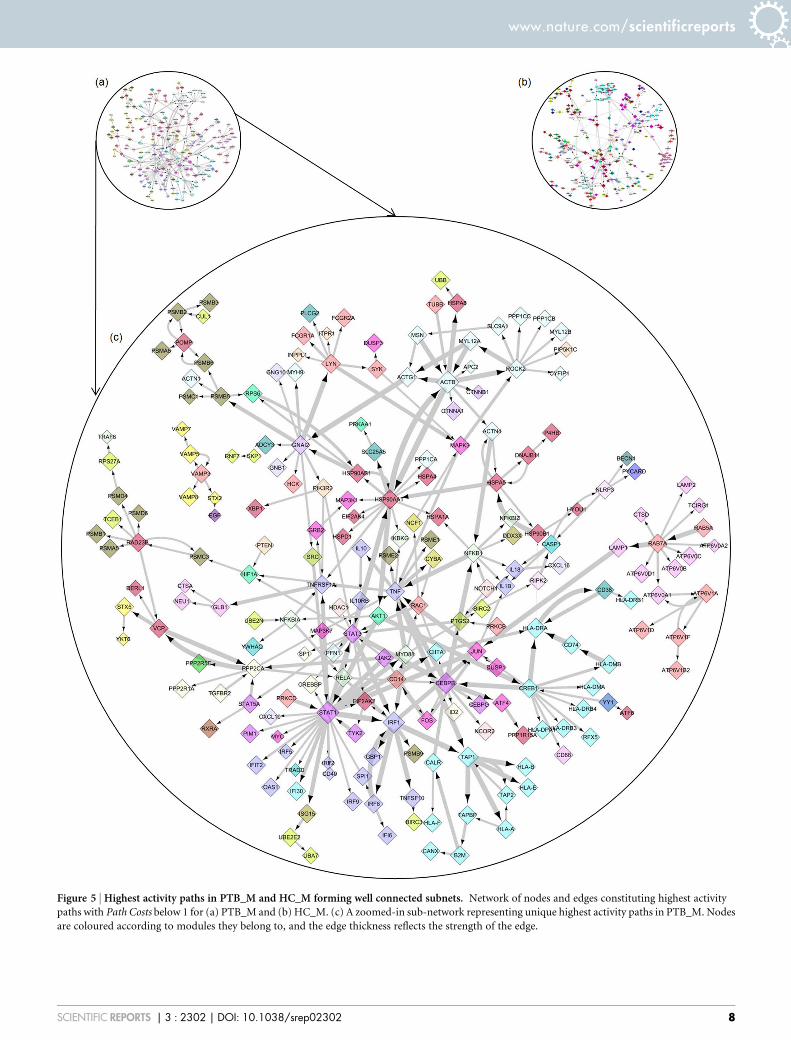
Figure 5 | Highest activity paths in PTB_M and HC_M forming well connected subnets. Network of nodes and edges constituting highest activity
paths with Path Costs below 1 for (a) PTB_M and (b) HC_M. (c) A zoomed-in sub-network representing unique highest activity paths in PTB_M. Nodes
are coloured according to modules they belong to, and the edge thickness reflects the strength of the edge.
www.nature.com/scientificreports
SCIENTIFIC REPORTS | 3 : 2302 | DOI: 10.1038/srep02302 8
the target genes have very low node weights and higher edge weights,so the algorithm takes a different, longer route through low-costedges while computing the optimal shortest path to the given targetgenes, which may not be functionally significant as seen in pathsleading to CD40. This can be explained better in the context oftreatment, with the activity of IFN mediated responses subsidingover the course of treatment, as the state of infection is lost,approaching a profile similar to the healthy controls. A similar scen-ario for differential path activity for downstream signalling throughIFNA receptors is shown. The pathways leading to the activation ofIFNA response genes GBP1, PIM1, CD40, IF130, IRF9, OAS1, IFIT2and ISG15 show an increase in activity in PTB networks, and aconsistent decrease in path activity over the course of treatment, asreflected by the reduction in node size and edge thickness. These sub-networks provide a representation of the interferon response intuberculosis.
A detailed inspection of high activity paths in PTB_M reveals thepresence of several cytokine mediated paths as well as several highlyactive paths leading to the expression of interferon-response genes.Many of the modulators of signalling such as JAK2, STAT1, andSTAT3 are well known to be involved in regulation of the immunesystem. Figure 7 provides a list of few selected paths from a givensource to a specified target that show considerably high activity in agiven condition, and their variation in Path Costs in different condi-tions. Paths leading to antigen presentation through HLA-DRB5 areseen to be most repressed in PTB_M as compared to their activities inthe HC_M top path network. Subversion of antigen presentation andexpression of HLA genes is a survival strategy utilised by M.tb52. Tolllike receptors play an important role in recognition and subsequentactivation of immune responses to tuberculosis. Paths from TLR6through MYD88 leading to TNF and IRF1 expression are active indisease, with the activity decreasing over treatment. Downstreamresponses of TNF through TNFRSF leading to GBP1 are also morepronounced in PTB, as opposed to the healthy controls. Analysis oftop paths also reveals paths through the anti-inflammatory cytokineIL10 in networks for disease, reflective of the intricate interplaybetween both PICs and AICs. There are several other examples wherepaths revert to the HC_B paths upon treatment (Supplementarytable S15). There are also examples of paths that do not completelyrevert their activities upon treatment, suggesting that treatment iseffective in rescuing some but not all paths in the network(Supplementary table S16). From this analysis we thus identifiedthe set of paths that respond to treatment and those that remainrelatively unchanged over the course of treatment.
DiscussionIn any cell, several proteins mediate a whole range of biochemicalactivities at any given time. Infection with M.tb triggers severalchanges to normal cellular activity. Some of these changes may bereadily comprehensible with the available knowledge about the bio-logy of M.tb infection, but the effect or reason of involvement ofmany other proteins are yet to be understood. Most often, only thoseproteins that are known to be important are focused upon leaving outa huge number of them unaddressed. Besides gaps in knowledge ofthis type, two major challenges in relating genotype to phenotype area) the scale in terms of numbers of molecular players and b) thecomplexity in terms of a complex network of interactions that occurin a cell. A wholistic systems perspective is thus necessary to not onlyidentify critical components but also to gain mechanistic insightsinto how they achieve a particular objective. Networks of protein-protein interactions capturing both structural (complex formation)and functional (genetic) associations provide a useful framework toaddress these aspects53,54. It is becoming increasingly feasible to con-struct large scale networks owing to increase in the availability ofcurated databases, improved cross-mapping of literature containingprimary research data into annotation databases, parseable ontolo-gies, and cross-accession gene identifiers. There have been manyadvances in network biology including improved and better access-ible tools based on graph theoretical concepts to mine networks andto visualize them55. It is no surprise therefore that networks areincreasingly being applied to study several complex issues includingfinding hubs, choke points, shortest paths and alternate routes56.Networks have their drawbacks as well, primarily because they pre-sent static snapshots of cellular activities at a given instant of time. Toovercome this limitation, the concept of dynamic interactome orresponse networks have been introduced18,57,58, where time orspace-series data is superimposed onto the networks to gain insightsabout the changing patterns of communication within the network.
In this work, we report use of response networks in health anddisease and also upon treatment to identify top most activities in thecell under different conditions. In a given condition, we may notknow which paths in the network are active, let alone provide a ranklist of most important activities. It is important therefore to mine allhigh activity paths in an unbiased fashion. Using the response net-works, the problem of identifying high activities in a cell can beformulated as a problem of identifying shortest paths with leastPath Costs. A path refers to a route through a connected set of nodesfrom any source to any sink. Path Cost refers to the cumulative scoreof individual edges in a path. Lower the cost of the path, higher is the
Table 1 | A short list of characteristic nodes seen in tuberculosis top networks. Nodes occurring in PTB_0 and PTB_M highest activitynetworks, but not in HC_M, HC_B, or PTB_12 highest activity networks that have the potential to serve as possible biomarkers for disease.Nodes showing maximal difference in node weights upon treatment are represented here
Node Node weight PTB_0 Node weight PTB_12 Module
FCGR1A 8912.80 173.81 PhagocytosisVAMP5 10789.79 446.83 SNARECASP5 877.60 56.98 ApoptosisOAS1 680.09 50.63 Cytokine_signallingGNG10 2343.51 243.23 Chemokine_signallingNCF1 4405.63 689.49 ROIIRF7 1659.32 317.85 Cytokine_signallingIFI30 2016.60 437.90 Antigen_presentationIRF2 144.59 47.95 Cytokine_signallingPYCARD 2029.13 681.97 Cytosol_DNA_sensingDUSP3 1809.13 667.71 MAPK_signallingCCR1 777.42 323.87 Chemokine_signallingVAMP3 1484.29 718.59 SNAREHLA-F 3684.13 2056.94 Antigen_presentationIRF9 3197.67 1857.75 Cytokine_signalling
www.nature.com/scientificreports
SCIENTIFIC REPORTS | 3 : 2302 | DOI: 10.1038/srep02302 9

Figure 6 | Illustrative example of interferon sub-networks showing alterations in different conditions. Sub-networks are shown depicting paths from
Interferon gamma receptors and Interferon alpha receptors to downstream target genes in different conditions. Node sizes correspond to node weights,
while edge thickness reflects the interaction strength of the edge in a given condition. Nodes are coloured according to the modules they belong to.
www.nature.com/scientificreports
SCIENTIFIC REPORTS | 3 : 2302 | DOI: 10.1038/srep02302 10
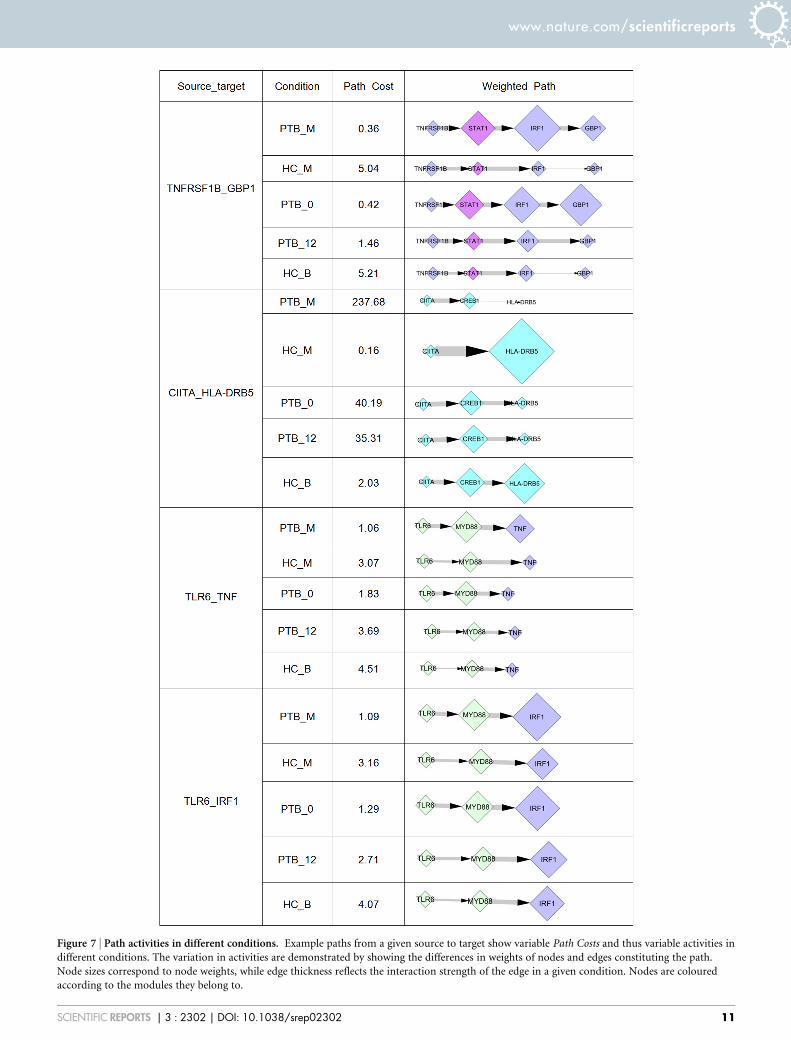
Figure 7 | Path activities in different conditions. Example paths from a given source to target show variable Path Costs and thus variable activities in
different conditions. The variation in activities are demonstrated by showing the differences in weights of nodes and edges constituting the path.
Node sizes correspond to node weights, while edge thickness reflects the interaction strength of the edge in a given condition. Nodes are coloured
according to the modules they belong to.
www.nature.com/scientificreports
SCIENTIFIC REPORTS | 3 : 2302 | DOI: 10.1038/srep02302 11
activity expected through it. This formulation enables identificationof all possible paths of highest activities, anywhere in the cell. Highactivity paths are those with least Path Costs which implies suffi-ciently high levels of gene expression in that condition in all nodesof the path and also implicitly implies that the corresponding edgesin the path are topologically centrally located. Hence the highestactivity paths identified through this method can be expected to besignificant routes through which intracellular communication cantake place.
Often for studies of this nature, a limiting factor is utilisation ofexperimental data available in literature for the individual nodes in acomprehensive manner and reconstruction of a network. We haveaddressed that by first building a large curated network that capturesknown biology of the individual nodes in terms of their structuraland function interactions with other proteins and includes directionof such interactions as well as the activatory or the inhibitory natureof the interactions. While care has been taken to include as much dataas presently accessible, it is inevitable that the network remainsincomplete due to lack of data for all nodes and all interactions.However, the network model presented here allows incorporationand refinement as new data becomes available.
Gene expression profiles through microarrays and recently alsothrough NextGen sequencing provide lists of differentially regulatedgenes. Several reports presenting DEG profiles in tuberculosispatients exist in literature, leading to insights into the molecularmap of the pathophysiology of tuberculosis. Many DEGs are con-sistently identified from individual studies leading to a general pic-ture of what changes occur in response to tuberculosis. Examples ofthe identified profiles include (a) activation of cytokine signallingincluding both pro-inflammatory and anti-inflammatory cytokines(b) increased signalling through the Janus kinase signal transducerand activator of transcription (JAK-STAT) pathway (c) increasedsignalling through the Fc-gamma receptors and (d) Decrease in anti-gen presentation indicating subversion. The network analysisreported here identifies many of these DEGs to be present in thetop most activity paths in the network, and more importantly alsoprovides insights into the functional routes through which they canmediate their altered function. We note that over-expression of anode by itself is not a sufficient criterion for dictating ‘HighActivity’ through a given path because for an activity to take place,the entire path must have a low Path Cost. Focusing on DEGs alonewould miss out this aspect all together. Among our top activity paths,we find some nodes which are constitutively expressed in sufficientlevels, but whose fold change may be close to 1, for example IL10 andIL18 are seen in high activity paths. IL10 and IL18 are both known toplay critical roles in regulating the manifestation of tuberculosis59,60.We also observe some highly expressed DEGs such as AIM2, OSM,VAMP5 which do not have high scoring neighbours and hence donot feature in the top most paths. Placing them in a network per-spective helps to understand their function in terms of their neigh-bourhoods. Analogous to finding highways in a complex trafficnetwork, this approach finds top paths which are connected sets ofnodes of sufficient weights (extent of expression) and high centrality.
Validation becomes an important step in any model buildingexercise. Since the network is built primarily using experimental databased on molecular level studies of individual proteins and weightedusing experimentally derived gene expression profiles, validation willmainly amount to checking for consistency with well known bio-logical phenomena. This is in addition to the model building valid-ation steps that are routinely carried out involving data accessionchecks and cross-mapping across databases. Towards validationtherefore, the following were analysed (a) known nodes appearingin the top paths, (b) checking that no inhibitory connections appearin the top paths (edges with inhibitory connections have nodes thatare anti-correlated in their weights), (c) well known activated pathshave sufficiently low Path Costs and known repressed paths have
high costs and (d) path reversals upon treatment are seen in thetreatment related response networks. All these criteria are met forthe top paths that are analysed (Figures 6 and 7).
There are a large number of new insights that are gained from thisstudy including identification of connected routes for well knownnodes thus rationalising data from individual experiments. Thus, byintegrating expression data and network topology, a comprehensivemodel of the host response to tuberculosis is presented. Mining thenetwork identifies highest activities in the cell and interestingly iden-tifies that such top paths all form a well connected subnet. Nodes inthis network that differ substantially with respect to healthy controland in response to treatment have the potential to serve as possiblebiomarkers for tuberculosis and can be explored further for theirdiagnostic potential. The approach followed is sufficiently genericthat it can be applied to other systems fairly easily, thus representinga general framework for integrating and rationalising genome-scaleand clinical data.
MethodsThe methodology comprises model building, network reconstruction, microarraydata extraction and integration into the network to generate response networks,followed by a weighted shortest path analysis from all nodes to all other nodes in thenetwork and computation of Path Costs.
Model reconstruction. In the first step towards generating a response network inmacrophages, a model was built encompassing different processes that are activated ininfection as well as those responsible for cellular signalling. The model was manuallyassembled after a thorough literature survey on the biology of the macrophage intuberculosis. The model schematic was drawn using Microsoft Visio. Modules wereidentified through literature describing host cellular signalling events in tuberculosis,as well as from pathway information sources KEGG61 and PATHWAYCOMMONS62.Once the signalling modules were identified, all proteins that participate in or belongto that module were enlisted using their ENTREZ identifiers.
Protein-protein interaction network. For all proteins identified in the model,corresponding interactions were extracted and a comprehensive protein-proteininteraction network was constructed. Only interactions with experimental evidenceand supporting literature were considered. The interactions were extracted fromvarious sources including KEGG, STRING63, NETPATH64, Signalink65 and from themacrophage interaction map curated by Raza and co-workers66. Through literaturesurvey and network repositories such as BioGRAPH67 and GeneMania68, directionswere assigned for several interactions by considering functional annotations such as‘phosphorylation’, ‘ubiquitinylation’, ‘proteolysis’ and ‘activation’ as well as‘inhibition’. However, for certain interactions which describe a ‘binding’ event, theedge is represented as bidirectional. Interactions with experimental evidence butwithout functional annotation were also considered as bidirectional interactions.Ambiguous and predicted interactions were not considered.
Network Analysis. The network was subjected to network analysis using Cytoscapeversion 2.8.269. Topological network properties were computed on the directed andunweighted network, using the NetworkAnalyzer70 plugin. Shortest pathsdistribution was also computed between all vertices in the network. Edge centralityattributes, namely Edge Betweenness was calculated. Betweenness is a measure ofcentrality, which captures the number of times the edge is traversed among allshortest paths from the set of source nodes to the set of sink nodes71. For a graphG(V,E), the edge betweenness is defined as follows:
CB eð Þ~X
s=n=t[E
sst eð Þsst
ð1Þ
Where sst is the number of shortest paths from s to t, and sst(e) is the number ofshortest paths from s to t that pass through an edge e. The edge betweenness of eachedge was computed using the Cytoscape plugin NetworkAnalyzer, where thebetweenness is normalized by dividing by (M 2 1)(M 2 2), where M is the number ofedges in the connected component that the edge belongs to.
Microarray data integration. For this study, microarray expression data was takenfrom NCBI GEO ID GSE19491. The study was carried out by Berry et al.(2010)8,where genome-wide whole blood transcriptional profiles were extracted frompatients with active tuberculosis and monitored under drug treatment for 0, 2 and 12months (5 samples each), as well as healthy controls (12 samples). Neutrophils,monocytes and CD41 and CD81 T cells were isolated. For this study, the monocyteexpression data was considered for patients with active TB(7 samples) and healthycontrols (4 samples).
Normalisation. The raw expression data was normalised per gene, as it was pre-normalised per-chip. The expression data for the genes of interest was filtered out.The average fold change of expression under conditions of infection in both whole
www.nature.com/scientificreports
SCIENTIFIC REPORTS | 3 : 2302 | DOI: 10.1038/srep02302 12
blood and isolated monocytes was computed with respect to the median value of thecorresponding healthy controls. The fold change for a gene i in condition A withrespect to its expression value in condition B was computed as described:
FCi(A=B)~SignalIntensityi(A)
SignalIntensityi(B)ð2Þ
Where SignalIntensityi(A) represents the normalised signal intensity for the conditionA and SignalIntensityi(B) represents the normalised signal intensity for the conditionB.
Node weight. For all nodes in the network, the node weight was calculated as theproduct of the average fold change and the normalised signal intensity value for thecorresponding node. This captures the quantitative information regarding expressionlevel of the node in the cell.
The node weight Ni(A) of node i in a given condition A, is computed as:
Ni(A)~FCi(A=B) � SignalIntensityi(A) ð3Þ
Edge weight. The edge weights for every edge between two nodes were calculated bytaking into account both the node weights, and the betweenness of the given edge. Theedge weight was computed as the inverse of the product of edge betweenness and thesquare root of the product of node weights. The edge weight in a given condition foran edge e (We (A)) comprised of nodes Ni(A) and Nj(A) is computed by the formula:
We(A)~1
½CB(e) �ffiffiffiffiffiffiffiffiffiffiffiffiffiffiffiffiffiffiffiffiffiffiffiffiffi(Ni(A) � Nj(A)
p)�
ð4Þ
Where, Ni(A) and Nj(A) are the node weights of i and j nodes respectively in conditionA. The edge weights were scaled up by 106, for convenience.
Module-module influence networks. Proteins were assigned into 32 modules basedon their presence in a given KEGG Pathway. Modular node weights Nx(A) for eachmodule X were calculated as a cumulative sum of node weights of individual nodes(Ni) in the module.
NX(A)~X
Nix(A) ð5Þ
Edge weight for an edge between module X and module Y in a condition wascalculated as
WXY(A)~X 1
WeXY(A)ð6Þ
where, WeXY(A) represents the edge weight We for an edge that captures an interactionbetween nodes belonging to module X and Y.
Shortest path computation. Shortest paths between all the proteins in the weightedand directed network were computed using Dijkstra’s algorithm implemented inMATLAB-Boost Graph Library (http://www.stanford.edu/,dgleich/programs/matlab_bgl). The algorithm computes minimum weight shortest paths, in which eachpath begins from a source node and ends with a sink node, through interactingproteins, choosing the least-cost edge in every step. For a path of length n, the PathCost was computed by taking the summation of the edge weights (We(A) ) of all edgesconstituting the path.
PathCost~Xn
e~1
We(A) ð7Þ
All paths were ranked according to their Path Cost, with the least costing paths rankedhighest.
1. WHO Report No. WHO/HTM/TB/2012.6 (2012).2. Casadevall, A. & Pirofski, L-a. Host-Pathogen Interactions: The Attributes of
Virulence. J. Infect Dis. 184, 337–344 (2001).3. Mukherjee, S., Sambarey, A., Prashanthi, K. & Chandra, N. Current trends in
modeling host–pathogen interactions. Wiley Interdiscip Rev Data Min KnowlDiscov. 3, 109–128 (2013).
4. Kaufmann, S. H. & Walker, B. Host–pathogen interactions. Curr Opin Immunol.19, 371–373 (2006).
5. Kirschner, D. E. & Linderman, J. J. Mathematical and computational approachescan complement experimental studies of host-pathogen interactions. CellMicrobiol. 11, 531–539 (2009).
6. Raman, K., Bhat, A. G. & Chandra, N. A systems perspective of host-pathogeninteractions. predicting disease outcome in tuberculosis. Mol Biosyst. 6, 516–530(2010).
7. Mandal, S., Sarkar, R. R. & Sinha, S. Mathematical models of malaria-a review.Malar J. 10, 202 (2011).
8. Berry, M. P. R. et al. An interferon-inducible neutrophil-driven bloodtranscriptional signature in human tuberculosis. Nature. 466, 973–977 (2010).
9. Kumar, D. et al. Genome-wide Analysis of the Host Intracellular Network thatRegulates Survival of Mycobacterium tuberculosis. Cell. 140, 731–743 (2010).
10. Pommerenke, C. et al. Global Transcriptome Analysis in Influenza-InfectedMouse Lungs Reveals the Kinetics of Innate and Adaptive Host ImmuneResponses. PLoS ONE. 7, e41169 (2012).
11. Nunez-Hernandez, C. et al. Genome Expression Analysis of NonproliferatingIntracellular Salmonella enterica Serovar Typhimurium Unravels an Acid pH-Dependent PhoP-PhoQ Response Essential for Dormancy. Infect Immun. 81,154–165 (2012).
12. Nascimento, E. J. M. et al. Gene Expression Profiling during Early Acute FebrileStage of Dengue Infection Can Predict the Disease Outcome. PLoS ONE. 4, e7892(2009).
13. Forst, C. V. Host-pathogen systems biology. Drug Discov Today. 11, 220–227(2006).
14. Barabasi, A-L. & Oltvai, Z. N. Network biology: understanding the cell’s functionalorganization. Nat Rev Genet. 5, 101–113 (2004).
15. Papin, J. A., Hunter, T., Palsson, B. O. & Subramaniam, S. Reconstruction ofcellular signalling networks and analysis of their properties. Nat Rev Mol Cell Biol.6, 99–111 (2005).
16. Shoemaker, B. A. & Panchenko, A. R. Deciphering Protein-Protein Interactions.Part I. Experimental Techniques and Databases. PLoS Comput Biol. 3, e42 (2007).
17. Shoemaker, B. A. & Panchenko, A. R. Deciphering Protein-Protein Interactions.Part II. Computational Methods to Predict Protein and Domain InteractionPartners. PLoS Comput Biol. 3, e43 (2007).
18. Ideker, T., Ozier, O., Schwikowski, B. & Siegel, A. F. Discovering regulatory andsignalling circuits in molecular interaction networks. Bioinformatics. 18,S233–S240 (2002).
19. Steinman, R. M. Decisions about dendritic cells: past, present, and future. AnnuRev Immunol 30, 1–22 (2012).
20. Urdahl, K. B., Shafiani, S. & Ernst, J. D. Initiation and regulation of T-cellresponses in tuberculosis. Mucosal Immunol 4, 288–93 (2011).
21. Andersen, P. Host responses and antigens involved in protective immunity toMycobacterium tuberculosis. Scand J Immunol. 45, 115–131 (1997).
22. Raja, A. Immunology of tuberculosis. Indian J Med Res. 120, 213–232 (2004).23. Kindt, T. J., Goldsby, R. A., Osborne, B. A. & Kuby, J. Kuby Immunology: Sixth
Edition (2006).24. Meraviglia, S. et al. cd T Cells Cross-Link Innate and Adaptive Immunity in
Mycobacterium tuberculosis Infection. Clin Dev Immunol. 2011 (2011).25. O’Garra, A. et al. The Immune Response in Tuberculosis. Annu Rev Immunol. 31,
475–527 (2013).26. Ernst, J. D. Macrophage Receptors for Mycobacterium tuberculosis. Infect
Immun. 66, 1277–1281 (1998).27. van Crevel, R., Ottenhoff, T. H. M. & van der Meer, J. W. M. Innate Immunity to
Mycobacterium tuberculosis. Clin Microbiol Rev. 15, 294–309 (2002).28. Indik, Z., Kelly, C., Chien, P., Levinson, A. I. & Schreiberm, A. D. Human Fc
gamma RII, in the absence of other Fc gamma receptors, mediates a phagocyticsignal. J. Clin. Invest. 88, 1766–1771 (1991).
29. Tuijnman, W. B., Capel, P. J. & van de Winkel, J. G. Human low-affinity IgGreceptor Fc gamma RIIa (CD32) introduced into mouse fibroblasts mediatesphagocytosis of sensitized erythrocytes. Blood. 79, 1651–1656 (1992).
30. Stenmark, H., Botelhom, R. J., Scott, C. C. & Grinstein, S. PhosphoinositideInvolvement in Phagocytosis and Phagosome Maturation. Curr Top MicrobiolImmunol. 282, 1–30 (2004).
31. Nunes,P. & Demaurex, N. The role of calcium signaling in phagocytosis. J LeukocBiol. 88, 57–68 (2010).
32. Rohde, K., Yates, R. M., Purdy, G. E. & Russell, D. G. Mycobacterium tuberculosisand the environment within the phagosome. Immunol Rev. 219, 37–54 (2007).
33. Reiner, S. L. Helper T cell differentiation, inside and out. Curr Opin Immunol. 13,351–355 (2001).
34. Yamane, H. & Paul, W. E. Cytokines of the gamma(c) family control CD41 T celldifferentiation and function. Nat Immunol. 13, 1037–1044 (2012).
35. Li, Z., Zhang, Y. & Sun, B. Current understanding of Th2 cell differentiation andfunction. Protein Cell. 2, 604–611 (2011).
36. Cooper, A. M. & Khader, S. A. The role of cytokines in the initiation, expansion,and control of cellular immunity to tuberculosis. Immunol Rev. 226, 191–204(2008).
37. Kidd, P. Th1/Th2 balance: the hypothesis, its limitations, and implications forhealth and disease. Altern Med Rev. 8, 223–246 (2003).
38. Schluger, N. W. & Rom, W. N. The host immune response to tuberculosis. Am JRespir Crit Care Med. 157, 679–691 (1998).
39. Ding, Z., Xiong, K. & Issekutz, T. B. Chemokines stimulate human T lymphocytetransendothelial migration to utilize VLA-4 in addition to LFA-1. J Leukoc Biol.69, 458–466 (2001).
40. Astarie-Dequeker, C., Nigou, J., Puzo, G. & Maridonneau-Parini, I.Lipoarabinomannans activate the protein tyrosine kinase Hck in humanneutrophils. Infect Immun. 68, 4827–4830 (2000).
41. Tapping, R. I. & Tobias, P. S. Mycobacterial lipoarabinomannan mediates physicalinteractions between TLR1 and TLR2 to induce signaling. J. Endotoxin Res. 9,264–268 (2003).
42. Quesniaux, V. J. et al. Toll-Like Receptor 2 (TLR2)-Dependent-Positive andTLR2-Independent-Negative Regulation of Proinflammatory Cytokines byMycobacterial Lipomannans. J. Immunol. 172, 4425–4434 (2004).
43. Fratti, R. A., Chua, J., Vergnem,I. & Deretic, V. Mycobacterium tuberculosisglycosylated phosphatidylinositol causes phagosome maturation arrest. PNAS.100, 5437–5442 (2003).
www.nature.com/scientificreports
SCIENTIFIC REPORTS | 3 : 2302 | DOI: 10.1038/srep02302 13
44. Vergne, I. et al. Mycobacterium tuberculosis Phagosome Maturation Arrest:Mycobacterial Phosphatidylinositol Analog Phosphatidylinositol MannosideStimulates Early Endosomal Fusion. Mol Biol Cell. 15, 751–760 (2004).
45. Spargo, B. J., Crowe, L. M., Ioneda, T., Beaman, B. L. & Crowe, J. H. Cord factor(alpha, alpha-trehalose 6,69-dimycolate) inhibits fusion between phospholipidvesicles. PNAS. 88, 737–740 (1991).
46. Rajaram, M. V. S. et al. Mycobacterium tuberculosis activates human macrophageperoxisome proliferator-activated receptor gamma linking mannose receptorrecognition to regulation of immune responses. J. Immunol. 185, 929–942 (2010).
47. Blumenthal, A. et al. The Wingless homolog WNT5A and its receptor Frizzled-5regulate inflammatory responses of human mononuclear cells induced bymicrobial stimulation. Blood. 108, 965–973 (2006).
48. Pereira, C., Schaer, D. J., Bachlim, E. B., Kurrer, M. O. & Schoedon, G. Wnt5A/CaMKII Signaling Contributes to the Inflammatory Response of Macrophagesand Is a Target for the Antiinflammatory Action of Activated Protein C andInterleukin-10. Arterioscler Thromb Vasc Biol. 28, 504–510 (2008).
49. Harding, C. V. & Boom, W. H. Regulation of antigen presentation byMycobacterium tuberculosis: a role for Toll-like receptors. Nat Rev Microbiol. 8,296–307 (2010).
50. Zhu, X., Gerstein, M. & Snyder, M. Getting connected: analysis and principles ofbiological networks. Genes Dev. 21, 1010–1024 (2007).
51. Bossers, K. et al. Intensity-based analysis of dual-color gene expression data as analternative to ratio-based analysis to enhance reproducibility. BMC Genomics. 11,112 (2010).
52. Baena, A. & Porcelli, S. A. Evasion and subversion of antigen presentation byMycobacterium tuberculosis. Tissue Antigens. 74, 189–204 (2009).
53. De Las Rivas, J. & Fontanillo, C. Protein-protein interaction networks: unravelingthe wiring of molecular machines within the cell. Brief Funct Genomics. 11,489–496 (2012).
54. Ma, X. & Gao, L. Biological network analysis: insights into structure and functions.Brief Funct Genomics. 11, 434–442 (2012).
55. Lahti, L., Knuuttila, J. E. A. & Kaski, S. Global modeling of transcriptionalresponses in interaction networks. Bioinformatics. 26, 2713–2720 (2010).
56. Jordan, F., Nguyen, T-P. & Liu, W-c. Studying protein-protein interactionnetworks: a systems view on diseases. Brief Funct Genomics. 11, 497–504 (2012).
57. Ideker, T. & Sharan, R. Protein networks in disease. Genome Res. 18, 644–652(2008).
58. Davis, M. J., Shin, C. J., Jing, N. & Ragan, M. A. Rewiring the dynamic interactome.Mol Biosyst. 8, 2054–2066 (2012).
59. Redford, P. S., Murray, P. J. & O’Garra, A. The role of IL-10 in immune regulationduring M. tuberculosis infection. Mucosal Immunol. 4, 261–270 (2011).
60. Schneider, B. E. et al. A role for IL-18 in protective immunity againstMycobacterium tuberculosis. Eur J Immunol. 40, 396–405 (2010).
61. Kanehisa, M., Goto, S., Sato, Y., Furumichi, M. & Tanabe, M. KEGG forintegration and interpretation of large-scale molecular data sets. Nucleic AcidsRes. 40, D109–114 (2012).
62. Cerami, E. G. et al. Pathway Commons, a web resource for biological pathwaydata. Nucleic Acids Res. 39, D685–690 (2010).
63. Szklarczyk, D. et al. The STRING database in 2011: functional interactionnetworks of proteins, globally integrated and scored. Nucleic Acids Res. 39,D561–568 (2011).
64. Kandasamy, K. et al. NetPath: a public resource of curated signal transductionpathways. Genome Biol. 11, R3 (2010).
65. Korcsmaros, T. et al. Uniformly curated signaling pathways reveal tissue-specificcross-talks and support drug target discovery. Bioinformatics. 26, 2042–2050(2010).
66. Raza,S. et al. Construction of a large scale integrated map of macrophage pathogenrecognition and effector systems. BMC Syst. Biol. 4, 63 (2010).
67. Liekens, A. et al. BioGraph: Unsupervised biomedical knowledge discovery viaautomated hypothesis generation. Genome Biol. 12, R57 (2011).
68. Warde-Farley, D. et al. The GeneMANIA prediction server: biological networkintegration for gene prioritization and predicting gene function. Nucleic Acids Res.38, W214–220 (2010).
69. Smoot, M. E., Ono, K., Ruscheinski, J., Wang, P. L. & Ideker, T. Cytoscape 2.8: newfeatures for data integration and network visualization. Bioinformatics. 27,431–432 (2010).
70. Assenov,Y., Ramirez, F., Schelhorn, S. E., Lengauer, T. & Albrecht, M. Computingtopological parameters of biological networks. Bioinformatics. 24, 282–284(2008).
71. Linton, C. F. A Set of Measures of Centrality Based on Betweenness. Sociometry.40, 35–41 (1977).
AcknowledgementsWe thank the Department of Biotechnology (DBT) and the Mathematical BiologyProgramme supported by the Department of Science and Technology (DST), Governmentof India, for financial support. The use of facilities at Department of Biochemistry, IndianInstitute of Science is also gratefully acknowledged.
Author contributionsBoth A.S. and K.P. contributed equally to the manuscript. A.S. and K.P. constructed themodel and carried out the network analysis. N.S.C. conceptualised and closely supervisedthe project. All three authors read, wrote and approved of the manuscript.
Additional informationSupplementary information accompanies this paper at http://www.nature.com/scientificreports
Competing financial interests: The authors declare no competing financial interests.
How to cite this article: Sambarey, A., Prashanthi, K. & Chandra, N. Mining large-scaleresponse networks reveals ‘topmost activities’ in Mycobacterium tuberculosis infection. Sci.Rep. 3, 2302; DOI:10.1038/srep02302 (2013).
This work is licensed under a Creative Commons Attribution-NonCommercial-ShareAlike 3.0 Unported license. To view a copy of this license,
visit http://creativecommons.org/licenses/by-nc-sa/3.0
www.nature.com/scientificreports
SCIENTIFIC REPORTS | 3 : 2302 | DOI: 10.1038/srep02302 14
Copyright © 2022 FDOKUMEN