Miniaturised eight-channel impedance spectroscopy unit as sensor platform for biosensor applications
7
Miniaturised eight-channel impedance spectroscopy unit as sensor platform for biosensor applications Jeroen Broeders * ,1,2 , Stijn Duchateau 2 , Bart Van Grinsven 1 , Wouter Vanaken 2 , Marloes Peeters 1 , Thomas Cleij 2 , Ronald Thoelen 2 , Patrick Wagner 1,3 , and Ward De Ceuninck ** ,1,3 1 Institute for Materials Research, Hasselt University, Wetenschapspark 1, 3590 Diepenbeek, Belgium 2 Xios University College, Agoralaan Gebouw H, 3590 Diepenbeek, Belgium 3 IMEC, Devision IMOMEC, Wetenschapspark 1, 3590 Diepenbeek, Belgium Received 29 October 2010, revised 27 January 2011, accepted 2 February 2011 Published online 9 May 2011 Keywords biosensors, electrochemical analysis, impedance spectroscopy, molecular imprinting * Corresponding author: e-mail [email protected], Phone: þ32-011-26-88-35, Fax: þ32-011-26-88-99 ** e-mail [email protected] A miniaturised, low cost impedance analyser is developed to ease the use of impedance spectroscopy in biological setups. This could form the first step towards fully standalone, hand- held biosensor applications. The system is capable of perform- ing quasi-simultaneous time resolved impedance measure- ments on eight different channels in a frequency range of 10 Hz–100 kHz. The unit is accurate in a broad impedance range and is able to perform stable measurements over intervals of several days. The system is characterised by passive components, a temperature controlled wet cell based impe- dance setup and a biomimetic molecularly imprinted polymer (MIP) based histamine sensor. The test results all indicate accurate and stable functioning of the unit, making it suitable for bioanalytical applications. ß 2011 WILEY-VCH Verlag GmbH & Co. KGaA, Weinheim 1 Introduction Impedance spectroscopy can be used as a readout technique for a wide variety of sensors. The technique has already been used with success for monitoring DNA hybridisation and detection of single nucleotide polymorphisms [1], nicotine and histamine recognition by means of molecularly imprinted polymers (MIPs) [2–4] and the detection of immunoreactions [5–7]. Furthermore, impedance spectroscopy is used as a reference for other biosensor readout techniques [8–10]. This measurement is usually performed by bulky, expensive equipment. To ease the readout of biosensors, a first step towards a miniaturised and low cost impedance spectroscopy unit was already developed based on the Analogue Devices AD5933 chip [11]. The main advantage of this chip was that complex measurement circuitry that is present in conventional equipment is now integrated in a single chip, resulting in a much smaller unit. The integration of the measurement circuitry in a chip also decreases noise caused by signal paths between separate electronic components. This device was capable of performing impedance measurements in a range of 10 V–2 MV in a frequency spectrum of 100 Hz–100 kHz [12]. Although the unit is capable of performing stable measurements on biosensors, it had some limitations in usable ranges, accuracy and ease-of-use. These problems have now been overcome in the new system. The setup is downscaled to a hand-held device and is being interfaced by USB to a computer, which also provides power for the system. This eliminates the need for any external power supply. The frequency bandwidth has been increased from 10 Hz to 100 kHz, with sub-Hertz resolution. The measurable impedance ranges from 10 V to 5MV. Figure 1 shows this newly developed device, with a 1 Euro coin placed on top for size reference. One can clearly distinguish the 16 subminiature coax SMB connectors on top, which are used for connection to samples, and the USB- and peripheral port on the side of the device. The applicability of the developed system, both in electronic lab setup as well as under biological research conditions was investigated. 2 Experimental 2.1 Measurement setup As can be seen in Fig. 2, the unit has an on-board I 2 C-bus which controls all measurement- and peripheral circuitry. This bus is interfaced Phys. Status Solidi A 208, No. 6, 1357–1363 (2011) / DOI 10.1002/pssa.201001199 pss applications and materials science a status solidi www.pss-a.com physica ß 2011 WILEY-VCH Verlag GmbH & Co. KGaA, Weinheim
Transcript of Miniaturised eight-channel impedance spectroscopy unit as sensor platform for biosensor applications

Phys. Status Solidi A 208, No. 6, 1357–1363 (2011) / DOI 10.1002/pssa.201001199 p s sa
statu
s
soli
di
www.pss-a.comph
ysi
ca
applications and materials science
Miniaturised eight-channel
impedance spectroscopy unit as sensor platformfor biosensor applicationsJeroen Broeders*,1,2, Stijn Duchateau2, Bart Van Grinsven1, Wouter Vanaken2, Marloes Peeters1,Thomas Cleij2, Ronald Thoelen2, Patrick Wagner1,3, and Ward De Ceuninck**,1,3
1 Institute for Materials Research, Hasselt University, Wetenschapspark 1, 3590 Diepenbeek, Belgium2Xios University College, Agoralaan Gebouw H, 3590 Diepenbeek, Belgium3 IMEC, Devision IMOMEC, Wetenschapspark 1, 3590 Diepenbeek, Belgium
Received 29 October 2010, revised 27 January 2011, accepted 2 February 2011
Published online 9 May 2011
Keywords biosensors, electrochemical analysis, impedance spectroscopy, molecular imprinting
*Corresponding author: e-mail [email protected], Phone: þ32-011-26-88-35, Fax: þ32-011-26-88-99** e-mail [email protected]
A miniaturised, low cost impedance analyser is developed to
ease the use of impedance spectroscopy in biological setups.
This could form the first step towards fully standalone, hand-
held biosensor applications. The system is capable of perform-
ing quasi-simultaneous time resolved impedance measure-
ments on eight different channels in a frequency range of
10Hz–100 kHz. The unit is accurate in a broad impedance
range and is able to perform stable measurements over intervals
of several days. The system is characterised by passive
components, a temperature controlled wet cell based impe-
dance setup and a biomimetic molecularly imprinted polymer
(MIP) based histamine sensor. The test results all indicate
accurate and stable functioning of the unit, making it suitable
for bioanalytical applications.
� 2011 WILEY-VCH Verlag GmbH & Co. KGaA, Weinheim
1 Introduction Impedance spectroscopy can be usedas a readout technique for a wide variety of sensors. Thetechnique has already been used with success for monitoringDNA hybridisation and detection of single nucleotidepolymorphisms [1], nicotine and histamine recognition bymeans of molecularly imprinted polymers (MIPs) [2–4] andthe detection of immunoreactions [5–7]. Furthermore,impedance spectroscopy is used as a reference for otherbiosensor readout techniques [8–10]. This measurement isusually performed by bulky, expensive equipment. To easethe readout of biosensors, a first step towards a miniaturisedand low cost impedance spectroscopy unit was alreadydeveloped based on the Analogue Devices AD5933 chip[11]. The main advantage of this chip was that complexmeasurement circuitry that is present in conventionalequipment is now integrated in a single chip, resulting in amuch smaller unit. The integration of the measurementcircuitry in a chip also decreases noise caused by signal pathsbetween separate electronic components. This device wascapable of performing impedance measurements in a rangeof 10V–2MV in a frequency spectrum of 100Hz–100 kHz[12]. Although the unit is capable of performing stable
measurements on biosensors, it had some limitations inusable ranges, accuracy and ease-of-use. These problemshave now been overcome in the new system.
The setup is downscaled to a hand-held device and isbeing interfaced by USB to a computer, which also providespower for the system. This eliminates the need for anyexternal power supply. The frequency bandwidth has beenincreased from 10Hz to 100 kHz, with sub-Hertz resolution.The measurable impedance ranges from 10V to 5MV.Figure 1 shows this newly developed device, with a 1 Eurocoin placed on top for size reference. One can clearlydistinguish the 16 subminiature coax SMB connectors ontop, which are used for connection to samples, and the USB-and peripheral port on the side of the device.
The applicability of the developed system, both inelectronic lab setup as well as under biological researchconditions was investigated.
2 Experimental2.1 Measurement setup As can be seen in Fig. 2,
the unit has an on-board I2C-bus which controls allmeasurement- and peripheral circuitry. This bus is interfaced
� 2011 WILEY-VCH Verlag GmbH & Co. KGaA, Weinheim
1358 J. Broeders et al.: Miniaturised eight-channel impedance spectroscopy unit for biosensor applicationsp
hys
ica ssp st
atu
s
solid
i a
Figure 1 (online colour at: www.pss-a.com) The developed eight-channel impedance analyser with USB-port and SMB connectorsvisible.
Figure 2 Simplified diagram of the measurement circuit.
to an USB-port by a Future Technologies DevicesInternational (FTDI) chip, enabling full control over thecircuitry via USB protocol [13]. The measurement circuitryalters the signal generated by the impedance chip, which is asine wave with a minimal peak-to-peak voltage of 198mVand a bias of 173mV, to a usable signal for biologicalmeasurements. This includes removal of the bias voltage bymeans of a single capacitor and attenuation of the signal in avoltage divider to avoid polarisation of the electrodes. Theresult is a 65mV peak-to-peak sine wave oscillating voltageand a 0V bias voltage. It is however possible to furtherdecrease the voltage by fine-tuning an on-board potentio-meter connected to the voltage divider. This can be, forexample necessary when performing measurements onbiological cells which have an action potential of 60mVand will trigger ion channels when bigger voltages areapplied [14].
The resulting current, caused by the impedance of thesample, is converted to a voltage by an inverting operationalamplifier (opamp) circuit. With a fixed feedback resistorconnected to this opamp, the AD5933 chip is by itself onlycapable of analysing samples within a fixed impedance range.Since the impedance of the sample can vary strongly during
� 2011 WILEY-VCH Verlag GmbH & Co. KGaA, Weinheim
biological measurements [15, 16], the amplification factor ofthe opampwill also vary strongly, whichmay cause the outputvoltage of the opamp to go either out of range of the impedancechip or become too small to analyse. This was overcome by aset of resistors which can be connected as feedback resistorusing mechanical relay switches. Software controls theselection of the suited feedback resistor during measurements,keeping the amplification factor and output voltage of theopamp in a suitable range for analysis by the AD5933 chip. Acalibration sequence, which is performed before everymeasurement, delivers a set of correction factors which areutilised to compensate for the different feedback resistors.As alast step in the signal chain the bias voltage is again added bymeans of a time- and temperature-stable Zener diode.
Peripheral circuitry inside the unit includes preciseclocking to enable measurements in a wide frequencyspectrum. The optimal frequency at which impedancespectroscopy is performed in biological applications isstrongly dependant on the specific purpose. Examplesinclude a frequency of 80Hz for polymer-based immuno-sensors [6], a kilohertz range forDNAand cell-based sensors[17, 18] and 1MHz for diamond based C-reactive protein(CRP) sensors [5]. The internal clocking oscillator insidethe chip, which determines the sampling frequency inthe analogue-to-digital convertor (ADC) and thus theanalysable frequency range, has a fixed frequency of16.66MHz. Since 1024 samples are needed for discreteFourier transformation (DFT) inside the chip, the minimaldetectable frequency lies at 16 kHz. A Maxim IntegratedProducts clock chip with a programmable frequency rangingfrom 10 kHz to 66MHzwas used as external clocking devicefor the impedance analyser [19]. This results in a lowestanalysable frequency of 10Hz. It should also be noted thatthe AD5933 chip is, on itself, only capable of performinglinear frequency sweeps. Since the frequency range has beenextended to four decades, a logarithmic sweep would bepreferred. This has been achieved by softwarematicallyforcing the chip to perform a series of single-frequencymeasurements which are logarithmically divided along thecomplete frequency range.
The power of the unit is supplied by the USB-port of 5V,which is stabilised by voltage regulators. On board analogueand digital voltage are separated to avoid influence ofthe digital components, for example noise generated by theclocking chip, on the analogue measurement circuitry. Theeight different input channels are double pole switched bymechanical relays, controlled by software, to avoid inter-ference between samples via the analyser.
Interfacing to the sensor platforms is performed bysubminiature SMB connectors, with shielding connected tothe ground of the circuit, or zero-insertion-force (ZIF)sockets. A peripheral port, which supplies voltages and I2Cprotocol, enables usage of the device in a master-slave setupwith other equipment, e.g. external multiplexers.
2.2 General characterisation First, a generalcharacterisation is performed, by measuring electrical
www.pss-a.com

Phys. Status Solidi A 208, No. 6 (2011) 1359
Original
Paper
resistors with a resistance ranging from 10V to 820 kV and aseries resistor–capacitor circuit with a metal film resistor of33V and a ceramic capacitor of 100 nF.
As a first step to analyse the accuracy of the unit a set ofmetal film resistors ranging from 10V to 820 kV wasmeasured over the complete frequency bandwidth of 10Hz–100 kHz. This frequency range was swept logarithmically.For a measurement with ten points per decade, a frequencysweep of 40 frequency points was performedwithin 20 s. Themeasurement time on biological samples can vary from a fewminutes, in for example DNA sensors [20], to several days incell growth studies [21]. Therefore, the long-term stability ofthe unit is also an important factor. A series resistor–capacitor circuit with a metal film resistor of 33V and aceramic capacitor of 100 nF was measured over 60 h.The standard deviation of the measured impedances wascalculated per frequency point over time.
2.3 Wet cell condition Biologicalmeasurements areoften performed under wet cell conditions at differenttemperatures. These temperatures include room tempera-ture, 37 8C for in vivo applications and 70–80 8C for real-timemonitoring of DNA hybridisation [1, 22]. Therefore, the unitshould not only function properlywhenmeasuring solid statecomponents, but also when measuring wet cell biosensorssetups at different temperatures. To test the applicability ofthe unit under these conditions a prototype sensor-cell wasconstructed, as shown in Fig. 3. This cell utilises a siliconelectrodewith nanocrystalline diamond (NCD) coating and acopper back contact [23]. Diamond is biocompatible and issuited for attachment of biological receptors, enablingapplication as an immobilisation platform for use inbiological measurements [24]. Furthermore, diamond has ahigh thermal conductivity, it is chemically inert and it can bemade semiconducting by chemical doping [25]. A chemi-cally inert platinumwirewas used as a counter electrode. Thefluid cell was sealed by a rubber O-ring with inner diameterof 7mm, pressed onto a teflon lid with an opening of equalsize. The cell was filled with 140ml of phosphate bufferedsaline (PBS) solution, a commonly used salt solution which
Figure 3 (online colour at: www.pss-a.com) Experimental setupfor impedimetricmeasurementson1�PBSatdifferent temperatures(schematic).
www.pss-a.com
mimics the bloods pH and ionic strength. Furthermore, athermocouple was mounted into the copper and a second onewas mounted in the fluid, to monitor temperature. Atemperature profile ranging form room temperature to85 8C was utilised to verify the functionality of the setup inthe range of biologically relevant temperatures. Thesetemperatures were applied in steps of 10 8C at a heating rateof 0.66 8C/min by a programmable hot plate. After each stepthe setup was allowed to stabilise for 15min. After reachingthe maximum temperature of 85 8C the setup was againallowed to stabilise for 15min after which the setup wascooled down by means of convection, though following theprotocol as described above. This way a temperature rangefrom 35 to 85 8C was obtained. During this process,the impedance was monitored. The working and counterelectrode of the cell were connected to the impedance unitwith 50V coaxial cables with SMB-connectors. Theimpedance was monitored by performing frequency sweepsfrom 100Hz to 100 kHz with ten divisions per decade, at aspeed of 5 s per frequency sweep.
2.4 Biomimetic sensor As a last step in validation ofthe unit in biosensor setups, a biomimetic sensor wasanalysed. A MIP was used to detect the concentration ofhistamine in a PBS solution. Histamine, a low molecularweight molecule with chemical formula C5H9N3, plays animportant role in asthma [26], allergies [27] and irritablebowel syndrome [28]. MIPs are synthetic receptors whichconsist of polymers in which nanocavities are present withthe exact shape, size and functionality complementary to atarget molecule [29, 30].When the target molecule binds in ananocavity, the dielectric properties of the MIP change,which can be detected by impedance spectroscopy.
Molecularly imprinted polymers suited for detection ofhistamine and non-imprinted polymers (NIPs), weresynthesised from a mixture of methacrylic acid(17.8 mmol), ethylene glycol dimethacrylate (36mmol)and azobisisobutyronitrile (0.60mmol), together with thetemplate molecule histamine (8.99mmol), following themethod described in Ref. [3]. The NIPs can be used as areference during measurements and allow for compen-sation of non-specific absorption of targetmolecules. Sincethe developed device has eight measurement channels, adifferential measurement can be performed on both theMIP and the NIP sample. In order to do so, a cell similar toFig. 3 was constructed, though with two aluminiumelectrodes with copper back contacts. Both the MIP andthe NIP sample were immobilised on these aluminiumsubstrates. The cell was kept at a constant temperature of37 8C with a programmable hot plate to mimic in vivoconditions. The sensor was allowed to stabilise for 2.5 h inthe fluid cell filled with PBS, after which a concentration of2 nM of histamine was added. Hereafter the setup wasallowed to stabilise for 30min. Impedance spectroscopywas simultaneously performed on the MIP and the NIPchannel in a frequency range of 100 Hz–100 kHz at a speedof 5 s per sweep.
� 2011 WILEY-VCH Verlag GmbH & Co. KGaA, Weinheim
1360 J. Broeders et al.: Miniaturised eight-channel impedance spectroscopy unit for biosensor applicationsp
hys
ica ssp st
atu
s
solid
i a
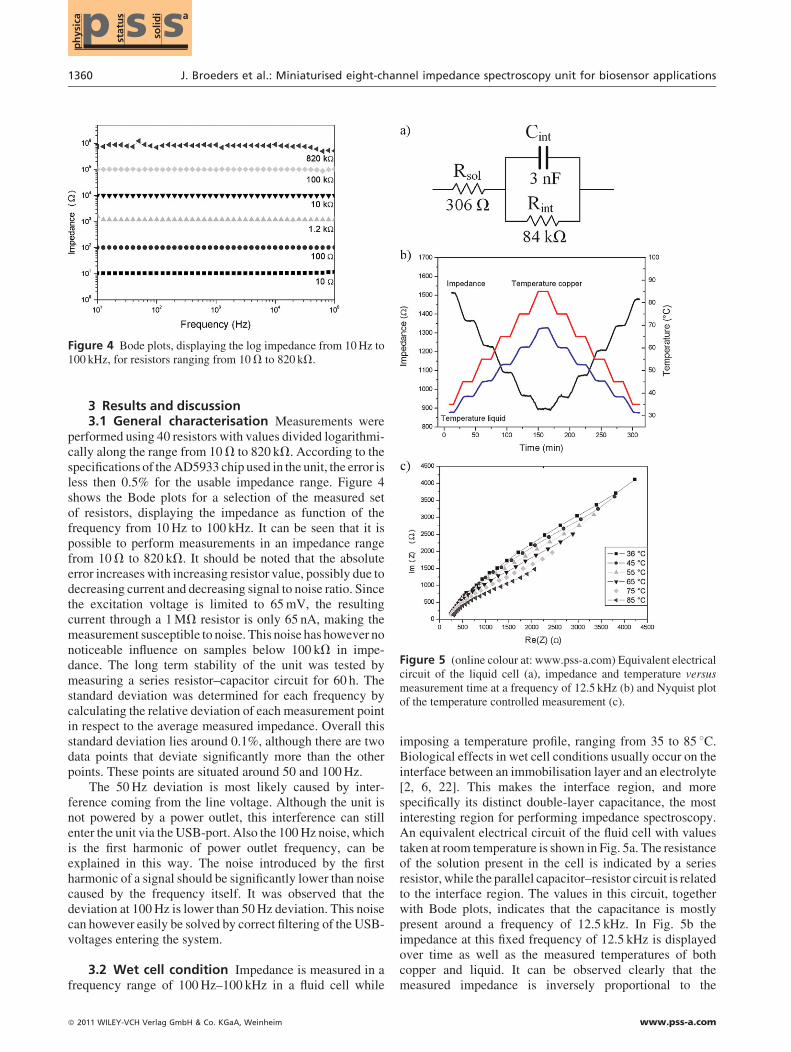
Figure 4 Bode plots, displaying the log impedance from 10Hz to100 kHz, for resistors ranging from 10V to 820 kV.
Figure 5 (online colour at: www.pss-a.com) Equivalent electricalcircuit of the liquid cell (a), impedance and temperature versusmeasurement time at a frequency of 12.5 kHz (b) and Nyquist plotof the temperature controlled measurement (c).
3 Results and discussion3.1 General characterisation Measurements were
performed using 40 resistors with values divided logarithmi-cally along the range from 10V to 820 kV. According to thespecifications of theAD5933 chip used in the unit, the error isless then 0.5% for the usable impedance range. Figure 4shows the Bode plots for a selection of the measured setof resistors, displaying the impedance as function of thefrequency from 10Hz to 100 kHz. It can be seen that it ispossible to perform measurements in an impedance rangefrom 10V to 820 kV. It should be noted that the absoluteerror increases with increasing resistor value, possibly due todecreasing current and decreasing signal to noise ratio. Sincethe excitation voltage is limited to 65mV, the resultingcurrent through a 1MV resistor is only 65 nA, making themeasurement susceptible to noise. This noise has however nonoticeable influence on samples below 100 kV in impe-dance. The long term stability of the unit was tested bymeasuring a series resistor–capacitor circuit for 60 h. Thestandard deviation was determined for each frequency bycalculating the relative deviation of each measurement pointin respect to the average measured impedance. Overall thisstandard deviation lies around 0.1%, although there are twodata points that deviate significantly more than the otherpoints. These points are situated around 50 and 100Hz.
The 50Hz deviation is most likely caused by inter-ference coming from the line voltage. Although the unit isnot powered by a power outlet, this interference can stillenter the unit via theUSB-port. Also the 100Hz noise, whichis the first harmonic of power outlet frequency, can beexplained in this way. The noise introduced by the firstharmonic of a signal should be significantly lower than noisecaused by the frequency itself. It was observed that thedeviation at 100Hz is lower than 50Hz deviation. This noisecan however easily be solved by correct filtering of the USB-voltages entering the system.
3.2 Wet cell condition Impedance is measured in afrequency range of 100Hz–100 kHz in a fluid cell while
� 2011 WILEY-VCH Verlag GmbH & Co. KGaA, Weinheim
imposing a temperature profile, ranging from 35 to 85 8C.Biological effects in wet cell conditions usually occur on theinterface between an immobilisation layer and an electrolyte[2, 6, 22]. This makes the interface region, and morespecifically its distinct double-layer capacitance, the mostinteresting region for performing impedance spectroscopy.An equivalent electrical circuit of the fluid cell with valuestaken at room temperature is shown in Fig. 5a. The resistanceof the solution present in the cell is indicated by a seriesresistor, while the parallel capacitor–resistor circuit is relatedto the interface region. The values in this circuit, togetherwith Bode plots, indicates that the capacitance is mostlypresent around a frequency of 12.5 kHz. In Fig. 5b theimpedance at this fixed frequency of 12.5 kHz is displayedover time as well as the measured temperatures of bothcopper and liquid. It can be observed clearly that themeasured impedance is inversely proportional to the
www.pss-a.com

Phys. Status Solidi A 208, No. 6 (2011) 1361
Original
Paper
temperature profile, which is most likely caused by thetemperature dependence of the double-layer capacitance.Figure 5c shows Nyquist plots of the impedance datafrom 1 to 100 kHz at temperatures of 35, 45, 55, 65, 75 and85 8C. It becomes distinct that an increasing temperatureleads not only to a decrease in the imaginary part of theNyquist plot, but also in the real part, indicating both resistiveand capacitive effects. This resistive effect is most likelycaused by higher ion mobilities in the electrolyte withincreasing temperature.
To gain insight into this temperature effect at differentfrequencies, a linear fit of the impedance at differenttemperatures was performed for frequencies of 1, 2, 5, 10and 20 kHz. The data of the performed fits is shown inTable 1. The slope increases with increasing frequencyindicating that the temperature effect shifts towards theimaginary part with increasing frequency. This shows alarger temperature dependence for the capacitive com-ponents, related to the interfacial double-layer, compared tothe resistive solution components of the sample. Thistemperature effect can also be monitored in the phase, wherean increase in temperature of 1 8C causes a phase shift of0.38.
3.3 Biomimetic sensor Measurements described inSection 3.2 are repeated with two aluminium workingelectrodes covered with a conductive polymer loaded witheitherMIP or NIP particles. The temperature is fixed at 37 8Cin order to prevent temperature effects discussed in Section3.2. This setup is allowed to stabilise for 100min. Figure 6ashows the Bode plot of the stabilised MIP sample rightbefore and 15min after addition of histamine. An impedancedifference can be clearly observed in the highest frequencydecade. This effect is however also present in the NIPsample and is most likely related to a change in theelectrolyte conductivity, caused by addition of the targetmolecule. Using the NIP sample as a reference, the intrinsiceffect of histamine detection is mostly present in the firstfrequency decade and can be most clearly observedaround 150Hz. Equivalent circuit modelling before additionindicates a double-layer capacitance of 27 nF with a parallelcharge-transfer resistance of 16 kV. In order to monitorthe interfacial effects of target molecule binding insidethe MIP cavities, both the real and imaginary part of theimpedance were plotted versus time at a set frequency of150Hz. Figure 6b shows the relative variation of the real part
Table 1 Slope and coefficient of determination for differentfrequencies.
frequency (kHz) slope R2
1 1.21 1.0002 1.36 0.9985 1.75 0.98810 2.21 0.96120 2.50 0.980
Figure 6 (online colour at: www.pss-a.com) Bode plots of the cellwith anMIP samplemounted (a), real (b) and imaginary (c) part overtime and relative impedance of the MIP – NIP versus time (d). Theimpedance changes are normalised to their value 20min beforehistamine was added.
www.pss-a.com � 2011 WILEY-VCH Verlag GmbH & Co. KGaA, Weinheim

1362 J. Broeders et al.: Miniaturised eight-channel impedance spectroscopy unit for biosensor applicationsp
hys
ica ssp st
atu
s
solid
i a
of both theMIP andNIP sample,which is used as a reference,in respect to their values taken 20min before histamine wasadded (t0). Addition of the target molecule results in anincrease in the real part of both the MIP and the NIP sample.The difference in slope is probably a result of the stabilisationperiod of the MIP. As can be seen in Fig. 6c, addition of thetarget molecule results in a decrease of the MIP imaginarypart of about 15% with a decrease of 2% in the NIP sample.This is most likely caused by non-specific binding orabsorption of target molecule in the NIP. This indicates thatthe impedance change due to binding of a target molecule inthe MIP is most dominant in the imaginary part of theimpedance, which is related to the interfacial double-layercapacitance. The measured impedance values were normal-ised relative to their initial values, resulting in a relativeimpedance Z(t)/Z(t0). In Fig. 6d the difference between therelative impedance signals of the MIP and the NIP is plottedover time. Addition of the 2 nM concentration of histaminecauses a slight drop in impedance due to movement of theliquid, after which the impedance increases significantly inrespect to the impedance of the NIP, indicating detectionof the target molecule. When stabilising for 15min afteraddition of the target, an increase of about 20% occurred.
4 Conclusion Both accuracy and stability of thedeveloped impedance spectroscopy unit were analysedusing passive components and circuits. These results showthat the device is accurate in a broad impedance range and isable to perform stable measurements over intervals ofseveral days. Measurements on a temperature controlledfluid cell indicate that the device is also capable ofmeasuringsetups for biological samples at high accuracy and stability.
As is shown in this paper, the system can clearly identifytemperature differences in a cell filled with 1� PBS and adiamond electrode by monitoring the time variation of themeasured impedance at certain frequencies. Nyquist plotsalso indicate that this temperature-driven impedance vari-ation is present in the real as well as the imaginary part. Thisis most likely related to both interfacial double-layercapacitance and electrolyte conductivity. Furthermore, thesystem was tested with its multichannel option on abiomimetic MIP-based histamine sensor. Upon detectionof a concentration as small as 2 nM of target molecule asignificant change in double-layer capacitance could bemonitored. These results indicate that the setup can be usedfor impedimetric detection of chemical binding in sensors,making it suited for bioanalytical purposes.
The unit will most likely become a vital part of currentimpedimetric biosensor setups. Possible applicationsinclude, amongst others, DNA single nucleotide mismatchidentification, detection of antibody–antigen recognition andimpedimetric cell growth measurements. There is still roomfor improving biosensor measurement setups and thedeveloped unit may become the first step towards fullystandalone, portable biosensor applications. Furthermore,this setup can be used in any field of research whereimpedance spectroscopy is used and its low cost and small
� 2011 WILEY-VCH Verlag GmbH & Co. KGaA, Weinheim
size offers advantages over conventional equipment.Additional improvements could be achieved by furtherextending the impedance range by adding feedback resistorsto the circuit, and lowering theminimal excitation frequencyby altering the clocking signal. This could enable the use inan even wider range of applications.
Acknowledgements We would like to thank the SpecialResearch Funds of Hasselt University and Xios University Collegeto provide us with the necessary financial resources. Furthermore,we owe thanks to Jan Mertens, Johan Sogen, Johnny Baccus andLieven DeWinter for technical support and Hannelore Strauven forassisting during measurements.
References
[1] V. Vermeeren, N. Bijnens, S. Wenmackers, M. Daenen, K.Haenen, O. A. Williams, M. Ameloot, M. vandeVen, P.Wagner, and L. Michiels, Langmuir 23, 13193–13202(2007).
[2] R. Thoelen, R. Vansweevelt, J. Duchateau, F. Horemans, J.D’Haen, L. Lutsen, D. Vanderzande, M. Ameloot, M. van-deVen, T. Cleij, and P. Wagner, Biosens. Bioelectron. 23,913–918 (2008).
[3] E. Bongaers, J. Alenus, F. Horemans, A. Weustenraed, L.Lutsen, D. Vanderzande, T. J. Cleij, F. J. Troost, R.-J.Brummer, and P. Wagner, Phys. Status Solidi A 207, 837–843 (2010).
[4] F. Horemans, J. Alenus, E. Bongaers, A. Weustenraed, R.Thoelen, J. Duchateau, L. Lutsen, D. Vanderzande, P.Wagner, and T. J. Cleij, Sens. Actuators B 148, 392–398(2010).
[5] N. Bijnens, V. Vermeeren, M. Daenen, L. Grieten, K. Hae-nen, S. Wenmackers, O. A. Williams, M. Ameloot, M.vandeVen, L. Michiels, and P. Wagner, Phys. Status SolidiA 206, 520–526 (2009).
[6] P. Cooreman, R. Thoelen, J. Manca, M. vandeVen, V.Vermeeren, L. Michiels, M. Ameloot, and P. Wagner, Bio-sens. Bioelectron. 20, 2151–2156 (2006).
[7] F. Frederix, K. Bonroy, W. Laureyn, G. Reekmans, A.Campitelli, W. Dehaen, and G. Maes, Langmuir 19, 4351–4357 (2003).
[8] A. Poghossian, D.-H. Mai, Yu. Mourzina, and M. J. Schon-ing, Sens. Actuators B 103, 423–428 (2004).
[9] A. Poghossian, M. H. Abouzar, F. Amberger, D. Mayer, Y.Han, S. Ingebrandt, A. Offenhauser, and M. J. Schoning,Biosens. Bioelectron. 22, 2100–2107 (2006).
[10] M. Kramer, M. Pita, J. Zhou, M. Ornatska, A. Poghossian, M.J. Schoning, and E. Katz, J. Phys. Chem. C 113, 2573–2579(2009).
[11] Analog Devices, Datasheet AD 5933, http://www.analog.com/static/imported-files/data_sheets/AD5933.pdf.
[12] B. van Grinsven, T. Vandenryt, S. Duchateau, A. Gaulke, L.Grieten, R. Thoelen, S. Ingebrandt, W. De Ceuninck, and P.Wagner, Phys. Status Solidi A 297, 919–923 (2010).
[13] Future Technologies Devices International, DatasheetFT232R, http://www.ftdichip.com/Support/Documents/DataSheets/ICs/DS_FT232R.pdf.
[14] C. H. Fry and R. I. Jabr, Surgery 28, 49–54 (2010).[15] J. Kafka, O. Panke, B. Abendroth, and F. Lisdat, Electrochim.
Acta 53, 7467–7474 (2008).
www.pss-a.com
Phys. Status Solidi A 208, No. 6 (2011) 1363
Original
Paper
[16] S. Zheng, M. S. Nandra, C.-Y. Shih, W. Li, and Y.-C. Tai,Sens. Actuators A 145/146, 29–36 (2008).
[17] D. Berdat, A. Marin, F. Herrera, and M. A. M. Gijs, Sens.Actuators B 118, 53–59 (2006).
[18] M. Thein, F. Asphahana, A. Cheng, R. Buckmaster, M.Zhang, and J. Xu, Biosens. Bioelectron. 25, 1963–1969(2010).
[19] Maxim Integrated Products, Datasheet DS 1077, http://data-sheets.maxim-ic.com/en/ds/DS1077.pdf.
[20] C. A. Marquette, I. Lawrence, C. Polychronakos, and M. F.Lawrence, Talanta 56, 763–768 (2002).
[21] K. Haupt and K. Mosbach, Chem. Rev. 100, 2495–2504(2000).
[22] R. Vansweevelt, A. Malesevic, M. Van Gompel, A. Vanhul-sel, S. Wenmackers, J. D’Haen, V. Vermeeren, M. Ameloot,L. Michiels, C. Van Haesendonck, and P. Wagner, Chem.Phys. Lett. 485, 196–201 (2010).
[23] O. A. Williams, M. Daenen, J. D’Haen, K. Haenen, J. Maes,V. V. Moshchalkov, M. Nesladek, and D. M. Gruen,Diamond Relat. Mater. 15, 654–658 (2006).
www.pss-a.com
[24] P. Christiaens, V. Vermeeren, S. Wenmackers, M. Daenen,K. Haenen, M. Nesladek, M. vandeVen, M. Ameloot, L.Michiels, and P. Wagner, Biosens. Bioelectron. 22, 170–177(2006).
[25] E. Gheeraert, S. Koizumi, T. Teraji, H. Kanda, and M.Nesladek, Diamond Relat. Mater. 9, 948–951 (2000).
[26] J. Chhabra, Y.-Z. Li, H. Alkhouri, A. E. Blake, Q. Ge, C. L.Armour, and J. M. Hughes, Eur. Respir. J. 29, 861–870(2007).
[27] R. Y. Lin, L. B. Schwartz, A. Curry, G. R. Pesola, R. J.Knight, H. S. Lee, L. Bakalchuk, C. Tenenbaum, and R. E.Westfal, J. Allergy Clin. Immunol. 106, 65–71 (2000).
[28] G. Barbara, V. Stanghellini, R. De Giorgio, C. Cremon, G. S.Cottrel, D. Santini, G. Pasquinelli, A. M. Morselli-Labate, E.F. Grady, N. W. Bunnett, S. M. Collins, and R. Corinalidesi,Gastroenterology 126, 693–702 (2004).
[29] S. A. Piletsky, S. Alcock, and A. P. F. Tuner, TrendsBiotechnol. 19, 9–12 (2001).
[30] S. Arndt, J. Seebach, K. Psathaki, H.-J. Galla, and J.Wegener,Biosens. Bioelectron. 19, 583–594 (2004).
� 2011 WILEY-VCH Verlag GmbH & Co. KGaA, Weinheim