Microstructural Investigation of Tablet Compaction ... - CORE
Upload
independentCategory
view
1download
0
ORI GIN AL PA PER
Microstructural Characterization and Cyclic HotCorrosion Behaviour of Sputtered Co–AlNanostructured Coatings on Superalloy
Atikur Rahman • R. Jayaganthan •
Ramesh Chandra • R. Ambardar
Received: 7 January 2011 / Revised: 14 March 2011 / Published online: 15 June 2011
� Springer Science+Business Media, LLC 2011
Abstract Nanostructured Co–Al coatings on Superni-718 superalloy substrate were
deposited by DC/RF magnetron sputtering in the present work. The microstructure
and cyclic hot-corrosion behavior of nanostructured Co–Al coatings on Superni-718
superalloy were investigated in molten salt of 40 wt% Na2SO4 ? 60 wt% V2O5 at
900 �C. The results showed that a dense scale formed on the coated samples exposed
to corrosive environment during thermal cycling. The spinel phases of CoCr2O4,
CoAl2O4 and NiCr2O4 were found in the corroded scale of the coatings, resulting in an
effective inhibition of O and S diffusion. The sputtered Co–Al coatings exhibited high
hot corrosion resistance due to the formation of b-CoAl phases in the coating. The
relevant corrosion mechanisms substantiating the role of coatings are discussed.
Keywords Nanostructured Co–Al coating � Magnetron sputtering �Molten salts � Hot corrosion
Introduction
MCrAlY coatings play a significant role in protection of hot section components in
gas turbine engine system, either as overlays or as bond coats for TBCs [1–4].
A. Rahman � R. Jayaganthan (&)
Department of Metallurgical and Materials Engineering, Indian Institute of Technology Roorkee,
Roorkee 247667, India
e-mail: [email protected]
A. Rahman � R. Chandra
Institute Instrumentation Centre, Indian Institute of Technology Roorkee, Roorkee 247667, India
R. Ambardar
Department of Metallurgical Engineering, National Institute of Technology Hazratbal, Srinagar
190006, India
123
Oxid Met (2011) 76:307–330
DOI 10.1007/s11085-011-9257-3
Usually, the conventional MCrAlY coatings are designed to meet particular
operating conditions. In order to provide enhanced high temperature protection over
a wide range of operating conditions, the nanostructured coatings have been
designed based on MCrAlY coatings [5–7]. Nanostructured MCrAlY (M = Ni, Co,
or Fe) coatings have been identified as potential materials for providing good
resistance against high temperature oxidation and hot corrosion [8–16] as compared
to conventional coatings due to the formation of dense, continuous, non-porous and
adherent alumina scales over the coatings[17, 18]. The size effect of nanostructured
coatings facilitates the enhanced diffusivity of atoms to form the continuous
protective scales, which is normally discontinuous in the conventional coatings as
reported in the literature [19]. Wang et al. [20] investigated the oxidation and hot
corrosion behavior of sputtered nanocrystalline coating of superalloy K52 and result
showed that nanocrystallization of superalloy coating greatly reduced the oxidation
and hot corrosion rate due to formation of protective and adherent alumina scale.
Ren and Wang [21] have studied the high-temperature oxidation and hot-corrosion
behavior of a sputtered NiCrAlY coating with and without aluminizing. The results
indicated that the sputtered NiCrAlY coating possessed excellent oxidation
resistance at 1,000 �C due to the presence of extensive amount of chromium and
good amount of aluminum. The aluminized NiCrAlY coating showed a much better
hot-corrosion resistance in the presence of 75 wt% Na2SO4 ? 25 wt% K2SO4/NaCl
film as a result of the formation of a continuous and protective Al2O3 scale. The hot-
corrosion behavior of a nanocrystalline coating of K38G alloy, prepared by
magnetron sputtering and cast K38G in molten 75 wt% Na2SO4 ? K2SO4 at
900 �C was studied by Geng et al. [22]. The coating eliminated internal sulfidation
during the early stage of corrosion as a result of the formation of a continuous and
compact scale. The nanocrystallization of K38G alloy prolonged the incubation of
breakaway corrosion and improved the corrosion resistance of K38G.
It is well known that the content of Al is vital for MCrAlYs because the selective
oxidation of Al occurs only while the Al concentration is adequate [23–29]. Besides,
the life time of MCrAlY coatings depends greatly on the extent of Al depletion
occurring on ceaseless consumption from the repeated spallation/rehabilitation of
the alumina scale and the interdiffusion with substrates. An increase of the Al
content in MCrAlY overlays is deemed effective for both enhancing the
performance and extending the service life. However, the direct increase of the
Al content in the coating is hard to be accomplished due to the reduction of
mechanical properties and the deterioration of machinability.
The present work has been focused to study the microstructure and hot corrosion
behaviour of magnetron sputtered Co–Al coatings on the Superni-718 superalloy
substrate and compared with uncoated bare Superni-718 substrate in the environ-
ment of molten salt of 40% Na2SO4 ? 60% V2O5 at 900 �C for 100 cycles. The
formation of intermetallic b-CoAl phase (Al reservoir) in the Co–Al based
superalloy coatings exhibits high melting point (1,640 �C), which is beneficial for
providing high temperature oxidation and type I hot corrosion resistance at very
high temperature above 1,000 �C, in the actual service applications, especially in
gas turbines. The CoAl based nanostructured superalloy coatings could serve as
potential protective coatings for high temperature applications to combat high
308 Oxid Met (2011) 76:307–330
123

temperature corrosion. The improvement in oxide scale spallation resistance is
believed to be related to the fine-grained structure of the coating [30–33].
The weight changes of the coated samples exposed to corrosive environments
under cyclic conditions are continuously monitored to establish its corrosion rate,
The nanostructured Co–Al coatings and corroded products of the coatings were
characterized by using XRD, FE-SEM/EDS to understand the mechanisms of high
temperature corrosion in the present work.
Experimental Procedures
Ni-based superalloy namely Superni-718 has been chosen to deposit Co–Al coating
in the present work. The superalloy was procured from Mishra Dhatu Nigam
Limited, Hyderabad, India in annealed and cold rolled sheet form and its chemical
composition is shown in Table 1. Each specimen measuring approximately 18 mm
(length) 9 15 mm (width) 9 3 mm (thickness) were cut from the rolled sheet and
grinded by using SiC emery papers. Subsequently, it was polished on cloth
polishing disc by using alumina powder followed by diamond paste. Commercially
available Co Target (99.99% pure) with 2 inch diameter and 2.0 mm thickness and
similarly, commercially available Al Target (99.99% pure) with 2 inch diameter and
5.0 mm thickness were fixed at an angle of 45� to each other in the sputtering
chamber. With the use of rotator, the substrate heater was rotated between Co and
Al targets continuously to perform co-sputtering. The target to substrate distance
was fixed at 40 mm during sputter deposition of the coatings. Before starting the
deposition, the targets were pre-sputtered for 15 min with a shutter located in
between the targets and the substrate. The shutter was also used to control the
deposition time. Before deposition of Co–Al coatings, all samples were cleaned in
acetone, ethanol and deionized water. The detailed process parameters used in DC/
RF magnetron sputtering are shown in Table 2.
Characterization of Co–Al Coatings
XRD (Bruker AXS, D8 Advance) measurements were made using CuKa radiation to
characterize the as deposited Co–Al coatings at 500 and 700 �C on Superni-718
substrate. The scan rate and the scan range were used 0.1 s/step and from 10� to
110�, respectively. An average grain size of the Co–Al coatings is estimated using
its XRD peak broadening according to Scherrer formula [34], as given in Eq. 1. It
Table 1 Chemical composition of the superalloy used in study (Superni-718)
Chemical composition (wt%)
Midhani
grade
Fe Ni Cr Ti Al Mo Mn Si Co Nb P C S
Superni-718 19.8 Bal 17.6 0.96 0.53 3.23 0.02 0.03 0.01 4.91 0.005 0.02 0.007
Oxid Met (2011) 76:307–330 309
123
was found to be in the range of 20–35 nm and 21.8 nm and 25.7 nm at 500 and
700 �C respectively.
Bð2hÞ ¼ kkD cos h
ð1Þ
where D is the average size of crystallite, B is the broadening of the diffraction line
measured at half maximum intensity, k is constant (k = 1 is used in the present
work), k is the wavelength of the X-ray radiation (1.54052 A, CuKa) and h is the
Bragg angle. The instrumental broadening has been considered for the calculation of
grain size, and the value of 0.1 is subtracted (calculated using standard silicon
sample) from the full-width half maximum (FWHM) value (B value).
FE-SEM (FEI, Quanta 200F) is used to characterize the microstructures of the
Co–Al coatings at an acceleration voltage of 20 kV. The surface morphology of the
Co–Al coatings is characterized by AFM (NT-MDT, Ntegra) operated in a semi
contact (tapping) mode in order to calculate its surface roughness. The root-mean-
square (RMS) roughness of the coatings is calculated from the AFM scan at five
different spots chosen in each sample.
Hot Corrosion Studies
Hot corrosion studies under cyclic conditions were performed in molten salt of
(40% Na2SO4 ? 60% V2O5) environment up to 100 cycles for the bare, Co–Al
coated superalloy samples, and their corrosion behavior was compared. The samples
were mirror polished down to 1 lm alumina on a wheel cloth polishing machine.
Each cycle consisted of 1 h of heating at 900 �C, in silicon carbide tube furnace,
followed by 30 min of cooling at room temperature for up to 100 cycles. The
samples were cleaned using acetone and heated in an oven at about 250 �C for
10 min. Thereafter, a layer of 40% Na2SO4 ? 60% V2O5 mixture, prepared by
mixing it with distilled water, was applied uniformly on the warmed polished
samples with the help of camel hair brush. The amount of salt coating was
maintained within the range of 3.0–5.0 mg/cm2. The salt coated samples were kept
in the alumina boats and then inserted into SiC tube furnace for 3–4 h at 100 �C for
drying and proper adhesion of the salt. Subsequently, the dried salt coated samples
were again weighed and introduced into the silicon tube furnace at 900 �C. During
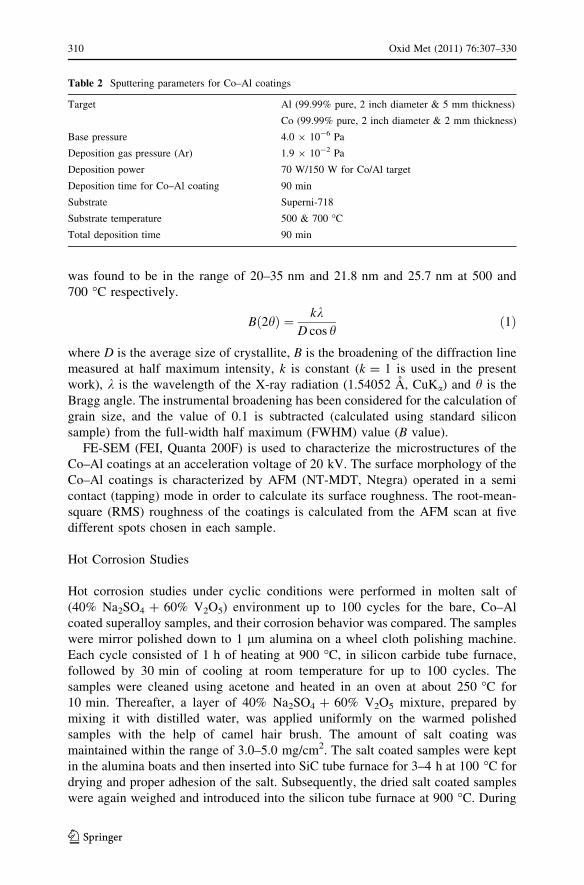
Table 2 Sputtering parameters for Co–Al coatings
Target Al (99.99% pure, 2 inch diameter & 5 mm thickness)
Co (99.99% pure, 2 inch diameter & 2 mm thickness)
Base pressure 4.0 9 10-6 Pa
Deposition gas pressure (Ar) 1.9 9 10-2 Pa
Deposition power 70 W/150 W for Co/Al target
Deposition time for Co–Al coating 90 min
Substrate Superni-718
Substrate temperature 500 & 700 �C
Total deposition time 90 min
310 Oxid Met (2011) 76:307–330
123

hot corrosion runs, the weight of boats and samples was measured together at the
end of each cycle with the help of an electronic balance Model CB-120 (Contech,
Mumbai, India) with a sensitivity of 1 mg. During each cycle, the weight changes
measured for bare and coated samples were used to calculate the corrosion rate. The
spalled scale (if any) was also included at the time of measurements of weight
change to determine total corrosion rate. The kinetics of hot corrosion was
determined from the weight change measurements. After hot corrosion studies, the
corroded samples were analyzed by using XRD and FE-SEM/EDS.
Results and Discussion
Microstructures Before Hot Corrosion
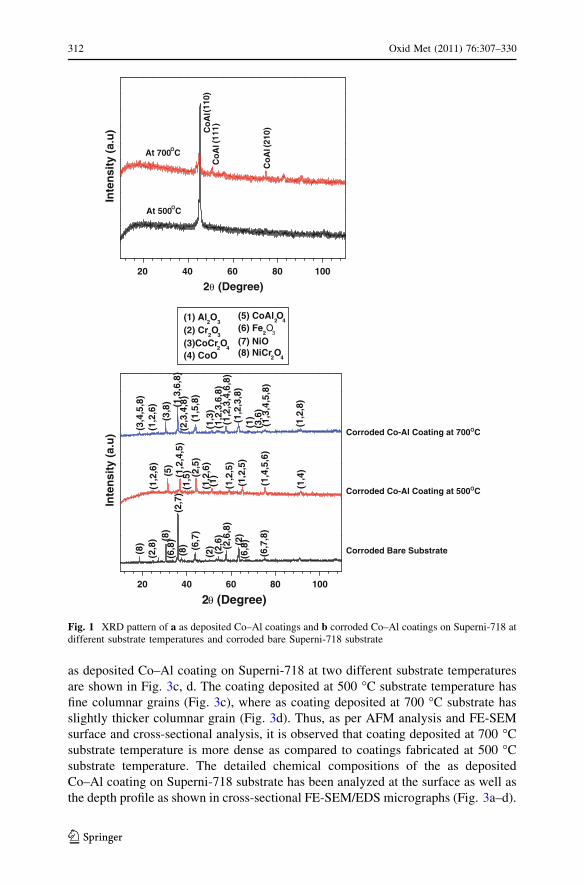
Figure 1a shows the XRD pattern of as deposited Co–Al coatings on Superni 718 at
different substrate temperatures. The intermetallic b-CoAl phase is observed at
different substrate temperatures, since the outer layer of coatings contains high Co
and Al as evident from the XRD results and the CoAl binary phase diagram. Co–Al
coating at substrate temperature of 500 �C, shows only one major peak of b-CoAl
phase; where as, the coating at substrate temperature of 700 �C shows one major
peak along with two small peak of b-CoAl phase with different orientation.
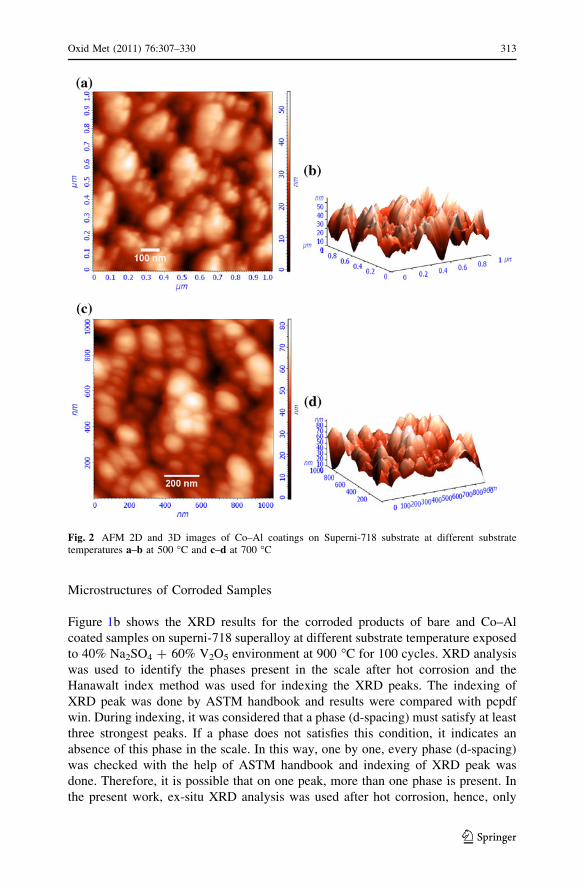
The 2D and 3D AFM images of the Co–Al coating at different substrate
temperatures are shown in Fig. 2a–d. 2D image of Fig. 2a indicates that coating has
some voids and spherical grains, where as 2D image of Fig. 2c shows that it has
dense coating and spherical grains. The surface roughness of the coatings is found to
be 12.2 and 22.5 nm for the coatings deposited at 500 and 700 �C, respectively. The
particle size of Co–Al coated samples are also confirmed by AFM images (Fig. 2a,
c) and are used for calculation of particle size, which are in tandem with the XRD
results.
Figure 3a, b shows the FE-SEM surface micrographs with EDS at different
points on the surface of as deposited Co–Al coatings at 500 and 700 �C. The
observed microstructural features of the coatings can be classified by using the
structure zone model proposed by Messier [35]. The homogeneous temperature,
(ratio of substrate temperature to melting point of the coating materials), is used to
classify the coating microstructures observed at different substrate temperature
during sputter deposition of the coatings. In the present work, the coating deposited
at 500 �C exhibits a homogeneous temperature of 0.41 and showed spherical shape
grains, which approaches zone 2 structures as reported in Messier’s work. The
homogeneous temperature (TS/Tm) is 0.51 for the coatings deposited at 700 �C and
the rod type elongated shape grains, but their edges are round and dense coating are
observed at this deposition temperature, which comes under zone 3 structure. With
increase in substrate temperature, the surface mobility of condensed atoms
increases, which could easily diffuse from island side to lower potential zone of
substrate, resulting in denser coating with reduced porosity or voids in coatings. The
thickness of coatings was calculated by its cross sectional FE-SEM images and it
was found to be approximately 4 lm. The cross-sectional FE-SEM micrographs of
Oxid Met (2011) 76:307–330 311
123
as deposited Co–Al coating on Superni-718 at two different substrate temperatures
are shown in Fig. 3c, d. The coating deposited at 500 �C substrate temperature has
fine columnar grains (Fig. 3c), where as coating deposited at 700 �C substrate has
slightly thicker columnar grain (Fig. 3d). Thus, as per AFM analysis and FE-SEM
surface and cross-sectional analysis, it is observed that coating deposited at 700 �C
substrate temperature is more dense as compared to coatings fabricated at 500 �C
substrate temperature. The detailed chemical compositions of the as deposited
Co–Al coating on Superni-718 substrate has been analyzed at the surface as well as
the depth profile as shown in cross-sectional FE-SEM/EDS micrographs (Fig. 3a–d).
(210
)
(111
)(1
10)
Co
Al
Co
Al
Co
Al
At 700OC
At 500OC
Inte
nsi
ty (
a.u
)
2θ (Degree)20 40 60 80 100
20 40 60 80 100
(1,2
,8)
(1,3
,4,5
,8)
(3,6
)(1
)(1,2
,3,8
)(1
,2,3
,4,6
,8)
(1,2
,3,6
,8)
(1,3
)
(1,5
,8)
(2,3
,4,8
)(1
,3,6
,8)
(3,8
)
(1,2
,6)
(3,4
,5,8
)
(1,4
)
(1,4
,5,6
)
(1,2
,5)
(1,2
,5)
(1)
(1,2
,6)
(2,5
)(1
,5)(1,2
,4,5
)(5
)
(1,2
,6)
(6,7
,8)
(6,8
)(2)
(2,6
,8)
(2,6
)(2
)(6,7
)(8
)(6
,8)
(2,7
)(8
)(2
,8)
(8)
Corroded Co-Al Coating at 700OC
Corroded Co-Al Coating at 500OC
Corroded Bare Substrate
Inte
nsi
ty (
a.u
)
2θ (Degree)
(1) Al2O
3
(2) Cr2O
3
(3)CoCr2O
4
(4) CoO
(5) CoAl2O
4
(6) Fe2O
3
(7) NiO(8) NiCr
2O
4
Fig. 1 XRD pattern of a as deposited Co–Al coatings and b corroded Co–Al coatings on Superni-718 atdifferent substrate temperatures and corroded bare Superni-718 substrate
312 Oxid Met (2011) 76:307–330
123
Microstructures of Corroded Samples
Figure 1b shows the XRD results for the corroded products of bare and Co–Al
coated samples on superni-718 superalloy at different substrate temperature exposed
to 40% Na2SO4 ? 60% V2O5 environment at 900 �C for 100 cycles. XRD analysis
was used to identify the phases present in the scale after hot corrosion and the
Hanawalt index method was used for indexing the XRD peaks. The indexing of
XRD peak was done by ASTM handbook and results were compared with pcpdf
win. During indexing, it was considered that a phase (d-spacing) must satisfy at least
three strongest peaks. If a phase does not satisfies this condition, it indicates an
absence of this phase in the scale. In this way, one by one, every phase (d-spacing)
was checked with the help of ASTM handbook and indexing of XRD peak was
done. Therefore, it is possible that on one peak, more than one phase is present. In
the present work, ex-situ XRD analysis was used after hot corrosion, hence, only
Fig. 2 AFM 2D and 3D images of Co–Al coatings on Superni-718 substrate at different substratetemperatures a–b at 500 �C and c–d at 700 �C
Oxid Met (2011) 76:307–330 313
123

Fig. 3 FE-SEM/EDS surface micrographs (a–b) of Co–Al coatings on Superni-718 substrate at differentsubstrate temperatures a at 500 �C, and b at 700 �C, and c–d FE-SEM/EDS cross-sectional micrographs ofCo–Al coatings on Superni-718 substrate at different substrate temperatures c at 500 �C and d at 700 �C
314 Oxid Met (2011) 76:307–330
123

stable phases (mainly oxides) were observed and indexed. It is observed that the
oxide scales such as Cr2O3, NiO, Fe2O3 and NiCr2O4 are formed on the bare
superalloy and Cr2O3, Al2O3, CoO, and CoAl2O4 are formed as a major phase and
Fe2O3 as a minor phase on corroded coating at 500 �C substrate temperature.
However, Cr2O3, Al2O3, Fe2O3, CoO and CoCr2O4, CoAl2O4 and NiCr2O4 scales
are found as major phases on the corroded Co–Al coatings deposited at 700 �C
substrate temperature. The presence of Fe2O3 and Cr2O3 phases on the surface of
hot corroded Co–Al coatings indicates the outward diffusion of Fe and Cr element
from the substrate to coating during hot corrosion of the samples exposed to 40%
Na2SO4 ? 60% V2O5 environment at 900 �C. Therefore, it is required that a third
element should be present in the coating which act as barrier for cation as well
anion. Hence, most of the researchers reported that Cr or Y as a third element in the
coating is beneficial for corrosion protection. Cr is more beneficial since its presence
in the coating may induce transient oxidation containing Cr-oxide patches, which
act as oxidation retardants and nucleation centers for Al-oxide scales. Thus, it favors
the formation of more alumina in scale. Once sufficient amount of alumina in scale
is formed, it enables to act as a barrier layer with corrosive environment. Thus, it
can retard the diffusivity of substrate element towards coating during hot corrosion.
Figure 4a shows the weight gain per unit area versus number of cycles plots for
the bare substrate and Co–Al coatings deposited at different substrate temperatures,
500 and 700 �C on Superni-718 subjected to hot corrosion studies in molten salt
(40% Na2SO4 ? 60% V2O5) environment at 900 �C for 100 cycles. It is shown that
under cyclic conditions, the bare substrate is more prone to corrosion attack. In case
of bare Superni-718 substrate after 20th cycle, weight increases rapidly up to 60th
cycle, and then onwards shows very little weight gain and appears like a constant
weight variation. In Co–Al coated sample at 500 �C substrate temperature, the
weight increases up to 20th cycle, and subsequently, the weight variation is less and
follows a constant weight variation. On the other hand, in Fig. 4a, Co–Al coated
sample at deposition temperature of 700 �C shows abruptly weight loss from 40
cycles to 60 cycles, and then onwards, the weight variation is constant. The total
weight gain at the end of 100 cycles after hot corrosion in Co–Al coated sample at
700 �C was 20.12 mg/cm2, where as in Co–Al coated sample at 500 �C was
23.42 mg/cm2 and for the bare substrate it was 46.39 mg/cm2 (Fig. 4c). The hot
corrosion kinetics is determined based on weight change measurements made
during the corrosion studies. Overall, the weight gain in Co–Al coated sample at
700 �C has found to be lower than that of Co–Al coating at 500 �C and bare
substrate.
Mass gain results (Fig. 4a) of coated specimen shows that it follows nearly a
parabolic law, where as bare substrate showed a deviation from the parabolic law.
Parabolic law is diffusion controlled after the initial chemical controlled reaction of
the coated specimens. Once a nearly constant weight gain is obtained, it indicates
the parabolic law, which precludes further oxidation/corrosion process. Any
coating/alloy designed for high temperature application should follow the parabolic
law for the better corrosion protection. The weight changes curves reveals that the
Co–Al coated substrate are found to be more hot corrosion resistant than the bare
superalloy. It is evident that Co–Al coated substrate obeys parabolic rate law and
Oxid Met (2011) 76:307–330 315
123

0
5
10
15
20
25
30
35(b)Corroded Bare Substrate Corroded Co-Al Coating at 500O CCorroded Co-Al Coating at 700O C
(Wei
gh
t C
han
ges
/ A
rea)
2 (m
g2 c
m-4
s-1)
Number of Cycles
-10 0 10 20 30 40 50 60 70 80 90 100 1100
1
2
3
4
5
6(a)
Wei
gh
t C
han
ges
/ A
rea
(mg
/ cm
2 )
Number of Cycles
Corroded Bare Substrate Corroded Co-Al Coating at 500O CCorroded Co-Al Coating at 700O C
0
10
20
30
40
50(c)
Co-Al Coating At 700oC
Co-Al Coating At 500oC
BareSuperni-718
Cu
mm
ula
tive
Wei
gh
t g
ain
/Are
a(m
g/c
m2 )
-10 0 10 20 30 40 50 60 70 80 90 100 110
Fig. 4 a Weight changes/area(mg/cm2) versus number ofcycles and b parabolic rateconstant, Kp (weight change/area)2, mg2/cm4 versus numberof cycles, for bare and coatedsamples oxidized in molten saltenvironment at 900 �C, andc cumulative weight gain/area(mg/cm2) versus number ofcycles, for bare and coatedsamples oxidized in molten saltenvironment at 900 �C for 100cycles
316 Oxid Met (2011) 76:307–330
123
exhibit the tendency to act likes diffusion barriers to the corroded species. The
weight changes square (mg2/cm4) verses time (number of cycles) plots are shown in
Fig. 4b to establish the rate law for the hot corrosion. It is observed from the graph
that Co–Al coated sample follow nearly parabolic rate law where as bare substrate
deviated from parabolic law due to cyclic scale growth. The higher weight gain of
the specimens during the first few cycles might be due to the rapid formation of
oxides at the grain boundaries and within the open pores due to the penetration of
the oxidizing species, further the subsequent increase in weight is gradual. The
weight changes of the samples reveal that Co–Al coated sample at 700 �C substrate
temperature are found to be more hot corrosion resistant than the bare Superni-718
substrate and Co–Al coated at 500 �C substrate temperature. The nature of corrosion
kinetics of coatings and bare substrate was determined by using the changes in their
weight measured as a function of different cycles. The parabolic rate (Fig. 4b)
constant Kp was calculated by a linear least-square algorithm to a function in the
form of (W/A)2 = Kpt, where W/A is the weight gain per unit surface area
(mg cm-2) and ‘t’ indicates the number of cycles represents the time of exposure.
The calculated Kp for the Co–Al coating at 500 and 700 �C on superalloy is found to
be 9.721 9 10-12 and 5.472 9 10-12 g2 cm-4 s-1 respectively. It is very less as
compared to the Kp value of 98.921 9 10-12 g2 cm-4 s-1 obtained for the bare
superalloy substrate. Figure 4c shows the cumulative weight gain per unit area for
Co–Al coated sample at different substrate temperature and bare Superni-718
substrate subjected to cyclic hot corrosion for 100 cycles in 40% Na2SO4 ? 60%
V2O5 environment at 900 �C. Figure 4c indicate that Co–Al coating at 700 �C
substrate temperature shows minimum cumulative weight gain per unit area as
compared to bare substrate and Co–Al coating at 500 �C substrate temperature,
exposed to molten salt environment at 900 �C for 100 cycles. Co–Al coating on
Superni-718 substrate at 700 �C has been found successful in reducing the overall
weight gain by 56.6% (Fig. 4c) with reference to bare superni-718 substrate. On the
other hand, Co–Al coating on Superni-718 substrate at 500 �C has been reduced the
overall weight gain by 49.5% (Fig. 4c) with reference to bare superni-718 substrate.
Figure 5a–d shows FE-SEM/EDS surface micrographs at the selected points of
interest of corroded bare substrate Superni-718. The scale formed on bare Superni-
718 has spalled, and the cracks were formed as shown in Fig. 5b. The large numbers
of small pores on the surface of the specimen are observed from Fig. 5b. The low
magnification (2,5009) micrograph shown in Fig. 5a, revels that the scale is non-
uniform. High magnification (20,0009) micrograph shown in Fig. 5c indicates the
formation of faceted oxides. The over all EDS result showed (Fig. 5d) that scale on
the surface of corroded bare substrate has chromium and nickel rich oxide and also
iron oxide is present. The EDS analysis (Fig. 5c) was carried out such as the one
marked as (1) correspond to the Fe2O3 phase i.e. iron-rich oxide (O = 43.36 at%,
Fe = 43.36 at%, Cr = 10.40 at% and Ni = 10.33 at%), the location ‘2’ corre-
sponds to the Cr-rich and Ni-rich oxide (O = 49.99 at%, Cr = 26.31 at%,
Ni = 17.96 at% and Fe = 10.76 at%). These results are also confirmed by XRD
results (Fig. 1b).
Figure 6a, b shows the FE-SEM surface micrographs of corroded coatings at the
selected points of interest along with its corresponding EDS results. The low
Oxid Met (2011) 76:307–330 317
123

magnification (2,5009) micrograph shown in Fig. 6a, b reveals that scale formed on
both corroded Co–Al coated substrate has uniform, continuous and defect free scale.
There is no spallation and cracks in scale are observed on the both corroded Co–Al
coated sample. At high magnification (15,0009), surface micrograph of corroded
Co–Al coating at 500 �C substrate temperature shown in corner Fig. 6a indicates
three dimensional hexagonal morphology of scale. The surface micrograph of
corroded Co–Al coating at 700 �C substrate temperature at high magnification
(15,0009) shown in corner Fig. 6b indicates the pyramidal morphology of scale.
EDAX Genesis 32 software was used to calculate the composition of the corroded
products, mainly, oxides using elemental composition of the coatings obtained from
EDS analysis. The formation of oxide scale such as Al2O3, Cr2O3, Fe2O3 and CoO
on the surface of the coating is evident from this figure. The coating deposited at
500 �C substrate temperature has Al-rich oxide (37.85 at%) and also chromium
oxide (09.58 at%), iron oxide (01.12 at%) and cobalt oxide (08.51 at%) scale are
Fig. 5 a–b FE-SEM surface micrographs of corroded bare Superni-718 substrate at lower magnification(92,500) and c at higher magnification (920,000), and d surface EDS analysis result at the differentlocations of corroded bare Superni-718 substrate
318 Oxid Met (2011) 76:307–330
123

present, which is shown in Fig. 6a. The coatings deposited at 700 �C substrate
temperature has Al-rich oxide scale (42.47 at%) and Co-rich oxide (11.29 at%) and
also chromium oxide (02.92 at%), and iron oxide (01.08 at%) scale are present,
which is shown in Fig. 6b. The nanosized grains in the Co–Al coating, observed
using XRD and AFM analysis, facilitates the enhanced reactivity of Al and Co with
oxygen for the formation of continuous layer of their corresponding oxide, which is
essential for providing an adequate protection to the Superni-718 in the high
temperature environment. Thus, both corroded Co–Al coatings show uniform,
adherent, continuous, and dense scale on the surface.
Figure 7a–c shows the FE-SEM cross sectional micrographs of corroded bare
substrate and it reveals that the scale is non-uniform (Fig. 7a), crack (Fig. 7b) and
porous (Fig. 7c). The higher weight gain of bare alloy after 20th cycles is due to
spallation of initial oxide scales and formation of cracks in scales (Figs. 5b, 7b), the
Fig. 6 FE-SEM surface micrographs (at 92,500 magnification) with EDS of corroded Co–Al coatingson Superni-718 deposited at different substrate temperatures a at 500 �C, and b at 700 �C. The cornersurface micrograph is at higher magnification (915,000) of the same coating
Oxid Met (2011) 76:307–330 319
123

continuous exposure of fresh surface of the materials takes place during hot
corrosion. The evaporation of volatile impurities in the bare sample, during high
temperature exposure, result in the formation of pores (Figs. 5b, 7c), which might
also contribute to the enhanced reaction between the bare sample and oxygen. After
60th cycles, weight variation in bare substrate is less and it seems nearly a constant.
XRD result revealed that there is NiCr2O4 spinel phase is present on the surface of
corroded bare substrate. The presence of NiCr2O4 spinel phase at the surface of
corroded bare substrate might be inhibit the diffusivity of O and S [36] and thus
weight variation is less in bare substrate after 60th cycle, but still it is higher than
corroded coating. Thus, the surface as well as cross-sectional FE-SEM micrograph
of corroded bare substrate revealed that it has poor hot corrosion resistance in
molten salt of 40% Na2SO4 ? 60% V2O5 environment at 900 �C for 100 cycles.
Typical cross-sectional images of the corroded Co–Al coating deposited on
Superni-718 at different substrate temperature after exposure to 40%
Fig. 7 FE-SEM cross-section micrographs of corroded bare Superni-718 substrate
320 Oxid Met (2011) 76:307–330
123
Na2SO4 ? 60% V2O5 environment at 900 �C for 100 cycle are compared in Fig. 8a,
b at lower magnifications. A loss in coating thickness due to hot corrosion was
found in all the cases. It can be seen that the loss of coating thickness due to hot
corrosion is reduced in corroded Co–Al coating on Superni-718 at 500 �C substrate
temperature (Fig. 8a) as compared to corroded Co–Al coating deposited on Superni-
718 at 700 �C substrate temperature. Micrograph (Fig. 8b) reveals that the Co–Al
coating on Superni-718 at 700 �C substrate temperature as a bond coat should have
higher hot corrosion attack in 40% Na2SO4 ? 60% V2O5 environment at 900 �C.
At higher magnification (10,0009), it is observed that the cross-sectional
micrograph of corroded Co–Al coating at 700 �C substrate temperature (Fig. 8d)
shows dense scale and appears like a solid mass, where as, the corroded Co–Al
coating at 500 �C substrate temperature (Fig. 8c) shows a less dense morphology of
the coating with an occurrence of swelling. Co–Al coating at 500 �C substrate
temperature has fine surface morphology (Fig. 3a), but it belongs to Structure zone
model 2, which has some voids. It has been confirmed by AFM images in Fig. 2a.
On the other hand Co–Al coating at 700 �C substrate temperature has rod type
surface morphology (Fig. 3b) and it belongs to zone 3 as per the structure model
proposed by Messier. It has dense coating which is confirmed by AFM images
(Fig. 2c) and also by cross-sectional micrograph (Fig. 3d) which has thick columnar
structure. During hot corrosion, due to some voids in as deposited coating, corrosion
rate is slightly high as compared to Co–Al coating at 700 �C. Besides, it forms only
one spinel phase (CoAl2O4) in the corroded coating at 500 �C. Thus, they are not
able to heal up the all possible defects in scale. Therefore, cross-section micrograph
(Fig. 8c) indicated that Co–Al coated sample at 500 �C has less dense scale as
compared to Co–Al coating at 700 �C (Fig. 8d). Due to this reason, at lower
magnification (2,5009), the thickness of corroded Co–Al coated sample at 500 �C
substrate temperature (Fig. 8a) observed to be thicker as compared to corroded
Co–Al coated sample at 700 �C substrate temperature. Now, it is clear that the
Co–Al coating on Superni-718 at 700 �C substrate temperature as a bond coat
exhibit lower hot corrosion attack in 40% Na2SO4 ? 60% V2O5 environment at
900 �C for 100 cycles. Figure 8c, d shows.
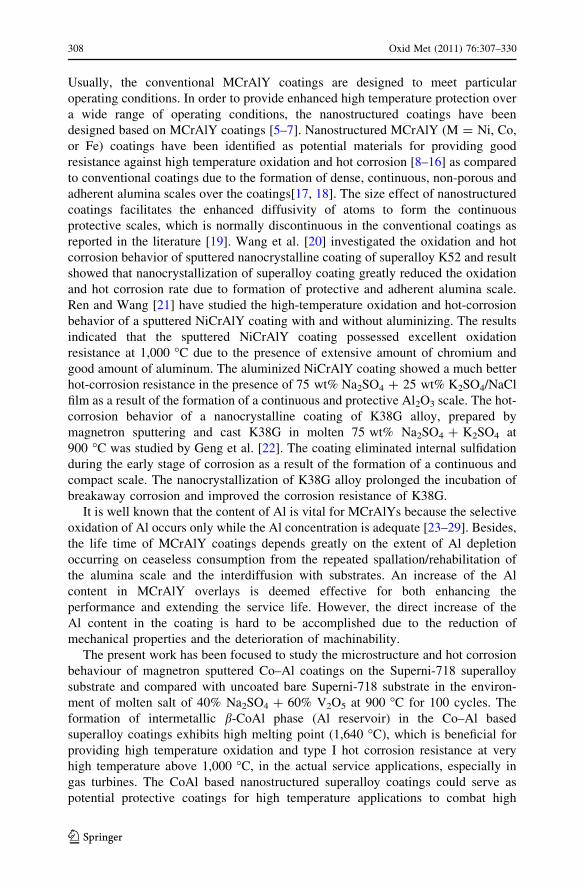
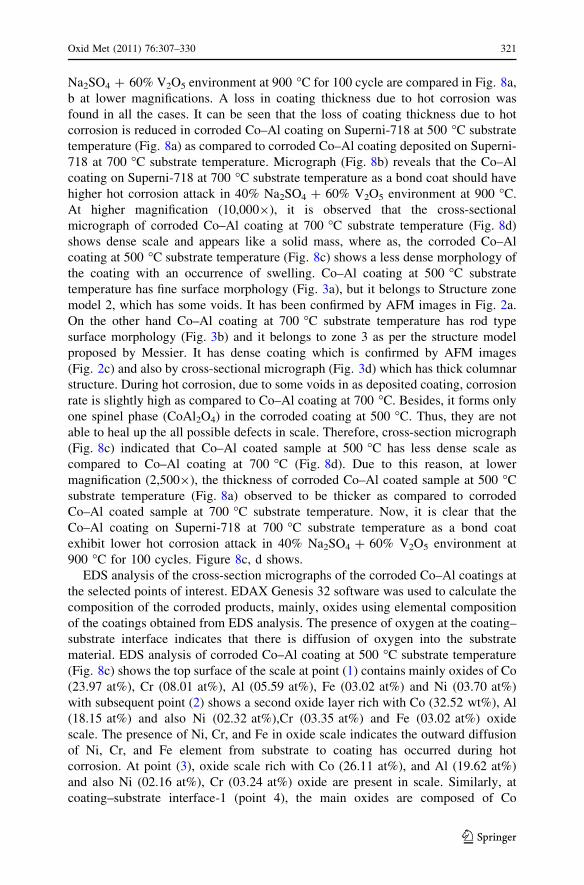
EDS analysis of the cross-section micrographs of the corroded Co–Al coatings at
the selected points of interest. EDAX Genesis 32 software was used to calculate the
composition of the corroded products, mainly, oxides using elemental composition
of the coatings obtained from EDS analysis. The presence of oxygen at the coating–
substrate interface indicates that there is diffusion of oxygen into the substrate
material. EDS analysis of corroded Co–Al coating at 500 �C substrate temperature
(Fig. 8c) shows the top surface of the scale at point (1) contains mainly oxides of Co
(23.97 at%), Cr (08.01 at%), Al (05.59 at%), Fe (03.02 at%) and Ni (03.70 at%)
with subsequent point (2) shows a second oxide layer rich with Co (32.52 wt%), Al
(18.15 at%) and also Ni (02.32 at%),Cr (03.35 at%) and Fe (03.02 at%) oxide
scale. The presence of Ni, Cr, and Fe in oxide scale indicates the outward diffusion
of Ni, Cr, and Fe element from substrate to coating has occurred during hot
corrosion. At point (3), oxide scale rich with Co (26.11 at%), and Al (19.62 at%)
and also Ni (02.16 at%), Cr (03.24 at%) oxide are present in scale. Similarly, at
coating–substrate interface-1 (point 4), the main oxides are composed of Co
Oxid Met (2011) 76:307–330 321
123

(b)(a)
1 2 3 4 50
10
20
30
40
50
Ato
m %
of
each
ele
men
ts
Point of analysis
1 2 3 4 50
5
10
15
20
25
30
35
40
45
50
55
60
Ato
m %
of
each
ele
men
ts
Point of analysis
1
2
3
4
5
(c)
1
2
3
4
5
(d)
O Fe Co Cr Ni Al
O Ni Al Co Cr Fe
322 Oxid Met (2011) 76:307–330
123

(26.99 at%), Al (15.04 at%) and Cr (05.67 at%). Further, very close to coating–
substrate interface-2 at points (5), oxide scale is rich with Co (54.23 at%), Cr
(10.66 at%) and Al (05.44 at%) and also Ni (04.03 at%) scale are present. Oxygen
content in the scale at the top surface of corroded coating is found to be 55.12 at%
and decreases rapidly up to point (2); where as, it is 40.64 at% at point (4) and then
increases up to coating–substrate interface-1 (49 at%). Subsequently, it further
decreases rapidly at point (5) at the coating–substrate interface-2 (22.91 at%).
EDS analysis of corroded Co–Al coating at 700 �C substrate temperature
(Fig. 8d) shows the top surface of the scale (point (1)) exhibiting a dense and
adherent oxide scale. At point (1), the main oxide scale is rich with Al (29.53 at%),
Co (08.25 at%) and Ni (05.44 at%) and also Fe (02.43 at%), Cr (02.72 at%) scales
are found. The presence of Ni, Cr and Fe on top of the scale indicates the outward
diffusion of substrate elements to coating has occurred during hot corrosion. In
second layer of oxide scale, at point (2), the oxide scale is rich with Al (29.01 at%),
Co (10.07 at%) and Ni (06.07 at%) and also Fe (02.88 at%) and Cr (03.34 at%)
oxide are observed. At point (3), the oxide scale is rich with Al (22.79 at%), Co
(13.72 at%), and Ni (09.73 at%) and also Fe (03.21 at%) and Cr (03.27 at%) are
present. At point (4), coating–substrate interface, the oxide scale is rich with Al
(18.02 at%), Ni (16.38 at%) and Co (10.38 at%) and also Cr (04.56 at%), Fe
(04.22 at%) oxide are present. At point (5), the scale has fallen during cutting of the
corroded sample. The oxygen content in scale at the top of surface of corroded
coating is 51.63 at% and it decreases rapidly to 46.48 at% at the coating–substrate
interface (point 4).
The following observations are made from Fig. 8c, d: (i) The over all content of
Al in the corroded Co–Al coating at 700 �C substrate temperature when it is
exposed to molten salt environment at 900 �C is high as compared to Co–Al coating
at 500 �C substrate temperature. It reveals that a loss of Al2O3 scale during fluxing
is less in corroded Co–Al at 700 �C temperature. (ii) Distribution of Co element in
corroded Co–Al coating at 700 �C is nearly same throughout the coating, from top
surface of corroded Co–Al Coating to coating–substrate interface. It suggests that
the role of Co is not only to the formation of CoO but also to formation of CoAl2O4
and CoCr2O4 spinel phase in coating. (iii) In the case of corroded Co–Al coating at
700 �C substrate temperature, Ni and Cr contents increase from top of the coating to
coating–substrate interface during hot corrosion, which indicates the formation of
second spinel phase NiCr2O4. (iv) Just after point (1). From point (2) to point (4),
Co and Cr contents in the corroded Co–Al coatings at 700 �C substrate temperature
is sufficient for the formation of third spinel phase (CoCr2O4) as observed in the
corroded coating. Due to this reason, during hot corrosion, the voids and defects
formed in Co–Al coating at 700 �C, are healed by these spinel phases. Hence, dense
scale morphology is observed in the corroded Co–Al coating at 700 �C substrate
temperature (Fig. 8d). The presence of spinel phase in the corroded Co–Al coating
Fig. 8 a, b FE-SEM cross-section micrograph at lower magnification (92,500) of corroded Co–Alcoatings on Superni-718 deposited at different substrate temperatures a at 500 �C, b at 700 �C and c,d FE-SEM cross-section micrographs (at higher magnification 910,000) with EDS profile of corrodedCo–Al coatings on Superni-718 deposited at different substrate temperatures c at 500 �C and d at 700 �C
b
Oxid Met (2011) 76:307–330 323
123

at 700 �C substrate temperature is also confirmed by XRD result (Fig. 1b). The
presence of oxygen content at coating–substrate interface (point (4)) is less, which
indicates a decrease in the diffusivity of O.
Figure 9a shows that the spallation of scale has occurred at corner in one of the
corroded Co–Al coated sample at 700 �C substrate temperature where it is clamped
during coating deposition, deposition of coating was less at this location. It is
observed that there are four layers of scales in the corroded Co–Al coated sample
(Fig. 9a) and EDS analysis was carried out at four different locations which
correspond to different layer of scale. In each layer, the oxide of Al, Co, Cr, Fe and
the spinel phase are observed. On the top layer (points 1 & 2) of scale, CoCr2O4,
CoAl2O4 and NiCr2O4 scales are observed. In the second layer of scale (point 3),
NiCr2O4 and CoCr2O4 are observed. The third layer (points 4 & 5) of scale contains
CoCr2O4 and in the fourth layer (point 6) of scale, NiCr2O4 spinel is observed. In
hot corrosion of Co–Al coated sample, Al2O3 scale is fluxed by NaVO3 and it forms
NaAlO2 phase which has a melting point around 1,785 �C, Thus, it increases the hot
corrosion resistance of coating. During cyclic hot corrosion, some defects in the
scale might form due to mismatch in coefficient of thermal expansion. Hence,
corrosive species might have diffused through these defects, which causes the
oxidation of the alloying elements in the coating as well as in the substrate. When
Cr2O3 scale is fluxed, it forms Na2CrO4 phase in the scale whose melting point is
around 765 �C, it evaporates and creates another defects in the scale. This defect is
healed by the spinel phases like CoCr2O4, CoAl2O4 and NiCr2O4 [36]. Due to this
reason, the cross-section FE-SEM micrograph (Fig. 8a–d) of corroded Co–Al
coated sample has dense and uniform scale as compared to corroded bare substrate
(Fig. 7a–c). Corroded Co–Al coated sample at 700 �C (Fig. 8d) has dense scale and
look like solid mass as compared to the corroded Co–Al coating at 500 �C (Fig. 8c)
since it has three spinel phase i.e. CoAl2O4, CoCr2O4 and NiCr2O4, beside Fe2O3
scale present as a major phase, which is confirmed by XRD (Fig. 1b) results. In case
of corroded bare substrate, dense and uniform scale is not observed on surface
(Fig. 5a, b) as well as in the cross-sectional micrograph (Fig. 7a–c) due to the
following reasons.
(i) Substrate does not have sufficient Al content (Table 1) and
(ii) There is only one spinel phase present in the scale (Fig. 1b), and it is not able
to rectify the all defects in scale, which has formed during hot corrosion.
It is evident from Fig. 9a that the spinel phase heals the defects developed during
hot corrosion and retards the diffusivity of O and S, which in turns increases the hot
corrosion resistance.
Hot Corrosion Mechanisms
The reactivity of bare and coated samples in molten salt environment can be
explained as follows:
The salts Na2SO4 and V2O5 react at 900 �C and form a low melting compound of
NaVO3 (M.P. 610 �C) as per the reaction given below [37].
324 Oxid Met (2011) 76:307–330
123

Fig. 9 FE-SEM surface micrograph of damage portion of corroded Co–Al coating on Superni-718 at700 �C substrate temperature with EDS analysis results at different location
Oxid Met (2011) 76:307–330 325
123

Na2SO4 þ V2O5 ¼ 2NaVO3 1ð Þ þ SO2 þ 1=2ð ÞO2 ð2ÞNaVO3 acts as a catalyst and also serve as an oxygen carrier to the bare
superalloy through the open pores present on the surface, which leads to the rapid
oxidation of the substrate elements and form non protective scales [38–42]. Hence,
an increase in the mass gain of the bare superalloy occurs during hot corrosion.
Also, a simultaneous dissolution of Cr2O3 could occur in the molten salt due to the
reaction [43–45] as given below;
Cr2O3 þ 4NaVO3 þ 3=2ð ÞO2 ¼ 2Na2CrO4 þ 2V2O5 ð3ÞIn case of Co–Al coatings deposited on Superni-718 substrate, diffusion of Al and
Co from the coatings, and Cr, Fe and Ni from the substrate, respectively, may occur
and subsequently get oxidized. Once these oxides of Al, Cr, Fe and spinel phases of
CoCr2O4, CoAl2O4, and NiCr2O4 are formed, it might obstruct the diffusion of
corrosive species across the coatings and stops further corrosion of coated samples.
Fig. 9 continued
326 Oxid Met (2011) 76:307–330
123

The coating is compact and adherent up to 100 cycles. The parabolic rate constant for
the bare superalloy is found to be greater than that of Co–Al coated superalloy. It can
be inferred that the nanostructured Co–Al coating provides necessary protection to
the superalloy. Particularly, Co–Al coating at 700 �C substrate temperature exhibits
a high hot corrosion resistance and provided the best protection. During the
subsequent cycles, cracks are developed in corrode bare scale as shown in Fig. 5b.
The crack has developed due to the stress build up at the scale–base metal interface,
during cooling as a result of the thermal expansion mismatch. Through these cracks,
the corrosion environment can quickly reach to the base metal and cut its way under
the scale to result in adhesion loss and spalling of scale. Similar type of cracks in base
metal (ASTM-SA213-T22 Steel) was also reported by Wang [43].
The bare substrate upon exposure to molten salt environment shows small pores,
indicating the possible escape of vaporized phases. These pores can help corroding
species to easily penetrate into the substrate and cause damage as shown in Fig. 5a,
b. The rapid increase in the mass gain was also reported for the superalloy coatings
subjected to hot corrosion studies as reported in the literature [46–49]. Further, the
formation of spinel phase could be explained due to the dissolution of NiO and
Cr2O3 in the molten salt of NaVO3, and thus facilitating the formation of mixed
oxide through the reaction given below.
NiOþ Cr2O3 ¼ NiCr2O4 spinel phaseð Þ ð4ÞDue to this spinel phase observed on the surface of corroded bare substrate, the
weight variation in bare substrate has slightly decreased after 60th cycles (Fig. 4a).
The similar observations were reported for Fe–Cr alloys oxidized in the molten salt
environment at 1,000 �C by Sadique et al. [36].
Figure 6a, b shows the surface micrographs of corroded Co–Al coatings on
superni-718 at different substrate temperature, which indicates the defect free scale
on the surface. The FE-SEM/EDS analysis of the scale on the Co–Al coated
superalloy specimens shows the presence of Cr2O3, Al2O3, Fe2O3, NiCr2O4 and
CoO. Further, CoCr2O4, CoAl2O4 (spinel phase) are formed due to the reaction
between CoO and Cr2O3, Al2O3. The presence of these oxides at the surface of
coatings decreases oxygen availability in the underlying superalloy and favor the
formation of thermodynamically stable oxide, Al2O3. The EDS results are further
supplemented by XRD analysis.
Figure 8c, d shows the Al content in the corroded Co–Al coating at 500 �C
dropped from 45.37 to 5.59 at% on surface (located by point 1 in Fig. 8c),where as
in corroded Co–Al coating at 700 �C, it dropped to 29.53 at% on surface (located by
point 1 in Fig. 8d). Similarly, in the corroded Co–Al coating at 500 �C, it dropped to
15.04 at% at coating–substrate interface (located by point 4 in Fig. 8c), where as in
corroded Co–Al coating at 700 �C, it decreased to 18.02 at% at coating–substrate
interface (located by point 4 in Fig. 8d) after 100 thermal cycles due to the inward
and outward diffusion of Al. Thus, loss of Al in corroded Co–Al coating at 700 �C
is less as compared to corroded Co–Al coating at 500 �C. Further, no spallation of
scale has occurred in both the corroded coatings. The improvement in spallation
resistance of oxide scale is believed to be related to the fine grain structure of the as
deposited coating [50].
Oxid Met (2011) 76:307–330 327
123

Co–Al coating deposited at 700 �C substrate temperature on Superni-718
exhibits higher hot corrosion resistance properties as compared to that of the
coatings deposited at 500 �C substrate temperature due to the following reasons:
(i) It is evident from the FE-SEM surface as well as cross-sectional micrographs
(Fig. 3b, d) of the Co–Al coatings deposited at 700 �C that it exhibits dense
coating, as per the zone-3 structure model. The surface and cross-sectional
morphology of the coating showed rod type and columnar structure,
respectively. It may be mentioned that the diffusivity of atoms such as Al
and Co in the coatings through columnar structure is fast, which results in the
formation of dense and defect free scale as confirmed by surface as well as
cross-sectional FE-SEM micrograph shown in Figs. 6b and 8d. Therefore, the
coatings deposited at substrate temperature of 700 �C show Al-rich and Co-
rich oxide scale shown in Fig. 6b, which inhibits the movement of anions as
well as cations.
(ii) XRD analysis (Fig. 1b) revealed that the corroded Co–Al coating deposited at
700 �C substrate temperature has three types of spinel phase on the surface of
corroded coating i.e. CoCr2O4, CoAl2O and NiCr2O4, which might have
blocked the diffusivity of corrosive reagent.
In brief, the nanostructured Co–Al coating is designed in such a way that outer
layer is rich with high aluminum and high cobalt so that it forms b-CoAl
intermetallic phases (pool of Al) and are effectively utilized to combat hot
corrosion. The resistance to hot corrosion fluxing of the Co–Al coating is greatly
enhanced at the cost of sacrificing its beneficial element (especially Al), while the
bare substrate Superni-718 exhibits poor hot corrosion resistance in molten salt of
(Na2SO4 ? 60% V2O5) environment at 900 �C, due to the shortage of aluminum
reservoir. In other words, a coating with an insufficient amount of aluminum
reservoir cannot survive for a longer duration in chemically aggressive environ-
ments at high temperature [51–54]. The low corrosion rate of nanostructured Co–Al
coatings observed in the present work is in accordance with the results of
nanocrystalline NiCrAlY coatings reported in the literature [21].
Conclusion
Microstructure and cyclic hot corrosion of nanostructured Co–Al coatings on the
superalloy substrate exposed to molten salt of (40% Na2SO4–60% V2O5)
environment at 900 �C have been investigated in the present work. The hot
corrosion kinetics of Co–Al coatings has been compared with that of the bare
Superni-718 and found that the parabolic rate constant is very less for the former,
which is due to the formation of continuous, nonporous, adherent and protective
oxide scale over the surface of the coating. The continuous mass gain of Superni-
718 is due to the spallation of initial oxide scales, renewal of fresh surface of the
materials, and the pores resulting from the evaporation of volatile impurities in the
alloy at high temperature. The XRD analysis of the corroded products of the Co–Al
coatings indicated the formation of protective oxide scale such as Cr2O3, Al2O3,
328 Oxid Met (2011) 76:307–330
123
Fe2O3, CoCr2O4, CoAl2O4, CoO and NiCr2O4. The morphological features of the
corroded coatings and bare samples were characterized by FE-SEM and it was
evident that the scales formed on the surface of coatings are adherent, continuous
and dense as compared to bare samples.
Co–Al coatings, deposited at 700 �C, showed a lower corrosion rate as compared
to that of the coatings deposited at 500 �C and bare substrate. It is due to the denser
morphology, nanosized grains (20–35 nm) of the as deposited coatings, and
pyramidal type grain morphology of scales/oxides with higher amount of alumina
(42.27 wt%). The nanostructured coatings have improved their oxidation resistance
as well as the scale-metal adherence as observed in the present work.
Acknowledgment One of the authors, Dr. R. Jayaganthan would like to thank CSIR, New Delhi, India
for their financial support to this work.
References
1. J. R. Nicholls, Journal of Materials 52, 28 (2000).
2. J. R. Nicholls, Materials Bulletin 28, 1 (2003).
3. F. H. Yuan, Z. X. Chen, Z. W. Huang, Z. G. Wang, and S. J. Zhu, Corrosion Science 50, 1608 (2008).
4. Y. N. Wu, P. L. Ke, Q. M. Wang, C. Sun, and F. H. Wang, Corrosion Science 46, 2925 (2004).
5. J. R. Nicholls, N. J. Simms, W. Y. Chan, and H. E. Evans, Surface and Coating Technology 149, 236
(2002).
6. M. H. Guo, Q. M. Wang, J. Gong, C. Sun, R. F. Huang, and L. S. Wen, Corrosion Science 48, 2750
(2006).
7. S. M. Jiang, X. Peng, Z. B. Bao, S. C. Liu, Q. M. Wang, J. Gong, and C. Sun, Corrosion Science 50,
3213 (2008).
8. Z. Liu, W. Gao, and M. Li, Oxidation of Metals 51, 403 (1999).
9. Z. Liu, W. Gao, and Y. He, Materials Science and Technology 15, 1447 (1999).
10. W. Gao, Z. Liu, and Z. Li, Advanced Materials 13, 1001 (2001).
11. A. Rahman, R. Jayaganthan, S. Prakash, V. Chawla, and R. Chandra, Journal of Alloys and Com-pounds 472, 478 (2009).
12. A. Rahman, R. Jayaganthan, S. Prakash, V. Chawla, and R. Chandra, Surface Engineering (2008, in
press). doi:10.1179/026708408x339064.
13. A. Rahman, V. Chawla, R. Jayaganthan, R. Chandra, and R. Ambardar, Oxidation of Metals 74, 341
(2010).
14. A. Rahman, V. Chawla, R. Jayaganthan, R. Chandra, and R. Ambardar, Materials Chemistry andPhysics 126, 253 (2011).
15. S. Geng, F. Wang, S. Zhu, and W. Wu, Oxidation of Metals 57, 549 (2002).
16. C. Zhang, X. Peng, J. Zhao, and F. Wang, Journal of Electrochemical Society 152, B321 (2005).
17. N. S. Cheruvu, R. Wei, M. R. Govindaraju, and D. W. Gandy, Oxidation of Metals 73, 493 (2010).
18. D. P. Whittle, in High Temperature Alloys for Gas Turbines, eds. D. Coutsouradis, P. Felix, H.
Fischmeister, L. Habraken, Y. Linblon, and M. O. Speidel (Applied Science Publishers Ltd, London,
1978), p. 209.
19. S. Geng, F. Wang, and S. Zhang, Surface and Coating Technology 167, 212 (2003).
20. F. Wang, X. Tian, Q. Li, L. Li, and X. Peng, Thin Solid Films 516, 5740 (2008).
21. X. Ren and F. Wang, Surface and Coatings Technology 201, 30 (2006).
22. S. Geng, F. Wang, S. Zhu, and W. Wu, Oxidation of Metals 57, 549 (2002).
23. M. P. Brady, B. Gleeson, and I. G. Wright, Journal of Materials 52, 16 (2000).
24. S. Suresh, Corrosion Science 292, 2447 (2001).
25. M. K. Hossain and S. R. J. Saunders, Oxidation of Metals 12, 1 (1978).
26. Q. M. Wang, Y. N. Wu, P. L. Ke, H. T. Cao, J. Gong, C. Sun, and L. S. Wen, Surface and CoatingTechnology 186, 389 (2004).
27. D. Deb, S. R. Iyer, and V. M. Radhakrishnan, Material Letters 29, 19 (1996).
Oxid Met (2011) 76:307–330 329
123

28. M. J. Pomeroy, Materials and Design 26, 223 (2005).
29. Z. B. Bao, Q. M. Wang, W. Z. Li, X. Liu, J. Gong, T. Y. Xiong, and C. Sun, Corrosion Science 51,
860 (2009).
30. N. S. Cheruvu, R. Wei, M. R. Govindaraju, and D. W. Gandy, in American Society of MechanicalEngineers: Pressure Vessel Piping Conference, Prague, Czech Republic, July, 2009.
31. Z. Liu, W. Gao, K. L. Dahm, and F. Wang, Acta Materialia 46, 1691 (1998).
32. F. Wang and H. Lou, Oxidation of Metals 45, 39 (1996).
33. F. Wang, Oxidation of Metals 48, 215 (1997).
34. D. Zou, D. Yan, L. Xiao, and Y. Dong, Surface and Coating Technology 202, 1928 (2008).
35. R. Messier, A. P. Giri, and R. A. Roy, Journal of Vacuum Science and Technology A 2, 500 (1984).
36. S. E. Sadique, A. H. Mollah, M. S. Islam, M. M. Ali, M. H. H. Megat, and S. Basri, Oxidation ofMetals 54, 385 (2000).
37. G. A. Kotla, I. F. Hewaidy, and N. S. Felix, Thermochimica Acta 4, 151 (1972).
38. N. S. Bornstein and M. A. DeCrescente, Metallurgical Transaction 2, 2875 (1971).
39. N. S. Bornstein and M. A. DeCrescente, Metallurgical Transaction 4, 1799 (1973).
40. J. A. Goebel, F. S. Pettit, and G. W. Gowar, Metallurgical Transaction 4, 261 (1973).
41. D. K. Gupta and R. A. Rapp, Journal of Electrochemical Society 127, 2194 (1980).
42. Y. S. Zhang and R. A. Rapp, Journal of Electrochemical Society 132, 2498 (1985).
43. D. Wang, Surface and Coating Technology 36, 49 (1988).
44. G. R. Heath, P. Heimgarther, G. Irons, R. Miller, and S. Gustafsson, Material Science Forum251–254, 809 (1997).
45. M. Seiersten and P. Kofstad, High Temperature Technology 5, 115 (1987).
46. T. S. Sidhu, S. Prakash, and R. D. Agrawala, Surface and Coating Technology 201, 792 (2006).
47. H. Singh, D. Puri, and S. Prakash, Surface and Coating Technology 192, 27 (2005).
48. S. N. Tiwari and S. Prakash, in A Symposium on Localized Corrosion and Environmental Cracking(SOLCEC), Kalpakkam, India (1997), C-33.
49. A. Ul-Hamid, Materials Chemistry and Physics 80, 135 (2003).
50. N. S. Cheruvu, R. Wei, M. R. Govindaraju, and D. Gandy, Surface and Coatings Technology 204,
751 (2009).
51. R. A. Rapp, Corrosion Science 44, 209 (2002).
52. Y. S. Hwang and R. A. Rapp, Journal of Electrochemical Society 137, 1276 (1990).
53. R. A. Rapp, Corrosion-NACE 42, 568 (1986).
54. S. M. Jiang, H. Q. Li, J. Ma, C. Z. Xu, J. Gong, and C. Sun, Corrosion Science 52, 2316 (2010).
330 Oxid Met (2011) 76:307–330
123
Copyright © 2022 FDOKUMEN