Cortical Plasticity Induced by Spike-Triggered Microstimulation in Primate Somatosensory Cortex
Microstimulation of area V4 has little effect on spatial attention and onperception of phosphenes evoked in area V1
Bruno Dagnino,1* Marie-Alice Gariel-Mathis,1* and Pieter R. Roelfsema1,2,3
1Department of Vision and Cognition, Netherlands Institute for Neuroscience (an institute of the Royal Academy of Artsand Sciences of the Netherlands), Amsterdam, The Netherlands; 2Department of Integrative Neurophysiology, Center forNeurogenomics and Cognitive Research, VU University, Amsterdam, The Netherlands; and 3Psychiatry Department,Academic Medical Center, Amsterdam, The Netherlands
Submitted 2 September 2014; accepted in final form 7 November 2014
Dagnino B, Gariel-Mathis MA, Roelfsema PR. Microstimulationof area V4 has little effect on spatial attention and on perception ofphosphenes evoked in area V1. J Neurophysiol 113: 730–739, 2015.First published November 12, 2014; doi:10.1152/jn.00645.2014.—Previous transcranial magnetic stimulation (TMS) studies suggestedthat feedback from higher to lower areas of the visual cortex isimportant for the access of visual information to awareness. However,the influence of cortico-cortical feedback on awareness and the natureof the feedback effects are not yet completely understood. In thepresent study, we used electrical microstimulation in the visual cortexof monkeys to test the hypothesis that cortico-cortical feedback playsa role in visual awareness. We investigated the interactions betweenthe primary visual cortex (V1) and area V4 by applying microstimu-lation in both cortical areas at various delays. We report that themonkeys detected the phosphenes produced by V1 microstimulationbut subthreshold V4 microstimulation did not influence V1 phosphenedetection thresholds. A second experiment examined the influence ofV4 microstimulation on the monkeys’ ability to detect the dimming ofone of three peripheral visual stimuli. Again, microstimulation of agroup of V4 neurons failed to modulate the monkeys’ perception of astimulus in their receptive field. We conclude that conditions existwhere microstimulation of area V4 has only a limited influence onvisual perception.
phosphenes; visual cortex; area V1; area V4; visual awareness; cor-tico-cortical feedback
THE QUESTION of how visual awareness emerges in our brain isone of the major challenges that remain to be addressed inneuroscience. There is not yet a consolidated theory of howvisual percepts reach awareness (Dehaene et al. 2006; Lamme2003; Zeki 2003). One influential theory posits that informa-tion reaches consciousness when it ignites reciprocal interac-tions between multiple brain areas (Edelman 1987) that allowsharing of information in a global workspace (Dehaene et al.2003; Dehaene and Changeux 2011). Feedback connectionsmight be important for this process, as they can amplifyneuronal activity in the lower areas gating the access toconsciousness (Dehaene and Changeux 2011; Lamme andRoelfsema 2000; Super et al. 2001). Neurophysiological ex-periments have implicated cortico-cortical feedback in visualawareness (Super et al. 2001), figure-ground segregation(Lamme et al. 1998; Super et al. 2001), and shifts of visual
attention (Moore et al. 2003; Moore and Fallah 2001, 2004;Noudoost and Moore 2011; Roelfsema et al. 1998). Specifi-cally, neuronal responses in primary visual cortex (V1) areenhanced by feedback connections if a monkey detects a figureon a background (Lamme et al. 1998; Poort et al. 2012), butthis amplification does not occur if the monkey fails to perceivethe figure (Super et al. 2001).
Transcranial magnetic stimulation (TMS) experiments pro-vided additional support for the role of feedback connections inawareness. Silvanto et al. (2005) applied TMS to V1 to evokephosphenes, artificial percepts of light. They showed that anadditional subthreshold TMS pulse in motion-sensitive area V5increases the probability of detecting a moving phospheneinstead of a stationary one, but only if it precedes V1-TMS by10–50 ms, in accordance with a role of feedback connections.At the same time, V1-TMS can also interfere with the percep-tion of phosphenes that are evoked by V5-TMS (Pascual-Leone and Walsh 2001). This interference effect was onlyobserved if V5-TMS preceded V1-TMS, again suggesting arole for feedback connections.
Our main experiment was modeled after these TMS exper-iments, but we applied microstimulation (MS) in two areas ofthe visual cortex of monkeys. The advantage of MS is that thetechnique activates a more circumscribed population of neu-rons (Histed et al. 2009; Schiller and Tehovnik 2008; Tehovnik1996; Tehovnik et al. 2005). Will subthreshold MS in a highervisual area influence the perception of phosphenes evoked withMS in V1? If it does, we could test the effect of V4-MS onneuronal activity in V1 to investigate how feedback connec-tions contribute to visual awareness.
In a first experiment we applied subthreshold MS in area V4in a task in which monkeys had to detect a phosphene evokedby MS of V1 neurons with overlapping receptive fields (RFs).We expected that V4-MS would modulate the perception ofphosphenes elicited by V1-MS. To our surprise, even thoughfeedback connections from V4 to V1 have a strength that iscomparable to that of those from MT to V1 (Markov et al.2011), we observed no effect of V4-MS on the phosphenedetection threshold in V1. The activity of neurons in area V4also provides a sensitive measure for where monkeys directtheir attention (Cohen and Maunsell 2010, 2011). We thereforetested whether V4-MS influences the distribution of spatialattention across a visual stimulus in a contrast change detectiontask as has been observed with MS of the frontal eye fields(FEF) (Moore and Fallah 2001). However, we also did notobserve any effect of V4-MS in this task. Our results imply that
* B. Dagnino and M.-A. Gariel-Mathis contributed equally to this work.Address for reprint requests and other correspondence: P. R. Roelfsema,
Dept. of Vision and Cognition, Netherlands Inst. for Neuroscience, Meiberg-dreef 47, 1105 BA, Amsterdam, The Netherlands (e-mail: [email protected]).
J Neurophysiol 113: 730–739, 2015.First published November 12, 2014; doi:10.1152/jn.00645.2014.
730 0022-3077/15 Copyright © 2015 the American Physiological Society www.jn.org
on February 5, 2015
Dow
nloaded from

there are conditions where V4-MS influences neither the de-tection of V1-evoked phosphenes nor the distribution of visualattention.
METHODS
Surgeries and mapping. Two male monkeys (monkeys B and C)participated in this study. In a first operation, a head holder wasimplanted. In a separate surgery, arrays of 4 � 5 or 5 � 5 electrodes(Blackrock) with a thickness of 80 �m and a length of 1 or 1.5 mmwere chronically implanted in areas V1 and V4. The surgical proce-dures were performed under aseptic conditions and general anesthesia,complied with the National Institutes of Health Guide for the Careand Use of Laboratory Animals, and were approved by the Institu-tional Animal Care and Use Committee of the Royal NetherlandsAcademy of Arts and Sciences. Details of the surgical procedures andthe postoperative care have been described elsewhere (Poort et al.2012; Super and Roelfsema 2005).
We measured the RF dimensions of every V1 recording site bydetermining the onset and offset of the response to a slowly movinglight bar for each of four movement directions (Kato et al. 1978).V4-RFs were mapped by presenting white squares (1° � 1°) on a graybackground at different positions of a grid (1° spacing).
Microstimulation. For MS, we used trains of negative-first biphasicpulses of 400-�s duration (200 �s per phase) at a frequency of 200 Hzthrough one of the electrodes in V1/V4, using a custom-made two-channel constant-current stimulator. We varied the amplitude andnumber of pulses (we used different numbers of pulses in the 2 tasks,see below), but all currents stayed within the range of 5–250 �A. Wetested the impedance of the stimulated electrodes before every sessionand obtained values between 40 and 280 k� (mean 107 k�, SD 62k�). Even though unlikely, to rule out any changes in impedance overdays due to the MS, we checked in monkey C whether there was asignificant change in impedance across sessions. The mean differencebetween successive sessions was �13.7 � 12.6 k� (mean � SE, i.e.,a small decrease in impedance), but it was not significantly differentfrom zero (P � 0.1, t11 � �1.09).
Behavioral setup. The monkeys performed both tasks while seatedat a distance of 75 cm from a 21-in. CRT monitor with a refresh rateof 70 Hz (phosphene detection task) or 100 Hz (dimming detectiontask) and a resolution of 1,024 � 768 pixels. The eye position wasmonitored with a video-based eye tracker (Thomas Recording) andsampled at 250 Hz. A trial was initiated when the monkey hadmaintained his gaze for 300 ms within a (virtual) fixation window,1.5° in diameter, centered on the fixation point. The monkey obtaineda juice reward at the end of each correct trial.
Phosphene detection task. To estimate the phosphene detectionthreshold we used a yes/no forced-choice, delayed-saccade task (Fig.1A). On each trial we presented a fixation point in the center of thescreen (size of 0.3° of visual angle) and a “catch dot” in the periphery(size of 0.3° of visual angle). We randomly selected 50% of the trialsas MS trials, and on those trials we delivered a train of MS pulses after300 ms of fixation to elicit a phosphene at the location of the RF of thestimulated electrode. The other 50% of trials were catch trials withoutMS. In both conditions the monkeys were required to maintainfixation during an additional delay of 500 ms. After this delay thefixation dot turned blue, cuing the monkeys to make a saccade. Theadditional delay excludes reflexive saccades that might be elicited bythe direct activation of motor structures like the superior colliculus(Tehovnik et al. 2003, 2005). The monkeys reported the detection ofa phosphene by making a saccade to the location of the RF and theabsence of a phosphene by making a saccade to the catch dot. The trialwas considered correct only if the monkey reported a phosphene inMS trials or made an eye movement to the catch dot in catch trials,and incorrect otherwise. The monkeys obtained a juice reward afterevery correct trial.
Before they could perform this task, the monkeys were trained ona very similar task, in which they had to report the presence of a visualstimulus that was flashed for 20 ms on 50% of the trials. The stimuliwere presented at various positions on the screen, and we decreasedtheir luminance as the monkeys became better in the task. Trainingwith visual stimuli was continued until the monkeys’ accuracy washigher than 80% with very dim targets. This training phase took �1.5mo. We then replaced the visual stimuli by MS. We interleaved blocksof visual stimulation trials with blocks of V1-MS trials so that themonkeys would learn to also make saccadic eye movements to thephosphene locations. We gradually reduced the number of visualstimulation blocks until the monkeys reliably detected the V1 phos-phenes. This transition from visual to electrical stimulation wascompleted in 2 wk. Once the V1-MS training was completed werepeated the procedure with V4-MS. First, we presented visual stimuliwith different shapes (circles, ellipses, and squares), colors (red, blue,green, and gray), and sizes (between 3° and 6° of visual angle) so thatthe monkeys learned to make saccades to a variety of visual stimuli.This training phase was completed in �3 wk. In the last phase, whichtook �2 wk, we interleaved blocks of visual stimulation with blocksof V4-MS until the monkeys reliably detected the V4 phosphenes.
To determine the threshold for the electrical stimulation we variedthe amplitude of the electrical MS, using a Bayesian adaptive psy-chometric method called QUEST (Watson and Pelli 1983) set todetermine a threshold of 80% correct. To increase the robustness ofthe estimation we did not use every single correct or incorrect answeras input to the QUEST, but we introduced a counter for both correctand incorrect MS trials. Every time there was a correct or incorrectMS trial, we incremented the corresponding counter. Once either ofthe counters reached a value of 2, the QUEST was updated and bothcounters were set to 0. The update of the QUEST was done in thefollowing manner: if the correct trial counter reached 2 first, thenthe QUEST was fed with a value of 1, meaning that it should decreasethe amplitude of MS. If the counter of incorrect trials was the firstone to reach a value of 2, the QUEST was fed with a value of 0,indicating that it should increase the current. After 15 reversals (areversal being a change in the monotonicity of the series of successivecurrent amplitudes) the QUEST stopped and the threshold was com-puted as the mean of the last 10 reversals.
In each session we tested a combination of one V4 electrode andone V1 electrode with overlapping RFs. First we measured thethreshold for phosphene detection for the V4 electrode, with three(monkey C) or four (monkey B) pulses with a separation of 5 ms (200Hz). We used one pulse extra in monkey B to keep the currentthresholds below 100 �A. We here used a small number of pulses inV1 and V4 to keep the stimulus temporally concise, which is bene-ficial for comparing the results to the previous TMS studies, whichused a single pulse per brain region.
The average V4 threshold was 51 � 33 �A (mean � SD). We thendetermined the phosphene detection threshold for the electrode in V1(5 pulses). Of all trials, 50% were V1-MS trials and the other 50%were catch trials without V1-MS. There were 11 conditions forV1-MS trials. Ten of these conditions combined the train of pulses inV1 (evoking the phosphene) with V4-MS at 50% of the V4 threshold(measured at the start of the session) at different stimulus-onsetasynchronies (SOAs) so that V4-MS either preceded or followedV1-MS. V4-MS was between �68 ms and 22 ms after V1-MS in stepsof 10 ms (“V4-V1” conditions). The 11th condition monitored thephosphene detection threshold in V1 without V4 stimulation (“V1-only” condition). The average threshold in this condition was 32 � 18�A. These 11 QUEST procedures ran in parallel, in a randomlyinterleaved fashion.
Of the catch trials, 90% were without any MS and the animal wasrequired to make a saccade to the catch dot. In the other 10% of catchtrials we only stimulated V4 to investigate whether the V4-MS at 50%of the threshold could elicit a phosphene by itself. In these trials themonkeys were also rewarded for eye movements to the catch dot, just
731MICROSTIMULATION IN V1/V4 FOR PHOSPHENE INDUCTION
J Neurophysiol • doi:10.1152/jn.00645.2014 • www.jn.org
on February 5, 2015
Dow
nloaded from
as in the regular catch trials, and no reward was given for making asaccade toward the RF of the V4 stimulation site. We refer tosubthreshold V4-MS trials in which the monkey made an erroneoussaccade to the overlapping V1/V4-RFs as “V4 false alarm responses.”The monkeys were required to only make saccades to the V1/V4-RFlocation upon V1-MS. To investigate the influence of V4-MS on catchtrials, we computed the standard false positive rate (FPR) on regularcatch trials as the percentage of catch trials in which the monkeysreported a phosphene and the V4-FPR as the percentage of subthresh-old V4-MS trials in which monkeys reported a phosphene.
We collected a total of 15 sessions in monkey B and 16 sessions formonkey C. On average, every session had 815 � 108 trials. Figure 2Aillustrates the V1-RFs that have been superimposed on the V4-RFs.On every test day we used a different electrode combination. For each
SOA, threshold values either lower or higher than 5 times the standarderror across sessions were considered outliers and removed from theanalysis. On average, 15% of the single-session thresholds wereremoved.
d-Prime. To compute the d-prime we used the MATLAB toolboxPalamedes (Prins and Kingdom 2009). First, for each session, wefitted a psychometric function for both V1-only (the data from thethreshold with stimulation in V1 only) and V4-V1 (the data from allthe V4-V1 SOAs together) conditions with a logistic function, addingthe FPR (for the V1-only condition) and V4-FPR (for the V4-V1condition) as data points with zero current, providing an accuratemeasure of the false alarm rate. Thus the psychometric functionsexpressed d-prime as a function of stimulation current for everysession, and we then averaged across sessions, clipping d-prime
MS
Receptive Field
Fixation CatchMicro-Stimulation Trials
Micro-Stimulation Trials
Catch Trials
Catch Trials
300ms
800ms
0ms
A
C D
−14 −12 −10 −8 −6 −4 −2−9
−7
−5
−3
−1
1
3
Horizontal Position [deg]
Verti
cal P
ositi
on [d
eg]
B
SOA = -38msV1 Alone
C
0 0.1 0.2 0.3 0.4 0.5 0.6 0.7 0.8 0.9 1
Cur
rent
[µA
]
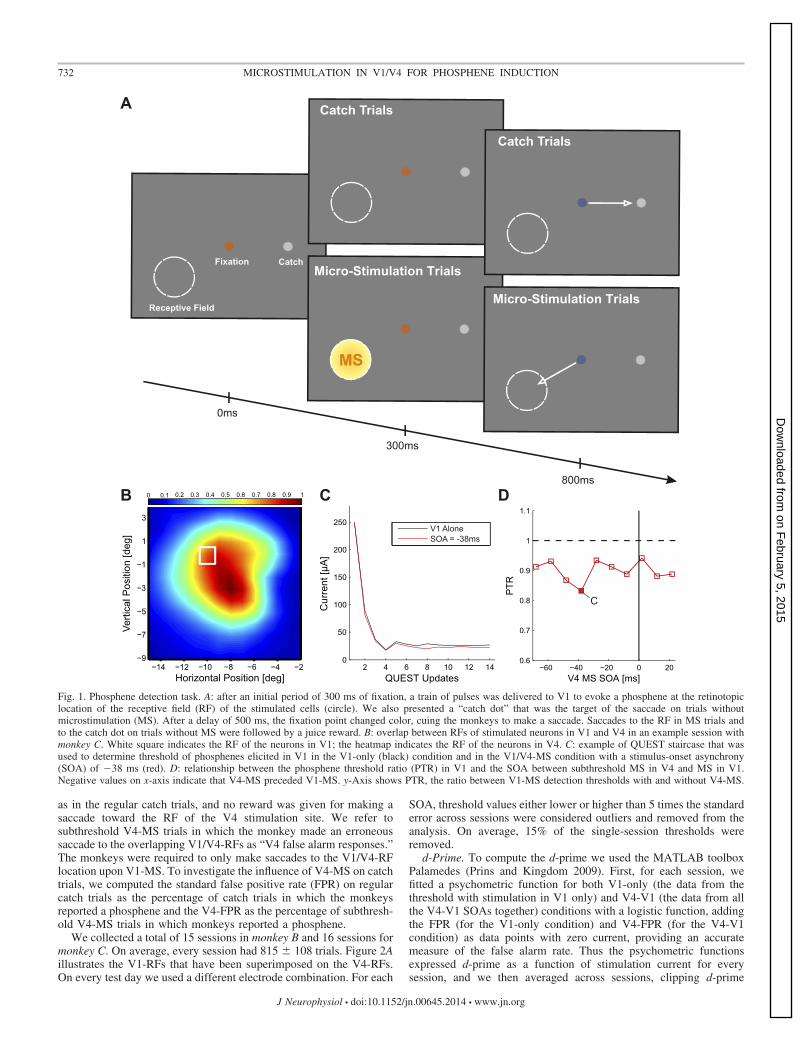
Fig. 1. Phosphene detection task. A: after an initial period of 300 ms of fixation, a train of pulses was delivered to V1 to evoke a phosphene at the retinotopiclocation of the receptive field (RF) of the stimulated cells (circle). We also presented a “catch dot” that was the target of the saccade on trials withoutmicrostimulation (MS). After a delay of 500 ms, the fixation point changed color, cuing the monkeys to make a saccade. Saccades to the RF in MS trials andto the catch dot on trials without MS were followed by a juice reward. B: overlap between RFs of stimulated neurons in V1 and V4 in an example session withmonkey C. White square indicates the RF of the neurons in V1; the heatmap indicates the RF of the neurons in V4. C: example of QUEST staircase that wasused to determine threshold of phosphenes elicited in V1 in the V1-only (black) condition and in the V1/V4-MS condition with a stimulus-onset asynchrony(SOA) of �38 ms (red). D: relationship between the phosphene threshold ratio (PTR) in V1 and the SOA between subthreshold MS in V4 and MS in V1.Negative values on x-axis indicate that V4-MS preceded V1-MS. y-Axis shows PTR, the ratio between V1-MS detection thresholds with and without V4-MS.
732 MICROSTIMULATION IN V1/V4 FOR PHOSPHENE INDUCTION
J Neurophysiol • doi:10.1152/jn.00645.2014 • www.jn.org
on February 5, 2015
Dow
nloaded from
values larger than 4 to a value of 4 because these very high d-primevalues depended strongly on the presence of one or a few errors.
Dimming detection task. To test the influence of V4-MS in adistributed attention task, we trained the monkeys to perform athree-alternative forced-choice task, in which they had to detect thedimming (transient decrease in luminance) of one of three bars (5° �0.21° of visual angle). One bar was presented in the RF of one of theV4 electrodes and the other two at the same eccentricity but at aposition rotated by 120° around the fixation point. We also presentedline elements in the background. These background line elements hadthe same luminance of 47.6 cd/m2 as the target bars (background: 11cd/m2) and a length of 1°, a width of 0.05°, and randomized orienta-
tion and were spaced by 0.5° in both vertical and horizontal directions,with a randomized jitter on their central position based on a normaldistribution with a SD of 0.2°. The background line elements coveredthe whole screen except from a region of 1° surrounding the threetarget bars. We started each session by measuring the V4 phosphenethreshold with 20 pulses (200 Hz, total duration 100 ms) at the testedV4 electrode. After the initial 300 ms of fixation, we presented thethree bars and the background (Fig. 3A). The task of the monkey wasto detect the dimming of one of the three bars by making an eyemovement to it between 100 and 500 ms after the dimming occurred.Reaction times shorter than 100 ms were counted as false alarms. Allbars were equally likely to dim, but only one did so on each trial, after
Horizontal position (deg)
V)ged(
noitisoplacitre
00.05
0.10.15
0.20.25
Monkey C
Monkey B
FPR V4 FPR
Fals
e P
ositi
ve R
ate
00.05
0.10.15
0.20.25
Fals
e P
ositi
ve R
ate
0 50 1000
1
2
3
4
d−pr
ime
0 50 1000
1
2
3
4
d−pr
ime
V1 current [µA]
C D
V1-Only V4-V1
Monkey B
Monkey C
−60 −40 −20 0 200.4
0.6
0.8
1
1.2
1.4
Monkey CMonkey B
V4 MS SOA [ms]
D-p
rime
Thre
shol
d R
atio
(DTR
)E
B
Pho
sphe
ne T
hres
hold
Rat
io (P
TR)
−60 −40 −20 0 200.6
0.7
0.8
0.9
1
1.1
1.2
V4 MS SOA [ms]
A
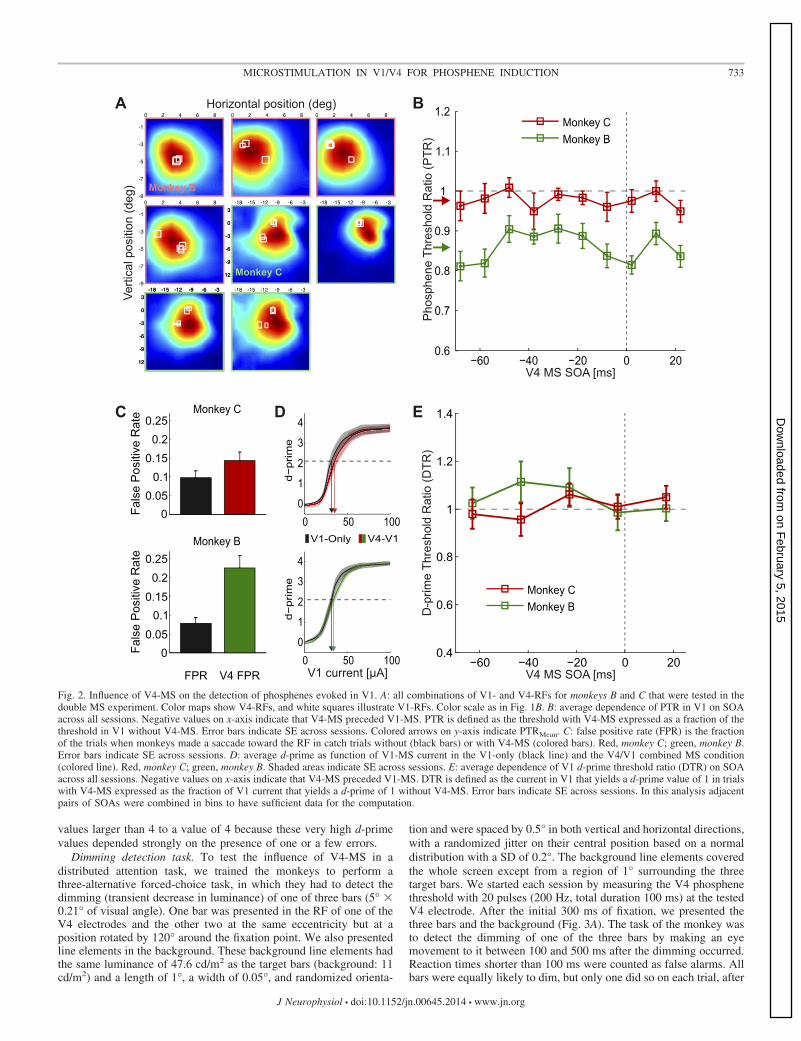
Fig. 2. Influence of V4-MS on the detection of phosphenes evoked in V1. A: all combinations of V1- and V4-RFs for monkeys B and C that were tested in thedouble MS experiment. Color maps show V4-RFs, and white squares illustrate V1-RFs. Color scale as in Fig. 1B. B: average dependence of PTR in V1 on SOAacross all sessions. Negative values on x-axis indicate that V4-MS preceded V1-MS. PTR is defined as the threshold with V4-MS expressed as a fraction of thethreshold in V1 without V4-MS. Error bars indicate SE across sessions. Colored arrows on y-axis indicate PTRMean. C: false positive rate (FPR) is the fractionof the trials when monkeys made a saccade toward the RF in catch trials without (black bars) or with V4-MS (colored bars). Red, monkey C; green, monkey B.Error bars indicate SE across sessions. D: average d-prime as function of V1-MS current in the V1-only (black line) and the V4/V1 combined MS condition(colored line). Red, monkey C; green, monkey B. Shaded areas indicate SE across sessions. E: average dependence of V1 d-prime threshold ratio (DTR) on SOAacross all sessions. Negative values on x-axis indicate that V4-MS preceded V1-MS. DTR is defined as the current in V1 that yields a d-prime value of 1 in trialswith V4-MS expressed as the fraction of V1 current that yields a d-prime of 1 without V4-MS. Error bars indicate SE across sessions. In this analysis adjacentpairs of SOAs were combined in bins to have sufficient data for the computation.
733MICROSTIMULATION IN V1/V4 FOR PHOSPHENE INDUCTION
J Neurophysiol • doi:10.1152/jn.00645.2014 • www.jn.org
on February 5, 2015
Dow
nloaded from

a random time between 200 and 900 ms after the presentation of thestimulus. The dimming lasted for 100 ms, and on MS trials (50% ofthe trials) the dimming took place immediately after the 100-ms MStrain applied to a V4 electrode with a RF that overlapped with one ofthe bars (comparable to Moore and Fallah 2001). We used anamplitude that was half of the V4 phosphene detection threshold. Wealso carried out a few sessions with suprathreshold V4 stimulation. Inthese sessions we set the current at 200% of the V4 phosphenedetection threshold.
Because the temporal expectation of an event can modulate per-ceptual processing (Vangkilde et al. 2012), we maintained a constanthazard rate for the dimming event. Specifically, we used an exponen-tial distribution of dimming times between 200 and 900 ms. Inaddition, 10% of the trials were “long” trials with a dimming time of1,200 ms. As a result, the hazard rate was constant between 200 and900 ms. If the dimming had not yet occurred at 900 ms, however, italways occurred at 1,200 ms, but these long trials were not includedin the analysis.
During the experiment we measured the luminance change thresh-old for detection of the dimming (in % of bar luminance) with andwithout MS, separately for each bar. We used a 3 up/1 down staircaseprocedure, and the 6 staircases (3 bars � MS or no MS) were run in
parallel (with trials interleaved). The gamma-corrected RGB lumi-nance of the bar was 47.6 cd/m2, and the eight luminance values forthe dimmed bars were 29.4, 31.9, 34.3, 36.7, 39.2, 41.6, 44, and 46.4cd/m2.
Statistical tests. All statistical tests were performed with MATLABstandard functions. Unless noted otherwise, all t-tests were one-sample, two-tailed tests. Paired t-tests were also two-tailed. We useda one-way ANOVA to assess the influence of SOA in the phosphenedetection task.
RESULTS
Influence of V4 microstimulation on phosphenes induced inarea V1. Our first experiment investigated how interactionsbetween areas of the visual cortex influence the detection ofphosphenes and was modeled after previous TMS studies onthe interaction between higher and lower areas of the visualcortex (Pascual-Leone and Walsh 2001; Silvanto et al. 2005).We trained two monkeys to detect a phosphene elicited bysuprathreshold MS of an electrode of one of the chronicallyimplanted arrays in V1 and to report the phosphene by making
Blank MS0
5
10
15
20
25
Lum
inan
ce C
hang
e [%
]
Stimulation Condition
A
Time
300ms
200 - 900ms
Stimuli
Fixation
100ms 400ms
MS (50%)
Dimming
SaccadeBlank (50%)
100ms
V4 RF
B C D
−14 −9 −4−9
−5
−1
3
Horizontal Position [deg]
Verti
cal P
ositi
on [d
eg]
Monkey C
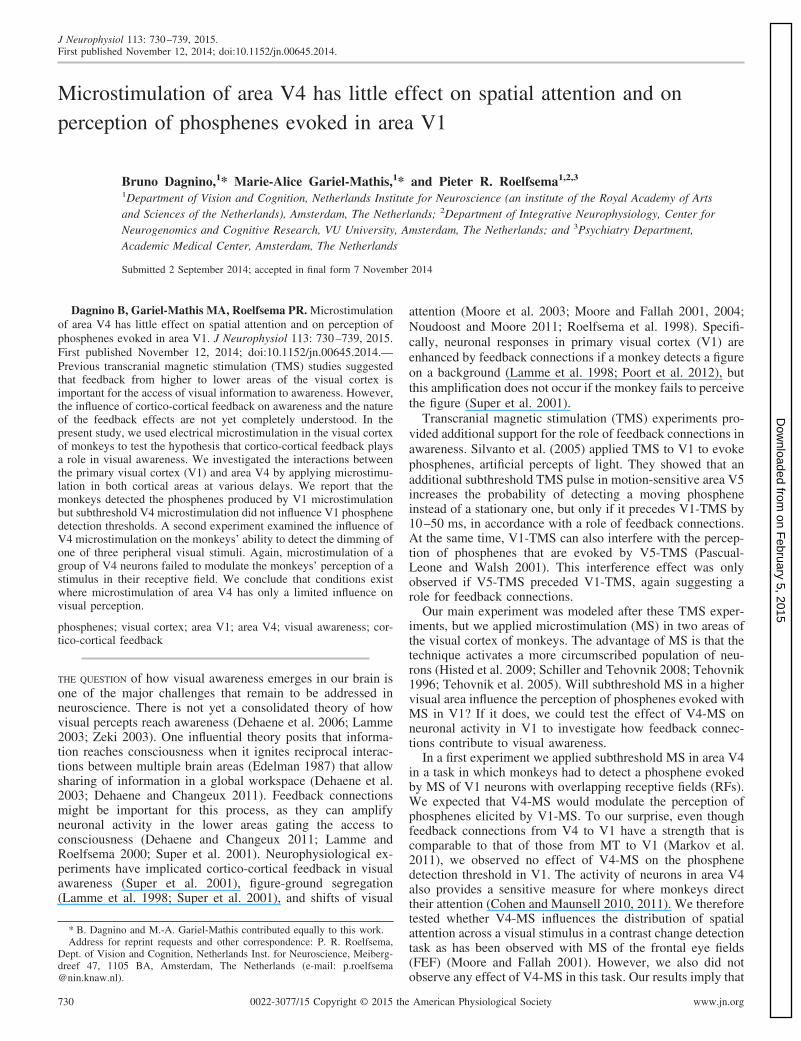
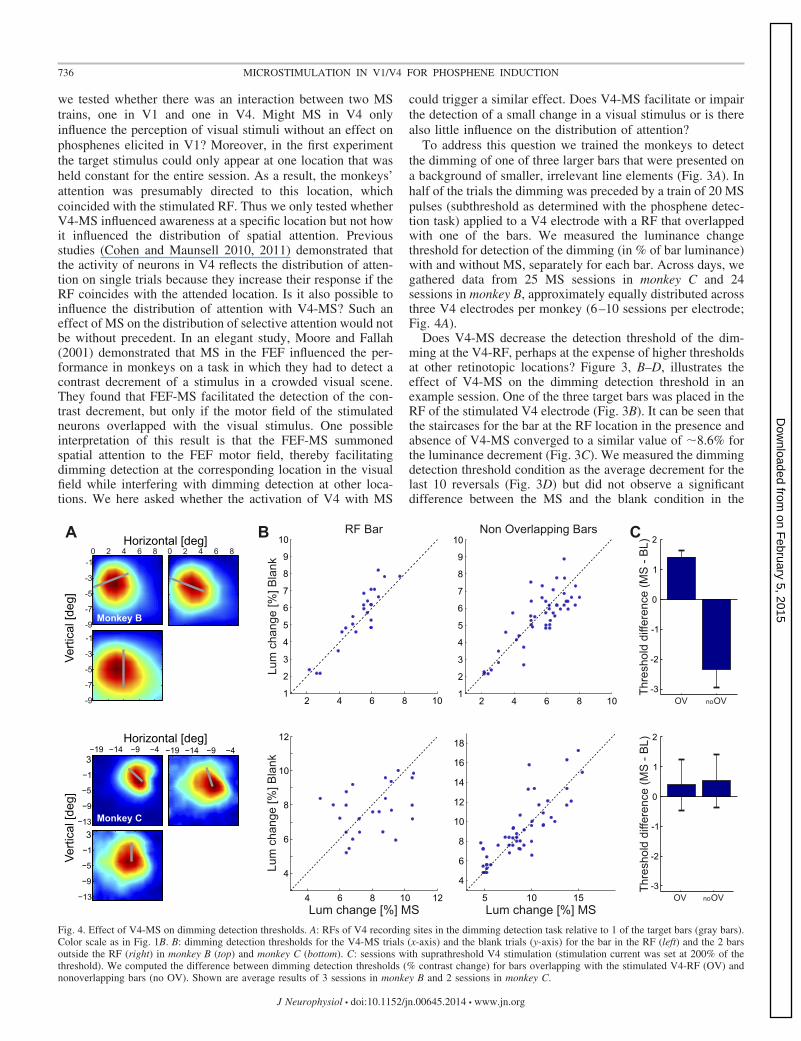
Fig. 3. Dimming detection task. A: after 300 ms of fixation, 3 larger bars were presented among smaller distractor bars. One of the larger bars overlapped witha V4-RF. In half of the trials a train of 20 pulses (total duration 100 ms) with a current corresponding to 50% of the phosphene detection threshold was deliveredto V4. After the end of the pulse train, 1 of the bars dimmed for 100 ms and monkeys had to make a saccade toward this bar. The luminance decrement wascontrolled by a staircase that kept performance at 79.4%. B: overlap between the RF of the stimulated V4 recording site and the bar in an example session. Colorscale as in Fig. 1B. C: staircases of an example session, both for the blank (i.e., no MS) and the MS condition with a bar in the stimulated V4-RF. D: thresholdsfor blank and MS conditions of the example session computed as the mean of the last 15 reversals. Error bars indicate SE of the staircases.
734 MICROSTIMULATION IN V1/V4 FOR PHOSPHENE INDUCTION
J Neurophysiol • doi:10.1152/jn.00645.2014 • www.jn.org
on February 5, 2015
Dow
nloaded from

a delayed saccade to its spatial location. We paired V1-MSwith subthreshold MS of an electrode of a V4 array whereneurons had overlapping RFs, at various SOAs. We tested theinteraction between MS in V1 and V4 in 15 combinations ofV1 and V4 electrodes in monkey B and in 16 combinations inmonkey C (the neurons’ RFs are shown in Fig. 2A).
At the start of every experimental session, we determinedthe threshold of V4-MS that evoked a phosphene and we thenset the V4-MS intensity at 50% of that threshold for theremainder of the session. This choice of 50% of the thresholdwas inspired by previous studies using MS in frontal cortexshowing that this current level can induce changes in behavior(Moore and Fallah 2001). The average V4 threshold was 51 �33 �A (mean � SD). The threshold in V1 for evokingphosphenes with the electrode arrays (in the absence of V4-MS) was 32 � 18 �A, which is slightly higher than thresholdsobtained with acutely inserted electrodes (Tehovnik et al.2005).
We next investigated the influence of the subthresholdV4-MS on the phosphene threshold in V1 at various SOAsbetween V1-MS and V4-MS. Figure 1B shows an exampleelectrode combination from a session with monkey C. In thissession, the V4 stimulation threshold was 38.3 �A (we there-fore stimulated with 19 �A) and the threshold in V1 in theabsence of V4-MS was 27.3 �A. Figure 1C illustrates thesequence of applied currents according to the QUEST staircasefor V1-only (in the absence of V4-MS) and combined V1-V4stimulation trials with an SOA of �38 ms (i.e., V4-MSpreceding V1-MS by 38 ms). The MS threshold in V1 for the�38 ms SOA was 22.7 �A. Thus, in this particular example,V4-MS led to a small reduction in V1 threshold.
To quantify the influence of V4-MS on the phosphenethreshold in V1, we computed the phosphene threshold ratio(PTR) for each SOA, defined as the ratio between the thresholdfor phosphene detection with combined V1/V4-MS and thethreshold with V1-MS only. Thus a PTR value of 1 means thatV4-MS had no effect on V1 phosphene detection thresholds, avalue higher than 1 indicates that V4-MS impaired V1 phos-phene detection, and a value lower than 1 indicates that V4-MSfacilitated V1 phosphene detection. In the example sessionillustrated in Fig. 1D, PTR values were lower than 1 across allSOAs, indicating that V4-MS produced a general decrease ofthe MS threshold in V1.
To investigate the mean influence of V4-MS on V1 phos-phene thresholds, we averaged values across SOAs to computethe PTRMean for every session (n � 15 for monkey B and n �16 for monkey C; Fig. 2B). The PTRMean was significantlylower than 1 for monkey B (P 0.05, t14 � �6.34), and therewas a trend in the same direction in monkey C (P 0.1, t15 ��1.75). Thus V4-MS caused a general decrease in V1-MSthresholds. Inspection of the individual data points in Fig. 2Bsuggests that this effect is relatively independent of the SOA,although previous studies suggested that V4-MS might interactmost strongly with V1 phosphene detection if it precedesV1-MS. We therefore specifically tested the influence of SOAon the PTR with a one-way ANOVA but did not observe asignificant effect of SOA on the PTR in either monkey (F9,127 �0.41, P � 0.1 in monkey C; F9,117 � 1.62, P � 0.1 in monkeyB). Thus the effect of V4-MS on V1 phosphene detection didnot depend on SOA, although we observed a general decreasein phosphene detection thresholds (Fig. 2B). We also tested
whether the interaction between MS in V1 and V4 depended onthe distance between RFs of neurons at the stimulation sites.To this aim, we analyzed the 50% V1-V4 combinations withnearest and the 50% with farthest RFs separately but did notobserve a significant effect of RF distance on the PTR(ANOVA; F1,118 � 0.15, P � 0.5 in monkey C and F1,126 �0.9, P � 0.3 in monkey B).
We suspected that the general increase in phosphene sensi-tivity might be caused by the detection of the V4-MS pulsesthemselves. Although we set the V4-MS pulse amplitude at50% of the threshold (see METHODS) and we did not reward themonkeys for saccades to V4 phosphenes, it is conceivable thatthe monkeys made saccades to phosphenes elicited by V4-MSon a fraction of the trials. To investigate the detection of V4phosphenes, we measured a V4-FPR by delivering V4-MS in10% of the catch trials without V1-MS and compared it to thefalse alarm rate on trials without MS in either area in the other90% of catch trials. V4-MS increased the FPR from 10% to15% in monkey C (paired t-test; P 0.05, t15 � 2.8) and from8% to 23% in monkey B (P 0.01, t14 � 4.3) (Fig. 2C), whichindicates that monkeys made saccades to phosphenes elicitedin V4 at 50% of the threshold in some of the trials even thoughthey were never rewarded for these saccades.
We used signal detection theory (Green and Swets 1966) toinvestigate whether the induction of V4 phosphenes couldaccount for the general decrease in the apparent V1-MS thresh-old caused by V4-MS. A genuine increase in the sensitivity forV1 phosphenes should increase the d-prime, whereas the de-tection of V4 phosphenes should only change the criterion, i.e.,a general increase in the probability of reporting the presenceof a phosphene. The signal-detection analysis revealed that thed-prime as function of V1-MS stimulation amplitude washardly influenced by V4-MS in either monkey (Fig. 2D). Forexample, the current in V1 at which d-prime reached a value of2.12 did not differ between V1-only and V4/V1 combined MStrials (paired t-test; P � 0.1, t15 � 1.65 for monkey C and P �0.1, t14 � 0.68 for monkey B) (arrows in Fig. 2D). In contrast,the bias was significantly different between conditions (pairedt-test; P 0.05, t15 � �2.86 for monkey C and P 0.01,t14 � �4.8 for monkey B). We computed a d-prime thresholdratio (DTR), which is equivalent to the PTR ratio, whilecorrecting for the influence of V4-MS on the monkeys’ crite-rion. DTR was defined as the ratio between the currents atwhich the d-prime reached a value of 1. In this analysis we hadto bin SOAs in groups of two because the number of trials perSOA bin was insufficient for a reliable determination of d-primes in individual sessions. As expected, the DTRMean didnot differ significantly from 1 (P � 0. 71, t14 � 0.38 in monkeyB; P 0.8, t14 � 0.25 in monkey C; Fig. 2E). Thus, althoughthe V4-stimulation was intended to be subthreshold, the induc-tion of V4 phosphenes on a fraction of trials accounted for theapparent decrease in the threshold for detecting V1 phos-phenes, which was independent of the SOA (Fig. 2B). Theseresults, taken together, indicate that V4-MS did not influencethe perception of V1 phosphenes themselves at any SOA.
Influence of V4 microstimulation on dimming detection.Despite the well-established theoretical and experimental basisfor our first experiment, we did not observe a specific influenceof V4-MS on the detection of phosphenes evoked in V1. Oneof the reasons for this negative result could be the nature ofthe visual percepts evoked by MS. In the previous experiment
735MICROSTIMULATION IN V1/V4 FOR PHOSPHENE INDUCTION
J Neurophysiol • doi:10.1152/jn.00645.2014 • www.jn.org
on February 5, 2015
Dow
nloaded from
we tested whether there was an interaction between two MStrains, one in V1 and one in V4. Might MS in V4 onlyinfluence the perception of visual stimuli without an effect onphosphenes elicited in V1? Moreover, in the first experimentthe target stimulus could only appear at one location that washeld constant for the entire session. As a result, the monkeys’attention was presumably directed to this location, whichcoincided with the stimulated RF. Thus we only tested whetherV4-MS influenced awareness at a specific location but not howit influenced the distribution of spatial attention. Previousstudies (Cohen and Maunsell 2010, 2011) demonstrated thatthe activity of neurons in V4 reflects the distribution of atten-tion on single trials because they increase their response if theRF coincides with the attended location. Is it also possible toinfluence the distribution of attention with V4-MS? Such aneffect of MS on the distribution of selective attention would notbe without precedent. In an elegant study, Moore and Fallah(2001) demonstrated that MS in the FEF influenced the per-formance in monkeys on a task in which they had to detect acontrast decrement of a stimulus in a crowded visual scene.They found that FEF-MS facilitated the detection of the con-trast decrement, but only if the motor field of the stimulatedneurons overlapped with the visual stimulus. One possibleinterpretation of this result is that the FEF-MS summonedspatial attention to the FEF motor field, thereby facilitatingdimming detection at the corresponding location in the visualfield while interfering with dimming detection at other loca-tions. We here asked whether the activation of V4 with MS
could trigger a similar effect. Does V4-MS facilitate or impairthe detection of a small change in a visual stimulus or is therealso little influence on the distribution of attention?
To address this question we trained the monkeys to detectthe dimming of one of three larger bars that were presented ona background of smaller, irrelevant line elements (Fig. 3A). Inhalf of the trials the dimming was preceded by a train of 20 MSpulses (subthreshold as determined with the phosphene detec-tion task) applied to a V4 electrode with a RF that overlappedwith one of the bars. We measured the luminance changethreshold for detection of the dimming (in % of bar luminance)with and without MS, separately for each bar. Across days, wegathered data from 25 MS sessions in monkey C and 24sessions in monkey B, approximately equally distributed acrossthree V4 electrodes per monkey (6–10 sessions per electrode;Fig. 4A).
Does V4-MS decrease the detection threshold of the dim-ming at the V4-RF, perhaps at the expense of higher thresholdsat other retinotopic locations? Figure 3, B–D, illustrates theeffect of V4-MS on the dimming detection threshold in anexample session. One of the three target bars was placed in theRF of the stimulated V4 electrode (Fig. 3B). It can be seen thatthe staircases for the bar at the RF location in the presence andabsence of V4-MS converged to a similar value of �8.6% forthe luminance decrement (Fig. 3C). We measured the dimmingdetection threshold condition as the average decrement for thelast 10 reversals (Fig. 3D) but did not observe a significantdifference between the MS and the blank condition in the
RF BarA B Non Overlapping Bars
Lum change [%] MS Lum change [%] MS
Lum
cha
nge
[%] B
lank
Lum
cha
nge
[%] B
lank
C
-2
-1
0
1
2
OV no OV
Thre
shol
d di
ffere
nce
(MS
- B
L)
-3
-2
-1
0
1
2
OV no OV
Thre
shol
d di
ffere
nce
(MS
- B
L)
-3
−19 −14 −9 −4−19 −14 −9 −4
−13
−9
−5
−1
3
−13
−9
−5
−1
3
Verti
cal [
deg]
Horizontal [deg]
Verti
cal [
deg]
-1
-9
-7
-5
-3
-1
-9
-7
-5
-3
80 2 4 6 80 2 4 6Horizontal [deg]
Monkey B
Monkey C
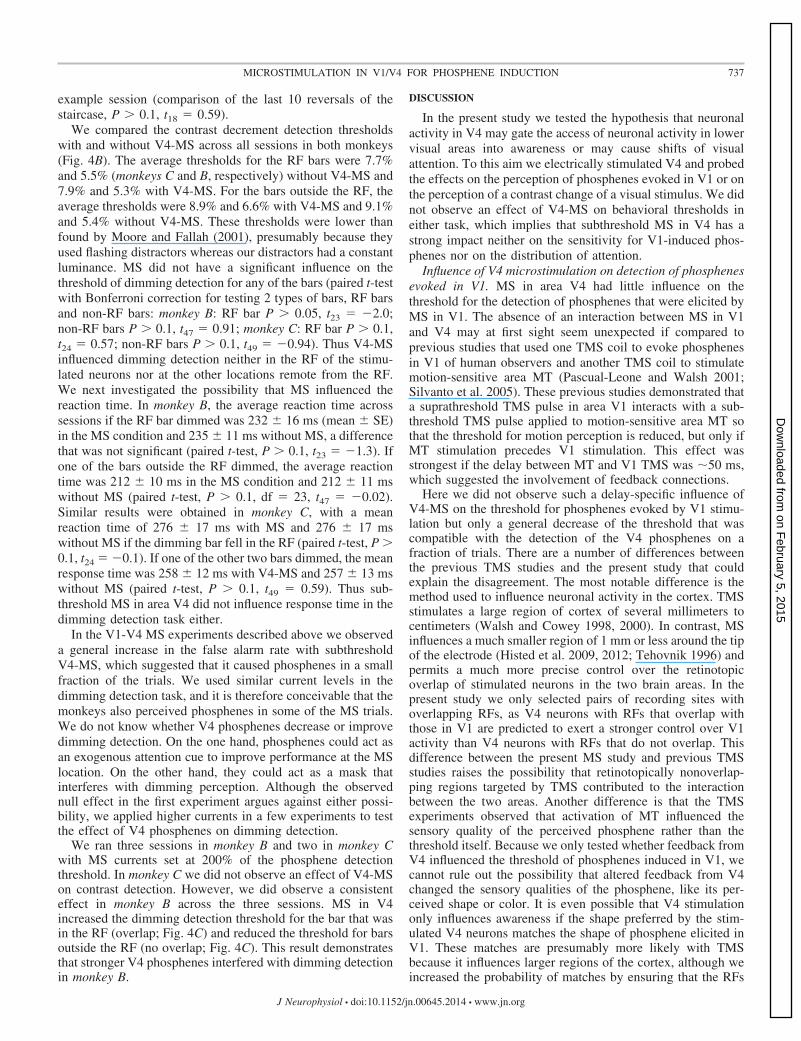
Fig. 4. Effect of V4-MS on dimming detection thresholds. A: RFs of V4 recording sites in the dimming detection task relative to 1 of the target bars (gray bars).Color scale as in Fig. 1B. B: dimming detection thresholds for the V4-MS trials (x-axis) and the blank trials (y-axis) for the bar in the RF (left) and the 2 barsoutside the RF (right) in monkey B (top) and monkey C (bottom). C: sessions with suprathreshold V4 stimulation (stimulation current was set at 200% of thethreshold). We computed the difference between dimming detection thresholds (% contrast change) for bars overlapping with the stimulated V4-RF (OV) andnonoverlapping bars (no OV). Shown are average results of 3 sessions in monkey B and 2 sessions in monkey C.
736 MICROSTIMULATION IN V1/V4 FOR PHOSPHENE INDUCTION
J Neurophysiol • doi:10.1152/jn.00645.2014 • www.jn.org
on February 5, 2015
Dow
nloaded from
example session (comparison of the last 10 reversals of thestaircase, P � 0.1, t18 � 0.59).
We compared the contrast decrement detection thresholdswith and without V4-MS across all sessions in both monkeys(Fig. 4B). The average thresholds for the RF bars were 7.7%and 5.5% (monkeys C and B, respectively) without V4-MS and7.9% and 5.3% with V4-MS. For the bars outside the RF, theaverage thresholds were 8.9% and 6.6% with V4-MS and 9.1%and 5.4% without V4-MS. These thresholds were lower thanfound by Moore and Fallah (2001), presumably because theyused flashing distractors whereas our distractors had a constantluminance. MS did not have a significant influence on thethreshold of dimming detection for any of the bars (paired t-testwith Bonferroni correction for testing 2 types of bars, RF barsand non-RF bars: monkey B: RF bar P � 0.05, t23 � �2.0;non-RF bars P � 0.1, t47 � 0.91; monkey C: RF bar P � 0.1,t24 � 0.57; non-RF bars P � 0.1, t49 � �0.94). Thus V4-MSinfluenced dimming detection neither in the RF of the stimu-lated neurons nor at the other locations remote from the RF.We next investigated the possibility that MS influenced thereaction time. In monkey B, the average reaction time acrosssessions if the RF bar dimmed was 232 � 16 ms (mean � SE)in the MS condition and 235 � 11 ms without MS, a differencethat was not significant (paired t-test, P � 0.1, t23 � �1.3). Ifone of the bars outside the RF dimmed, the average reactiontime was 212 � 10 ms in the MS condition and 212 � 11 mswithout MS (paired t-test, P � 0.1, df � 23, t47 � �0.02).Similar results were obtained in monkey C, with a meanreaction time of 276 � 17 ms with MS and 276 � 17 mswithout MS if the dimming bar fell in the RF (paired t-test, P �0.1, t24 � �0.1). If one of the other two bars dimmed, the meanresponse time was 258 � 12 ms with V4-MS and 257 � 13 mswithout MS (paired t-test, P � 0.1, t49 � 0.59). Thus sub-threshold MS in area V4 did not influence response time in thedimming detection task either.
In the V1-V4 MS experiments described above we observeda general increase in the false alarm rate with subthresholdV4-MS, which suggested that it caused phosphenes in a smallfraction of the trials. We used similar current levels in thedimming detection task, and it is therefore conceivable that themonkeys also perceived phosphenes in some of the MS trials.We do not know whether V4 phosphenes decrease or improvedimming detection. On the one hand, phosphenes could act asan exogenous attention cue to improve performance at the MSlocation. On the other hand, they could act as a mask thatinterferes with dimming perception. Although the observednull effect in the first experiment argues against either possi-bility, we applied higher currents in a few experiments to testthe effect of V4 phosphenes on dimming detection.
We ran three sessions in monkey B and two in monkey Cwith MS currents set at 200% of the phosphene detectionthreshold. In monkey C we did not observe an effect of V4-MSon contrast detection. However, we did observe a consistenteffect in monkey B across the three sessions. MS in V4increased the dimming detection threshold for the bar that wasin the RF (overlap; Fig. 4C) and reduced the threshold for barsoutside the RF (no overlap; Fig. 4C). This result demonstratesthat stronger V4 phosphenes interfered with dimming detectionin monkey B.
DISCUSSION
In the present study we tested the hypothesis that neuronalactivity in V4 may gate the access of neuronal activity in lowervisual areas into awareness or may cause shifts of visualattention. To this aim we electrically stimulated V4 and probedthe effects on the perception of phosphenes evoked in V1 or onthe perception of a contrast change of a visual stimulus. We didnot observe an effect of V4-MS on behavioral thresholds ineither task, which implies that subthreshold MS in V4 has astrong impact neither on the sensitivity for V1-induced phos-phenes nor on the distribution of attention.
Influence of V4 microstimulation on detection of phosphenesevoked in V1. MS in area V4 had little influence on thethreshold for the detection of phosphenes that were elicited byMS in V1. The absence of an interaction between MS in V1and V4 may at first sight seem unexpected if compared toprevious studies that used one TMS coil to evoke phosphenesin V1 of human observers and another TMS coil to stimulatemotion-sensitive area MT (Pascual-Leone and Walsh 2001;Silvanto et al. 2005). These previous studies demonstrated thata suprathreshold TMS pulse in area V1 interacts with a sub-threshold TMS pulse applied to motion-sensitive area MT sothat the threshold for motion perception is reduced, but only ifMT stimulation precedes V1 stimulation. This effect wasstrongest if the delay between MT and V1 TMS was �50 ms,which suggested the involvement of feedback connections.
Here we did not observe such a delay-specific influence ofV4-MS on the threshold for phosphenes evoked by V1 stimu-lation but only a general decrease of the threshold that wascompatible with the detection of the V4 phosphenes on afraction of trials. There are a number of differences betweenthe previous TMS studies and the present study that couldexplain the disagreement. The most notable difference is themethod used to influence neuronal activity in the cortex. TMSstimulates a large region of cortex of several millimeters tocentimeters (Walsh and Cowey 1998, 2000). In contrast, MSinfluences a much smaller region of 1 mm or less around the tipof the electrode (Histed et al. 2009, 2012; Tehovnik 1996) andpermits a much more precise control over the retinotopicoverlap of stimulated neurons in the two brain areas. In thepresent study we only selected pairs of recording sites withoverlapping RFs, as V4 neurons with RFs that overlap withthose in V1 are predicted to exert a stronger control over V1activity than V4 neurons with RFs that do not overlap. Thisdifference between the present MS study and previous TMSstudies raises the possibility that retinotopically nonoverlap-ping regions targeted by TMS contributed to the interactionbetween the two areas. Another difference is that the TMSexperiments observed that activation of MT influenced thesensory quality of the perceived phosphene rather than thethreshold itself. Because we only tested whether feedback fromV4 influenced the threshold of phosphenes induced in V1, wecannot rule out the possibility that altered feedback from V4changed the sensory qualities of the phosphene, like its per-ceived shape or color. It is even possible that V4 stimulationonly influences awareness if the shape preferred by the stim-ulated V4 neurons matches the shape of phosphene elicited inV1. These matches are presumably more likely with TMSbecause it influences larger regions of the cortex, although weincreased the probability of matches by ensuring that the RFs
737MICROSTIMULATION IN V1/V4 FOR PHOSPHENE INDUCTION
J Neurophysiol • doi:10.1152/jn.00645.2014 • www.jn.org
on February 5, 2015
Dow
nloaded from
in V1 and V4 were overlapping. A final difference betweenstudies is that we stimulated V4, whereas the TMS studiestargeted motion-sensitive area MT. We do not know whetherour double MS approach would have revealed an interactionbetween V1 and MT, but the strength of the feedback projec-tion from V4 to V1 is similar to the strength of the projectionfrom MT to V1 (Markov et al. 2011), so that the differencesbetween techniques seem to be a more likely cause of thediscrepancy.
Influence of V4 microstimulation on distribution of attention.We also investigated whether V4-MS influences the distribu-tion of attention, because previous studies demonstrated thatactivity in V4 reflects where a monkey directs attention onsingle trials (Cohen and Maunsell 2010, 2011). Our secondexperiment therefore paired subthreshold MS in V4 with thedimming of a visual stimulus. We did not observe an effect onthe detection of a dimming stimulus, thus demonstrating thatsubthreshold V4-MS does not alter the perception of subtlecontrast changes of visual stimuli. Previous experiments withrelated paradigms showed that MS of FEF does influencedimming detection, in a manner that can be explained by anattention shift (Moore et al. 2003; Moore and Fallah 2001,2004), and that MS in area LIP biases eye movement decisionstoward the RF of the stimulated neurons (Dai et al. 2014).However, despite using related paradigms as well as similarstimulation current levels (mean of 20 �A in our experimentvs. median of 10 �A in Moore and Fallah 2001 and 40 �A inDai et al. 2014), our second experiment also failed to reveal aneffect of MS on the threshold in a dimming detection task. Thissecond null result suggests that the influence of V4 stimulationon covert attention is limited. In contrast, stimulation of FEF orLIP appears to trigger feedback mechanisms to the visualcortex that influence the spatial distribution of attention andeye movement control (Dai et al. 2014; Moore et al. 2003).This influence of MS in FEF or LIP is consistent with thepreviously proposed role of frontal and parietal cortex in overtand covert shifts of attention (Rossi et al. 2009). In contrast, thepresent results demonstrate that MS of V4 does not cause ashift of attention, which suggests that it is more involved invisual processing than in the control of spatial attention.
Possible influences of feedback on perception and distribu-tion of attention. Although we did not observe an influence ofV4-MS on V1 phosphene thresholds, our results do not excludethe possibility that V4-MS changed the perceptual quality ofthe phosphenes. Schiller et al. (2011) recently trained monkeysto report the size, color, and brightness of phosphenes evokedby cortical MS. They provided evidence that V1 phosphenesevoked by currents in the same range used here have a smallsize (0.5°), a relatively weak contrast (10%), and in somecases a specific color. Future studies could use the double MSparadigm to test the influence of MS in higher visual areas onthe perceived quality of phosphenes evoked in area V1. Forinstance, it is conceivable that subthreshold stimulation of cellstuned for color in V4 could change the perceived color or shapeof phosphenes evoked by MS in area V1. A similar argumentcan be made about the absence of an effect of V4 stimulationon the distribution of attention. We did not obtain evidence thatV4-MS influences the distribution of spatial attention butcannot exclude that V4 can exert an influence on feature-basedattention. For example, MS of V4 neurons tuned to red mightlead to a specific improvement in the detection of the dimming
of red bars relative to the dimming of green bars. A drawbackof our negative results is that we cannot exclude that V4-MSwould have influenced the perception of dimming of stimulihad we used different colors, shapes, or sizes. Future experi-ments that test the influence of MS on the perception ofspecific features might further our understanding of thefunctional role of feedback connections between extrastriatecortex and area V1.
ACKNOWLEDGMENTS
We thank Kor Brandsma and Anneke Ditewig for biotechnical assistance.
GRANTS
The work was supported by NWO (VICI scheme and Brain and CognitionGrant No. 433-09-208) and the European Union Seventh Framework Program(Project 269921 “BrainScaleS,” Marie-Curie Action PITN-GA-2011-290011“ABC,” and ERC Grant Agreement No. 339490) awarded to P. R. Roelfsema.
DISCLOSURES
No conflicts of interest, financial or otherwise, are declared by the author(s).
AUTHOR CONTRIBUTIONS
Author contributions: B.D., M.-A.G.-M., and P.R.R. conception and designof research; B.D. and M.-A.G.-M. performed experiments; B.D. analyzed data;B.D., M.-A.G.-M., and P.R.R. interpreted results of experiments; B.D. andP.R.R. prepared figures; B.D. and P.R.R. drafted manuscript; B.D. and P.R.R.edited and revised manuscript; B.D. and P.R.R. approved final version ofmanuscript.
REFERENCES
Bullier J, McCourt ME, Henry GH. Physiological studies on the feedbackconnection to the striate cortex from cortical areas 18 and 19 of the cat. ExpBrain Res 70: 90–98, 1988.
Butovas S, Schwarz C. Spatiotemporal effects of microstimulation in ratneocortex: a parametric study using multielectrode recordings. J Neuro-physiol 90: 3024–3039, 2003.
Cohen MR, Maunsell JH. A neuronal population measure of attentionpredicts behavioral performance on individual trials. J Neurosci 30: 15241–15253, 2010.
Cohen MR, Maunsell JH. When attention wanders: how uncontrolled fluc-tuations in attention affect performance. J Neurosci 31: 15802–15806, 2011.
Dai J, Brooks DI, Sheinberg DL. Optogenetic and electrical microstimulationsystematically bias visuospatial choice in primates. Curr Biol 24: 63–69,2014.
Dehaene S, Changeux JP. Experimental and theoretical approaches to con-scious processing. Neuron 70: 200–227, 2011.
Dehaene S, Changeux JP, Naccache L, Sackur J, Sergent C. Conscious,preconscious, and subliminal processing: a testable taxonomy. Trends CognSci 10: 204–211, 2006.
Dehaene S, Sergent C, Changeux JP. A neuronal network model linkingsubjective reports and objective physiological data during conscious per-ception. Proc Natl Acad Sci USA 100: 8520–8525, 2003.
Edelman GM. Neural Darwinism: The Theory of Neuronal Group Selection.New York: Basic Books, 1987.
Girard P, Hupe JM, Bullier J. Feedforward and feedback connectionsbetween areas V1 and V2 of the monkey have similar rapid conductionvelocities. J Neurophysiol 85: 1328–1331, 2001.
Green DM, Swets JA. Signal Detection Theory and Psychophysics. NewYork: Wiley, 1966.
Histed MH, Bonin V, Reid RC. Direct activation of sparse, distributedpopulations of cortical neurons by electrical microstimulation. Neuron 63:508–522, 2009.
Histed MH, Ni AM, Maunsell JH. Insights into cortical mechanisms ofbehavior from microstimulation experiments. Prog Neurobiol 103: 115–130, 2012.
738 MICROSTIMULATION IN V1/V4 FOR PHOSPHENE INDUCTION
J Neurophysiol • doi:10.1152/jn.00645.2014 • www.jn.org
on February 5, 2015
Dow
nloaded from
Kaas JH, Lyon DC. Pulvinar contributions to the dorsal and ventral streamsof visual processing in primates. Brain Res Rev 55: 285–296, 2007.
Kato H, Bishop PO, Orban GA. Hypercomplex and simple/complex cellclassifications in cat striate cortex. J Neurophysiol 41: 1071–1095, 1978.
Lamme VA. Why visual attention and awareness are different. Trends CognSci 7: 12–18, 2003.
Lamme VA, Roelfsema PR. The distinct modes of vision offered by feed-forward and recurrent processing. Trends Neurosci 23: 571–579, 2000.
Lamme VA, Super H, Spekreijse H. Feedforward, horizontal, and feedbackprocessing in the visual cortex. Curr Opin Neurobiol 8: 529–535, 1998.
Markov NT, Misery P, Falchier A, Lamy C, Vezoli J, Quilodran R, GarielMA, Giroud P, Ercsey-Ravasz M, Pilaz LJ. Weight consistency specifiesregularities of macaque cortical networks. Cereb Cortex 21: 1254–1272,2011.
Moore T, Armstrong KM, Fallah M. Visuomotor origins of covert spatialattention. Neuron 40: 671–683, 2003.
Moore T, Fallah M. Control of eye movements and spatial attention. ProcNatl Acad Sci USA 98: 1273–1276, 2001.
Moore T, Fallah M. Microstimulation of the frontal eye field and its effectson covert spatial attention. J Neurophysiol 91: 152–162, 2004.
Movshon JA, Newsome WT. Visual response properties of striate corticalneurons projecting to area MT in macaque monkeys. J Neurosci 16:7733–7741, 1996.
Noudoost B, Moore T. Control of visual cortical signals by prefrontaldopamine. Nature 474: 372–375, 2011.
Pascual-Leone A, Walsh V. Fast backprojections from the motion to theprimary visual area necessary for visual awareness. Science 292: 510–512,2001.
Poort J, Raudies F, Wannig A, Lamme VA, Neumann H, Roelfsema PR.The role of attention in figure-ground segregation in areas V1 and V4 of thevisual cortex. Neuron 75: 143–156, 2012.
Prins N, Kingdom F. Palamedes: Matlab routines for analyzing psychophys-ical data. http://www.palamedestoolbox.org, 2009.
Purushothaman G, Marion R, Li K, Casagrande VA. Gating and control ofprimary visual cortex by pulvinar. Nat Neurosci 15: 905–912, 2012.
Roelfsema PR, Lamme VA, Spekreijse H. Object-based attention in theprimary visual cortex of the macaque monkey. Nature 395: 376–381, 1998.
Rossi AF, Pessoa L, Desimone R, Ungerleider LG. The prefrontal cortex andthe executive control of attention. Exp Brain Res 192: 489–497, 2009.
Schiller PH, Slocum WM, Kwak MC, Kendall GL, Tehovnik EJ. Newmethods devised specify the size and color of the spots monkeys see whenstriate cortex (area V1) is electrically stimulated. Proc Natl Acad Sci USA108: 17809–17814, 2011.
Schiller PH, Tehovnik EJ. Visual prosthesis. Perception 37: 1529–1559,2008.
Silvanto J, Cowey A, Lavie N, Walsh V. Striate cortex (V1) activity gatesawareness of motion. Nat Neurosci 8: 143–144, 2005.
Super H, Roelfsema PR. Chronic multiunit recordings in behaving animals:advantages and limitations. Prog Brain Res 147: 263–282, 2005.
Super H, Spekreijse H, Lamme VA. Two distinct modes of sensory process-ing observed in monkey primary visual cortex (V1). Nat Neurosci 4:304–310, 2001.
Tehovnik EJ. Electrical stimulation of neural tissue to evoke behavioralresponses. J Neurosci Methods 65: 1–17, 1996.
Tehovnik EJ, Slocum WM, Carvey CE, Schiller PH. Phosphene inductionand the generation of saccadic eye movements by striate cortex. J Neuro-physiol 93: 1–19, 2005.
Tehovnik EJ, Slocum WM, Schiller PH. Saccadic eye movements evoked bymicrostimulation of striate cortex. Eur J Neurosci 17: 870–878, 2003.
Vangkilde S, Coull JT, Bundesen C. Great expectations: temporal expecta-tion modulates perceptual processing speed. J Exp Psychol Hum PerceptPerform 38: 1183–1191, 2012.
Walsh V, Cowey A. Magnetic stimulation studies of visual cognition. TrendsCogn Sci 2: 103–110, 1998.
Walsh V, Cowey A. Transcranial magnetic stimulation and cognitive neuro-science. Nat Rev Neurosci 1: 73–80, 2000.
Watson AB, Pelli DG. QUEST: a Bayesian adaptive psychometric method.Atten Percept Psychophys 33: 113–120, 1983.
Zeki S. The disunity of consciousness. Trends Cogn Sci 7: 214–218, 2003.
739MICROSTIMULATION IN V1/V4 FOR PHOSPHENE INDUCTION
J Neurophysiol • doi:10.1152/jn.00645.2014 • www.jn.org
on February 5, 2015
Dow
nloaded from
Copyright © 2022 FDOKUMEN


![[Eng]Eurocode Training - EN 1993 2011.0 v4 - SCIA Downloads](https://static.fdokumen.com/doc/165x107/6326d727e491bcb36c0afe50/engeurocode-training-en-1993-20110-v4-scia-downloads.jpg)