Multimodal, longitudinal assessment of intracortical microstimulation
15
Transcript of Multimodal, longitudinal assessment of intracortical microstimulation

J. Schouenborg, M. Garwicz and N. Danielsen (Eds.)Progress in Brain Research, Vol. 194ISSN: 0079-6123Copyright � 2011 Elsevier B.V. All rights reserved.
Author's personal copy
CHAPTER 10
Multimodal, longitudinal assessment of intracorticalmicrostimulation
Andrew Koivuniemi{,}, Seth J. Wilks{, Andrew J. Woolley{ and Kevin J. Otto{,{,*
{ The Weldon School of Biomedical Engineering, Purdue University, West Lafayette, IN, USA{ Department of Biological Sciences, Purdue University, West Lafayette, IN, USA
} Indiana University School of Medicine, Indianapolis, IN, USA
Abstract: The fundamental obstacle to neuroprostheses based on penetrating microstimulation is thetissue’s response to the device insertion and to the application of the electrical stimulation. Our long-term goal is to develop multichannel microstimulation of central nervous tissue for clinical therapy.The overall objective of this research is to identify the optimal parameters for a chronically implantedmicrostimulation device. In particular, the work presented here focuses on the effects of repeatedstimulation and the reactive tissue response on the efficacy of stimulation-driven behavior. To this end,psychophysical experiments were performed using multichannel cortical implants in the auditory cortexof rats. Further, we investigated the effect of the device–tissue interfacial quality on the psychophysicalthreshold. Here, we report the effects of cortical depth, days postimplant on the psychophysicalthreshold of auditory cortical microstimulation, along with correlated impedance spectral changes andpost vivo histology. We expect that these data will further enable neuroprosthetic development.
Keywords: behavioral; impedance spectroscopy; reactive tissue response; histology; cortical depth.
Introduction
Brain machine interfaces (BMIs) aim to trans-duce information between the world and the sub-jective experience of the individual. The modernnexus of this dimensional exchange is typically
*Corresponding author.Tel.: þ1-765-496-1012; Fax: þ1-765-496-1912E-mail: [email protected]
131DOI: 10.1016/B978-0-444-53815-4.00011-X
an electrode. From atop the brain or implantedamong the glial cells and neurons, the electrodecan passively receive or actively drive the dynam-ics of the local neural cells. This ability to directlyinteract with the functional networks of the brainhas allowed clinicians to lessen the severity ofpatients’ movement disorders (Benabid et al.,2009), grant volitional control over devices tothe paralyzed (Hochberg et al., 2006; Kennedy

132
Author's personal copy
and Bakay, 1998), and create visual sensations inthe blind (Schmidt et al., 1996).
Nonetheless, one serious and nagging problemfor many BMIs is failure of effective transduction,putatively due to the reactive tissue response tothe indwelling implanted device. Determiningwhether electrodes can inhabit the brain fordecades and continue to interact and providevaluable information is the most significant BMIhurdle. Efforts to develop the proper signal pro-cessing techniques and the most effective stimula-tion patterns are useful endeavors only if thephysical connection between the mind and themachine is viable. The answer to the question oflong-term device viability varies based on theapplication. Indeed, for some BMIs, such as deepbrain stimulation (Benabid et al., 2009) and sur-face cortical stimulation (Dobelle, 2000), the issueseems to be mostly resolved, with devicesshowing functionality extending well beyond 10years. Further, some arrays used for recording,such as the neurotrophic electrode (Bartelset al., 2008) and cyberkinetics array (Kim et al.,2008), have also showed functionality in humansfor years after the initial implantation. However,for systems that rely on the ability ofmicroelectrodes implanted within the cerebralcortex to record and stimulate highly localizedcell populations, this problem remains frustrat-ingly unresolved.
This chapter focuses exclusively on intracorticalmicrostimulation (ICMS) of primary sensory cor-tical structures. After a brief summary of ICMS,it will set forth what is known about the long-termstability of the sensory effects of ICMS in threeparts. The first part will discuss the stability ofthe behavioral effect of microstimulation as afunction cortical depth. The second will describethe changes in electrode impedance seen duringelectrical stimulation as a potential approach toelucidating changes seen in the behavioral detec-tion level. The final section will describe postmor-tem histological analysis of interfacing tissue as analternative approach to understanding the behav-ioral changes.
Background
Stimulation of various sensory cortices offers aversatile platform for sensory prostheses. Thelogic for this is as follows: (1) Regions of the brainare responsible for processing information fromthe outside world and, in doing so, generating aperception in the individual. Thus, all awarenessof the outside world is a product of this informa-tion processing conducted by the networks ofneurons. (2) Electric current can be used to artifi-cially drive the activity of those neurons. Thisdriven activity produces an illusory sensation inthe subject, the qualities of which are determinedby the region that is stimulated. For example,stimulation of the visual cortex creates a visualillusion. Therefore, given points (1) and (2), elec-trical stimulation of the sensory cortex couldrestore vision to the blind, hearing to the deaf,and sensation to the paralyzed.
The first well-documented demonstration ofelectric cortical stimulation’s ability to generatesensory illusions was performed by the neuro-surgeon Wilder Penfield (Penfield and Boldrey,1937). Using simple electrodes applied to what isnow referred to as the primary somatosensorycortex, Penfield was able to electrically stimulateconscious patients and have them report theevoked sensations, their location, and quality. Indoing so, he was able to generate the iconic sen-sory homunculus. Penfield continued to studythe effects of electrical stimulation on the cortex(Penfield and Mullan, 1957; Penfield and Perot,1963), but his work tended to focus on higherorder structures and was never technologicallydeveloped in a way that would lend itself to a sen-sory prosthesis.
Prosthetic development drove other researchersworking in the 1960s and 1970s to systemize thereports of patients receiving cortical stimulation,typically of the primary visual cortex (Brindley andLewin, 1968; Dobelle and Mladejovsky, 1974).Using surface electrodes placed over the targetregion, these researchers were able to study thereports of patients and the effects of stimulation

133
Author's personal copy
parameters either in an acute experiment that onlylasted a few minutes during a surgery (Dobelleet al., 1973) or chronically with patients implantedfor years (Dobelle, 2000). While the studies didshow that some information could be transferredto individuals and that these effects could last years,the large surface electrodes were too limited interms of the quality anddegreeof information trans-ferred to make them a viable prosthetic option.Building on previous work in nonhuman
primates (Bartlett and Doty, 1980), another groupattempted to improve upon surface stimulation byusing microelectrodes implanted within the visualcortex (Bak et al., 1990; Schmidt et al., 1996).These experiments confirmed that ICMS couldbe employed to increase the density of stimulationelectrodes and that they could deliver morechannels of information. They also demonstratedthat the amount of electric current required to cre-ate a detectable sensation in the stimulated indi-vidual was two to three orders of magnitude lessfor ICMS when compared to surface stimulation.Since that time, work has focused primarily on
animal behavioral models. Because the artificiallygenerated sensations require a conscious agent toreport on the generated sensation, animals are tra-ined to perform tasks under known physical stimuliwhich are subsequently replaced by electricalstimuli. Two excellent examples of such tasks canbe found in the somatosensory system (O’Dohertyet al., 2009; Romo et al., 1998, 2000), wheremonkeys have been trained to discriminate betweenthe rate of flutter at their finger tips, and in the visualsystem, where monkeys have learned to perform adelayed saccade to demonstrate where a lightappears in their visual field (Murasugi et al., 1993;Salzman et al., 1990; Tehovnik et al., 2003). Afterthe animals perform these tasks in response toknown physical stimuli, the behavior is thenreelicited using electrical stimuli.While suchelegant tasks are useful indetermining
the subjective features of ICMS, simple detectiontasks in which the animal indicates the presence ofa sensation can also be elucidating (Butovas andSchwarz, 2007; Rousche and Normann, 1999). Such
studies with simpler tasks are useful for evaluatingthe stimulation parameters that determine thebehavioral salience of the electric pulses becauseexperimenters can rapidly explore a variety offactors (Otto et al., 2005a,b). Additionally, suchstudies could also be helpful in determining the reli-ability of ICMS in terms of threshold stability. How-ever, systematic exploration of longitudinaldetection thresholds for electrical stimulation islacking, particularlywith regard to the cortical depthof the electrode.Wildly fluctuating or steadily risingthresholds are undesirable and must be avoided ifICMS is to become a clinically viable option fortreating individuals with sensory deficits. Here, wereport recent data from our laboratory that seeksto assess the reliability of ICMS.
Experimental overview
In our behavioral paradigm, water-deprived maleSprague-Dawley rats are trained to perform aconditioned avoidance task to detect a sensory stim-ulus. This protocol was adapted from earlier studiesby Heffner and Kelly (Heffner et al., 1994; Kellyet al., 2006) and is described here only briefly.
After 24 h of water deprivation, a rat is placedin a Coulbourn Instruments (Whitehall, PA)behavioral box in a sound isolated chamber.Water flows through an electrically active drink-ing spout in response to the rat licking the spout.A pure, unmodulated tone is played for 600 msand acts as a warning. The rat’s licking is moni-tored for the last 200 ms of the warning. If therat continues to lick during this period, hereceives a mild �1 mA cutaneous shock deliveredthrough the spout. The amplitude of the nextwarning stimulus is then raised and a “miss” isrecorded. However, if the rat withdraws fromthe spout during the last 200 ms of the warningtrial, a “hit” is recorded and the amplitude ofthe next stimulus is lowered. After five to sevendetection reversals (changes between series ofhits and misses), the mean of the final fourreversals is calculated and recorded as the
134
Author's personal copy
detection threshold. This is referred to as the“threshold task,” a representative example ofwhich can be seen in Fig. 1c.
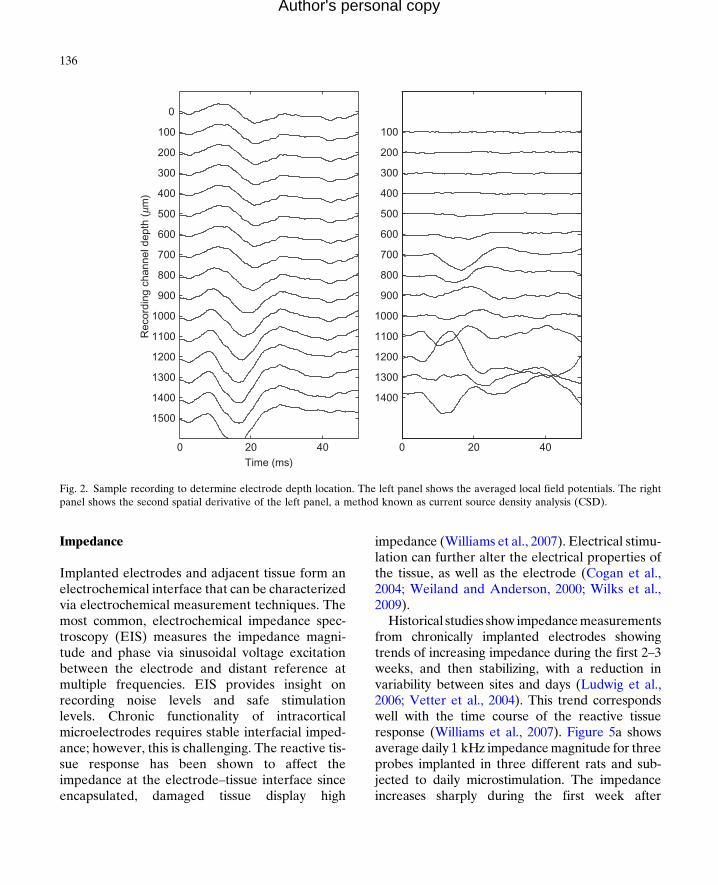
To ensure that the rat is maintaining good con-tact with the spout, warning trials are presentedrandomly with a 1 in 5 probability, while 4 outof 5 trials are shams in which no warning is pres-ented. If the rat leaves the spout for more than20% of the sham trials, the series is eliminatedfrom analysis. Once a rat demonstrates that itcan consistently perform the task near its putativethreshold (Kelly and Masterton, 1977) for a rangeof frequencies within a single training session,thus generating an audiogram like the one seenin Fig. 1a, it is implanted in its primary auditorycortex (A1) with a single shank, 16 site, 100 mmpitch NeuroNexus (Ann Arbor, MI) microelec-trode array in a procedure described in a previouspublication (Vetter et al., 2004). During surgery,electrophysiology is performed to ensure thatthe electrode is placed within the primary audi-tory cortex and that the site depth is approxi-mately the same for all rats. The electrodes areimplanted to span the cortical lamina (Fig. 1b);to confirm cortical depth, local field potentialsare recorded, and the current source density iscomputed to confirm that the electrode arrayabides in the desired lamina (Müller-Preuss andMitzdorf, 1984) as seen in Fig. 2.
Behavioral thresholds
Using the adaptive task described above, multiplethresholds can be generated by an animal in aday. Our experimental preparation provides 16sites linearly over a distance of 1.5 mm, and thus,stimulation can be delivered to all layers of the ratauditory cortex (Paxinos and Watson, 2008), anda behavioral threshold can be generated for all16 sites in a given rat, each day.
For the experiment presented here, six Sprague-Dawley rats were used (Harlan: Indianapolis, IN)in order to study the effect of electrode site depthon the detection threshold over the first month
after implantation. These data, representing 1273thresholds, have been analyzed in two ways. Thefirst analysis was performed to show the role ofdepth on the detection threshold. For the secondanalysis, the data have been lumped intogroups representing four relative cortical depthsand displayed by day in order to demonstratehow threshold stability varies over time with corti-cal depth.
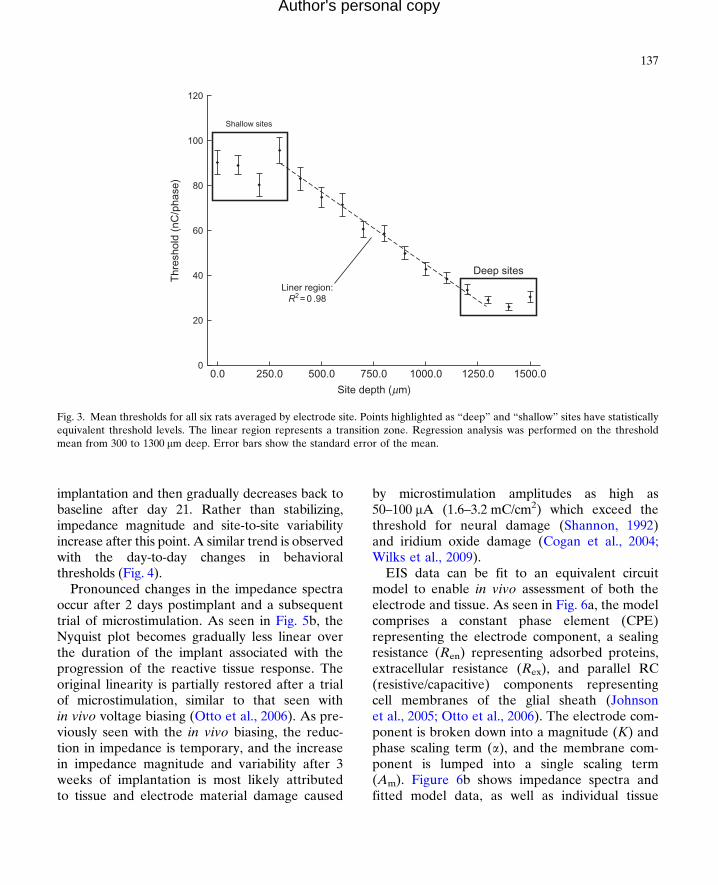
Threshold level varies with depth
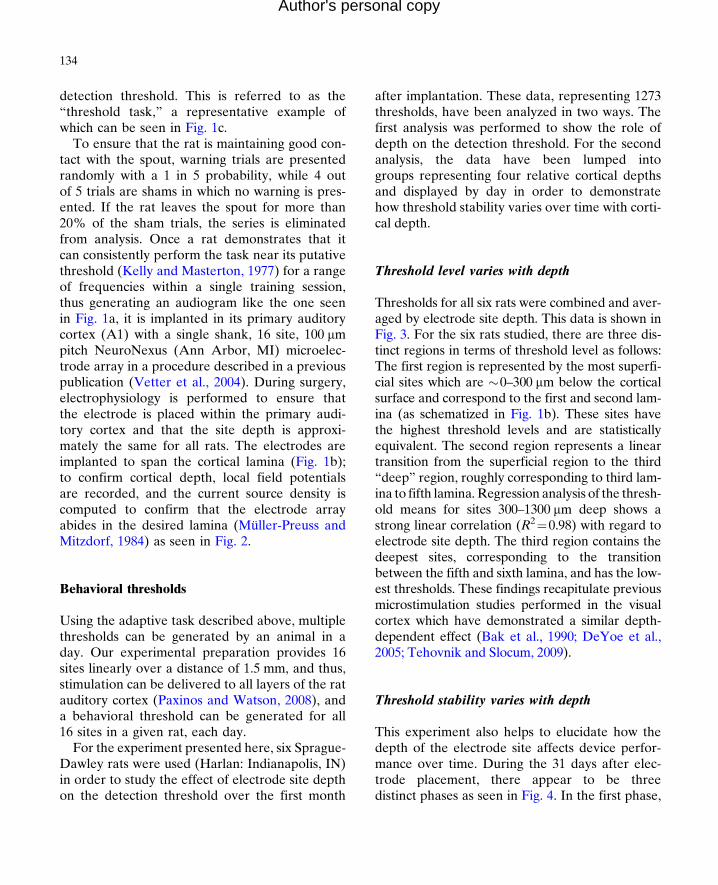
Thresholds for all six rats were combined and aver-aged by electrode site depth. This data is shown inFig. 3. For the six rats studied, there are three dis-tinct regions in terms of threshold level as follows:The first region is represented by the most superfi-cial sites which are �0–300 mm below the corticalsurface and correspond to the first and second lam-ina (as schematized in Fig. 1b). These sites havethe highest threshold levels and are statisticallyequivalent. The second region represents a lineartransition from the superficial region to the third“deep” region, roughly corresponding to third lam-ina to fifth lamina.Regression analysis of the thresh-old means for sites 300–1300 mm deep shows astrong linear correlation (R2¼0.98) with regard toelectrode site depth. The third region contains thedeepest sites, corresponding to the transitionbetween the fifth and sixth lamina, and has the low-est thresholds. These findings recapitulate previousmicrostimulation studies performed in the visualcortex which have demonstrated a similar depth-dependent effect (Bak et al., 1990; DeYoe et al.,2005; Tehovnik and Slocum, 2009).
Threshold stability varies with depth
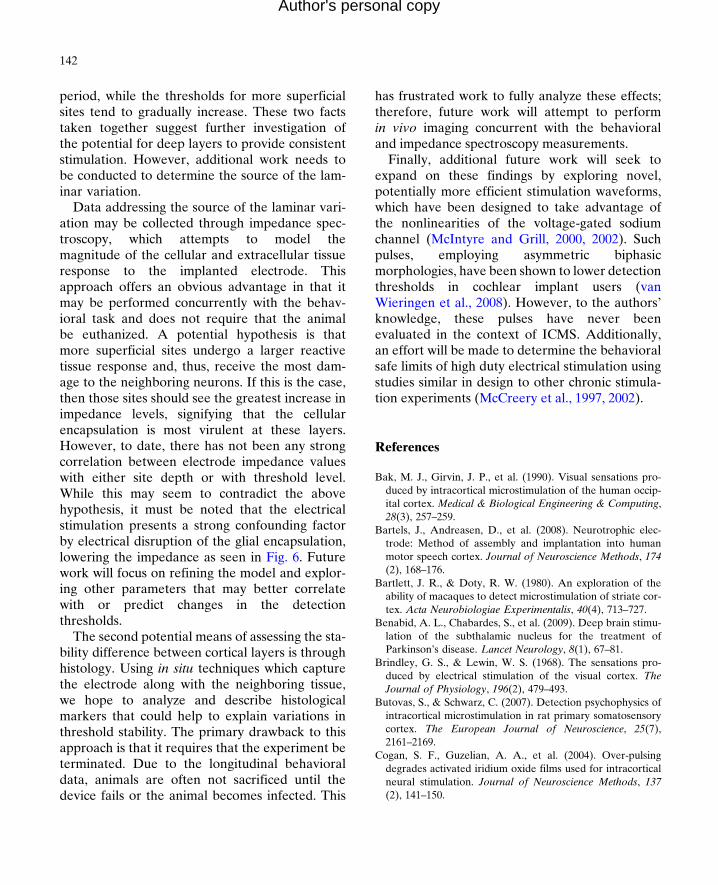
This experiment also helps to elucidate how thedepth of the electrode site affects device perfor-mance over time. During the 31 days after elec-trode placement, there appear to be threedistinct phases as seen in Fig. 4. In the first phase,

80(a)
70
60
50
40
Thr
esho
ld (
dB)
30
20
Frequency (kHz)
1010–1 100 101 102
(b) (c)
Depth (mm) Lamina
0.0
0.5
1.0
1.5
2.0
VI
DeepV
IV
II/III
I
050
60
70
80
90
100
110
120
130
140
150
Shallow
ElectrodeRat A1
Hit
Threshold
Miss
2
Stim
ula
tion
curr
ent (
uA)
4 6
Warning trial number
8 10 12 14
Fig. 1. Experimental background. (a) Sample audiogram generated by a rat in a single day. (b) Schematic representation of ratauditory cortex delineating histological layers as well as relative electrode site placement. (c) Sample rat adaptive threshold task:“○” represents a hit, “�” represents a miss, the bold line represents the threshold estimate.
135
Author's personal copy
which represents the first week after implanta-tion, there is a relatively small difference betweenthe superficial sites and the deep sites. Addition-ally, there is a gradual rise in the thresholds forall sites. In the second phase, which representsroughly the second week after surgery, the
superficial and deep sites begin to separate withthreshold levels for the deepest sites decliningand the most superficial sites remaining relativelyconstant. In the third and final phase, thresholdsbegin to increase again for all but the deepestsites.
0 20 40
1500
1400
1300
1200
1100
1000
900
800
700
600
500
400
300
200
100
0
1400
1300
1200
1100
1000
900
800
700
600
500
400
300
200
100R
ecor
ding
cha
nnel
dep
th (
mm)
Time (ms)
0 20 40
Fig. 2. Sample recording to determine electrode depth location. The left panel shows the averaged local field potentials. The rightpanel shows the second spatial derivative of the left panel, a method known as current source density analysis (CSD).
136
Author's personal copy
Impedance
Implanted electrodes and adjacent tissue form anelectrochemical interface that can be characterizedvia electrochemical measurement techniques. Themost common, electrochemical impedance spec-troscopy (EIS) measures the impedance magni-tude and phase via sinusoidal voltage excitationbetween the electrode and distant reference atmultiple frequencies. EIS provides insight onrecording noise levels and safe stimulationlevels. Chronic functionality of intracorticalmicroelectrodes requires stable interfacial imped-ance; however, this is challenging. The reactive tis-sue response has been shown to affect theimpedance at the electrode–tissue interface sinceencapsulated, damaged tissue display high
impedance (Williams et al., 2007). Electrical stimu-lation can further alter the electrical properties ofthe tissue, as well as the electrode (Cogan et al.,2004; Weiland and Anderson, 2000; Wilks et al.,2009).
Historical studies show impedancemeasurementsfrom chronically implanted electrodes showingtrends of increasing impedance during the first 2–3weeks, and then stabilizing, with a reduction invariability between sites and days (Ludwig et al.,2006; Vetter et al., 2004). This trend correspondswell with the time course of the reactive tissueresponse (Williams et al., 2007). Figure 5a showsaverage daily 1 kHz impedancemagnitude for threeprobes implanted in three different rats and sub-jected to daily microstimulation. The impedanceincreases sharply during the first week after
Shallow sites
120
100
80
60
40
20
Liner region:R2= 0 .98
00.0 250.0
Thr
esho
ld (
nC/p
hase
)
500.0 750.0
Site depth (mm)
1000.0 1250.0 1500.0
Deep sites
Fig. 3. Mean thresholds for all six rats averaged by electrode site. Points highlighted as “deep” and “shallow” sites have statisticallyequivalent threshold levels. The linear region represents a transition zone. Regression analysis was performed on the thresholdmean from 300 to 1300 mm deep. Error bars show the standard error of the mean.
137
Author's personal copy
implantation and then gradually decreases back tobaseline after day 21. Rather than stabilizing,impedance magnitude and site-to-site variabilityincrease after this point. A similar trend is observedwith the day-to-day changes in behavioralthresholds (Fig. 4).Pronounced changes in the impedance spectra
occur after 2 days postimplant and a subsequenttrial of microstimulation. As seen in Fig. 5b, theNyquist plot becomes gradually less linear overthe duration of the implant associated with theprogression of the reactive tissue response. Theoriginal linearity is partially restored after a trialof microstimulation, similar to that seen within vivo voltage biasing (Otto et al., 2006). As pre-viously seen with the in vivo biasing, the reduc-tion in impedance is temporary, and the increasein impedance magnitude and variability after 3weeks of implantation is most likely attributedto tissue and electrode material damage caused
by microstimulation amplitudes as high as50–100 mA (1.6–3.2 mC/cm2) which exceed thethreshold for neural damage (Shannon, 1992)and iridium oxide damage (Cogan et al., 2004;Wilks et al., 2009).
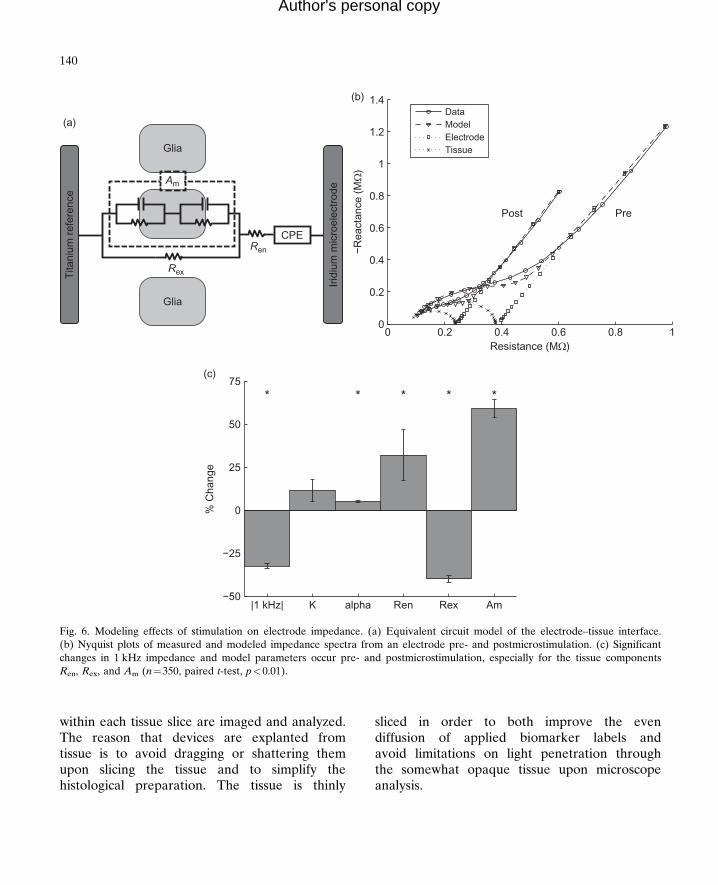
EIS data can be fit to an equivalent circuitmodel to enable in vivo assessment of both theelectrode and tissue. As seen in Fig. 6a, the modelcomprises a constant phase element (CPE)representing the electrode component, a sealingresistance (Ren) representing adsorbed proteins,extracellular resistance (Rex), and parallel RC(resistive/capacitive) components representingcell membranes of the glial sheath (Johnsonet al., 2005; Otto et al., 2006). The electrode com-ponent is broken down into a magnitude (K) andphase scaling term (a), and the membrane com-ponent is lumped into a single scaling term(Am). Figure 6b shows impedance spectra andfitted model data, as well as individual tissue

0 5 10 15 20 25 30 350
50
100
150
200
Day postimplant
Thr
esho
ld (
nC/p
hase
)
0−300 mm 400−700 mm800−1100 mm1200−1500 mmAverage
Fig. 4. Mean thresholds (represented on the Y-axis) for all six rats lumped into depth regions and averaged by days postimplant.The threshold, that is, the current amplitude for which the rat’s detection probability equaled 50%, is represented in terms of nCper phase, which is the product of the current amplitude and the duration of the first phase. The data represent the first month(31 days) after implantation. In the first week (days 1–7), thresholds tend to rise together. In the second week (days 8–14),thresholds tend to recover with deeper sites decreasing the most. In the final phase, thresholds tend to increase in the superficialsites, while thresholds at deep sites are relatively stable. Error bars show the standard error of the mean.
138
Author's personal copy
and electrode model components, pre- and post-microstimulation application. Microstimulationleads to an immediate decrease in impedancewith the largest changes occurring in Am and Rex
(Fig. 6c), indicating changes in the encapsulatedtissue and extracellular space.
Maintaining a stable, low-impedance interfaceis important in the continuing functionality ofintracortical microelectrodes. Changes in the cel-lular environment influence the day-to-dayimpedance changes which are similar to the day-to-day changes in behavioral threshold levels,revealing a complex interaction between the reac-tive tissue response, changes in electrode pro-perties, and device performance. Repeatedmicrostimulation likely results in additional tissueand electrode damage. However, because the
stimulation seems to necessarily disrupt the tissueresponse adjacent to the electrode site, it is diffi-cult to systematically study this interaction. None-theless, it remains an a priori truth that thedevelopment of devices and techniques to miti-gate adverse tissue responses and deliver non-damaging, behaviorally relevant electricalstimulation to the electrode and tissue is essentialto maintain a stable, low-impedance interface anda healthy surrounding neural population.
Histology
To investigate whether and how tissue changes atthe electrode interface might be affecting long-term device utility, histological labeling and

0 10 20 30 40 50 600
200
400
600
800
1000
1200
1400
Days postimplant
1-kH
z Im
peda
nce
(kΩ
)
(a)
0 0.2 0.4 0.6 0.8 1 1.20
0.1
0.2
0.3
0.4
0.5
0.6
0.7(b)
Resistance (MΩ)
−R
eact
ance
(M
Ω)
Days
Stimulate
Fig. 5. Impedance stability over time. (a) Mean 1 kHz impedance magnitudes from three electrodes arrays implanted in threedifferent rats subjected to daily microstimulation. Consistent across each implantation, the impedance magnitude increases withtime postimplant. (b) Nyquist plots from three electrode arrays taken immediately after implantation, 1 and 2 days postimplant(solid lines), and immediately after electrical stimulation (dotted line). This is an example of typical trends in impedance changesafter implantation and electrical stimulation.
139
Author's personal copy
imaging techniques are often employed (Polikovet al., 2005; Stensaas and Stensaas, 1978; Turneret al., 1999). Microscope-based analysis, akin totraditional pathological analysis, can be
performed on brain tissue to investigate the tissueresponse in each subject at a single, final timepoint. Typically, the locations of appliedbiomarkers relative to explanted-device holes
Rex
Am
Ren
CPE
Glia
Tita
nium
ref
eren
ce
Irid
ium
mic
roel
ectr
ode
Glia
(a)
0 0.2 0.4 0.6 0.8 10
0.2
0.4
0.6
0.8
1
1.2
1.4(b)
Resistance (MΩ)−
Rea
ctan
ce (
MΩ
)
PrePost
DataModelElectrodeTissue
|1 kHz| K alpha Ren Rex Am−50
−25
0
25
50
75(c)
% C
hang
e
* * * * *
Fig. 6. Modeling effects of stimulation on electrode impedance. (a) Equivalent circuit model of the electrode–tissue interface.(b) Nyquist plots of measured and modeled impedance spectra from an electrode pre- and postmicrostimulation. (c) Significantchanges in 1 kHz impedance and model parameters occur pre- and postmicrostimulation, especially for the tissue componentsRen, Rex, and Am (n¼350, paired t-test, p<0.01).
140
Author's personal copy
within each tissue slice are imaged and analyzed.The reason that devices are explanted fromtissue is to avoid dragging or shattering themupon slicing the tissue and to simplify thehistological preparation. The tissue is thinly
sliced in order to both improve the evendiffusion of applied biomarker labels andavoid limitations on light penetration throughthe somewhat opaque tissue upon microscopeanalysis.

141
Author's personal copy
While explanting devices and taking thin(<50 mm) tissue slices has provided significantdata on the tissue changes that occur aroundchronic ICMS arrays (McConnell et al., 2009;Turner et al., 1999; Winslow and Tresco, 2010),this method produces tissue with morphologicaldistortion at the interfacing tissue (Holeckoet al., 2005). The former location of electrodesites is also difficult to determine once the devicehas been explanted. Also, because histologicallabels diffuse from applied solutions into the tis-sue, surfaces contacting the solution can haveincreased labeling, leading to possibly misleadinglabel intensity at the surface of explant holes. Toavoid these problems, the authors have devel-oped a method to collect, label, and image thein situ implanted device and its surroundingtissue.Figure 7 presents example microscope data
taken around an implanted device, left in situwithin a thicker (>100 mm) histological slice.Using chemical and immunohistochemical label-ing techniques, biomarkers for inflammation, spe-cific cell types, and other items of interest can befluorescently tagged. After labeling, the tissueand devices can then be imaged using a laserscanning confocal microscope. Images takenalong the depth of the intact implant (Fig. 7a
(a) (b) (c)
Fig. 7. In situ histology to investigate the intact device/tissue interfaccaptured in fixed brain tissue and imaged by laser confocal microscthe protein Iba1 with the fluorescent marker Alexa Fluor 633,dependent fashion around this 1-week implanted device. (c) A 10-mcollecting laser reflectance; (d) microglia at this same location areimplantation. (e) Microglia filopodia investigating the device’s surfaoverlay. Scale bars indicate 200 mm in (a) and (b), and 50 mm in (c–
and b) allow investigation of tissue changesrelated to cortical depth. Close investigation oftissue at the device surface or even around indi-vidual electrode sites is also performed (Fig. 7c–e),revealing the local distribution of labeledelements relative to the intact electrode–tissueinterface.
Conclusion and future work
The development of a functional sensory prosthe-sis that interfaces directly with the human cortexis a daunting challenge with many obstacles toovercome. However, before any of these may beaddressed, it is important to first optimize theelectrode design, the implantation technique,and the stimulation parameters.
This chapter reports data and two potentialways of assessing that data. First, the data clearlydemonstrate that there is a laminar variation interms of detection threshold for ICMS in whichthe deepest sites, roughly corresponding to layersV and VI, are the most sensitive. Second, the dataalso demonstrate that there is laminar variation interms of threshold stability over the first monthafter implantation. Sites that are deepest in cortexmaintain their threshold during the 1-month trial
(d) (e)
e. (a) Transmission light image showing a microelectrode arrayopy. (b) Microglia, labeled by immunohistochemically taggingare seen in a single optical section responding in a layer-m-thick z-stack of images shows the device surface imaged byshown responding to the presence of the device 24 h afterce and neighboring tissue are further presented in this imagee).
142
Author's personal copy
period, while the thresholds for more superficialsites tend to gradually increase. These two factstaken together suggest further investigation ofthe potential for deep layers to provide consistentstimulation. However, additional work needs tobe conducted to determine the source of the lam-inar variation.
Data addressing the source of the laminar vari-ation may be collected through impedance spec-troscopy, which attempts to model themagnitude of the cellular and extracellular tissueresponse to the implanted electrode. Thisapproach offers an obvious advantage in that itmay be performed concurrently with the behav-ioral task and does not require that the animalbe euthanized. A potential hypothesis is thatmore superficial sites undergo a larger reactivetissue response and, thus, receive the most dam-age to the neighboring neurons. If this is the case,then those sites should see the greatest increase inimpedance levels, signifying that the cellularencapsulation is most virulent at these layers.However, to date, there has not been any strongcorrelation between electrode impedance valueswith either site depth or with threshold level.While this may seem to contradict the abovehypothesis, it must be noted that the electricalstimulation presents a strong confounding factorby electrical disruption of the glial encapsulation,lowering the impedance as seen in Fig. 6. Futurework will focus on refining the model and explor-ing other parameters that may better correlatewith or predict changes in the detectionthresholds.
The second potential means of assessing the sta-bility difference between cortical layers is throughhistology. Using in situ techniques which capturethe electrode along with the neighboring tissue,we hope to analyze and describe histologicalmarkers that could help to explain variations inthreshold stability. The primary drawback to thisapproach is that it requires that the experiment beterminated. Due to the longitudinal behavioraldata, animals are often not sacrificed until thedevice fails or the animal becomes infected. This
has frustrated work to fully analyze these effects;therefore, future work will attempt to performin vivo imaging concurrent with the behavioraland impedance spectroscopy measurements.
Finally, additional future work will seek toexpand on these findings by exploring novel,potentially more efficient stimulation waveforms,which have been designed to take advantage ofthe nonlinearities of the voltage-gated sodiumchannel (McIntyre and Grill, 2000, 2002). Suchpulses, employing asymmetric biphasicmorphologies, have been shown to lower detectionthresholds in cochlear implant users (vanWieringen et al., 2008). However, to the authors’knowledge, these pulses have never beenevaluated in the context of ICMS. Additionally,an effort will be made to determine the behavioralsafe limits of high duty electrical stimulation usingstudies similar in design to other chronic stimula-tion experiments (McCreery et al., 1997, 2002).
References
Bak, M. J., Girvin, J. P., et al. (1990). Visual sensations pro-duced by intracortical microstimulation of the human occip-ital cortex. Medical & Biological Engineering & Computing,28(3), 257–259.
Bartels, J., Andreasen, D., et al. (2008). Neurotrophic elec-trode: Method of assembly and implantation into humanmotor speech cortex. Journal of Neuroscience Methods, 174(2), 168–176.
Bartlett, J. R., & Doty, R. W. (1980). An exploration of theability of macaques to detect microstimulation of striate cor-tex. Acta Neurobiologiae Experimentalis, 40(4), 713–727.
Benabid, A. L., Chabardes, S., et al. (2009). Deep brain stimu-lation of the subthalamic nucleus for the treatment ofParkinson’s disease. Lancet Neurology, 8(1), 67–81.
Brindley, G. S., & Lewin, W. S. (1968). The sensations pro-duced by electrical stimulation of the visual cortex. TheJournal of Physiology, 196(2), 479–493.
Butovas, S., & Schwarz, C. (2007). Detection psychophysics ofintracortical microstimulation in rat primary somatosensorycortex. The European Journal of Neuroscience, 25(7),2161–2169.
Cogan, S. F., Guzelian, A. A., et al. (2004). Over-pulsingdegrades activated iridium oxide films used for intracorticalneural stimulation. Journal of Neuroscience Methods, 137(2), 141–150.

143
Author's personal copy
DeYoe, E. A., Lewine, J. D., et al. (2005). Laminar variationin threshold for detection of electrical excitation of striatecortex by macaques. Journal of Neurophysiology, 94(5),3443–3450.
Dobelle, W. H. (2000). Artificial vision for the blind by con-necting a television camera to the visual cortex. ASAIOJournal, 46(1), 3–9.
Dobelle, W. H., & Mladejovsky, M. G. (1974). Phosphenesproduced by electrical stimulation of human occipital cortex,and their application to the development of a prosthesis forthe blind. The Journal of Physiology, 243(2), 553–576.
Dobelle, W. H., Stensaas, S. S., et al. (1973). A prosthesis forthe deaf based on cortical stimulation. The Annals ofOtology, Rhinology, and Laryngology, 82(4), 445–463.
Heffner, H. E., Heffner, R. S., et al. (1994). Audiogram of thehooded Norway rat. Hearing Research, 73(2), 244–247.
Hochberg, L. R., Serruya, M. D., et al. (2006). Neuronalensemble control of prosthetic devices by a human withtetraplegia. Nature, 442(7099), 164–171.
Holecko, M. M., 2nd, Williams, J. C., et al. (2005). Visualiza-tion of the intact interface between neural tissue andimplanted microelectrode arrays. Journal of Neural Engi-neering, 2(4), 97–102.
Johnson, M. D., Otto, K. J., et al. (2005). Repeated voltagebiasing improves unit recordings by reducing resistive tissueimpedances. IEEE Transactions on Neural Systems andRehabilitation Engineering, 13(2), 160–165.
Kelly, J. B., Cooke, J. E., et al. (2006). Behavioral limits ofauditory temporal resolution in the rat: Amplitude modula-tion and duration discrimination. Journal of ComparativePsychology, 120(2), 98–105.
Kelly, J. B., & Masterton, B. (1977). Auditory sensitivity of thealbino rat. Journal of Comparative and Physiological Psy-chology, 91(4), 930–936.
Kennedy, P. R., & Bakay, R. A. E. (1998). Restoration of neu-ral output from a paralyzed patient by a direct brain connec-tion. NeuroReport, 9(8), 1707–1711.
Kim, S.-P., et al. (2008). Neural control of computer cursorvelocity by decodingmotor cortical spiking activity in humanswith tetraplegia. Journal of Neural Engineering, 5(4), 455.
Ludwig, K. A., Uram, J. D., et al. (2006). Chronic neuralrecordings using silicon microelectrode arrays electrochemi-cally deposited with a poly(3,4-ethylenedioxythiophene)(PEDOT) film. Journal of Neural Engineering, 3(1), 59–70.
McConnell,G.C., et al. (2009). Implantedneural electrodes causechronic, local inflammation that is correlated with local neu-rodegeneration. Journal of Neural Engineering, 6(5), 056003.
McCreery, D. B., Agnew, W. F., et al. (2002). The effects ofprolonged intracortical microstimulation on the excitabilityof pyramidal tract neurons in the cat. Annals of BiomedicalEngineering, 30(1), 107–119.
McCreery, D. B., Yuen, T. G., et al. (1997). A characterizationof the effects on neuronal excitability due to prolonged
microstimulation with chronically implantedmicroelectrodes. IEEE Transactions on Biomedical Engi-neering, 44(10), 931–939.
McIntyre, C. C., & Grill, W. M. (2000). Selectivemicrostimulation of central nervous system neurons. Annalsof Biomedical Engineering, 28(3), 219–233.
McIntyre, C. C., & Grill, W. M. (2002). Extracellular stimula-tion of central neurons: Influence of stimulus waveformand frequency on neuronal output. Journal of Neurophysiol-ogy, 88(4), 1592–1604.
Müller-Preuss, P., & Mitzdorf, U. (1984). Functional anatomyof the inferior colliculus and the auditory cortex: Currentsource density analyses of click-evoked potentials. HearingResearch, 16(2), 133–142.
Murasugi, C. M., Salzman, C. D., et al. (1993).Microstimulation in visual area MT: Effects of varying pulseamplitude and frequency. The Journal of Neuroscience, 13(4), 1719–1729.
O’Doherty, J. E., Lebedev, M., et al. (2009). A brain-machineinterface instructed by direct intracortical microstimulation.Frontiers in Neuroengineering, 2(7), 1–8.
Otto, K. J., Johnson, M. D., et al. (2006). Voltage pulseschange neural interface properties and improve unitrecordings with chronically implanted microelectrodes.IEEE Transactions on Biomedical Engineering, 53(2),333–340.
Otto, K. J., Rousche, P. J., et al. (2005a). Corticalmicrostimulation in auditory cortex of rat elicits best-fre-quency dependent behaviors. Journal of Neural Engineer-ing, 2(2), 42–51.
Otto, K. J., Rousche, P. J., et al. (2005b). Microstimulation inauditory cortex provides a substrate for detailed behaviors.Hearing Research, 210(1–2), 112–117.
Paxinos, G., & Watson, C. (2007). The rat brain in stereotaxiccoordinates. San Diego, CA: Academic Press.
Penfield, W., & Boldrey, E. (1937). Somatic motor and sen-sory representation in the cerebral cortex of man as studiedby electrical stimulation. Brain, 60, 389–443.
Penfield, W., & Mullan, S. (1957). Illusions of perceptionand the temporal cortex. Transactions of the AmericanNeurological Association 82nd Meeting: 6–8, discussion8–9.
Penfield, W., & Perot, P. (1963). The brain’s record of audi-tory and visual experience. Brain, 86, 595–696.
Polikov, V. S., Tresco, P. A., et al. (2005). Response of braintissue to chronically implanted neural electrodes. Journalof Neuroscience Methods, 148(1), 1–18.
Romo, R., Hernandez, A., et al. (1998). Somatosensory dis-crimination based on cortical microstimulation. Nature, 392(6674), 387–390.
Romo, R., Hernandez, A., et al. (2000). Sensing without touch-ing: Psychophysical performance based on corticalmicrostimulation. Neuron, 26(1), 273–278.

144
Author's personal copy
Rousche, P. J., & Normann, R. A. (1999). Chronic intracorticalmicrostimulation (ICMS) of cat sensory cortex using theUtah Intracortical Electrode Array. IEEE Transactions onRehabilitation Engineering, 7(1), 56–68.
Salzman, C. D., Britten, K. H., et al. (1990). Corticalmicrostimulation influences perceptual judgements ofmotion direction. Nature, 346(6280), 174–177.
Schmidt, E. M., Bak, M. J., et al. (1996). Feasibility of a visualprosthesis for the blind based on intracorticalmicrostimulation of the visual cortex. Brain, 119(Pt. 2),507–522.
Shannon, R. V. (1992). A model of safe levels for electricalstimulation. IEEE Transactions on Biomedical Engineering,39(4), 424–426.
Stensaas, S. S., & Stensaas, L. J. (1978). Histopathologicalevaluation of materials implanted in cerebral-cortex. ActaNeuropathologica, 41(2), 145–155.
Tehovnik, E. J., & Slocum, W. M. (2009). Depth-dependentdetection of microampere currents delivered to monkeyV1. The European Journal of Neuroscience, 29(7),1477–1489.
Tehovnik, E. J., Slocum, W. M., et al. (2003). Saccadic eyemovements evoked by microstimulation of striate cortex.The European Journal of Neuroscience, 17(4), 870–878.
Turner, J. N., Shain, W., et al. (1999). Cerebral astrocyteresponse to micromachined silicon implants. ExperimentalNeurology, 156(1), 33–49.
van Wieringen, A., Macherey, O., et al. (2008). Alternativepulse shapes in electrical hearing. Hearing Research, 242(1–2), 154–163.
Vetter, R. J., Williams, J. C., et al. (2004). Chronic neuralrecording using silicon-substrate microelectrode arraysimplanted in cerebral cortex. IEEE Transactions on Bio-medical Engineering, 51(6), 896–904.
Weiland, J. D., & Anderson, D. J. (2000). Chronic neural stim-ulation with thin-film, iridium oxide electrodes. IEEETransactions on Biomedical Engineering, 47(7), 911–918.
Wilks, S. J., Richardson-Burns, S. M., et al. (2009). Poly(3,4-ethylenedioxythiophene) as a micro-neural interface mate-rial for electrostimulation. Frontiers in Neuroengineering, 3(20), 1–8.
Williams, J. C., Hippensteel, J. A., et al. (2007). Compleximpedance spectroscopy for monitoring tissue responses toinserted neural implants. Journal of Neural Engineering, 4,410–423.
Winslow, B. D., & Tresco, P. A. (2010). Quantitative analysisof the tissue response to chronically implanted microwireelectrodes in rat cortex. Biomaterials, 31(7), 1558–1567.