V4, A Modern Mitteleuropa
36
1 Attila Marján – Lorina Buda: V4, A Modern Mitteleuropa The paper highlights the similarities and differences in the development paths of the four so called Visegrad countries (Poland, Hungary, Czech Republic, Slovakia, leaving countries like Slovenis, Croatia out) focussing on the economic policies of the period of 2004-2014, representing the first decade of their EU-membership, providing insight in their economic policy decisions. Introduction There are diverse and contrasting interpretations and connotations of the concept of Mitteleuropa. It served as an idealistic model for a multicultural, multinational region with common features and geopolitical realities that is situated between the German and Russian power bloc. The Central-European Federation was the ultimate political vision of this line of thought. This somewhat nostalgic interpretation was invented and maintained by mainly the liberal intelligentsia of the late Habsburg era. There is although another Mitteleuropa vision of Prussian origin - that found its way to mainstream German geopolitical strategy during World War I. - as a pan-Germanist imperium spreading way into East-Europe. This paper has no intention to engage in the academic debate on this subject. It chooses the Visegrad 4 countries as key nation states of this region of Mitteleuropa in its narrow geographical sense because of geopolitical realities. In 1335 when the first summit in Visegrad took place, Casimir III of Poland, Charles I of Hungary, and John I of Bohemia had two objectives: to strengthen their economic and political cooperation and to form a regional alliance to counter the power of the duke of Austria and of the Holy Roman Emperor. Some seven hundred years later in a completely different Europe regional cooperation still has a lot to offer but it has had several impediments to flourish in central Europe. The modern times cooperation in the V4 group since its formation in 1991 in a Hungarian town called Visegrad has had its ups and downs: it almost fell apart in December 2003 in
Transcript of V4, A Modern Mitteleuropa
1
Attila Marján – Lorina Buda: V4, A Modern Mitteleuropa
The paper highlights the similarities and differences in the development paths of the four so
called Visegrad countries (Poland, Hungary, Czech Republic, Slovakia, leaving countries like
Slovenis, Croatia out) focussing on the economic policies of the period of 2004-2014,
representing the first decade of their EU-membership, providing insight in their economic
policy decisions.
Introduction
There are diverse and contrasting interpretations and connotations of the concept of
Mitteleuropa. It served as an idealistic model for a multicultural, multinational region with
common features and geopolitical realities that is situated between the German and Russian
power bloc. The Central-European Federation was the ultimate political vision of this line of
thought. This somewhat nostalgic interpretation was invented and maintained by mainly the
liberal intelligentsia of the late Habsburg era. There is although another Mitteleuropa vision of
Prussian origin - that found its way to mainstream German geopolitical strategy during World
War I. - as a pan-Germanist imperium spreading way into East-Europe. This paper has no
intention to engage in the academic debate on this subject. It chooses the Visegrad 4 countries
as key nation states of this region of Mitteleuropa in its narrow geographical sense because of
geopolitical realities.
In 1335 when the first summit in Visegrad took place, Casimir III of Poland, Charles I of
Hungary, and John I of Bohemia had two objectives: to strengthen their economic and
political cooperation and to form a regional alliance to counter the power of the duke of
Austria and of the Holy Roman Emperor. Some seven hundred years later in a completely
different Europe regional cooperation still has a lot to offer but it has had several impediments
to flourish in central Europe.
The modern times cooperation in the V4 group since its formation in 1991 in a Hungarian
town called Visegrad has had its ups and downs: it almost fell apart in December 2003 in
2
Copenhagen when EU accession terms were to be finalized: a killing competition took place
among the four on who gets the most of the cohesion and agricultural funds.
The group of four central European EU member states, if counted as a single nation state, V4
(64,3 million inhabitants) would rank 22nd in the world and second in Europe, moreover it is
the seventh largest economy in Europe and the 15th globally. Before the introduction of the
double majority voting system they together have had equal number of weighted votes with
Germany and France put together. From November 2014, the double majority has been
replaced the old weighted voting system. According to the new rule the support of 55% of the
Member States representing 65 % of the overall population of the European Union will be
required. The new system significantly modifies the power distribution by strengthening the
influence of big Member States – with a population of 60 million; Spain and Poland will lose
their big Member State status and medium-sized countries’ - between 2 and 11 million
inhabitants - voting power will be reduced dramatically. In the new double majority system
the ability of countries with large population to block decisions will be significantly
reinforced, while small countries’ ability to prevent negative decisions will come to an end.
Germany and France will gain increased blocking capacities but V4 countries will not be able
to form any blocking coalition any longer. Even the new Member States joined in 2004 and
2007 will not be able to block decisions under the new system1. Nevertheless one has to bear
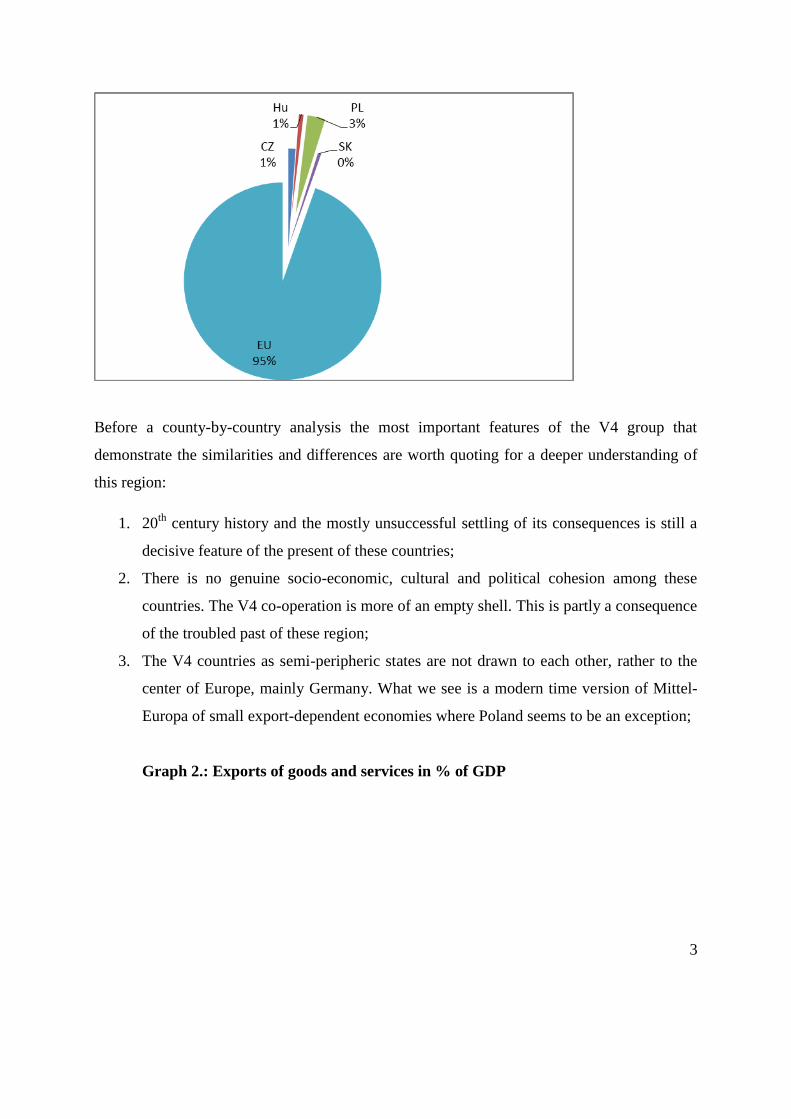
in mind that these countries stand for not more than 5 percent of the EU’s GDP (see graph
below)
Graph 1. Size of the V4 countries as per total EU GDP
1 Attila Marján: EU-rule changes force a Visegad re-think. Europe’s World. 2014. Spring
3
Before a county-by-country analysis the most important features of the V4 group that
demonstrate the similarities and differences are worth quoting for a deeper understanding of
this region:
1. 20th
century history and the mostly unsuccessful settling of its consequences is still a
decisive feature of the present of these countries;
2. There is no genuine socio-economic, cultural and political cohesion among these
countries. The V4 co-operation is more of an empty shell. This is partly a consequence
of the troubled past of these region;
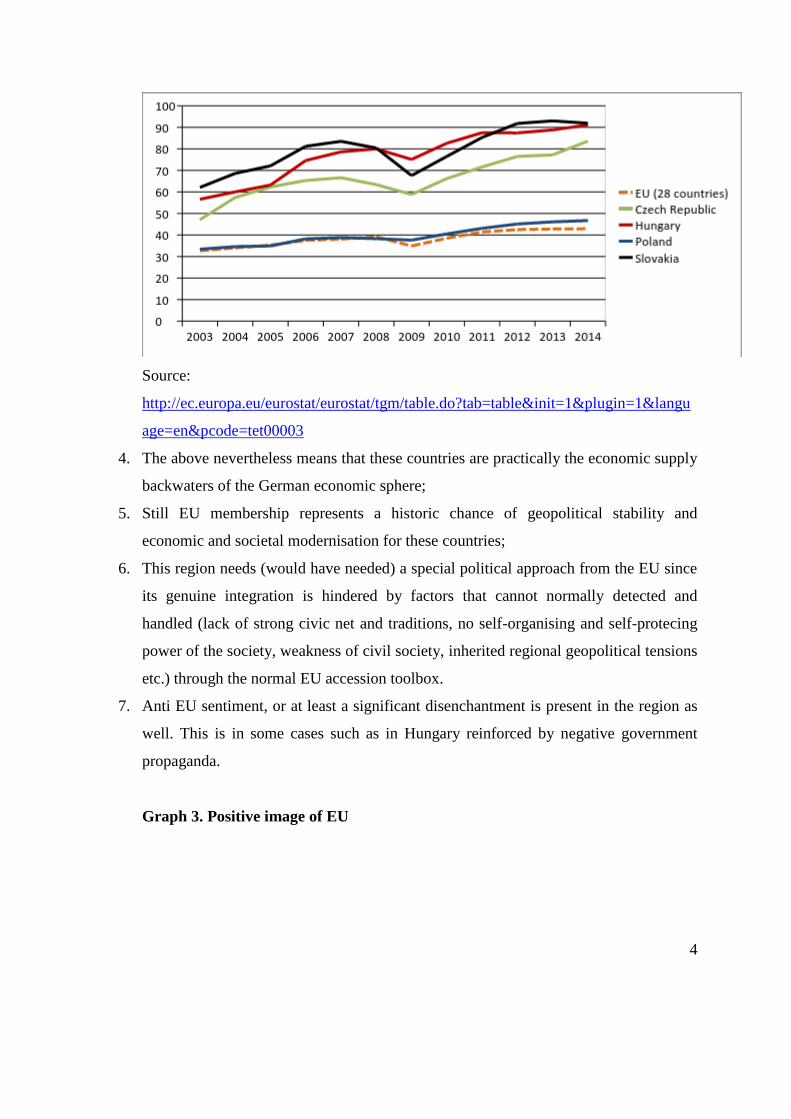
3. The V4 countries as semi-peripheric states are not drawn to each other, rather to the
center of Europe, mainly Germany. What we see is a modern time version of Mittel-
Europa of small export-dependent economies where Poland seems to be an exception;
Graph 2.: Exports of goods and services in % of GDP
4
Source:
http://ec.europa.eu/eurostat/eurostat/tgm/table.do?tab=table&init=1&plugin=1&langu
age=en&pcode=tet00003
4. The above nevertheless means that these countries are practically the economic supply
backwaters of the German economic sphere;
5. Still EU membership represents a historic chance of geopolitical stability and
economic and societal modernisation for these countries;
6. This region needs (would have needed) a special political approach from the EU since
its genuine integration is hindered by factors that cannot normally detected and
handled (lack of strong civic net and traditions, no self-organising and self-protecing
power of the society, weakness of civil society, inherited regional geopolitical tensions
etc.) through the normal EU accession toolbox.
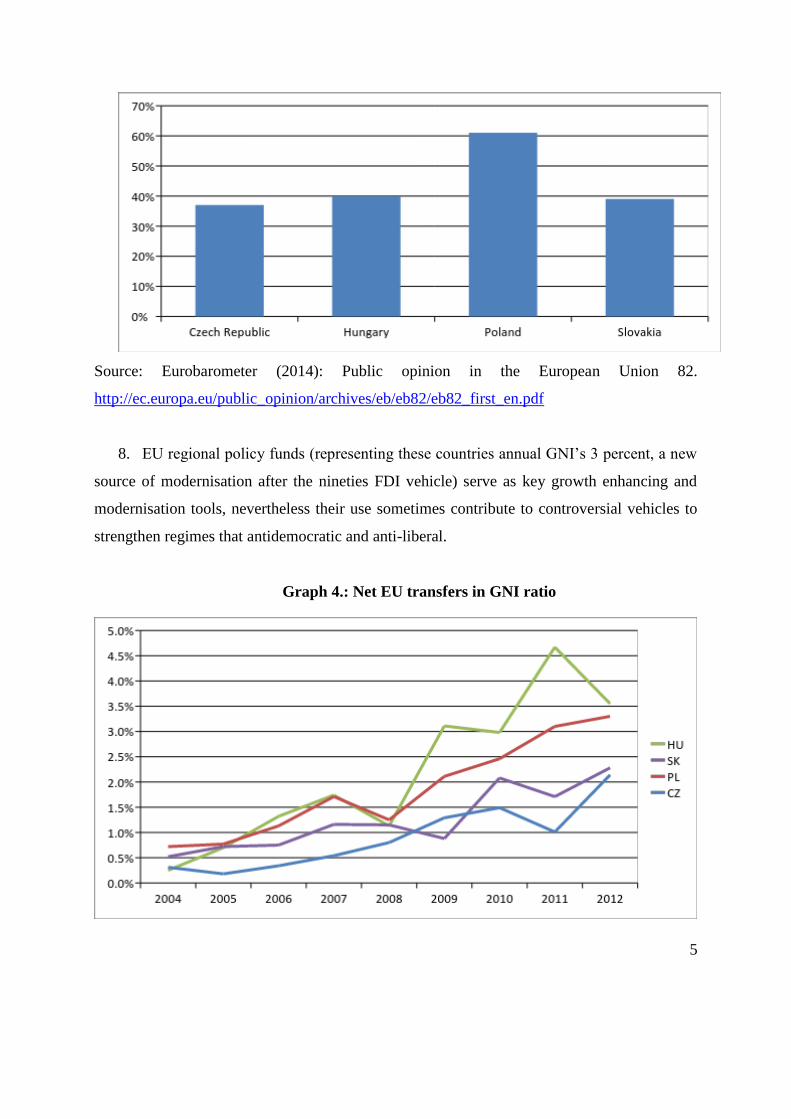
7. Anti EU sentiment, or at least a significant disenchantment is present in the region as
well. This is in some cases such as in Hungary reinforced by negative government
propaganda.
Graph 3. Positive image of EU
5
Source: Eurobarometer (2014): Public opinion in the European Union 82.
http://ec.europa.eu/public_opinion/archives/eb/eb82/eb82_first_en.pdf
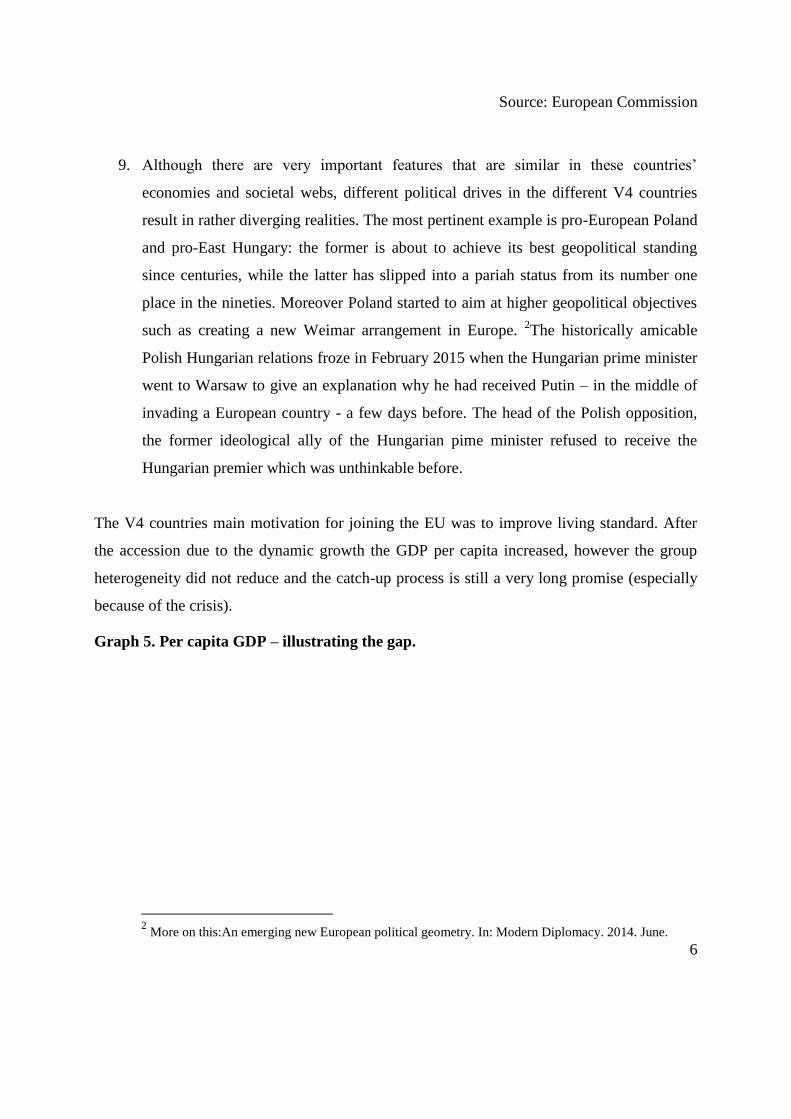
8. EU regional policy funds (representing these countries annual GNI’s 3 percent, a new
source of modernisation after the nineties FDI vehicle) serve as key growth enhancing and
modernisation tools, nevertheless their use sometimes contribute to controversial vehicles to
strengthen regimes that antidemocratic and anti-liberal.
Graph 4.: Net EU transfers in GNI ratio
6
Source: European Commission
9. Although there are very important features that are similar in these countries’
economies and societal webs, different political drives in the different V4 countries
result in rather diverging realities. The most pertinent example is pro-European Poland
and pro-East Hungary: the former is about to achieve its best geopolitical standing
since centuries, while the latter has slipped into a pariah status from its number one
place in the nineties. Moreover Poland started to aim at higher geopolitical objectives
such as creating a new Weimar arrangement in Europe. 2The historically amicable
Polish Hungarian relations froze in February 2015 when the Hungarian prime minister
went to Warsaw to give an explanation why he had received Putin – in the middle of
invading a European country - a few days before. The head of the Polish opposition,
the former ideological ally of the Hungarian pime minister refused to receive the
Hungarian premier which was unthinkable before.
The V4 countries main motivation for joining the EU was to improve living standard. After
the accession due to the dynamic growth the GDP per capita increased, however the group
heterogeneity did not reduce and the catch-up process is still a very long promise (especially
because of the crisis).
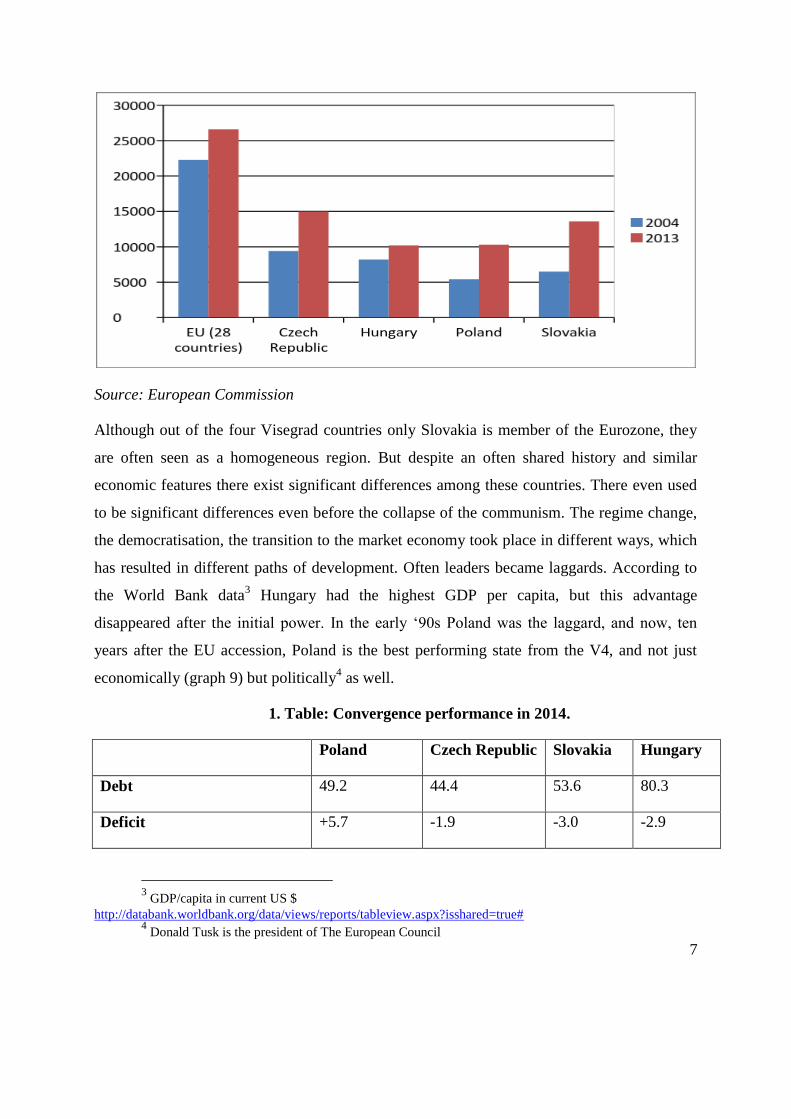
Graph 5. Per capita GDP – illustrating the gap.
2 More on this:An emerging new European political geometry. In: Modern Diplomacy. 2014. June.
7
Source: European Commission
Although out of the four Visegrad countries only Slovakia is member of the Eurozone, they
are often seen as a homogeneous region. But despite an often shared history and similar
economic features there exist significant differences among these countries. There even used
to be significant differences even before the collapse of the communism. The regime change,
the democratisation, the transition to the market economy took place in different ways, which
has resulted in different paths of development. Often leaders became laggards. According to
the World Bank data3 Hungary had the highest GDP per capita, but this advantage
disappeared after the initial power. In the early ‘90s Poland was the laggard, and now, ten
years after the EU accession, Poland is the best performing state from the V4, and not just
economically (graph 9) but politically4 as well.
1. Table: Convergence performance in 2014.
Hungary Slovakia Czech Republic Poland
80.3 53.6 44.4 49.2 Debt
-2.9 -3.0 -1.9 +5.7 Deficit
3 GDP/capita in current US $
http://databank.worldbank.org/data/views/reports/tableview.aspx?isshared=true# 4 Donald Tusk is the president of The European Council
8
1 -0.1 0.9 0.6 Inflation
5.8 2.7 2.2 4.2 Long-term interest rate
No No No Yes Country in excessive deficit
Source: ECB
In 2014 only one country from the four is under excessive deficit procedure, but in 2013 all of
them were under the procedure5. For Slovakia and the Czech Republic the procedure was
opened in 2009 and had to reduce its deficit 1% of GDP over the period 2010-13.
In case of Poland the procedure is ongoing. The procedure started in 20096, but Poland missed
the target by 2013, therefore in that year the Commission called Warsaw again to eliminate
the excessive deficit by 2015 with the following nominal deficit targets: 4.8% of GDP in
2013, 3.9% of GDP in 2014 and 2.8% of GDP in 20157. Forecasts present that deficit will
reduced to 2,5% of GDP by 2015, lower than the Council recommendation.
The Hungarian situation was a little bit different8, because this country was under the
procedure since 2004, the year of its EU accession. Firstly the Ecofin Council called on
Hungary to reduce its deficit by 2008. Because of the crisis the target could not met, so the
Council set 2011 as a new target. However Hungary met the target in 2011, but it was only
thanks to one-off revenues linked to the transfer of pension assets from private pension
schemes to the state. Since this measure is not a structural one, Hungary remained under the
procedure. After many negotiations in 2013, after 9 years, Hungary’s excessive debt has been
corrected.
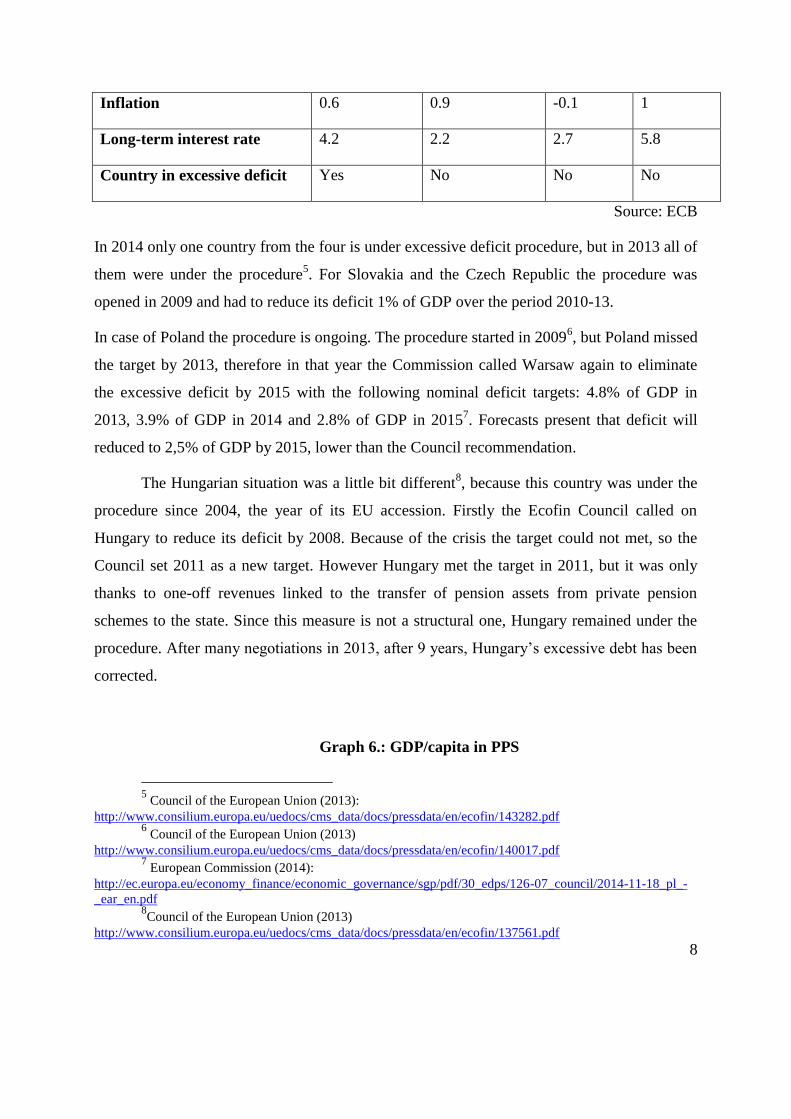
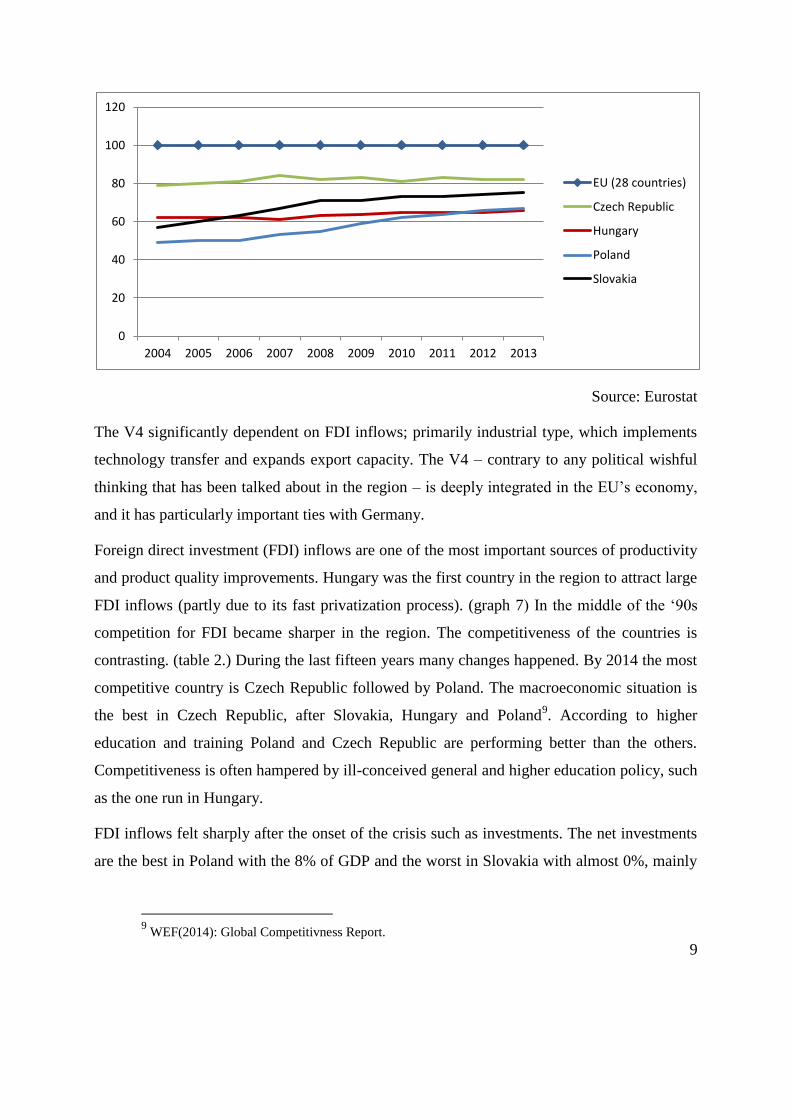
Graph 6.: GDP/capita in PPS
5 Council of the European Union (2013):
http://www.consilium.europa.eu/uedocs/cms_data/docs/pressdata/en/ecofin/143282.pdf 6 Council of the European Union (2013)
http://www.consilium.europa.eu/uedocs/cms_data/docs/pressdata/en/ecofin/140017.pdf 7 European Commission (2014):
http://ec.europa.eu/economy_finance/economic_governance/sgp/pdf/30_edps/126-07_council/2014-11-18_pl_-
_ear_en.pdf 8Council of the European Union (2013)
http://www.consilium.europa.eu/uedocs/cms_data/docs/pressdata/en/ecofin/137561.pdf
9
Source: Eurostat
The V4 significantly dependent on FDI inflows; primarily industrial type, which implements
technology transfer and expands export capacity. The V4 – contrary to any political wishful
thinking that has been talked about in the region – is deeply integrated in the EU’s economy,
and it has particularly important ties with Germany.
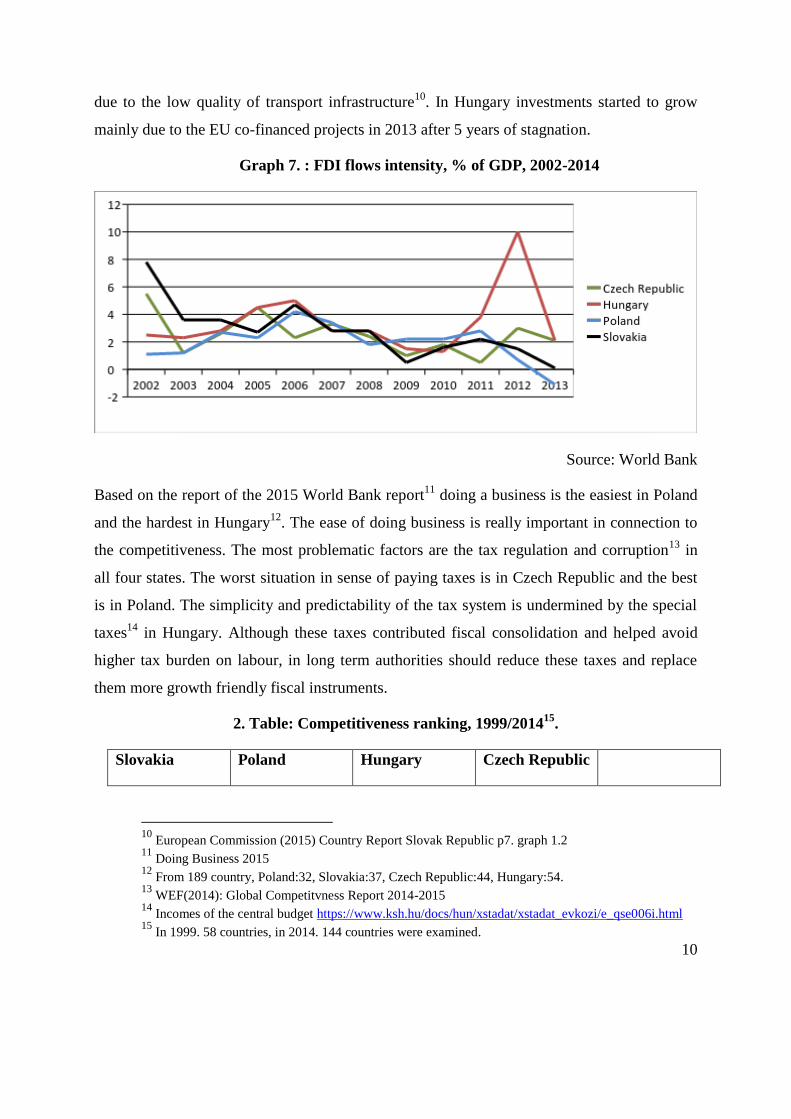
Foreign direct investment (FDI) inflows are one of the most important sources of productivity
and product quality improvements. Hungary was the first country in the region to attract large
FDI inflows (partly due to its fast privatization process). (graph 7) In the middle of the ‘90s
competition for FDI became sharper in the region. The competitiveness of the countries is
contrasting. (table 2.) During the last fifteen years many changes happened. By 2014 the most
competitive country is Czech Republic followed by Poland. The macroeconomic situation is
the best in Czech Republic, after Slovakia, Hungary and Poland9. According to higher
education and training Poland and Czech Republic are performing better than the others.
Competitiveness is often hampered by ill-conceived general and higher education policy, such
as the one run in Hungary.
FDI inflows felt sharply after the onset of the crisis such as investments. The net investments
are the best in Poland with the 8% of GDP and the worst in Slovakia with almost 0%, mainly
9 WEF(2014): Global Competitivness Report.
0
20
40
60
80
100
120
2004 2005 2006 2007 2008 2009 2010 2011 2012 2013
EU (28 countries)
Czech Republic
Hungary
Poland
Slovakia
10
due to the low quality of transport infrastructure10
. In Hungary investments started to grow
mainly due to the EU co-financed projects in 2013 after 5 years of stagnation.
Graph 7. : FDI flows intensity, % of GDP, 2002-2014
Source: World Bank
Based on the report of the 2015 World Bank report11
doing a business is the easiest in Poland
and the hardest in Hungary12
. The ease of doing business is really important in connection to
the competitiveness. The most problematic factors are the tax regulation and corruption13
in
all four states. The worst situation in sense of paying taxes is in Czech Republic and the best
is in Poland. The simplicity and predictability of the tax system is undermined by the special
taxes14
in Hungary. Although these taxes contributed fiscal consolidation and helped avoid
higher tax burden on labour, in long term authorities should reduce these taxes and replace
them more growth friendly fiscal instruments.
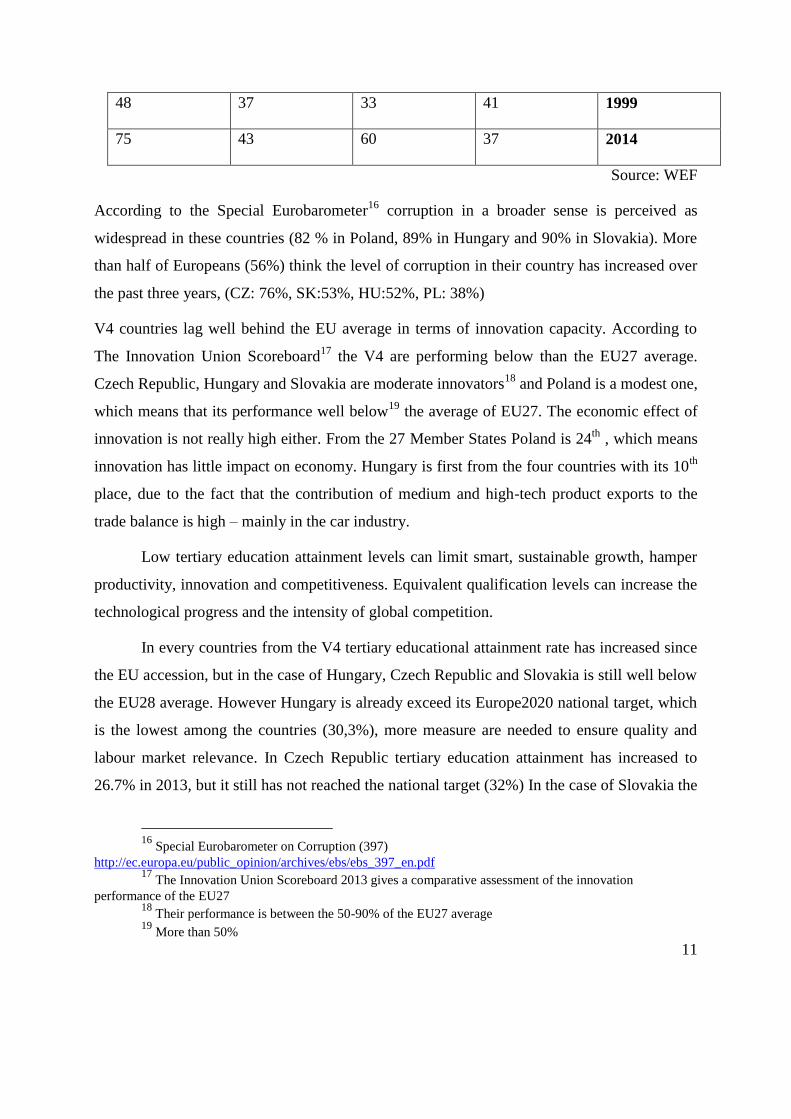
2. Table: Competitiveness ranking, 1999/201415
.
Czech Republic Hungary Poland Slovakia
10
European Commission (2015) Country Report Slovak Republic p7. graph 1.2 11
Doing Business 2015 12
From 189 country, Poland:32, Slovakia:37, Czech Republic:44, Hungary:54. 13
WEF(2014): Global Competitvness Report 2014-2015 14
Incomes of the central budget https://www.ksh.hu/docs/hun/xstadat/xstadat_evkozi/e_qse006i.html 15
In 1999. 58 countries, in 2014. 144 countries were examined.
11
1999 41 33 37 48
2014 37 60 43 75
Source: WEF
According to the Special Eurobarometer16
corruption in a broader sense is perceived as
widespread in these countries (82 % in Poland, 89% in Hungary and 90% in Slovakia). More
than half of Europeans (56%) think the level of corruption in their country has increased over
the past three years, (CZ: 76%, SK:53%, HU:52%, PL: 38%)
V4 countries lag well behind the EU average in terms of innovation capacity. According to
The Innovation Union Scoreboard17
the V4 are performing below than the EU27 average.
Czech Republic, Hungary and Slovakia are moderate innovators18
and Poland is a modest one,
which means that its performance well below19
the average of EU27. The economic effect of
innovation is not really high either. From the 27 Member States Poland is 24th
, which means
innovation has little impact on economy. Hungary is first from the four countries with its 10th
place, due to the fact that the contribution of medium and high-tech product exports to the
trade balance is high – mainly in the car industry.
Low tertiary education attainment levels can limit smart, sustainable growth, hamper
productivity, innovation and competitiveness. Equivalent qualification levels can increase the
technological progress and the intensity of global competition.
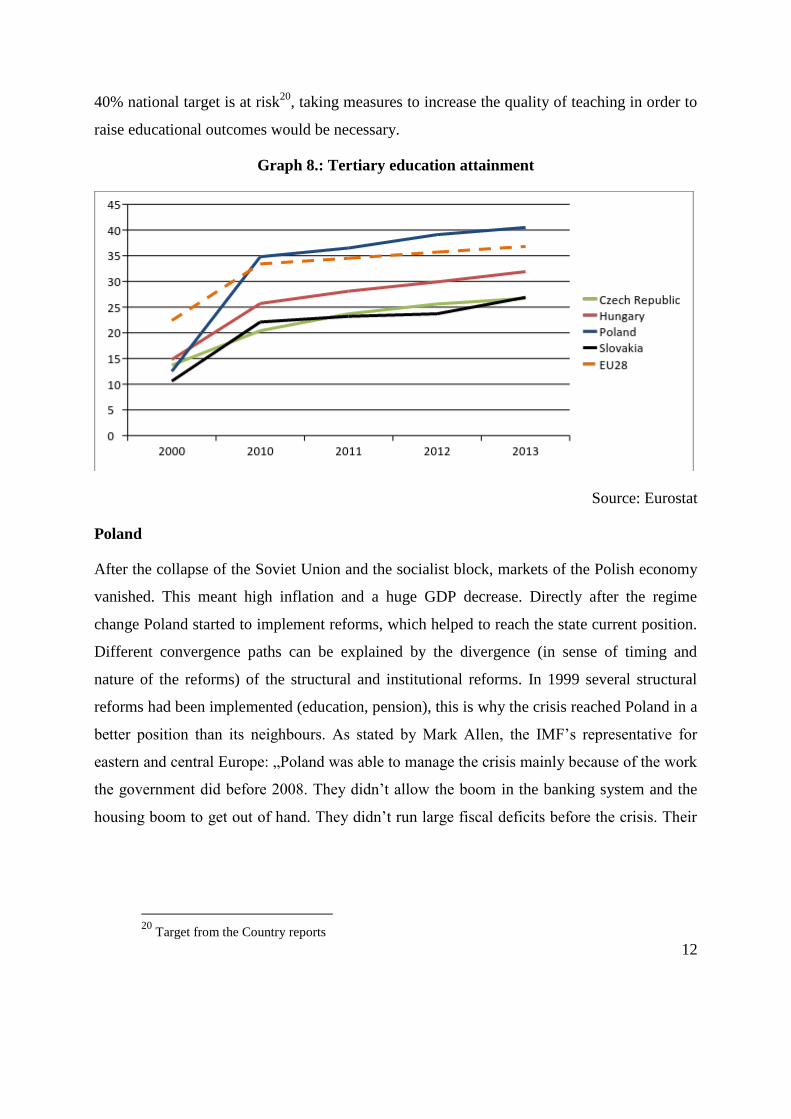
In every countries from the V4 tertiary educational attainment rate has increased since
the EU accession, but in the case of Hungary, Czech Republic and Slovakia is still well below
the EU28 average. However Hungary is already exceed its Europe2020 national target, which
is the lowest among the countries (30,3%), more measure are needed to ensure quality and
labour market relevance. In Czech Republic tertiary education attainment has increased to
26.7% in 2013, but it still has not reached the national target (32%) In the case of Slovakia the
16
Special Eurobarometer on Corruption (397)
http://ec.europa.eu/public_opinion/archives/ebs/ebs_397_en.pdf 17
The Innovation Union Scoreboard 2013 gives a comparative assessment of the innovation
performance of the EU27 18
Their performance is between the 50-90% of the EU27 average 19
More than 50%
12
40% national target is at risk20
, taking measures to increase the quality of teaching in order to
raise educational outcomes would be necessary.
Graph 8.: Tertiary education attainment
Source: Eurostat
Poland
After the collapse of the Soviet Union and the socialist block, markets of the Polish economy
vanished. This meant high inflation and a huge GDP decrease. Directly after the regime
change Poland started to implement reforms, which helped to reach the state current position.
Different convergence paths can be explained by the divergence (in sense of timing and
nature of the reforms) of the structural and institutional reforms. In 1999 several structural
reforms had been implemented (education, pension), this is why the crisis reached Poland in a
better position than its neighbours. As stated by Mark Allen, the IMF’s representative for
eastern and central Europe: „Poland was able to manage the crisis mainly because of the work
the government did before 2008. They didn’t allow the boom in the banking system and the
housing boom to get out of hand. They didn’t run large fiscal deficits before the crisis. Their
20
Target from the Country reports
13
debt, even though, at close to 55 percent, is a little bit high by emerging market standards, did
not give rise to concern. „21
Following important reforms which have deeply transformed the structure of the economy,
Poland has economically integrated to the eurozone, caught up steadily with the EU15 in
GDP-per-capita terms22
. By 2013, the country had achieved levels of income and quality of
life likely never experienced before. Since the accession GDP increased by 48,6% and 20%
from this growth was reported during the period 2008-201323
. (graph 5.)
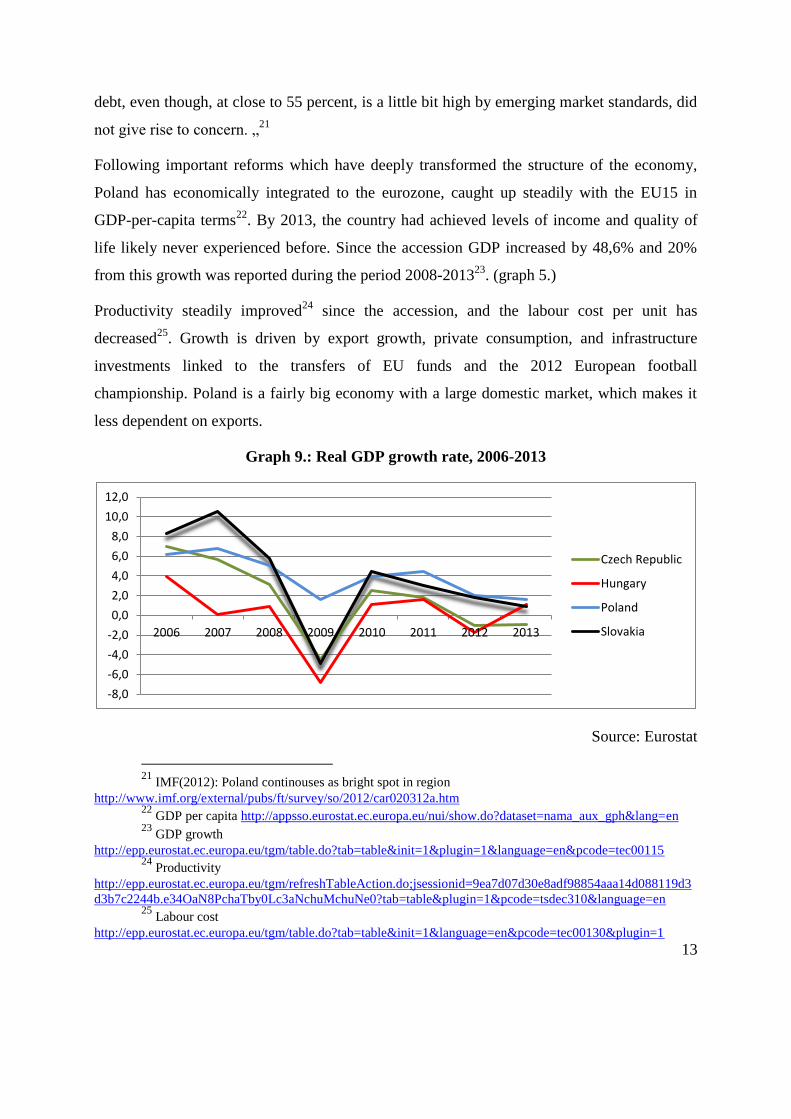
Productivity steadily improved24
since the accession, and the labour cost per unit has
decreased25
. Growth is driven by export growth, private consumption, and infrastructure
investments linked to the transfers of EU funds and the 2012 European football
championship. Poland is a fairly big economy with a large domestic market, which makes it
less dependent on exports.
Graph 9.: Real GDP growth rate, 2006-2013
Source: Eurostat
21
IMF(2012): Poland continouses as bright spot in region
http://www.imf.org/external/pubs/ft/survey/so/2012/car020312a.htm 22
GDP per capita http://appsso.eurostat.ec.europa.eu/nui/show.do?dataset=nama_aux_gph&lang=en 23
GDP growth
http://epp.eurostat.ec.europa.eu/tgm/table.do?tab=table&init=1&plugin=1&language=en&pcode=tec00115 24
Productivity
http://epp.eurostat.ec.europa.eu/tgm/refreshTableAction.do;jsessionid=9ea7d07d30e8adf98854aaa14d088119d3
d3b7c2244b.e34OaN8PchaTby0Lc3aNchuMchuNe0?tab=table&plugin=1&pcode=tsdec310&language=en 25
Labour cost
http://epp.eurostat.ec.europa.eu/tgm/table.do?tab=table&init=1&language=en&pcode=tec00130&plugin=1
-8,0
-6,0
-4,0
-2,0
0,0
2,0
4,0
6,0
8,0
10,0
12,0
2006 2007 2008 2009 2010 2011 2012 2013
Czech Republic
Hungary
Poland
Slovakia
14
Overall, the fact that Poland – by far the biggest of the V4 economies - did so well speaks not
only to its strong economic fundamentals, but also to good policy management and sound and
well-chosen economic policies. The results of the economic prosperity of the country were
used by the Polish government to improve the international position of the country, which was
supported by the country image and international political actions (such as the Year of
Chopin, the Polish Presidency of the EU, the Polish-Ukrainian joint organized Football
Championship). Warsaw is trying to obtain the right position, according to its growing
economic weight, both in the international and European arena. Tusk government not only
was able to stabilize the relationship with Berlin, but Poland became one of Germany’s major
allies in the European crisis management.
Warsaw responded to the crisis less sensitively than the international standards. Poland was
the only EU country where negative economic growth26
did not occurred as a result of the
crisis. Poland added significant fiscal stimulus during the crisis. This was one of the major
reasons why Poland did not fall into recession during the crisis. The government enacted a
discretionary fiscal relaxation of 4,5 percent of GDP and allowed the automatic stabilizers to
work27
. As a result, the fiscal deficit rose from less than 2 percent of GDP in 2007 to more
than 7 percent in 2009 (graph 10). Policymakers had considerable room for countercyclical
monetary and fiscal policy, because Poland did not have any severe macroeconomic
imbalances on the eve of the crisis.
Graph 10.: Fiscal deficit, (% of GDP) 2006-2013
26
GDP growth
http://epp.eurostat.ec.europa.eu/tgm/table.do?tab=table&plugin=1&language=en&pcode=tec00115 27
http://ec.europa.eu/economy_finance/eu/forecasts/2014_autumn/pl_en.pdf

15
Source: Eurostat
Although the Polish government debt has increased since the outbreak of the crisis, it is still
under the magic 60% of GDP28
. The general government debt-to-GDP ratio fell from 55.7%
in 2013 to 49.1% in 2014. It is set to amount to 50.1% in 2016. (graph 15)
Poland was granted a precautionary loan under the IMF’ Flexible Credit Line in 2010 but
hasn’t needed to draw on the funds29
, because the government insisted to solve the problems
by structural reforms and cut spending. Significant fiscal consolidation helped to reduce the
deficit and contain government debt. Poland’s fiscal framework contains a public debt rule
which is anchored in the Constitution and limits gross debt to 60% of GDP. Similarly,
monetary policy was accommodative at first, with aggressive cuts in the policy interest rate.
Reflect to the excessive deficit procedure Warsaw has implemented some reforms to
increase state revenues30
:
● increasing VAT rates from 22% to 23% and parallel decreasing the rates for basic food
products from 7% to 5%. Limiting the VAT fraud: reducing the limit authorising tax
payers to the exemption from the obligation to keep cash register, extension of the reverse
charge mechanism and the joint and several liability of the purchaser for tax liabilities of
the supplier of steel products, fuel and non-processed gold
28
Government debt
http://epp.eurostat.ec.europa.eu/tgm/table.do?tab=table&plugin=1&language=en&pcode=tsdde410 29
http://www.imf.org/external/pubs/ft/scr/2012/cr1212.pdf 30
http://ec.europa.eu/economy_finance/economic_governance/sgp/pdf/30_edps/126-07_council/2014-
11-18_pl_-_ear_en.pdf
-10
-8
-6
-4
-2
0
2006 2007 2008 2009 2010 2011 2012 2013
Czech Republic
Hungary
Poland
Slovakia
16
● increasing social security contributions (through limiting the part transfer red to OFE
(Open Pension Funds) in favour of the part transferred to FUS (Social Insurance Fund) –
2011 as well as owing to the increase of the pension insurance contribution in 2012
● introducing a fee for exploiting certain natural deposits of copper and silver
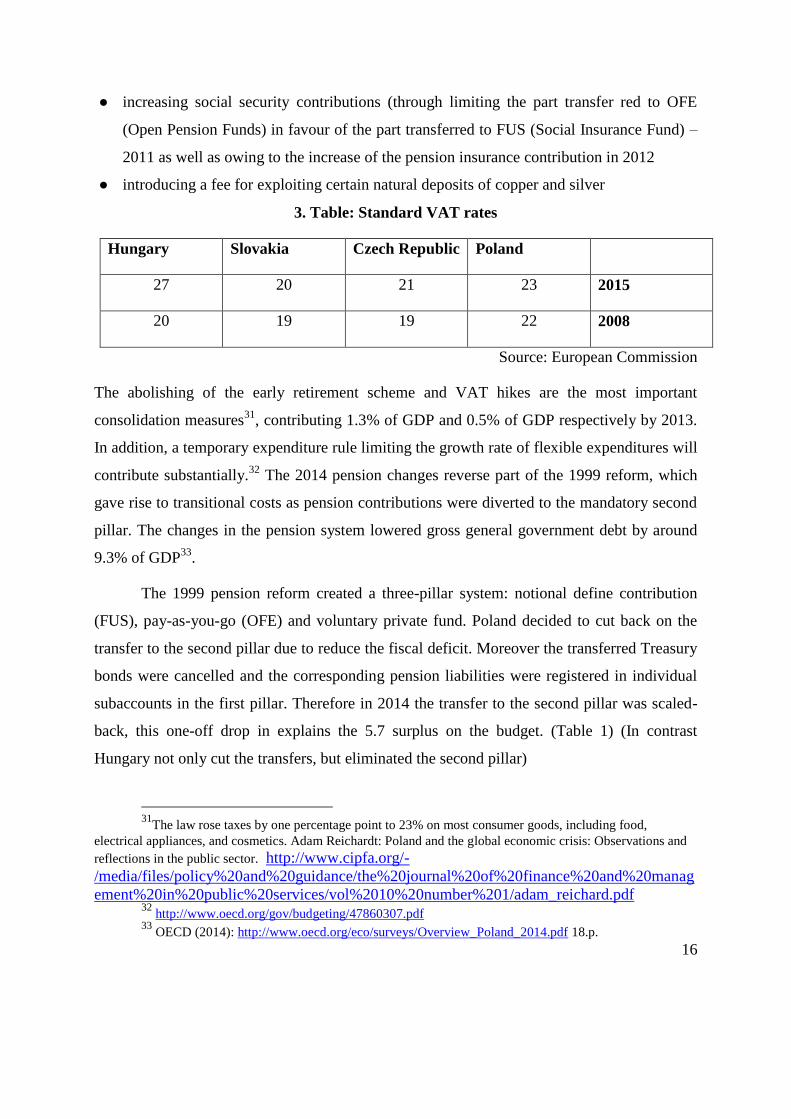
3. Table: Standard VAT rates
Poland Czech Republic Slovakia Hungary
2015 23 21 20 27
2008 22 19 19 20
Source: European Commission
The abolishing of the early retirement scheme and VAT hikes are the most important
consolidation measures31
, contributing 1.3% of GDP and 0.5% of GDP respectively by 2013.
In addition, a temporary expenditure rule limiting the growth rate of flexible expenditures will
contribute substantially.32
The 2014 pension changes reverse part of the 1999 reform, which
gave rise to transitional costs as pension contributions were diverted to the mandatory second
pillar. The changes in the pension system lowered gross general government debt by around
9.3% of GDP33
.
The 1999 pension reform created a three-pillar system: notional define contribution
(FUS), pay-as-you-go (OFE) and voluntary private fund. Poland decided to cut back on the
transfer to the second pillar due to reduce the fiscal deficit. Moreover the transferred Treasury
bonds were cancelled and the corresponding pension liabilities were registered in individual
subaccounts in the first pillar. Therefore in 2014 the transfer to the second pillar was scaled-
back, this one-off drop in explains the 5.7 surplus on the budget. (Table 1) (In contrast
Hungary not only cut the transfers, but eliminated the second pillar)
31
The law rose taxes by one percentage point to 23% on most consumer goods, including food,
electrical appliances, and cosmetics. Adam Reichardt: Poland and the global economic crisis: Observations and
reflections in the public sector. http://www.cipfa.org/-
/media/files/policy%20and%20guidance/the%20journal%20of%20finance%20and%20manag
ement%20in%20public%20services/vol%2010%20number%201/adam_reichard.pdf 32
http://www.oecd.org/gov/budgeting/47860307.pdf 33
OECD (2014): http://www.oecd.org/eco/surveys/Overview_Poland_2014.pdf 18.p.
17
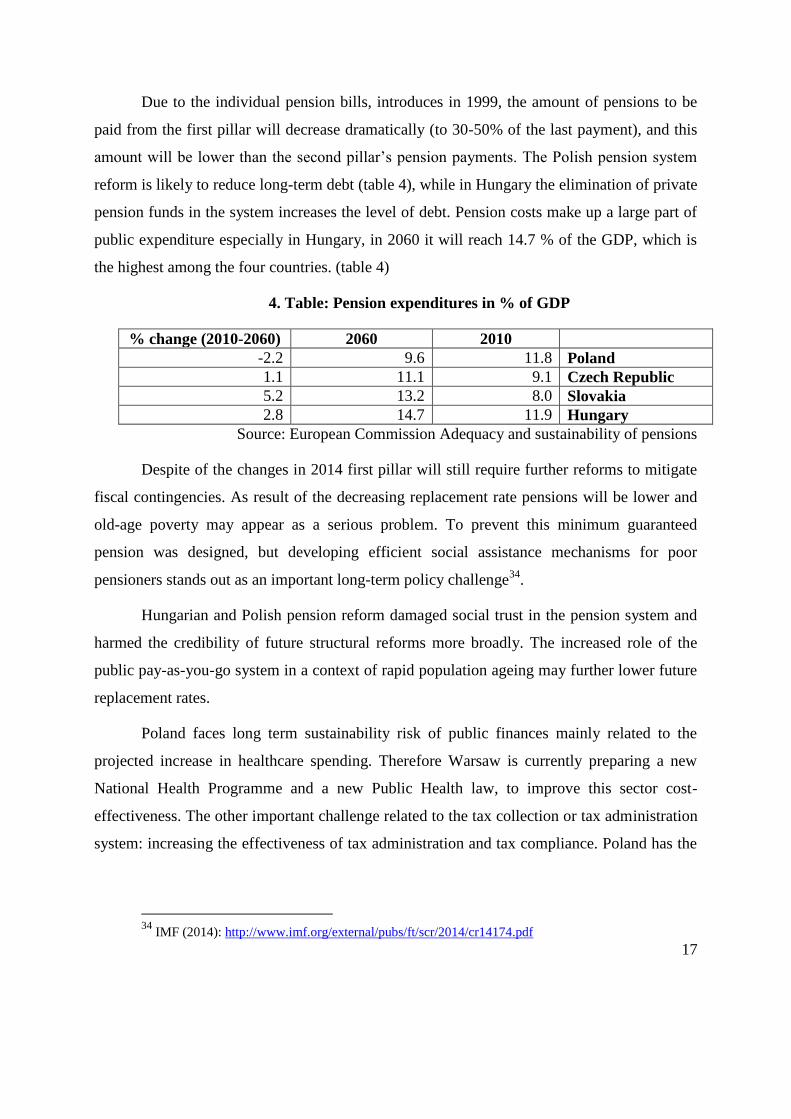
Due to the individual pension bills, introduces in 1999, the amount of pensions to be
paid from the first pillar will decrease dramatically (to 30-50% of the last payment), and this
amount will be lower than the second pillar’s pension payments. The Polish pension system
reform is likely to reduce long-term debt (table 4), while in Hungary the elimination of private
pension funds in the system increases the level of debt. Pension costs make up a large part of
public expenditure especially in Hungary, in 2060 it will reach 14.7 % of the GDP, which is
the highest among the four countries. (table 4)
4. Table: Pension expenditures in % of GDP
2010 2060 % change (2010-2060)
Poland 11.8 9.6 -2.2
Czech Republic 9.1 11.1 1.1
Slovakia 8.0 13.2 5.2
Hungary 11.9 14.7 2.8
Source: European Commission Adequacy and sustainability of pensions
Despite of the changes in 2014 first pillar will still require further reforms to mitigate
fiscal contingencies. As result of the decreasing replacement rate pensions will be lower and
old-age poverty may appear as a serious problem. To prevent this minimum guaranteed
pension was designed, but developing efficient social assistance mechanisms for poor
pensioners stands out as an important long-term policy challenge34
.
Hungarian and Polish pension reform damaged social trust in the pension system and
harmed the credibility of future structural reforms more broadly. The increased role of the
public pay-as-you-go system in a context of rapid population ageing may further lower future
replacement rates.
Poland faces long term sustainability risk of public finances mainly related to the
projected increase in healthcare spending. Therefore Warsaw is currently preparing a new
National Health Programme and a new Public Health law, to improve this sector cost-
effectiveness. The other important challenge related to the tax collection or tax administration
system: increasing the effectiveness of tax administration and tax compliance. Poland has the
34
IMF (2014): http://www.imf.org/external/pubs/ft/scr/2014/cr14174.pdf
18
second highest (after the Slovak Republic) cost for tax administration per net revenue
collection35
.
The country’s growth in the last decade was remarkable. (Graph 9) In order to be able
to continue this tendency further steps will be needed, such as improving the business climate
and innovation capacity of the Polish companies. Medium technology sectors using cheap and
comparatively low-skilled labour, which can undermine the future growth. The ratio of Gross
Value Added is lower than the other V4 countries36
. Firms with a higher technological content
tend to grow faster than low-technology sectors.
Some of the reforms not involve either significant budgetary or distributional costs;
others are more complex and need better preparation. Fortunately necessary reforms have
been implemented always. The challenge is not only identifying the needful measures, but to
find the way of political economy to implement them.
Czech Republic
The Czech economy started to grow in 2010 with 2,7 %, but after the growing tendency the
economy dropped back. (graph 9) Thanks to the decrease of the export and internal
consumption (private and public). Real incomes felt due to government measures, such as
freezing wages and cutting back allowances and benefits. Like all the V4 countries, the Czech
growth is depending on external conditions. The majority of its manufacturing exports are
directed to Germany and Western European countries. The Czech economy exited the
recession and started to recover during the second half of 2013, primarily driven by domestic
demand and growth in export markets. Real GDP growth is expected to be stronger in 2015
and 2016 with the remaining main driver: domestic demand.
35
European Commission (2014) Taxation.
http://ec.europa.eu/europe2020/pdf/themes/02_taxation_02.pdf 36
GVA: Ratio og GVA produced in high- and medium-high-technology industries to medium- and low
technology sectors. ECFIN (2014): Country Focus: Securing Poland’s economic succes: A good time for
reforms. http://ec.europa.eu/economy_finance/publications/country_focus/2014/pdf/cf_vol11_issue9_en.pdf
19
A sharp fiscal adjustment led to an exit from the Excessive Deficit Procedure37
(EDP) and
kept debt levels contained, but exacerbated the recession. The adjustment was driven mainly
by a compression of capital expenditure, partly due to implementation bottlenecks, while an
increase in VAT rates helped boost revenue. As a result of the measures and also to one-off
factors, the overall fiscal deficit narrowed from 4.2 percent of GDP in 2012 to 1.5 percent in
2013. (graph 10)
In 2014 the new Czech government has decided to adopt a fiscal policy that aims at keeping
the public deficit below 3% GDP and a reform agenda focussed on promoting external
competitiveness, investment, exports, infrastructures and quality of public services, which
were recommended by the European Commission also38
.
With respect to pensions, the government aims to propose to withdraw the second
pillar, as well as introducing measures to ensure the long-term stability of the public pension
system and an adequate level of pensions. The pension system is currently relatively
successful in preventing old-age poverty. Contrary to the Polish and Hungarian example,
Prague not dismantled but created a second pillar to its pension system in 2013. Although it is
a pity that due to the low participation and minimalized political support it is going to be
demolished in 2016.
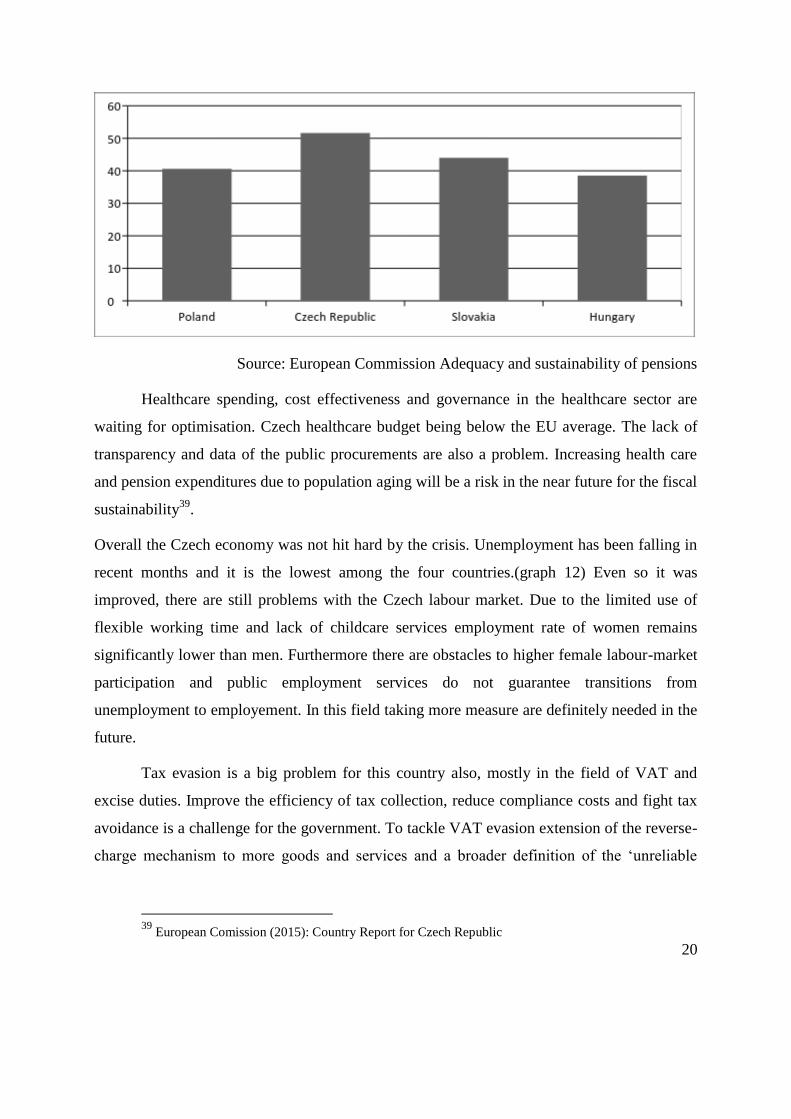
Graph 11.: Employment rate of older workers (age 55-64), 2013
37
Council of the European Union (2014): Council closes excessive deficit procedures for Belgium,
Czech Republic, Denmark, Austria, Netherlands and Slovakia.
http://www.consilium.europa.eu/uedocs/cms_data/docs/pressdata/en/ecofin/143282.pdf 38
European Commission (2015): Country report Czech Republic 2015.
http://ec.europa.eu/europe2020/pdf/csr2015/cr2015_czech_en.pdf
20
Source: European Commission Adequacy and sustainability of pensions
Healthcare spending, cost effectiveness and governance in the healthcare sector are
waiting for optimisation. Czech healthcare budget being below the EU average. The lack of
transparency and data of the public procurements are also a problem. Increasing health care
and pension expenditures due to population aging will be a risk in the near future for the fiscal
sustainability39
.
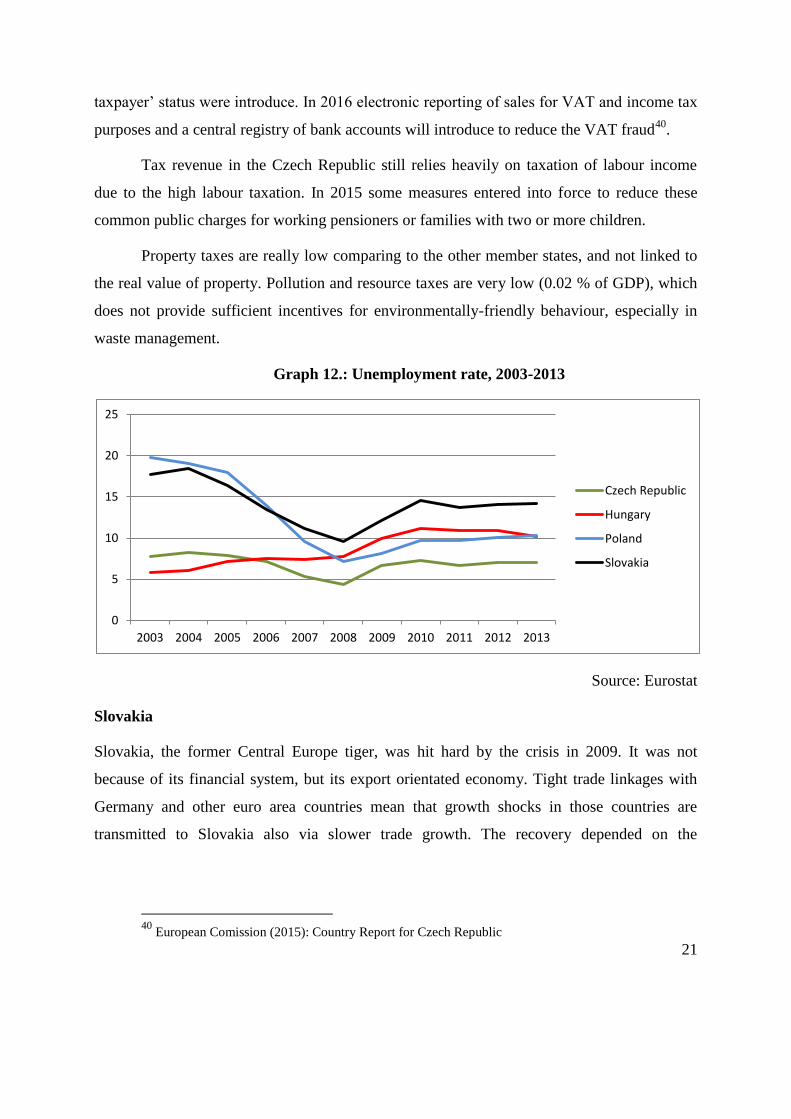
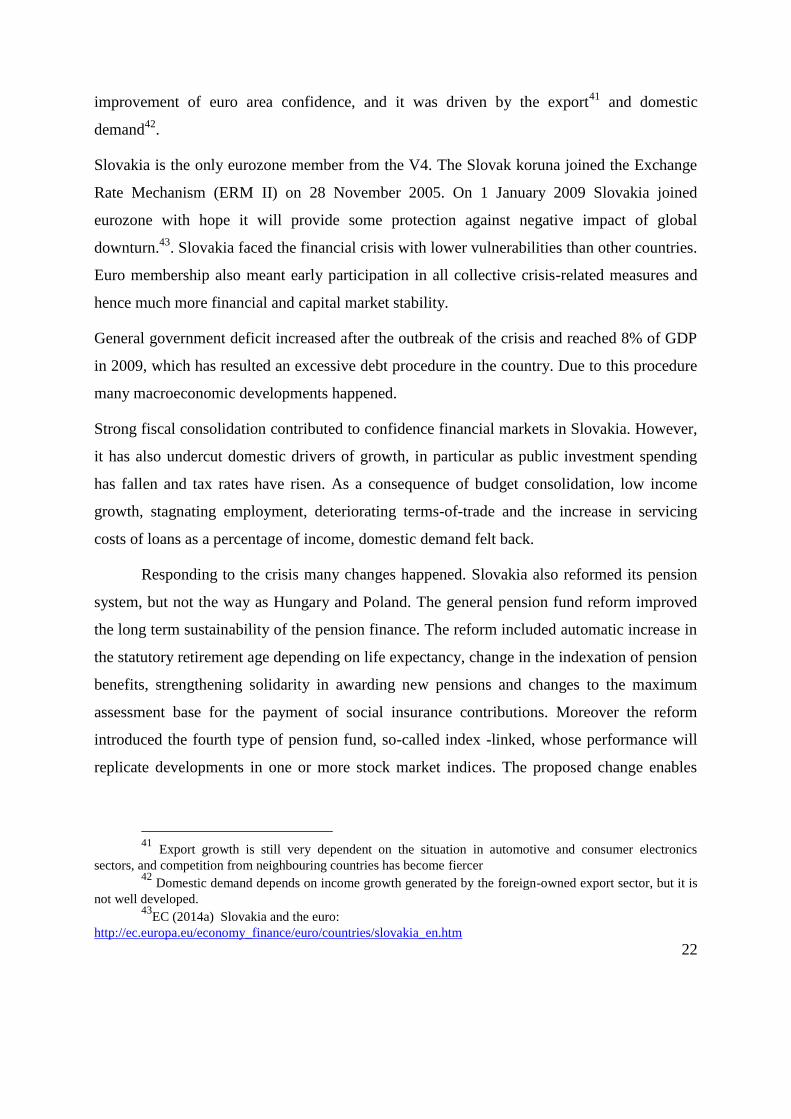
Overall the Czech economy was not hit hard by the crisis. Unemployment has been falling in
recent months and it is the lowest among the four countries.(graph 12) Even so it was
improved, there are still problems with the Czech labour market. Due to the limited use of
flexible working time and lack of childcare services employment rate of women remains
significantly lower than men. Furthermore there are obstacles to higher female labour-market
participation and public employment services do not guarantee transitions from
unemployment to employement. In this field taking more measure are definitely needed in the
future.
Tax evasion is a big problem for this country also, mostly in the field of VAT and
excise duties. Improve the efficiency of tax collection, reduce compliance costs and fight tax
avoidance is a challenge for the government. To tackle VAT evasion extension of the reverse-
charge mechanism to more goods and services and a broader definition of the ʻunreliable
39
European Comission (2015): Country Report for Czech Republic
21
taxpayerʼ status were introduce. In 2016 electronic reporting of sales for VAT and income tax
purposes and a central registry of bank accounts will introduce to reduce the VAT fraud40
.
Tax revenue in the Czech Republic still relies heavily on taxation of labour income
due to the high labour taxation. In 2015 some measures entered into force to reduce these
common public charges for working pensioners or families with two or more children.
Property taxes are really low comparing to the other member states, and not linked to
the real value of property. Pollution and resource taxes are very low (0.02 % of GDP), which
does not provide sufficient incentives for environmentally-friendly behaviour, especially in
waste management.
Graph 12.: Unemployment rate, 2003-2013
Source: Eurostat
Slovakia
Slovakia, the former Central Europe tiger, was hit hard by the crisis in 2009. It was not
because of its financial system, but its export orientated economy. Tight trade linkages with
Germany and other euro area countries mean that growth shocks in those countries are
transmitted to Slovakia also via slower trade growth. The recovery depended on the
40
European Comission (2015): Country Report for Czech Republic
0
5
10
15
20
25
2003 2004 2005 2006 2007 2008 2009 2010 2011 2012 2013
Czech Republic
Hungary
Poland
Slovakia
22
improvement of euro area confidence, and it was driven by the export41
and domestic
demand42
.
Slovakia is the only eurozone member from the V4. The Slovak koruna joined the Exchange
Rate Mechanism (ERM II) on 28 November 2005. On 1 January 2009 Slovakia joined
eurozone with hope it will provide some protection against negative impact of global
downturn.43
. Slovakia faced the financial crisis with lower vulnerabilities than other countries.
Euro membership also meant early participation in all collective crisis-related measures and
hence much more financial and capital market stability.
General government deficit increased after the outbreak of the crisis and reached 8% of GDP
in 2009, which has resulted an excessive debt procedure in the country. Due to this procedure
many macroeconomic developments happened.
Strong fiscal consolidation contributed to confidence financial markets in Slovakia. However,
it has also undercut domestic drivers of growth, in particular as public investment spending
has fallen and tax rates have risen. As a consequence of budget consolidation, low income
growth, stagnating employment, deteriorating terms-of-trade and the increase in servicing
costs of loans as a percentage of income, domestic demand felt back.
Responding to the crisis many changes happened. Slovakia also reformed its pension
system, but not the way as Hungary and Poland. The general pension fund reform improved
the long term sustainability of the pension finance. The reform included automatic increase in
the statutory retirement age depending on life expectancy, change in the indexation of pension
benefits, strengthening solidarity in awarding new pensions and changes to the maximum
assessment base for the payment of social insurance contributions. Moreover the reform
introduced the fourth type of pension fund, so-called index -linked, whose performance will
replicate developments in one or more stock market indices. The proposed change enables
41
Export growth is still very dependent on the situation in automotive and consumer electronics
sectors, and competition from neighbouring countries has become fiercer 42
Domestic demand depends on income growth generated by the foreign-owned export sector, but it is
not well developed. 43
EC (2014a) Slovakia and the euro:
http://ec.europa.eu/economy_finance/euro/countries/slovakia_en.htm
23
savers to divide their savings into two pension funds, one of which must be a bond pension
fund44
.
Slovakia implemented tax reforms in 2013 that replaced the flat income tax with a
progressive one45
, which should promote greater equity; and phasing out lower taxation of the
self-employed should reduce tax avoidance. Furthermore the corporate income tax rate has
been raised from 19% to 23%.
Due to the fight against tax fraud VAT effective rate increased with 2%. VAT control
statement, compulsory down-payment on VAT were introduces, and inspection on VAT
audit46
were emphasized. According to the national target of VAT collection effectiveness has
to reach 72% by 2020, this was 53% in 201247
. The implicit tax rate on labour is the lowest
among the four countries, and lower than the EU28 average; but real estate and environment
taxes are a problem is Slovakia as well as the other countries48
.
Unemployment has remained high, and still the highest among the four countries. (graph 12.)
High unemployment rate can undermine the growth. A significant part of unemployment is
located in more remote rural regions with a low population density. Despite of this fact
mobility of unemployed people are low due to the high living and housing cost and weak
travelling infrastructure. Unemployment had reached 20 per cent of labour force in the early
2000s. However, strong growth and convergence brought a reduction in the unemployment
rate to a low of 10 % in 2008. Following this, the fall in exports in 2008/9 was associated with
a new increase in unemployment to nearly 15 per cent. Nowadays it reached 12,4%, but it still
above the EU average (9,9%). The jobless recovery and the high unemployment rate illustrate
imbalances in the economy. The most problematic groups are women, Roma and young
people. 60% of the unemployements are low skilled and long-term unemployed. Due to its
structural nature unemployment rate will remain around 12%49
.
44
Stability Programme for the Slovak Republic 2014-2017.
http://ec.europa.eu/europe2020/pdf/csr2014/sp2014_slovakia_en.pdf 45
new tax rates: 19% and 25% 46
80% of all tax audit were VAT audit 47
http://ec.europa.eu/europe2020/pdf/csr2014/nrp2014_slovakia_en.pdf 48
European Cimmission (2015) Country Report Slovakia 49
European Commission (2015): Country Report Slovakia
24
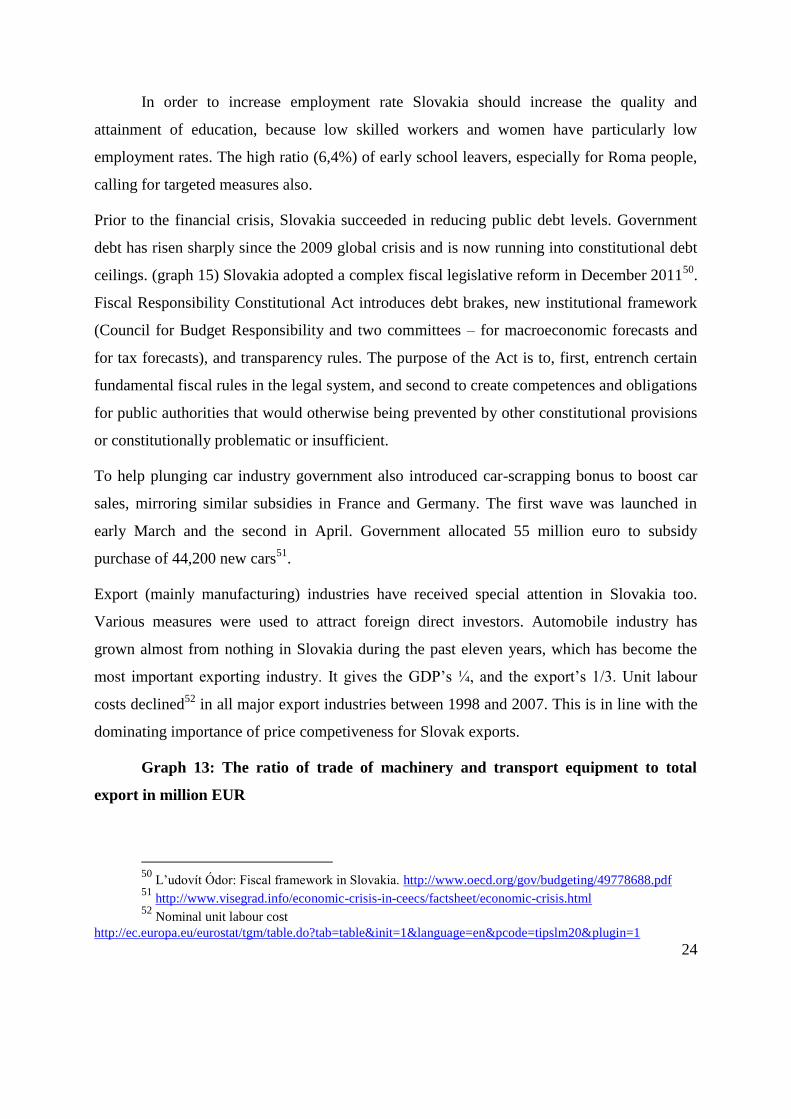
In order to increase employment rate Slovakia should increase the quality and
attainment of education, because low skilled workers and women have particularly low
employment rates. The high ratio (6,4%) of early school leavers, especially for Roma people,
calling for targeted measures also.
Prior to the financial crisis, Slovakia succeeded in reducing public debt levels. Government
debt has risen sharply since the 2009 global crisis and is now running into constitutional debt
ceilings. (graph 15) Slovakia adopted a complex fiscal legislative reform in December 201150
.
Fiscal Responsibility Constitutional Act introduces debt brakes, new institutional framework
(Council for Budget Responsibility and two committees – for macroeconomic forecasts and
for tax forecasts), and transparency rules. The purpose of the Act is to, first, entrench certain
fundamental fiscal rules in the legal system, and second to create competences and obligations
for public authorities that would otherwise being prevented by other constitutional provisions
or constitutionally problematic or insufficient.
To help plunging car industry government also introduced car-scrapping bonus to boost car
sales, mirroring similar subsidies in France and Germany. The first wave was launched in
early March and the second in April. Government allocated 55 million euro to subsidy
purchase of 44,200 new cars51
.
Export (mainly manufacturing) industries have received special attention in Slovakia too.
Various measures were used to attract foreign direct investors. Automobile industry has
grown almost from nothing in Slovakia during the past eleven years, which has become the
most important exporting industry. It gives the GDP’s ¼, and the export’s 1/3. Unit labour
costs declined52
in all major export industries between 1998 and 2007. This is in line with the
dominating importance of price competiveness for Slovak exports.
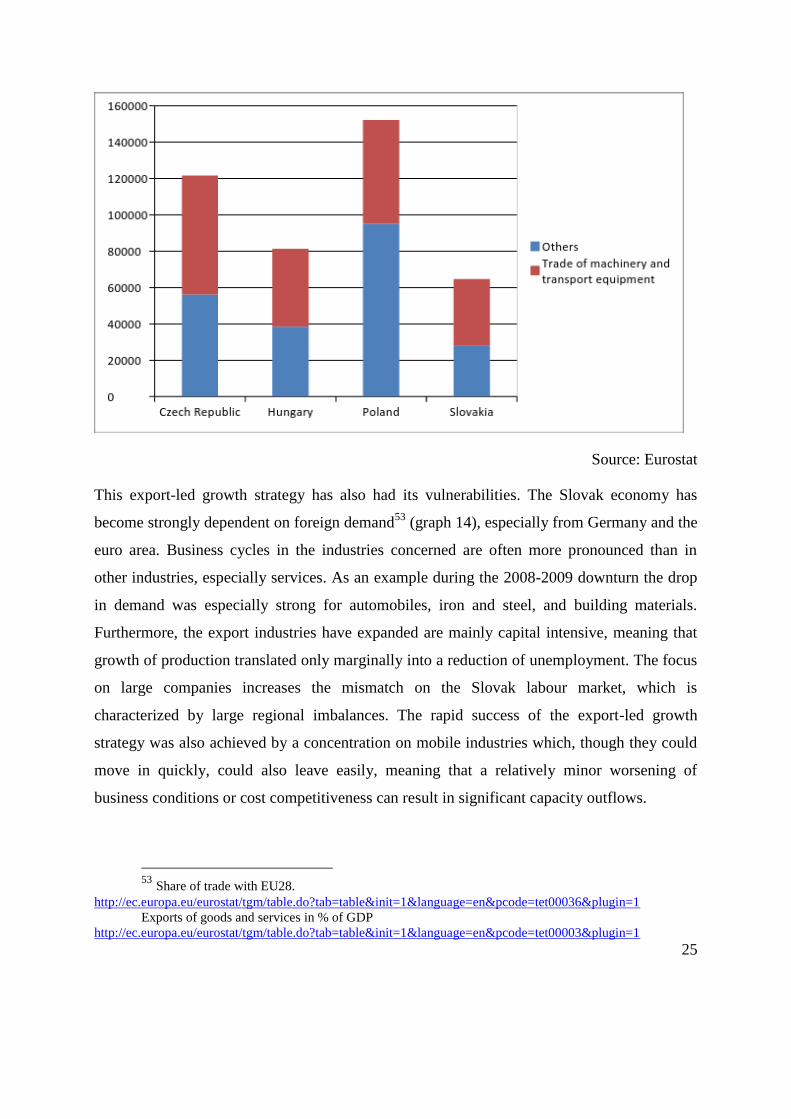
Graph 13: The ratio of trade of machinery and transport equipment to total
export in million EUR
50
L’udovít Ódor: Fiscal framework in Slovakia. http://www.oecd.org/gov/budgeting/49778688.pdf 51
http://www.visegrad.info/economic-crisis-in-ceecs/factsheet/economic-crisis.html 52
Nominal unit labour cost
http://ec.europa.eu/eurostat/tgm/table.do?tab=table&init=1&language=en&pcode=tipslm20&plugin=1
25
Source: Eurostat
This export-led growth strategy has also had its vulnerabilities. The Slovak economy has
become strongly dependent on foreign demand53
(graph 14), especially from Germany and the
euro area. Business cycles in the industries concerned are often more pronounced than in
other industries, especially services. As an example during the 2008-2009 downturn the drop
in demand was especially strong for automobiles, iron and steel, and building materials.
Furthermore, the export industries have expanded are mainly capital intensive, meaning that
growth of production translated only marginally into a reduction of unemployment. The focus
on large companies increases the mismatch on the Slovak labour market, which is
characterized by large regional imbalances. The rapid success of the export-led growth
strategy was also achieved by a concentration on mobile industries which, though they could
move in quickly, could also leave easily, meaning that a relatively minor worsening of
business conditions or cost competitiveness can result in significant capacity outflows.
53
Share of trade with EU28.
http://ec.europa.eu/eurostat/tgm/table.do?tab=table&init=1&language=en&pcode=tet00036&plugin=1 Exports of goods and services in % of GDP
http://ec.europa.eu/eurostat/tgm/table.do?tab=table&init=1&language=en&pcode=tet00003&plugin=1
26
However reforms in taxation, pension and healthcare systems can ensure sound public
finances, low investments can undermine Slovakia competitiveness and growth prospect, like
the high unemployment rate. In these two fields significant changes are needed.
Hungary
Hungary’s early “golden boy” status has vanished. After the regime change the governments
were unable to set in motion the economy, inflation went double-digit, public debt and deficit
proved to be difficult to keep under control, but from the mid-nineties a rather short period of
stabilization and rapid modernisation kicked in.
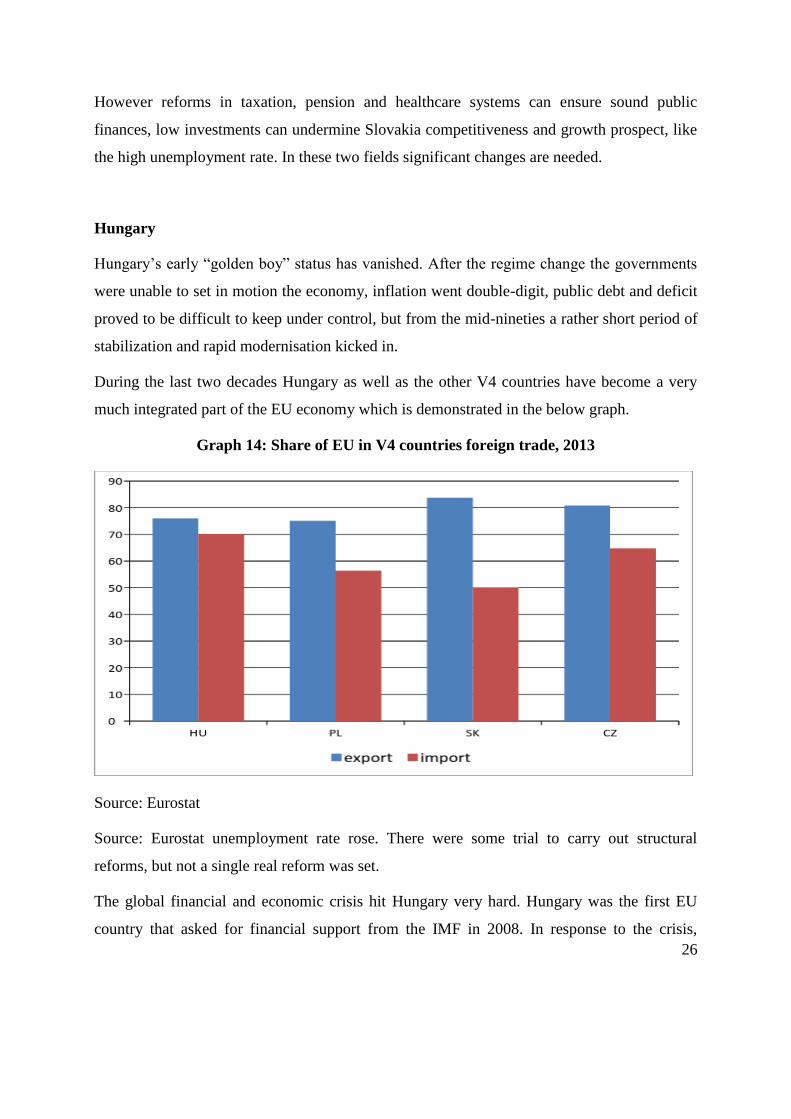
During the last two decades Hungary as well as the other V4 countries have become a very
much integrated part of the EU economy which is demonstrated in the below graph.
Graph 14: Share of EU in V4 countries foreign trade, 2013
Source: Eurostat
Source: Eurostat unemployment rate rose. There were some trial to carry out structural
reforms, but not a single real reform was set.
The global financial and economic crisis hit Hungary very hard. Hungary was the first EU
country that asked for financial support from the IMF in 2008. In response to the crisis,
27
Hungary took steps at two key areas: fiscal stability and financial stability. The government
took radical steps to diminish costs, and bring the spending to a sustainable rate. All together
spending has to be cut by approximately 5 billion Euros in 2009-2010. The package contained
the elevation of general VAT-rates from 20 to 25 percent (currently it is at 27 percent), with
some exceptions: dairy products, wheat, flour, or starch-made products and district-heating
costs pertain under a preferential, 18 percent tax rate. Excise duty for cigarettes, fuel and
alcohol has grown. The income-tax classes have been changed, so the net income of the most
employees rose. But after the election the government set up a new economic model which is
called unorthodox economic policy.
Hungary’s economy emerged from the 2012 recession and entered to a weak growth path in
2013. This growth is mainly driven by government investment and consumption, and also
exports. Private demand remained weak, and credit to the retail and corporate sectors
continued to contract. Hungary’s medium-term growth prospects remain modest, as private
consumption is still hampered by the ongoing repair of households’ balance sheets; low
employment among low skilled workers and shortcoming in labour and product market; while
the weak business environment continues to weigh on private investment.
Monetary easing has helped to return to growth. The Hungarian National Bank has cuts its
policy rate since 2012 to support demand and credit growth54
. The central bank also
introduced the Funding for Growth Scheme in 2013 with the aim of easing access to finance
for SMEs and improving their credit conditions through the provision of subsidized lending
interest rate. Despite strong take up it is still not clear whether it produce more growth in the
economy or not.
External vulnerabilities have been the key risk of the Hungarian economy. External
debt remains high and large open net position can create more volatility in the future. Growth
potential is held back by low employment among low-skilled and weak investment, making
further structural reforms essential.
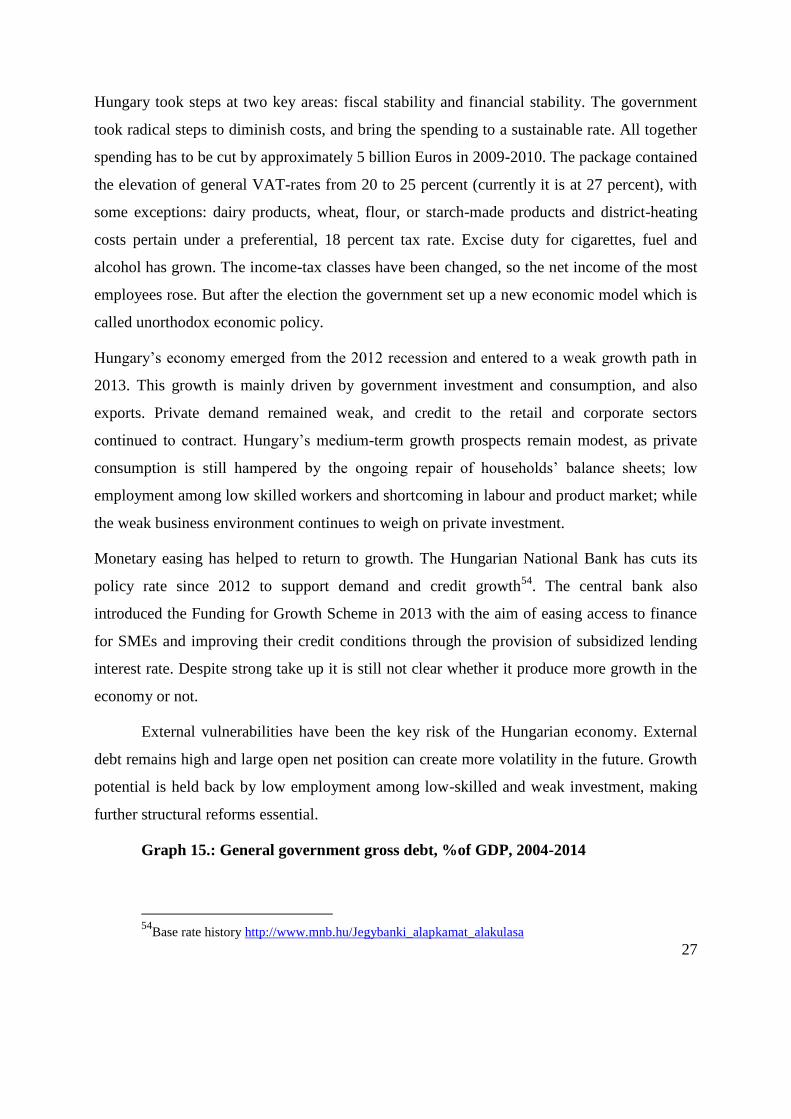
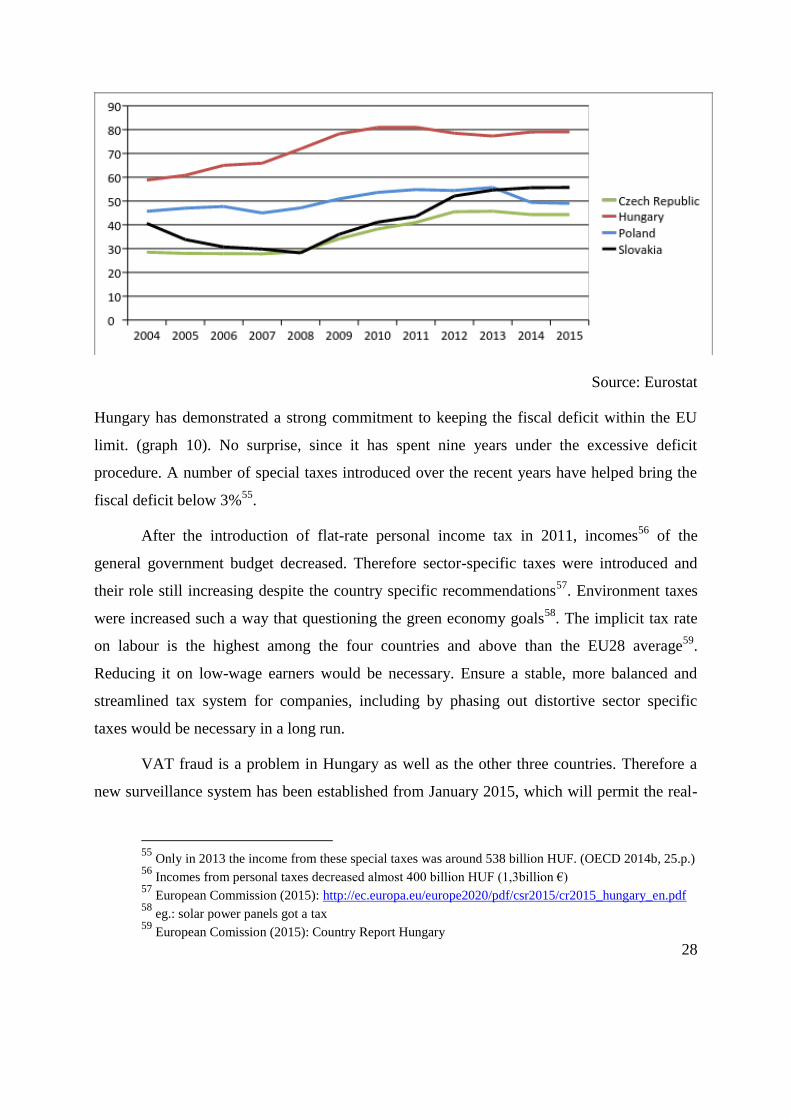
Graph 15.: General government gross debt, %of GDP, 2004-2014
54
Base rate history http://www.mnb.hu/Jegybanki_alapkamat_alakulasa
28
Source: Eurostat
Hungary has demonstrated a strong commitment to keeping the fiscal deficit within the EU
limit. (graph 10). No surprise, since it has spent nine years under the excessive deficit
procedure. A number of special taxes introduced over the recent years have helped bring the
fiscal deficit below 3%55
.
After the introduction of flat-rate personal income tax in 2011, incomes56
of the
general government budget decreased. Therefore sector-specific taxes were introduced and
their role still increasing despite the country specific recommendations57
. Environment taxes
were increased such a way that questioning the green economy goals58
. The implicit tax rate
on labour is the highest among the four countries and above than the EU28 average59
.
Reducing it on low-wage earners would be necessary. Ensure a stable, more balanced and
streamlined tax system for companies, including by phasing out distortive sector specific
taxes would be necessary in a long run.
VAT fraud is a problem in Hungary as well as the other three countries. Therefore a
new surveillance system has been established from January 2015, which will permit the real-
55
Only in 2013 the income from these special taxes was around 538 billion HUF. (OECD 2014b, 25.p.) 56
Incomes from personal taxes decreased almost 400 billion HUF (1,3billion €) 57
European Commission (2015): http://ec.europa.eu/europe2020/pdf/csr2015/cr2015_hungary_en.pdf 58
eg.: solar power panels got a tax 59
European Comission (2015): Country Report Hungary
29
time monitoring of the transport of VAT-liable goods and establishment of on-line links to
cash registers in the retail sector has been completed by the end of 2014.
Regulating the fiscal framework after 2010 has lead to mixed results. Long-term sustainability
is questionable due to incomes after the phasing out of special taxes. Legal actions have to be
taken to improve the transparency of public finances.
The basic feature Hungarian economic policy since 2010 (sometimes misleadingly labelled by
the government as „unorthodox”) is keeping the VAT rate at a very high level (27%) and
more importantly applying one-off sectoral „crisis” taxes imposed on whatever sector that can
be taxed. The application of these taxes (accounting for 2200 billion Hungarian forints (EUR
7,4 billion) together with the nationalisation (i.e.: confiscation) of the second pillar pension
fund assets made it possible to curb the government deficit. These taxes constitute a major
burden on some sectors and seemingly spare the population at least it is more difficult to track
their imposition on the society later by the companies affected through higher fees and other
charges. Here is a list of the nine special tax introduced since 2010:
- special tax on financial institutions;
- special sectoral tax (phased out in 2013);
- utility services tax;
- telecom tax;
- financial transaction tax;
- insurance tax;
- health tax;
- accident tax;
- publicity tax.
Government debt has remained steadily at a high level, which is forecast to be
corrected only at a very slow pace. Despite one-off capital transfers60
that decreased public
debt by around 7% of GDP, and a substantial improvement in the structural balance,
government debt has been broadly stable around 80% of GDP since 2009. This reflects the
effect of a weakened exchange rate, a low growth performance and high financing costs.
(graph 11.) The Hungarian Constitution contains that the gross government debt should not
60
Gathering the private pension fund.
30
exceed 50% of GDP. Until it comes down that level the debt GDP ratio has to decline every
year, after 2016 nominal public debt can increase only by half of expected real GDP growth,
which supposes a counter-cyclical fiscal policy.61
Budgetary risks and the small reduction
path can undermine long-term debt reduction which highlights the importance of fiscal
sustainability and growth friendly economic policy.
The Hungarian export deflators have broadly stagnated since 2000, so far the other V3
countries were able to increase their deflators by around 30% to 70%. All V4 countries are
primarily involved in producing machinery and transport equipment products for exports,
with Poland having a somewhat less concentrated structure compared to the other V3
countries. The Hungarian export performance suggests that the deterioration is primarily
related to tightening supply constraints. This is partly linked to the inability to attract new FDI
inflows but also to the weak spill over linkages between multinationals and domestic
companies. Although recently there have been some large investment projects in the
automobile industry, a marked improvement in the export sector is not expected.
The relapse of Hungary's competitiveness in the export sector is primarily related to the
machinery and transport equipment subsector. (graph 13) Nevertheless, the country continues
to have the highest level of export unit values, thanks to the still competitive product quality
in regional comparison62
.
Although unemployment rate is around 10% (graph 11), increasing employment rate
to reach its Europe2020 national target labour market policy measures are inevitable. Labour
force participation also remains low for women and for old cohort. Maternal employments
rate is the lowest within the OECD63
. The poor overall health status of the Hungarian
population implies that many workers are affected by debilitating health conditions, in
particular at advancing age, this one reason why older workers market participation is low.
The public works programme has increased employment, but has a poor record in
reintegrating the non-employed to regular work. Like in Slovakia unemployment rate has a
61
http://net.jogtar.hu/jr/gen/hjegy_doc.cgi?docid=A1100425.ATV Article 36. Constitution of Hungary 62
graph 3.12, p23. EC 2014c 63
IMF (2014): http://www.imf.org/external/pubs/ft/scr/2014/cr14156.pdf
31
strong regional profile, which calls for measures to mobilize the workers and create more jobs
in the peripheral regions.
Therefore revision of the public works scheme, creation of a Roma labour market
integration policy scheme and reduction poverty, support the transition between different
stages of education and towards the labour market are should be done in the near future.
Long-term improvements in labour market outcomes will also depend on complimentary
structural reforms, improvements in health care and public education.
Conclusion
The EU as a whole and even more so, the Eurozone was heavily hit by the sovereign debt
crisis, which resulted in way above the mark national debt to GDP ratios. In the light of this
V4 countries’ performance in controlling the national debt was a relative success, although in
absolute terms all of them experienced a rising debt. The analysis of growth trends clearly
show that the dramatic decline in 2009 was followed by consolidation in 2010.
Economic success and political decisions are interlinked to a great extent in the region. This
stems from the fact that politics in general and the direction in which the political class wants
to direct the country is more important in this region in terms of end results both in political
and economic terms. A new government in the V4 countries can have dramatic impact on the
geopolitical, EU-political and economic policy path the country takes. Long-term political
stability is still in nascent form, or in a more pessimistic tone: is a rarity in the region.
V4 countries harnessing the benefits of EU membership differs a lot. Some of the new
members were more successful than others in using EU-accession as an economic and
modernisation leverage by halving the number of people living in poverty and raising the per
capita GDP by almost fifty percent. There is obviously a clear difference in the group when
euro-status is considered. When it comes to EMU issues, the four countries are in different
position and have differing views. The way V4 countries approach the Euro accession and
crisis management is also a mix of economic and political features. These states differ a lot:
Slovakia, a relative latecomer in economic reforms is part of the currency union. Poland,
Hungary and the Czech Republic are not Euro-members. But even this sub-group is divided:
32
Poland intends to join whenever requirements are fulfilled while the Hungarian and the Czech
governments are cool on accession.
The future of the V4 co-operation is dim: clearly the divisive forces are way stronger than the
rather opportunistic cohesive ones (such as the drive to gain as much EU funds as possible).
The case of Hungary is particular, it has maneouvered itself onto a path that leads the country
away not only from the mainstream European political consensus but also from the other
Visegrad countries.
As far as desirable policy actions from the EU’s side vis-à-vis the V4 countries are concerned,
a mix of pragmatist and positivistic engagement is recommended. This would entail taking a
strong stance in relation to the respect of the basic values of Europeaness but also an open and
understanding attitude. Besides the European institutions, Germany will also have to play a
decisive role, not for its own good this time but for the good of this region this time -
hopefully.
References
Constitution of Hungary: Article 36.
http://net.jogtar.hu/jr/gen/hjegy_doc.cgi?docid=A1100425.ATV Last accessed: 20-02-2015
Council of the European Union (2014): Council closes excessive deficit procedures for
Belgium, Czech Republic, Denmark, Austria, Netherlands and Slovakia.
http://www.consilium.europa.eu/uedocs/cms_data/docs/pressdata/en/ecofin/143282.pdf Last
accessed: 20-02-2015
Council of the European Union (2013): Council closes excessive deficit procedures for
Italy, Latvia, Lithuania, Hungary and Romania.
http://www.consilium.europa.eu/uedocs/cms_data/docs/pressdata/en/ecofin/137561.pdf
Council of the European Union (2014): Council closes excessive deficit procedures for
Belgium, Czech Republic, Denmark, Netherlands, Austria and Slovakia
http://www.consilium.europa.eu/uedocs/cms_data/docs/pressdata/en/ecofin/143282.pdf
Council of the European Union (2013) Excessive deficit procedure for Poland:
Insufficient action taken, Council issues new recommendation
http://www.consilium.europa.eu/uedocs/cms_data/docs/pressdata/en/ecofin/140017.pdf
ECB (2014): Convergence Report.
http://www.ecb.europa.eu/pub/pdf/conrep/cr201406en.pdf
33
ECFIN (2014): Country Focus: Securing Poland’s economic success: A good time for
reforms.
http://ec.europa.eu/economy_finance/publications/country_focus/2014/pdf/cf_vol11_issue9_e
n.pdf
Eurobarometer(2014): Public opinion in the European Union 82.
http://ec.europa.eu/public_opinion/archives/eb/eb82/eb82_first_en.pdf
European Commission (2013): Special Eurobarometer on Corruption (397)
http://ec.europa.eu/public_opinion/archives/ebs/ebs_397_en.pdf Last accessed: 20-02-2015
European Commission (2013): The Innovation Union Scoreboard 2013.
http://ec.europa.eu/enterprise/policies/innovation/files/ius-2013_en.pdf Last accessed: 20-02-
2015
European Commission (2014a): Slovakia and the euro:
http://ec.europa.eu/economy_finance/euro/countries/slovakia_en.htm Last accessed: 20-02-
2015
European Commission( 2014b): Economic forecast for Poland
http://ec.europa.eu/economy_finance/eu/forecasts/2014_autumn/pl_en.pdf Last accessed: 20-
02-2015
European Commission (2014c) Macroeconomic imbalances in Hungary 2014.
http://ec.europa.eu/economy_finance/publications/occasional_paper/2014/pdf/ocp180_en.pdf
Last accessed: 20-02-2015
European Commission (2014): Europe 2020 target: Tertiary education attainment.
http://ec.europa.eu/europe2020/pdf/themes/28_tertiary_education_02.pdf
European Commission (2014): Report on action taken by Poland in response to the
Council recommendation of 10 December 2013 in order to bring an end to the situation of
excessive deficit.
http://ec.europa.eu/economy_finance/economic_governance/sgp/pdf/30_edps/126-
07_council/2014-11-18_pl_-_ear_en.pdf
European Commission (2014) Taxation.
http://ec.europa.eu/europe2020/pdf/themes/02_taxation_02.pdf
European Commission (2014): Adequacy and sustainability of pensions
http://ec.europa.eu/europe2020/pdf/themes/04_pensions_02.pdf
European Commission (2014): National Reform Programme of the Slovak Republic
2014 http://ec.europa.eu/europe2020/pdf/csr2014/nrp2014_slovakia_en.pdf
European Commission (2014): Stability Programme for the Slovak Republic 2014-
2017. http://ec.europa.eu/europe2020/pdf/csr2014/sp2014_slovakia_en.pdf
European Commission (2015): VAT Rates applied in the Member States of the
European Union.
34
http://ec.europa.eu/taxation_customs/resources/documents/taxation/vat/how_vat_works/rates/
vat_rates_en.pdf
European Commission (2015): Country report Czech Republic 2015.
http://ec.europa.eu/europe2020/pdf/csr2015/cr2015_czech_en.pdf
European Commission (2015): Country report Hungary 2015.
http://ec.europa.eu/europe2020/pdf/csr2015/cr2015_hungary_en.pdf
European Commission (2015): Country report for Poland 2015.
http://ec.europa.eu/europe2020/pdf/csr2015/cr2015_poland_en.pdf
European Commission (2015): Country report Slovak Republic 2015
http://ec.europa.eu/europe2020/pdf/csr2015/cr2015_slovakia_en.pdf
Eurostat: Nominal unit labour cost
http://ec.europa.eu/eurostat/tgm/table.do?tab=table&init=1&language=en&pcode=tipslm20&
plugin=1 Last accessed: 20-02-2015
Eurostat: Share of trade with EU28.
http://ec.europa.eu/eurostat/tgm/table.do?tab=table&init=1&language=en&pcode=tet00036&
plugin=1 Last accessed: 20-02-2015
Eurostat: Government debt
http://epp.eurostat.ec.europa.eu/tgm/table.do?tab=table&plugin=1&language=en&pcode=tsdd
e410 Last accessed: 20-02-2015
Eurostat: Exports of goods and services in % of GDP
http://ec.europa.eu/eurostat/tgm/table.do?tab=table&init=1&language=en&pcode=tet00003&
plugin=1 Last accessed: 20-02-2015
Eurostat: GDP per capita
http://appsso.eurostat.ec.europa.eu/nui/show.do?dataset=nama_aux_gph&lang=en Last
accessed: 20-02-2015
Eurostat: GDP growth
http://epp.eurostat.ec.europa.eu/tgm/table.do?tab=table&init=1&plugin=1&language=en&pco
de=tec00115 Last accessed: 20-02-2015
Eurostat: Productivity
http://epp.eurostat.ec.europa.eu/tgm/refreshTableAction.do;jsessionid=9ea7d07d30e8adf9885
4aaa14d088119d3d3b7c2244b.e34OaN8PchaTby0Lc3aNchuMchuNe0?tab=table&plugin=1
&pcode=tsdec310&language=en Last accessed: 20-02-2015
Eurostat: Labour cost
http://epp.eurostat.ec.europa.eu/tgm/table.do?tab=table&init=1&language=en&pcode=tec001
30&plugin=1 Last accessed: 20-02-2015
Eurostat: GDP growth
http://epp.eurostat.ec.europa.eu/tgm/table.do?tab=table&plugin=1&language=en&pcode=tec0
0115 Last accessed: 20-02-2015
35
Eurostat: Share of trade with the EU 28
http://ec.europa.eu/eurostat/tgm/table.do?tab=table&init=1&language=en&pcode=tet00036&
plugin=1 Last accessed: 20-02-2015
Eurostat: Long term interest rate:
http://ec.europa.eu/eurostat/tgm/table.do?tab=table&init=1&language=en&pcode=tec00097&
plugin=1
Eurostat: International trade of machinery and transport equipment
http://ec.europa.eu/eurostat/eurostat/tgm/table.do?tab=table&init=1&plugin=1&language=en
&pcode=tet00009
Eurostat: Tertiary education attainment
http://ec.europa.eu/eurostat/tgm/table.do?tab=table&init=1&language=en&pcode=tsdsc480&
plugin=1
Hungarian Central Statistical Office: Incomes of the central budget
https://www.ksh.hu/docs/hun/xstadat/xstadat_evkozi/e_qse006i.html Last accessed: 20-02-
2015
Hungarian National Bank: Base rate history
http://www.mnb.hu/Jegybanki_alapkamat_alakulasa Last accessed: 20-02-2015
IMF (2012): Poland continues as bright spot in region
http://www.imf.org/external/pubs/ft/survey/so/2012/car020312a.htm Last accessed: 20-02-
2015
IMF (2012): Republic of Poland—Review Under the Flexible Credit Line
Arrangement http://www.imf.org/external/pubs/ft/scr/2012/cr1212.pdf Last accessed: 20-02-
2015
IMF (2014):IMF Country Report: Poland.
http://www.imf.org/external/pubs/ft/scr/2014/cr14174.pdf
IMF (2014): Database
http://www.imf.org/external/pubs/ft/weo/2014/02/weodata/weorept.aspx?pr.x=45&pr.
y=13&sy=2001&ey=2015&scsm=1&ssd=1&sort=country&ds=.&br=1&c=964%2C935%2C
936%2C944&s=PPPSH%2CGGXWDG_NGDP&grp=0&a= Last accessed: 20-02-2015
Marján, Attila (2014): The new EU voting system ―The old west-east north south
division. Modern Diplomacy.
http://www.moderndiplomacy.eu/index.php?option=com_k2&view=item&id=454:the-new-
eu-voting-system-the-old-west-east-north-south-division&Itemid=569 Last accessed: 20-02-
2015
Marján, Attila: EU-rule changes force a Visegad re-think. Europe’s World. 2014.
Spring
OECD (2011): Restoring public
financeshttp://www.oecd.org/gov/budgeting/47860307.pdf Last accessed: 20-02-2015
OECD (2014a): Economic Surveys, Poland
http://www.oecd.org/eco/surveys/Overview_Poland_2014.pdf Last accessed: 20-02-2015
36
OECD (2014b): Economic Survey of Hungary.
http://www.oecd.org/eco/surveys/economic-survey-hungary.htm Last accessed: 20-02-2015
Ódor ,L’udovít: Fiscal framework in Slovakia.
http://www.oecd.org/gov/budgeting/49778688.pdf Last accessed: 20-02-2015
Reichardt ,Adam: Poland and the global economic crisis: Observations and reflections
in the public sector. http://www.cipfa.org/-
/media/files/policy%20and%20guidance/the%20journal%20of%20finance%20and%20manag
ement%20in%20public%20services/vol%2010%20number%201/adam_reichard.pdf Last
accessed: 20-02-2015
Visegrad.info (2009): Economic crisis. http://www.visegrad.info/economic-crisis-in-
ceecs/factsheet/economic-crisis.html Last accessed: 20-02-2015
WEF (2014): Global Competitiveness Report 2014-2015
http://www3.weforum.org/docs/WEF_GlobalCompetitivenessReport_2014-15.pdf Last
accessed: 20-02-2015
WEF (1999): Global Competitiveness Report
http://www.cid.harvard.edu/archive/res/gcr_2000_overview.pdf Last accessed: 20-02-2015
World Bank: GDP/capita in current US $
http://databank.worldbank.org/data/views/reports/tableview.aspx?isshared=true# Last
accessed: 20-02-2015
World Bank (2014): Doing Business 2015
http://www.doingbusiness.org/reports/global-reports/doing-business-2015 Last accessed: 20-
02-2015
World Bank (2015): Exports of goods and services % of GDP.
http://databank.worldbank.org/data/views/reports/tableview.aspx?isshared=true# Last
accessed: 20-02-2015